Abstract
More than 800 million people suffer from kidney disease, yet the mechanism of kidney dysfunction is poorly understood. Here we define the genetic association with kidney function in 1.5 million individuals and identify 878 (126 novel) loci. We map the genotype effect on the methylome in 443 kidneys, transcriptome in 686 samples, and single-cell open chromatin in 57,229 kidney cells.
Heritability analysis reveals that methylation variation explains a larger fraction of heritability than gene expression. We present a multi-stage prioritization strategy, and prioritize target genes for 87% of kidney function loci. We highlight key roles of proximal tubules and metabolism in kidney function regulation. Furthermore, the causal role of SLC47A1 in kidney disease is defined in mice with genetic loss of Slc47a1 and in human individuals carrying loss-of-function variants. Our findings emphasize the key role of bulk and single-cell epigenomic information in translating genome-wide association studies into identifying causal genes, cellular origins and mechanisms of complex traits.
Keywords: meQTL, human kidney, methylation-mediated heritability, chronic kidney disease
Introduction
The kidney maintains electrolyte and water balance, and plays a major role in blood pressure regulation and excretion of toxins. Kidney disease is a major global health burden, responsible for roughly one million (1 in 60) yearly deaths worldwide. Kidney disease-associated mortality increased by more than 40% in the last two decades, making it one of the fastest-growing major causes of death1. Despite the major personal and economic burden, few new therapeutics have been registered to treat or cure kidney disease over the last 40 years.
Both genetic predisposition and environmental changes are critical for kidney disease development. Association of common variants with kidney function has been mapped in genome-wide association studies (GWAS)2–5. Despite efficient GWAS locus mapping, translating this information into improved mechanistic understanding is still challenging as more than 90% of kidney function-associated variants are located in the non-coding region of the genome6.
Integration of GWAS data and expression quantitative trait loci (eQTL) has been instrumental for GWAS target gene identification7–11. However, previously published eQTL datasets were only able to prioritize target genes for a small fraction (<20%) of GWAS loci4,7. Recently developed statistical methods suggested that eQTLs only explain a small fraction (~11%) of GWAS heritability12, requiring increasingly diverse functional genomic readouts beyond gene transcription to identify disease mechanisms.
The epigenome13 describes the cellular gene expression regulatory logic and integrates effects from genetic variation and environmental changes. Thus, epigenomic profiling data could provide critical insight into kidney disease development, as they have in previous work for other complex diseases14. DNA methylation, a key component of the epigenome, can regulate gene expression by altering transcription factor binding strength or recruiting proteins involved in gene repression15,16. Previous studies have cataloged the genotype effect on methylation (methylation quantitative trait loci, meQTL) in accessible tissues, for example blood cells17–19; however, kidney-specific meQTL data are not readily available.
Results
Kidney function GWAS for 1.5 million individuals
For comprehensive identification of genetic variants associated with kidney function (eGFRcrea: glomerular filtration rate estimated by serum creatinine), we conducted a meta-analysis of publicly available GWAS information from the CKDGen4, Pan-UK Biobank, MVP5, PAGE20, and SUMMIT21 consortia (Fig. 1a and Supplementary Table 1). These GWAS results were pooled via sample size-weighted meta-analysis of z-scores using METAL22, to allow for differences in eGFRcrea estimation and scaling (Methods), resulting in a comprehensive eGFRcrea GWAS catalog of 12,653,804 variants with a total sample size of 1,508,659 (Extended Data Fig. 1a,b). Using the genome-wide significance cut-off (p < 5×10⁻⁸), we identified 90,950 variants associated with eGFRcrea, most (81.9%) of which were validated by serum cystatin C based eGFR (eGFRcys) and/or blood urea nitrogen (BUN) (Extended Data Fig. 1c–e).
Fig. 1. Graphical summary of new datasets created, and analyses performed in this study.
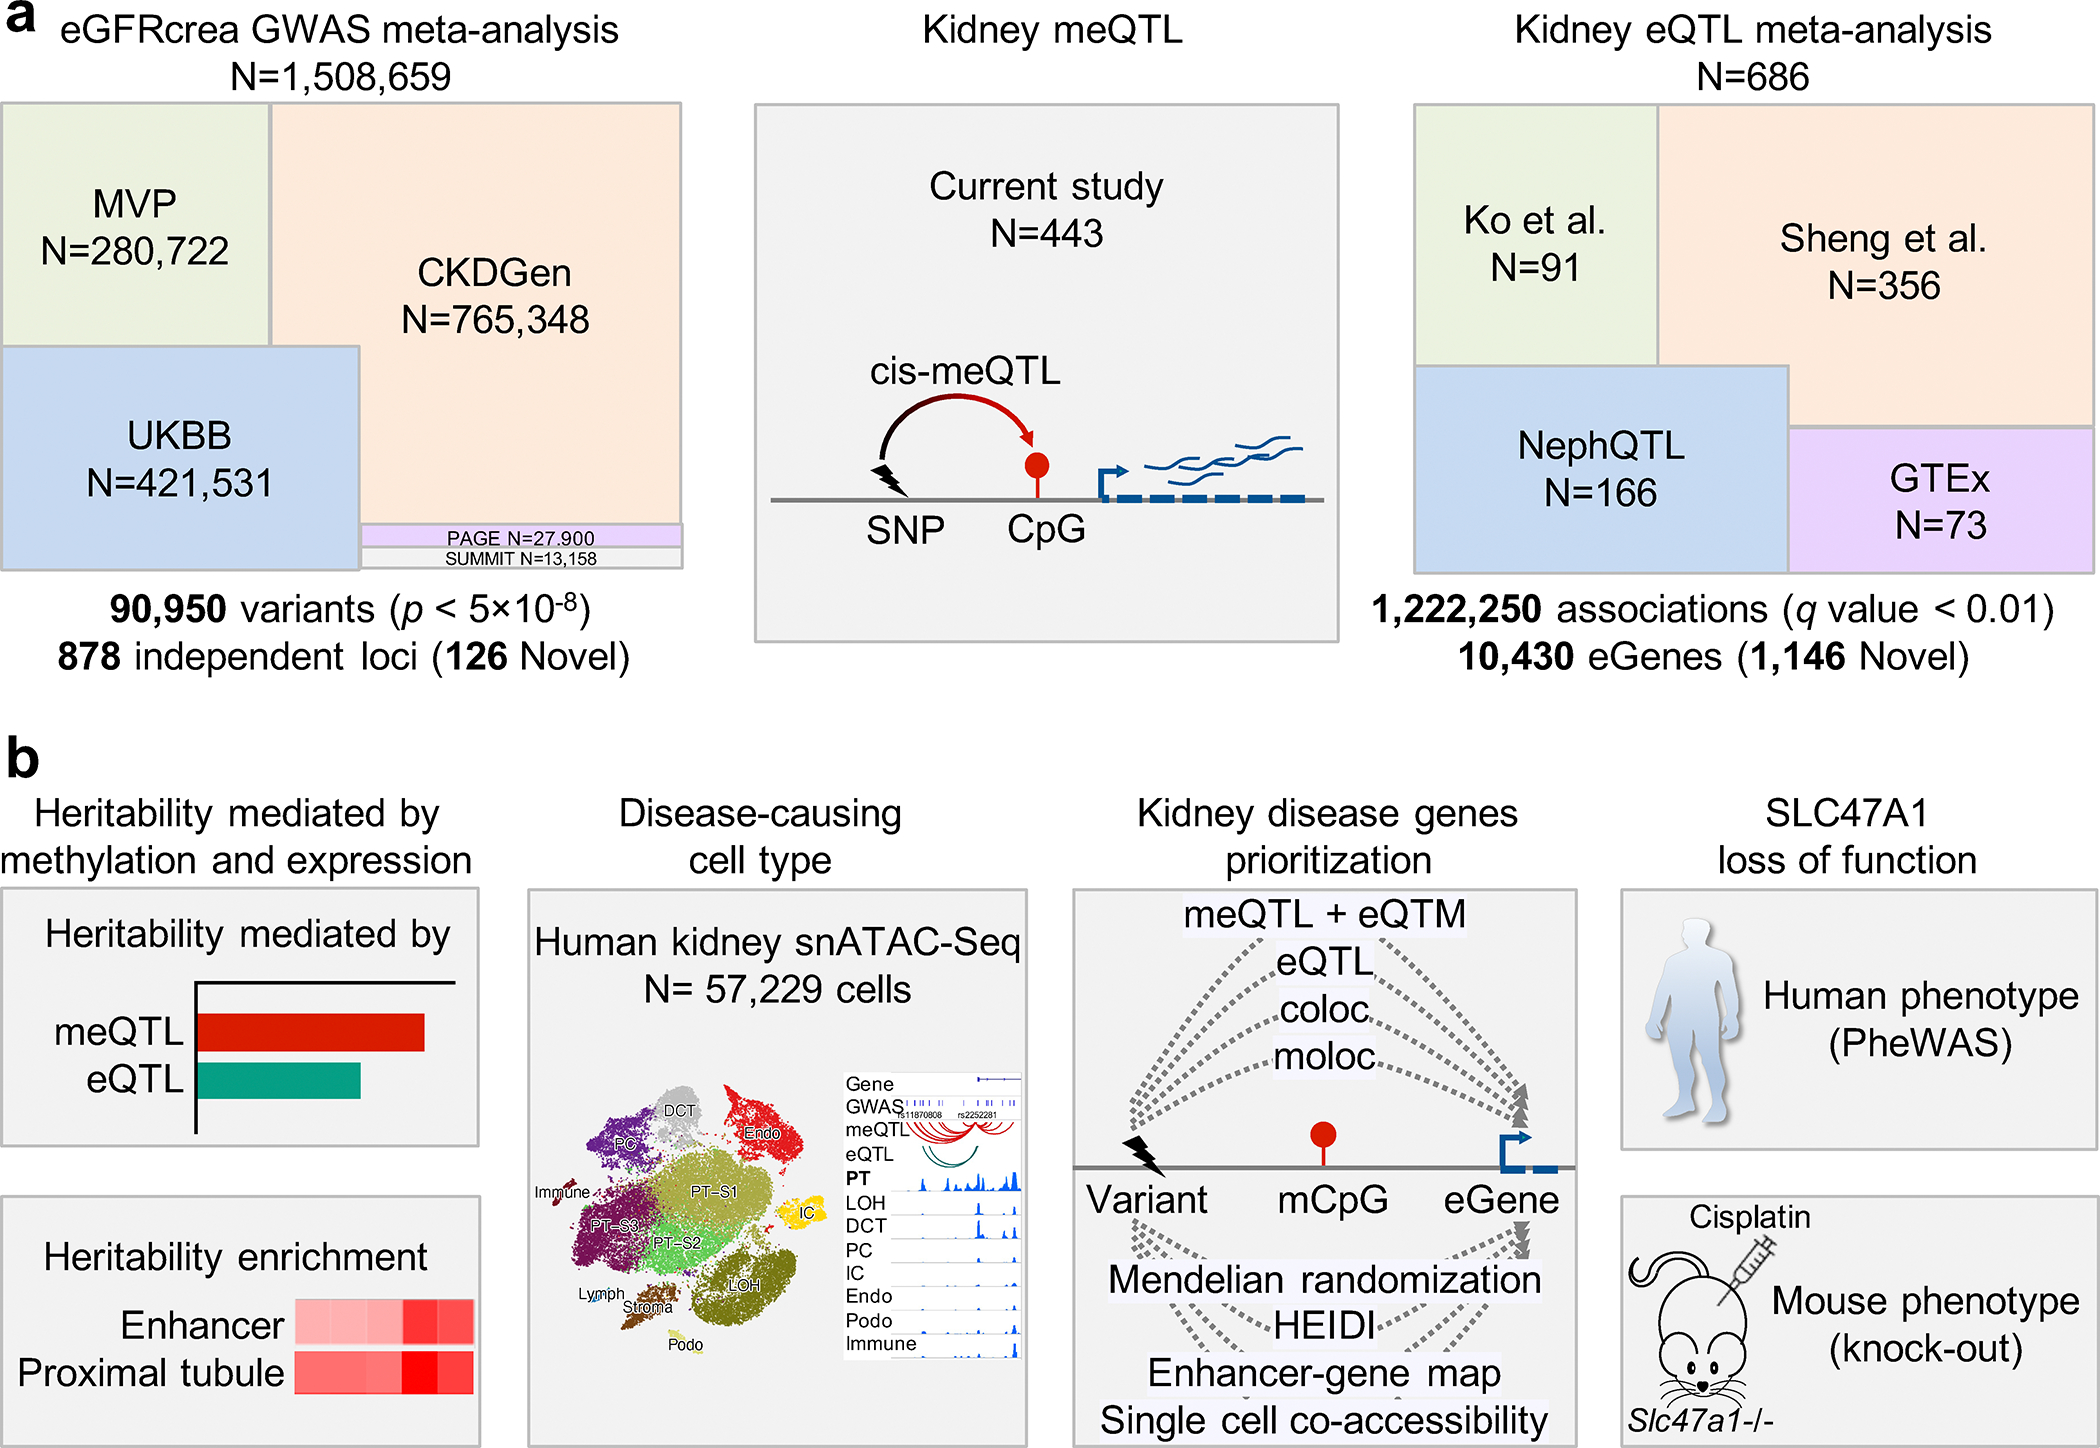
a. Overview of the different genome-wide association and quantitative trait (GWAS, meQTL and eQTL) datasets generated and used in this study. Cohort abbreviations and details found in Supplementary Table 1.
b. Schematic representation of our methods and datasets for prioritization and function analysis of kidney disease genes by integrating genetic, human kidney epigenetic, transcriptomics, and human kidney single-nuclear open chromatin information.
Further, we discovered 878 independent loci (Methods, Fig. 2a, Extended Data Fig. 2a,b, and Supplementary Table 2), including 126 novel loci compared to previously reported GWAS sentinel variants4,5,20,21,23,24 and whole-exome association studies25,26 (Supplementary Fig. 1–3). Most (81.0%) novel eGFRcrea loci included at least one nominally significant (p < 0.05) association with eGFRcys and/or BUN (Extended Data Fig. 2c). Novel eGFRcrea GWAS loci were significantly enriched in genome regions around genes whose mutations are known to cause phenotypic abnormalities in the kidney, including Meprin A Subunit Alpha (MEP1A)27, ATP Binding Cassette Subfamily C Member 2 (ABCC2)28 and Nuclear Factor I A (NFIA)29 (Extended Data Fig. 2d–g). Most newly discovered common variants had small effect size, while newly discovered rare variants had larger effect size (Fig. 2b).
Fig. 2. eGFRcrea GWAS of 1.5 million individuals and kidney eQTL for 686 samples.
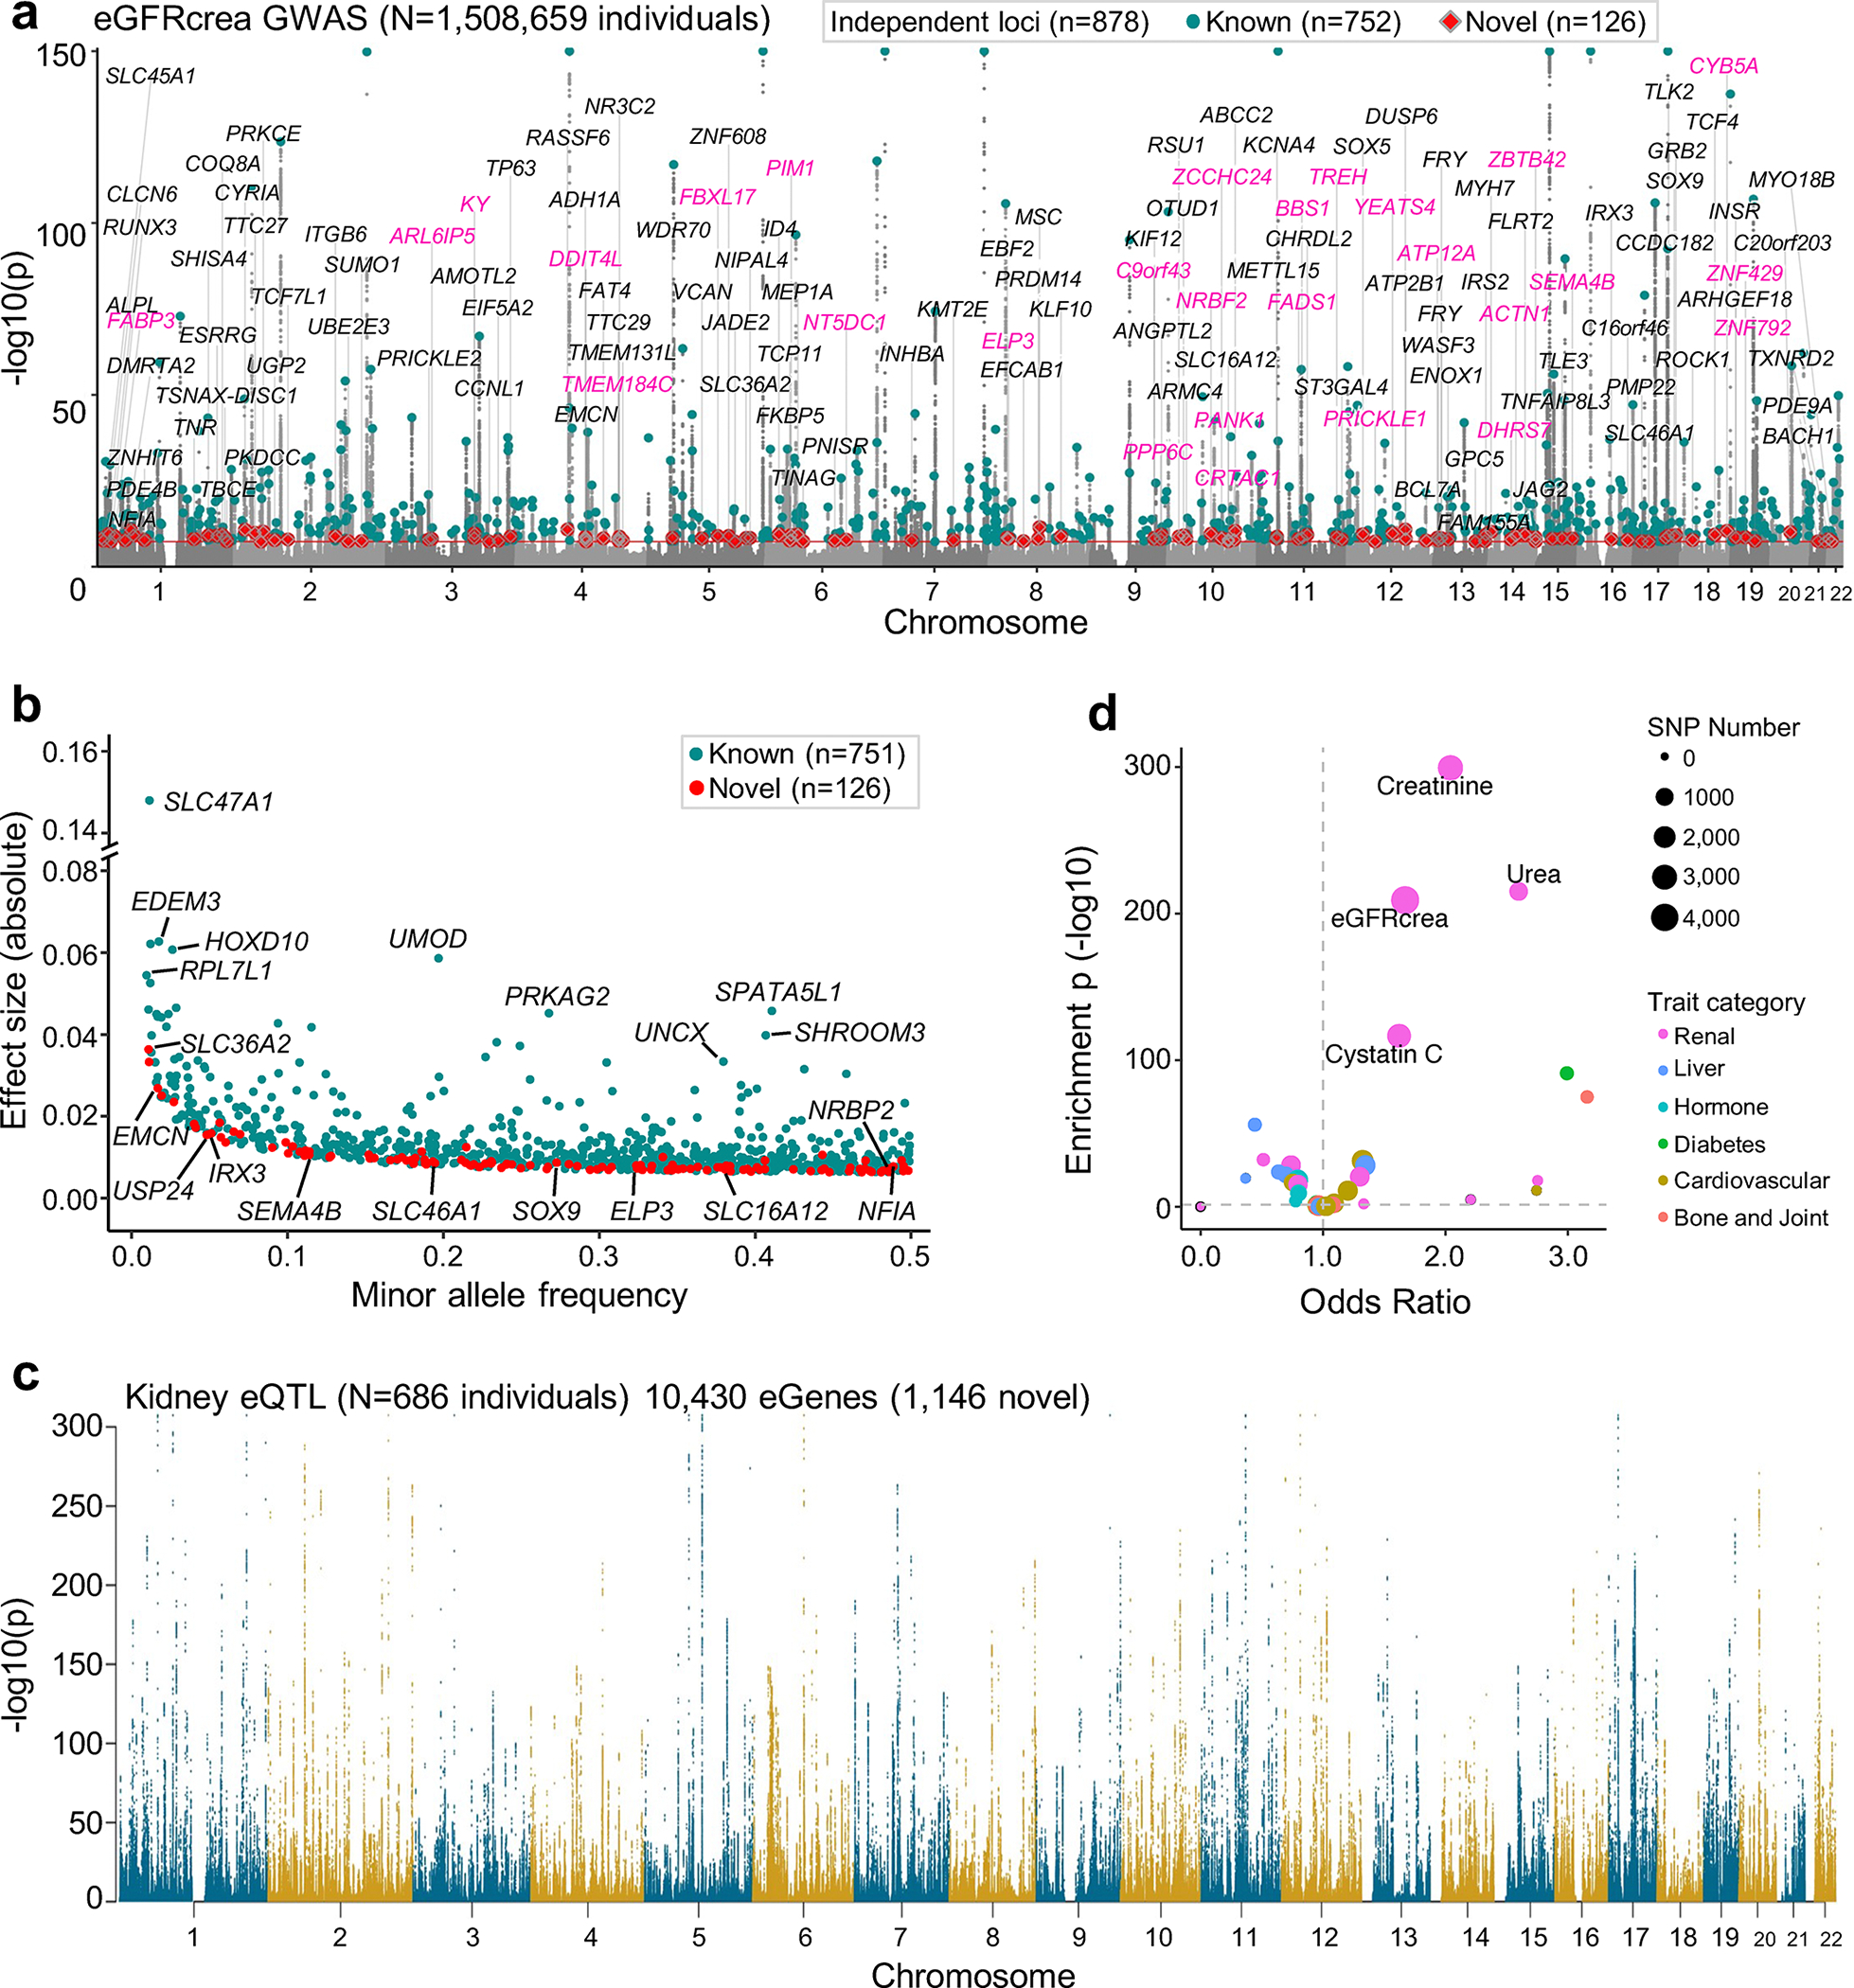
a. Manhattan plot of eGFRcrea GWAS of 1,508,659 individuals. X-axis is chromosomal location of SNP. Y-axis is strength of association -log10(p value, GWAS meta-analysis) (the scale is capped at 150). Lead SNPs for 878 independent loci are highlighted. Cyan represents loci overlapping or nearby (within 500kb or LD R2 > 0.001) previously reported sentinel variants, and red represents novel loci. Prioritized genes (score at least 3, in purple color) or closest genes (in black color) for the 126 novel loci are shown.
b. Scatter plot of minor allele frequency and effect size (absolute) of lead variants from 878 eGFRcrea GWAS loci. Cyan represents loci overlapping or nearby (within 500kb or LD R2 > 0.001) previously reported sentinel variants, and red represents novel loci.
c. Human kidney eQTL Manhattan plot (n= 686 kidney samples). X-axis is chromosomal location of SNP. Y-axis is strength of eQTL association -log10(p value eQTL meta-analysis).
d. Enrichment of kidney specific eQTL SNPs to GWAS traits. X-axis is odds ratio and Y-axis is strength of enrichment -log10(two-sided chi-square test p). Size of the dot represents the number of SNPs and colors represent the type of GWAS trait.
Genotype effect on renal gene expression (eQTL)
To comprehensively annotate the genotype effect on gene expression in the kidney, we integrated all publicly available kidney eQTL datasets from the Genotype-Tissue Expression (GTEx) project (v8)8, the Cancer Genome Atlas by Ko et al.9, the Nephrotic Syndrome Study Network eQTL (NephQTL) by Gillies et al.10, and our prior publication by Sheng et al.11, using fixed effects inverse-variance meta-analysis (Fig. 1a and Supplementary Table 3). The meta-analysis eQTL dataset included 201,627,059 associations with a total sample size of 686 (Methods, Fig. 2c and Extended Data Fig. 3). We identified 10,430 genes with eQTLs at a 1% false discovery rate (FDR) q value (hereafter referred to as eGenes), of which 11% (1,146) have not been previously reported7–11,30 (Supplementary Fig. 4 and Supplementary Table 4), including genes with known roles in kidney function, for example, Transcription Factor AP-2 Beta (TFAP2B)31 and Solute Carrier Family 22 Member 1 (SLC22A1)32. Comparing to eQTLs of 48 GTEx tissues, we identified 64,328 kidney-specific eQTLs associated with 3,046 eGenes (m-value > 0.9 in less than five tissues, including kidney) (Supplementary Table 5). Kidney-specific eQTL variants were significantly enriched for eGFRcrea GWAS (odds ratio (OR) = 1.67, χ2 test p = 8.4×10−210) and other kidney disease traits (Fig. 2d). Kidney-specific eGenes showed significant (p = 1.3×10⁻⁹) enrichment for metabolic pathways indicating the key role of the kidney in metabolism (Supplementary Table 6).
Robust identification of meQTL in the human kidney
The genotype effect on the epigenome has not been well characterized in the kidney; therefore, we performed high-density genotyping and high throughput DNA methylation profiling in 506 human kidneys (Fig. 3a). After quality control (Supplementary Table 7–9), we performed meQTL mapping in 443 kidney samples using an additive linear model with covariates including technical and clinical variables and probabilistic estimation of expression residuals (PEER) factors (Supplementary Fig. 5a,b). We identified 139,313 CpGs with meQTLs at a 1% FDR (hereafter referred to as mCpGs) (Fig. 3b and Supplementary Table 10–11), providing a comprehensive landscape of genetic effect on kidney epigenome (Supplementary Fig. 6). Significant meQTL SNPs were mostly located within 100kb of target CpGs, and significantly enriched on kidney enhancer regions (OR = 1.71, χ2 test p < 1×10−300) (Fig. 3c and Supplementary Fig. 5c–e).
Fig. 3. Robust identification of human kidney meQTL.
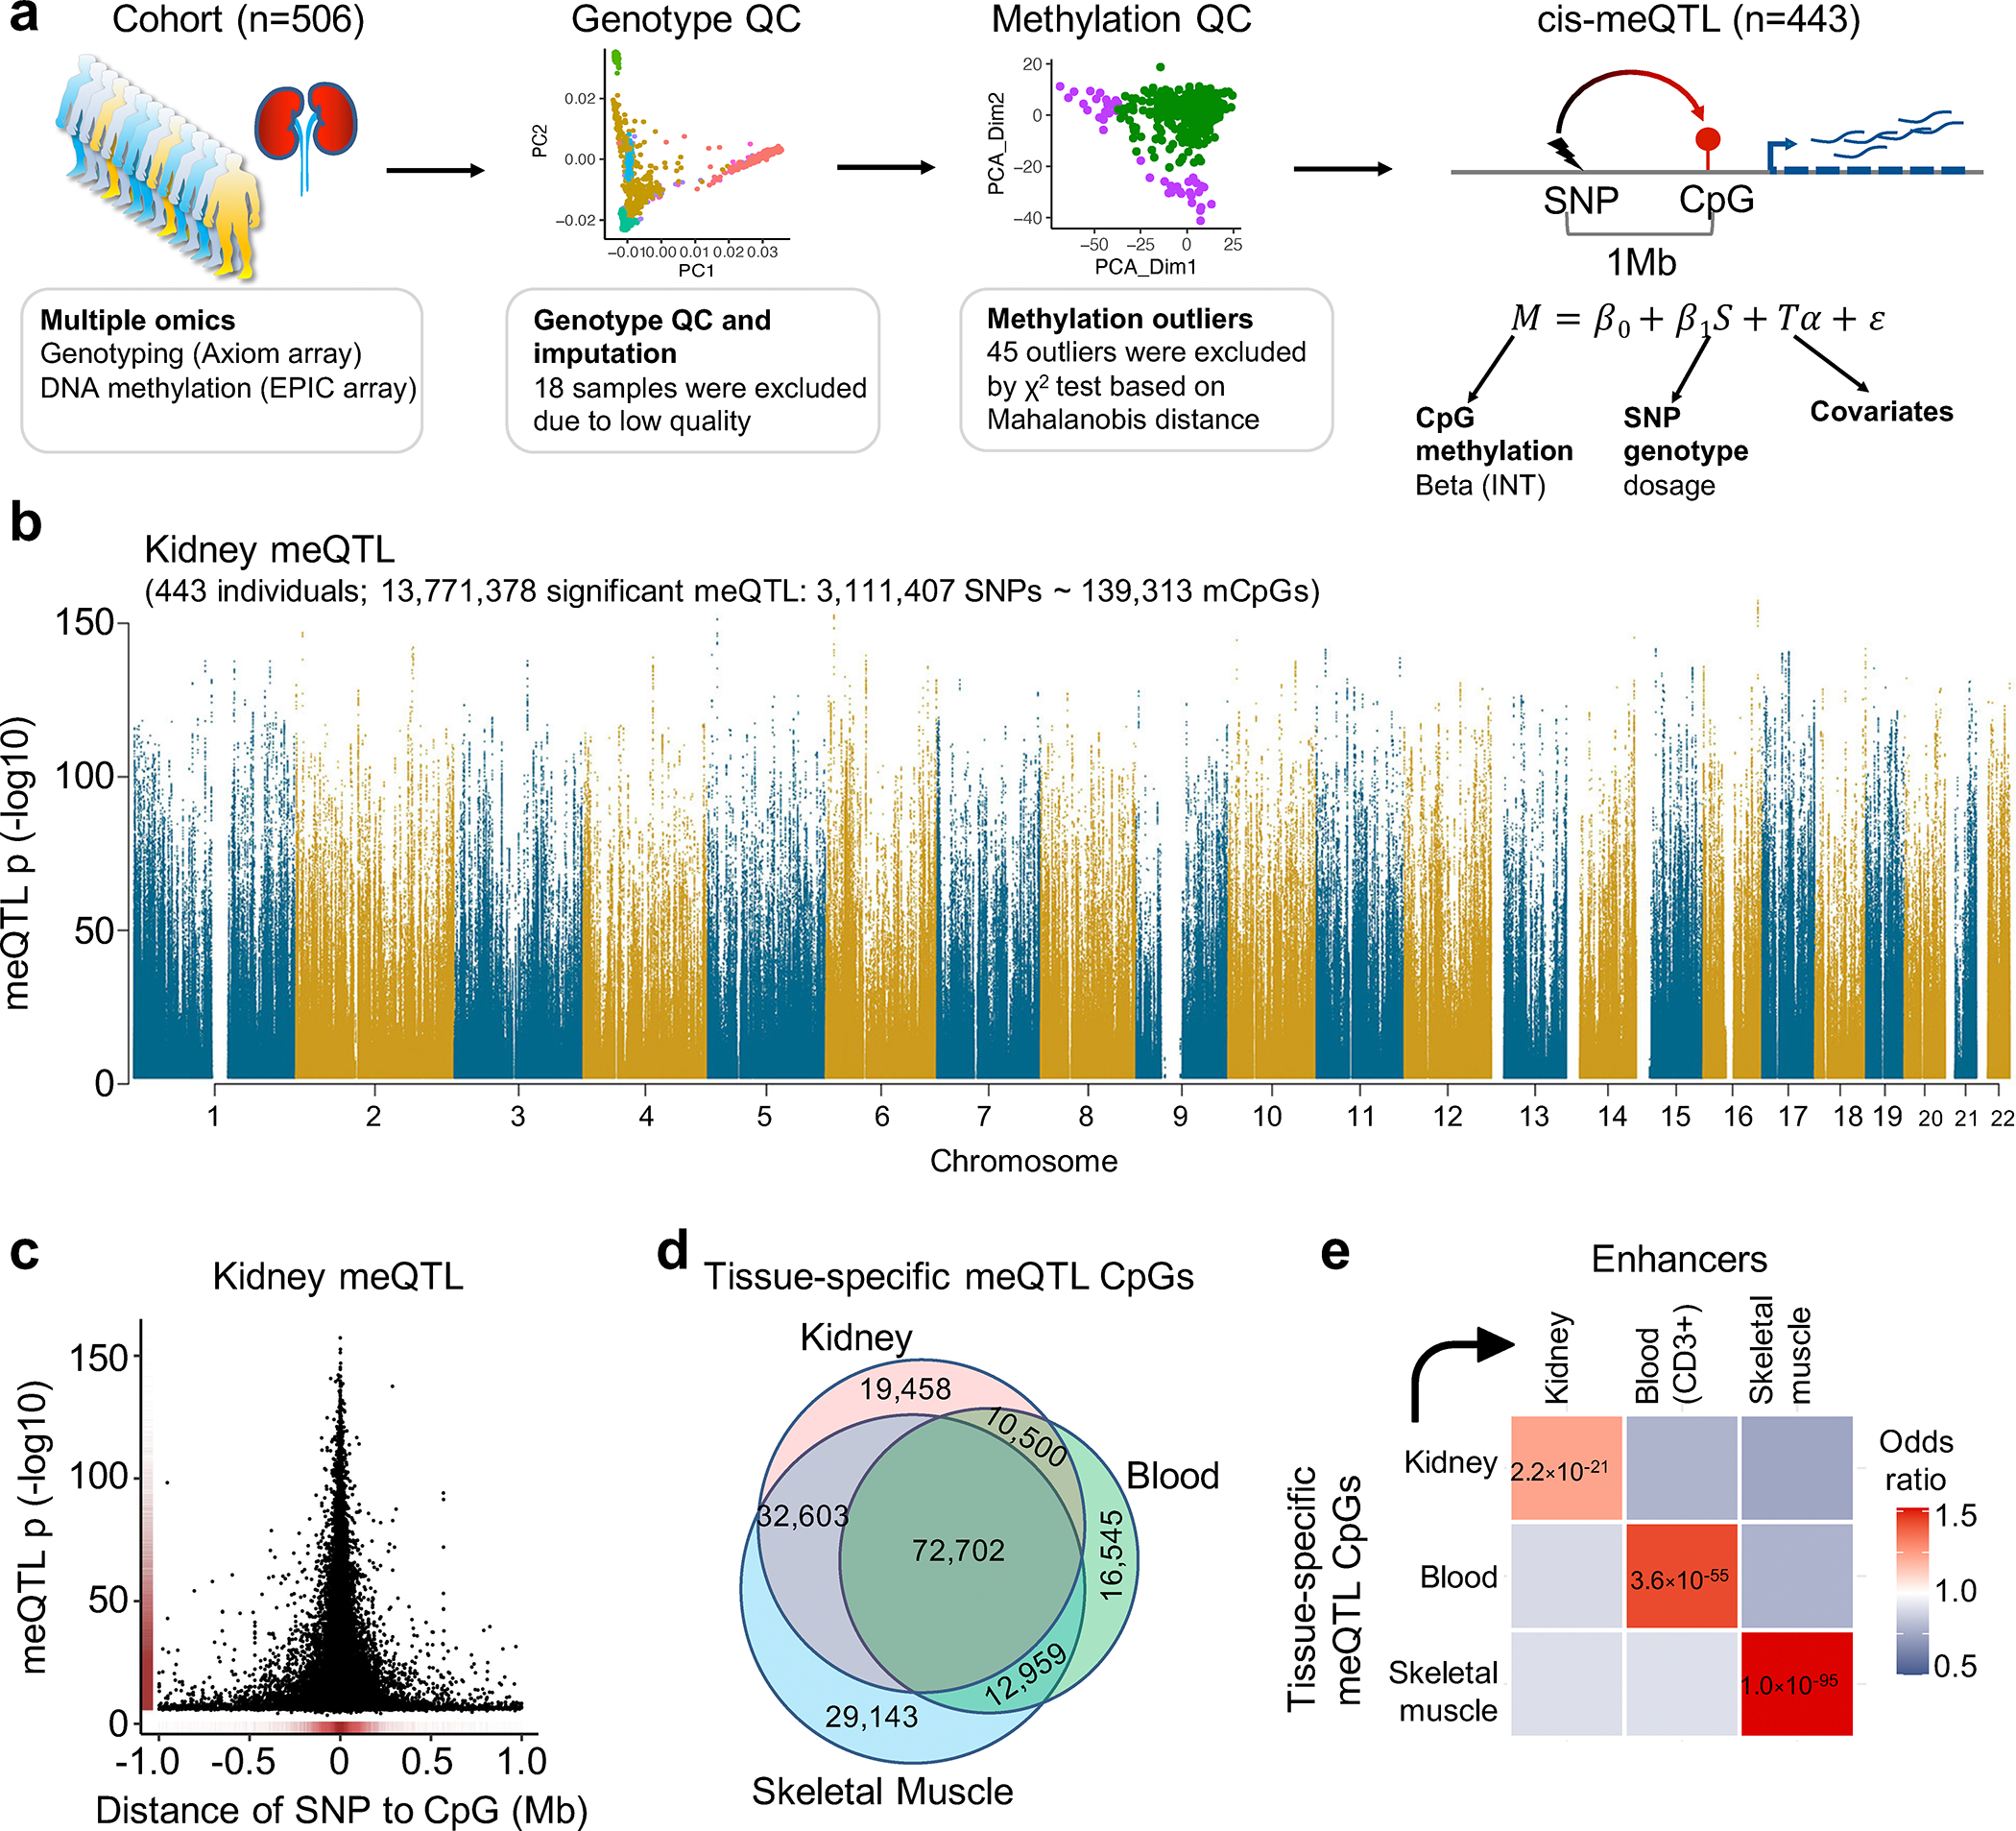
a. Samples and analytical workflow for the meQTL analyses.
b. Manhattan plot of human kidney meQTL data (n=443). X-axis is chromosomal location. Y-axis strength of association -log10(two-sided p). The two-sided p value was calculated by linear regression meQTL model. Only meQTLs with p < 0.01 are shown in the Manhattan plot.
c. The strength of association (-log10(two-sided p), y-axis) of the best mSNPs (the lead meQTL for each mCpG) decreases with the increasing distance (x-axis) from the CpG sites.
d. Overlap of meQTL CpGs between kidney, blood, and skeletal muscle.
e. Enrichment of tissue-specific meQTL CpGs in tissue enhancers. X-axis tissue enhancer, y-axis tissue meQTLs. The color shows the enrichment odds ratio from low (blue) to high (red), while the p-value (two-sided chi-square test) is listed in the box.
To identify kidney-specific meQTLs, we compared kidney meQTLs to whole blood33 and skeletal muscle19 meQTLs, and identified 19,458 mCpGs with high kidney specificity (m-value > 0.9 only in kidney) (Fig. 3d and Extended Data Fig. 4a). Kidney-specific mCpGs were enriched on kidney enhancers (OR = 1.23, χ2 test p = 2.2×10⁻²¹), kidney-specific transcription factor binding sites (for example HNF4A) and proximal tubule-specific accessible chromatin regions (OR = 2.23, χ2 test p = 4.9×10−167) (Fig. 3e and Extended Data Fig. 4b–d). Kidney-specific meQTL variants showed significant enrichment for kidney function traits including creatinine (OR = 1.51, χ2 test p = 7.3×10−85) (Extended Data Fig. 4e).
Expression quantitative trait methylation analysis (eQTM)
Next, we obtained gene expression information via RNA sequencing for the analyzed kidney samples (N=414) and explored the relationship between CpG methylation and gene expression via expression quantitative trait methylation (eQTM) analysis (Methods, Extended Data Fig. 5a,b). We identified 33,616 unique CpGs whose methylation levels correlated with expression of 8,908 unique genes at a global FDR < 0.05, enabling target genes identification for mCpGs (Extended Data Fig. 5c–d and Supplementary Table 11,12). Most (64%) eQTM CpGs showed the canonical negative association with their target gene expression, as observed in other tissues19,34–36 (Extended Data Fig. 5c,e,f). The negative eQTM CpGs showed significant enrichment on active promoters (OR = 1.83, χ2 test p = 2.5×10−217) and distal enhancers (OR = 1.61, χ2 test p = 9.7×10−102), while positive eQTMs CpGs were enriched on repressed polycomb areas marked by H3K27me3 (OR = 1.91, χ2 test p = 7.3×10−102) (Extended Data Fig. 5g–j). The (canonical) negative eQTM genes were enriched for metabolic pathways (Supplementary Table 13).
Methylation explains more GWAS heritability than expression
Next, we aimed to estimate kidney disease heritability mediated by DNA methylation and gene expression using the recently developed mediated expression score regression (MESC) method12 (Fig. 4a). To this end, MESC was applied to kidney methylation and expression data obtained from 414 individuals (78% European ancestry) and six GWAS datasets of kidney function biomarkers (Supplementary Table 14). Across three kidney function traits (eGFRcrea of UKBB, eGFRcys and BUN), the average proportion of heritability (defined as ) mediated by gene expression was around 0.21 (± 0.017 standard error) (Fig. 4b,c and Extended Data Fig. 6a). Meanwhile, the average mediated by methylation was around 0.46 (± 0.051 standard error), potentially indicating the key role of methylation in mediating heritability. We consistently observed that larger fraction of GWAS heritability explained by DNA methylation than gene expression when we applied MESC to European-ancestry only datasets and at different sample sizes as well (Fig. 4c and Extended Data Fig. 6b,c).
Fig. 4. Methylation variation explains a larger fraction of GWAS heritability than gene expression variation.
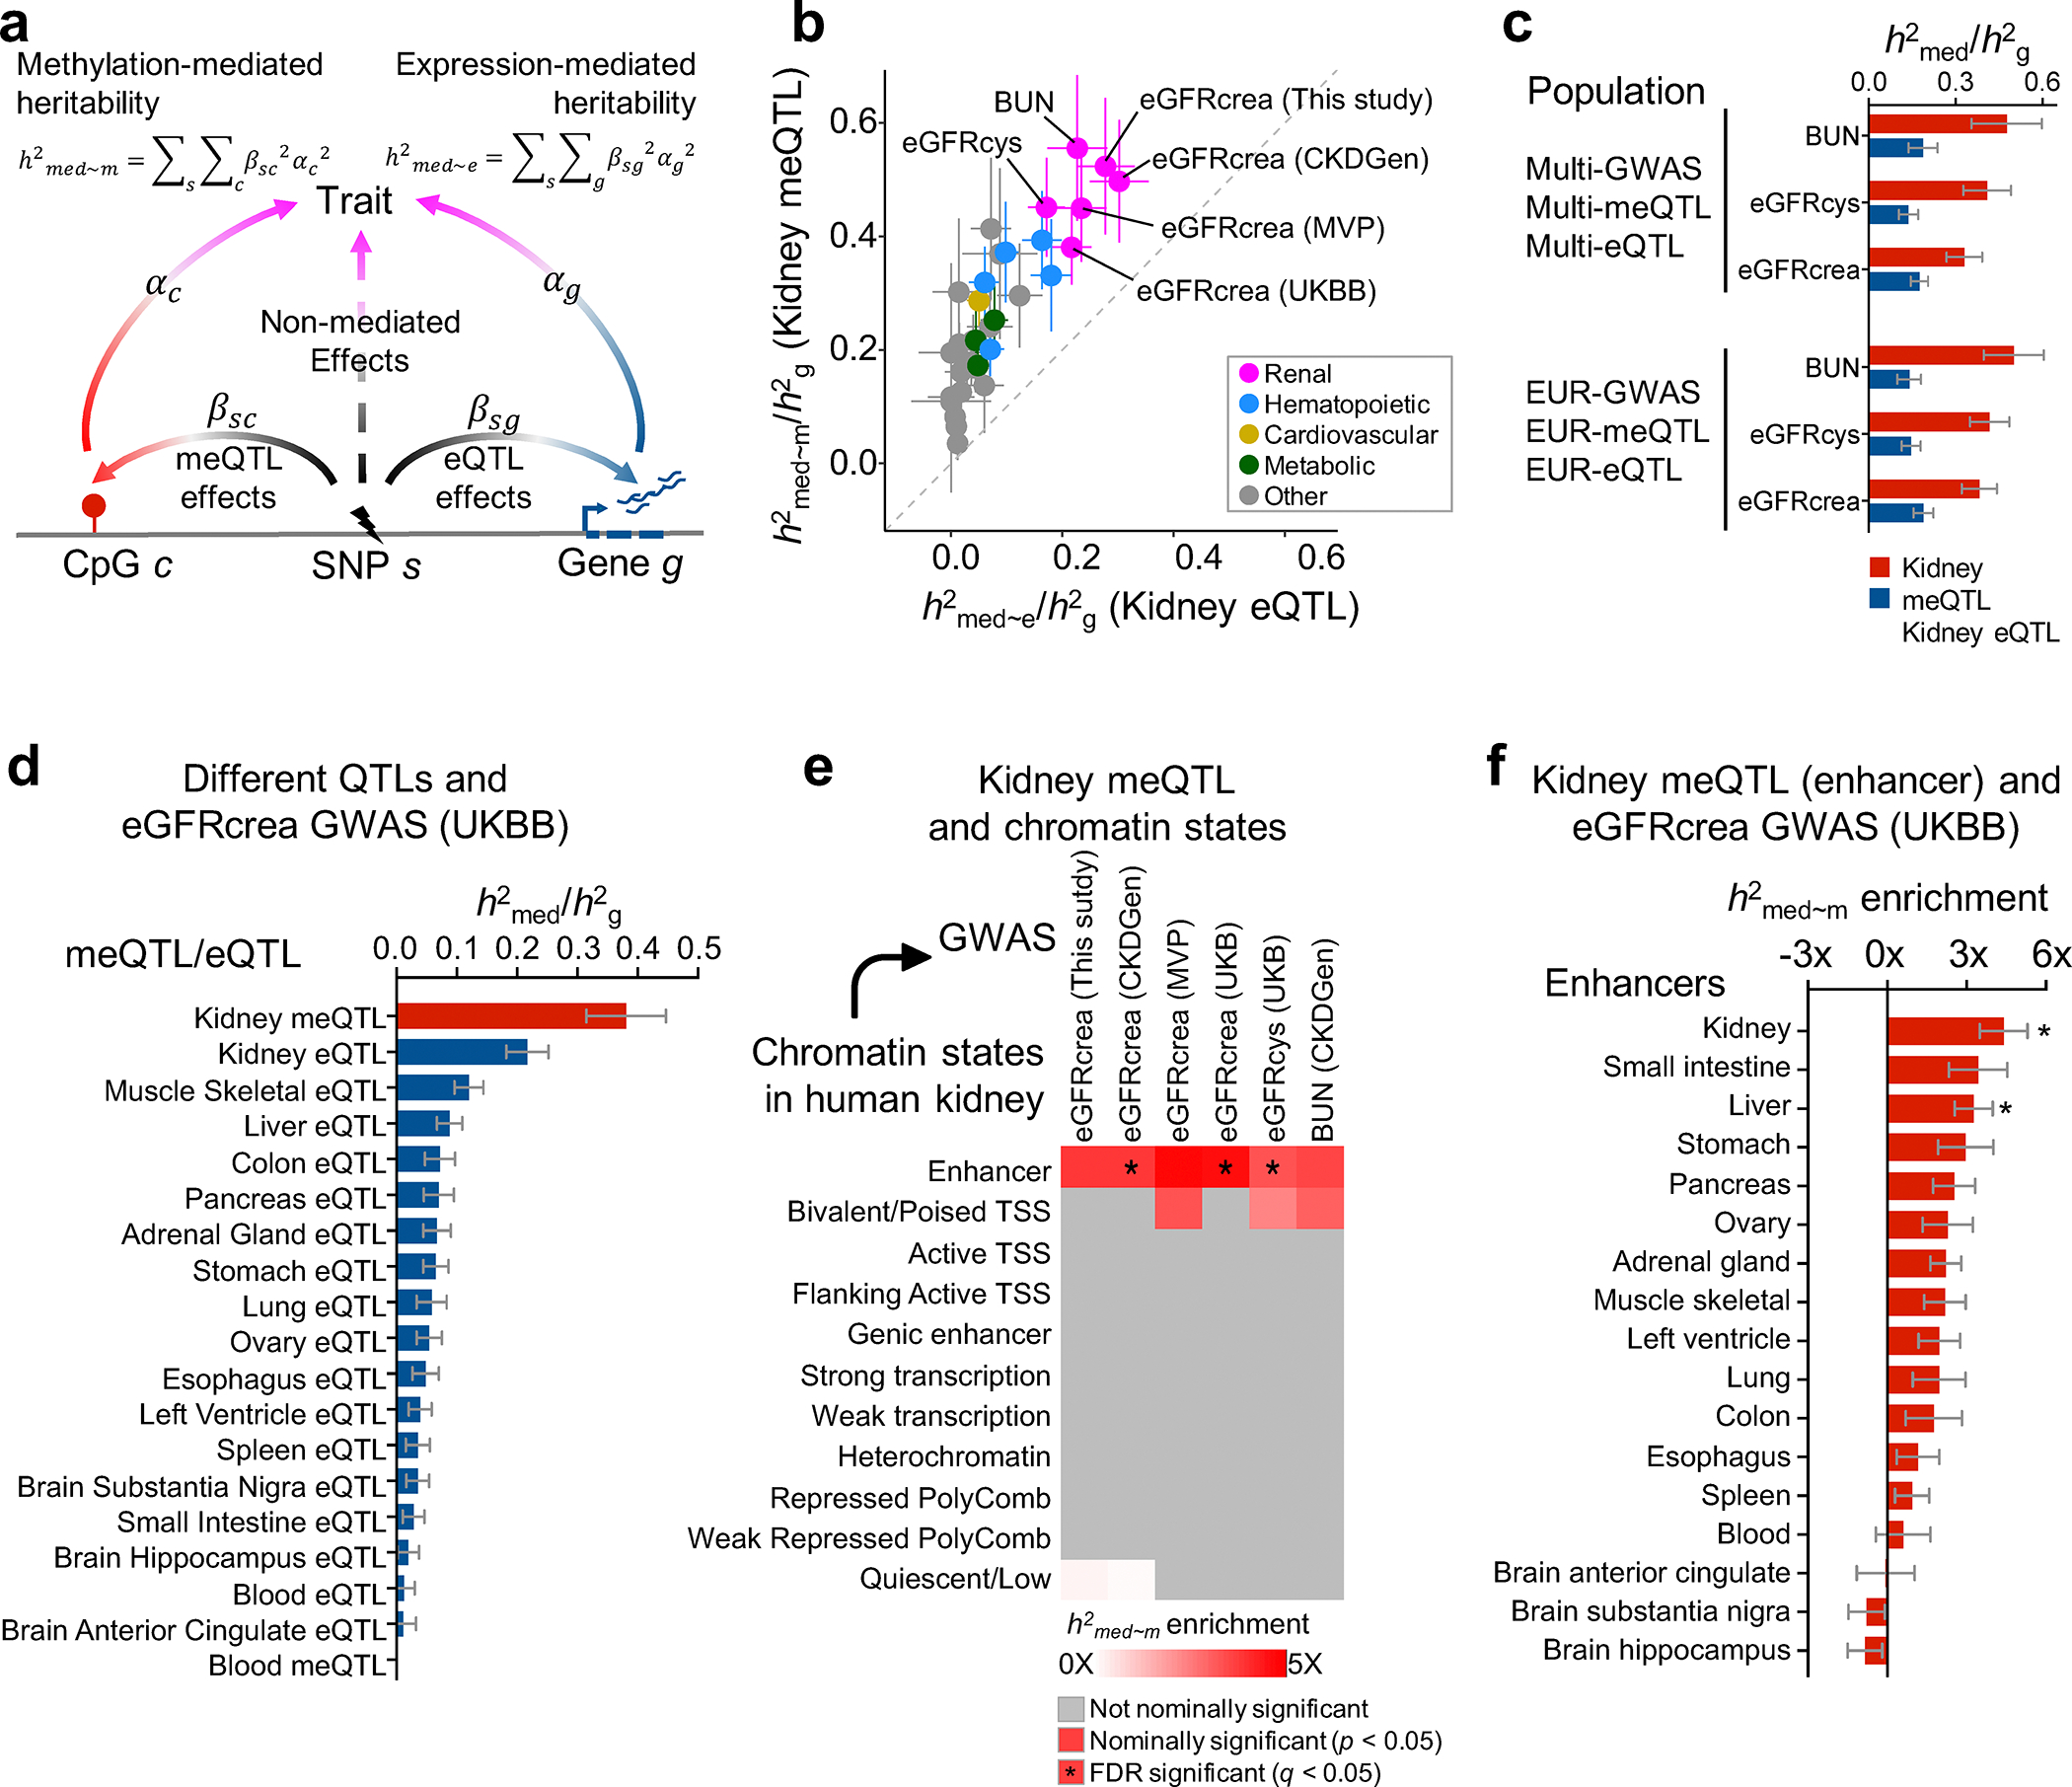
a. Schematic representation for estimation of heritability mediated by DNA methylation and gene expression using mediated expression score regression (MESC) analysis.
b. Estimated proportion of heritability () mediated by DNA methylation and gene expression in 414 kidneys across 34 GWAS traits. The y-axis represents mediated by methylation, while the x-axis mediated by expression. The color represents the type of the GWAS trait, error bars represent jackknife standard errors estimated for mediated by methylation and expression, respectively.
c. Estimated proportion of heritability () by multi-ancestry and European (only) ancestry datasets for kidney function GWAS traits (eGFRcrea, eGFRcys and BUN). The x-axis represents . For each bar plot, the center of error bar represents the value of , and error bar represent jackknife standard error.
d. Estimated proportion of heritability mediated by meQTLs and eQTLs from kidney and other tissue for eGFRcrea GWAS (n = 421,531 UKBB individuals). The x-axis represents , while the y-axis represents eQTL or meQTL data obtained from different tissues. meQTL data are shown in red and eQTL in blue. For each bar plot, the center of error bar represents the value of , and error bar represents jackknife standard error. See estimates of for other QTLs in Extended Data Fig. 6d.
e. Enrichment of kidney methylation-mediated heritability for kidney function GWAS traits (x-axis) in different ChromHMM regulatory elements (y-axis). White to red indicates enrichment (nominal two-sided p < 0.05 calculated by MESC). Asterisk indicates enrichment passing FDR q < 0.05 (accounting for 374 tests for 11 chromatin state CpG sets and 34 GWAS traits, Supplementary Fig. 7). TSS, transcription start site.
f. Enrichment of kidney methylation-mediated heritability (x-axis) for eGFRcrea GWAS (n = 421,531 UKBB individuals) in enhancers of different tissues (y-axis). For each bar plot, the center of error bar represents the enrichment score, and error bar represents jackknife standard error. Asterisk indicates enrichment passing FDR q < 0.05 (accounting for 4,352 tests for 128 enhancer CpG sets and 34 GWAS traits, Extended Data Fig. 7a).
To understand whether the kidney meQTL-improved heritability estimates are specific for kidney traits, we analyzed 28 non-kidney function GWAS traits (average N = 421,000 individuals from the UK Biobank)37. Compared to non-kidney traits, kidney traits showed higher estimates of by kidney meQTL and eQTL (Fig. 4b). Compared to blood meQTL33 and 48 non-kidney GTEx tissues eQTL8, kidney meQTL explained the highest for eGFRcrea and eGFRcys GWAS (Fig. 4d and Extended Data Fig. 6d), indicating important tissue-specific heritability of traits38. Compared with non-kidney tissue eQTL, kidney eQTL mediated higher fraction of heritability for kidney traits, but lower fraction of heritability for non-kidney traits (Extended Data Fig. 6a,e).
To gain further insight into methylation-mediated heritability, we estimated heritability enrichment for chromatin states. We consistently observed that kidney methylation-mediated heritability for kidney function traits was enriched on kidney enhancers (Fig. 4e and Supplementary Fig. 7), when comparing to enhancers from 127 different Roadmap tissues39 (Fig. 4f and Extended Data Fig. 7). In summary, our results indicate that a greater fraction of kidney function heritability is mediated by kidney-specific methylation, with specific enrichment at kidney enhancers.
Human kidney single cell open chromatin information
Next, we wanted to identify cell types within the human kidney causally associated with specific traits. To this end, we generated single nucleus (sn)ATAC-seq data from six adult human kidney samples and analyzed open chromatin in 57,229 cells after quality control (Fig. 5a, Supplementary Table 15 and Methods). First, we estimated enrichment of methylation-mediated heritability at cell type-specific open chromatin areas. We found eGFRcrea GWAS heritability mediated by methylation was enriched at proximal tubule-specific accessible chromatin (Fig. 5b and Supplementary Fig. 8a), which was further confirmed in single cell GWAS trait enrichment analysis for 63 complex trait fine mapped causal variants using gchromVAR40 (Fig. 5c and Supplementary Fig. 8b). In addition, collecting duct principal cell-specific accessible areas showed enrichment for systolic blood pressure GWAS (Fig. 5b,c).
Fig. 5. Single cell chromatin accessibility map enables target cell type and gene prioritization for GWAS variants.
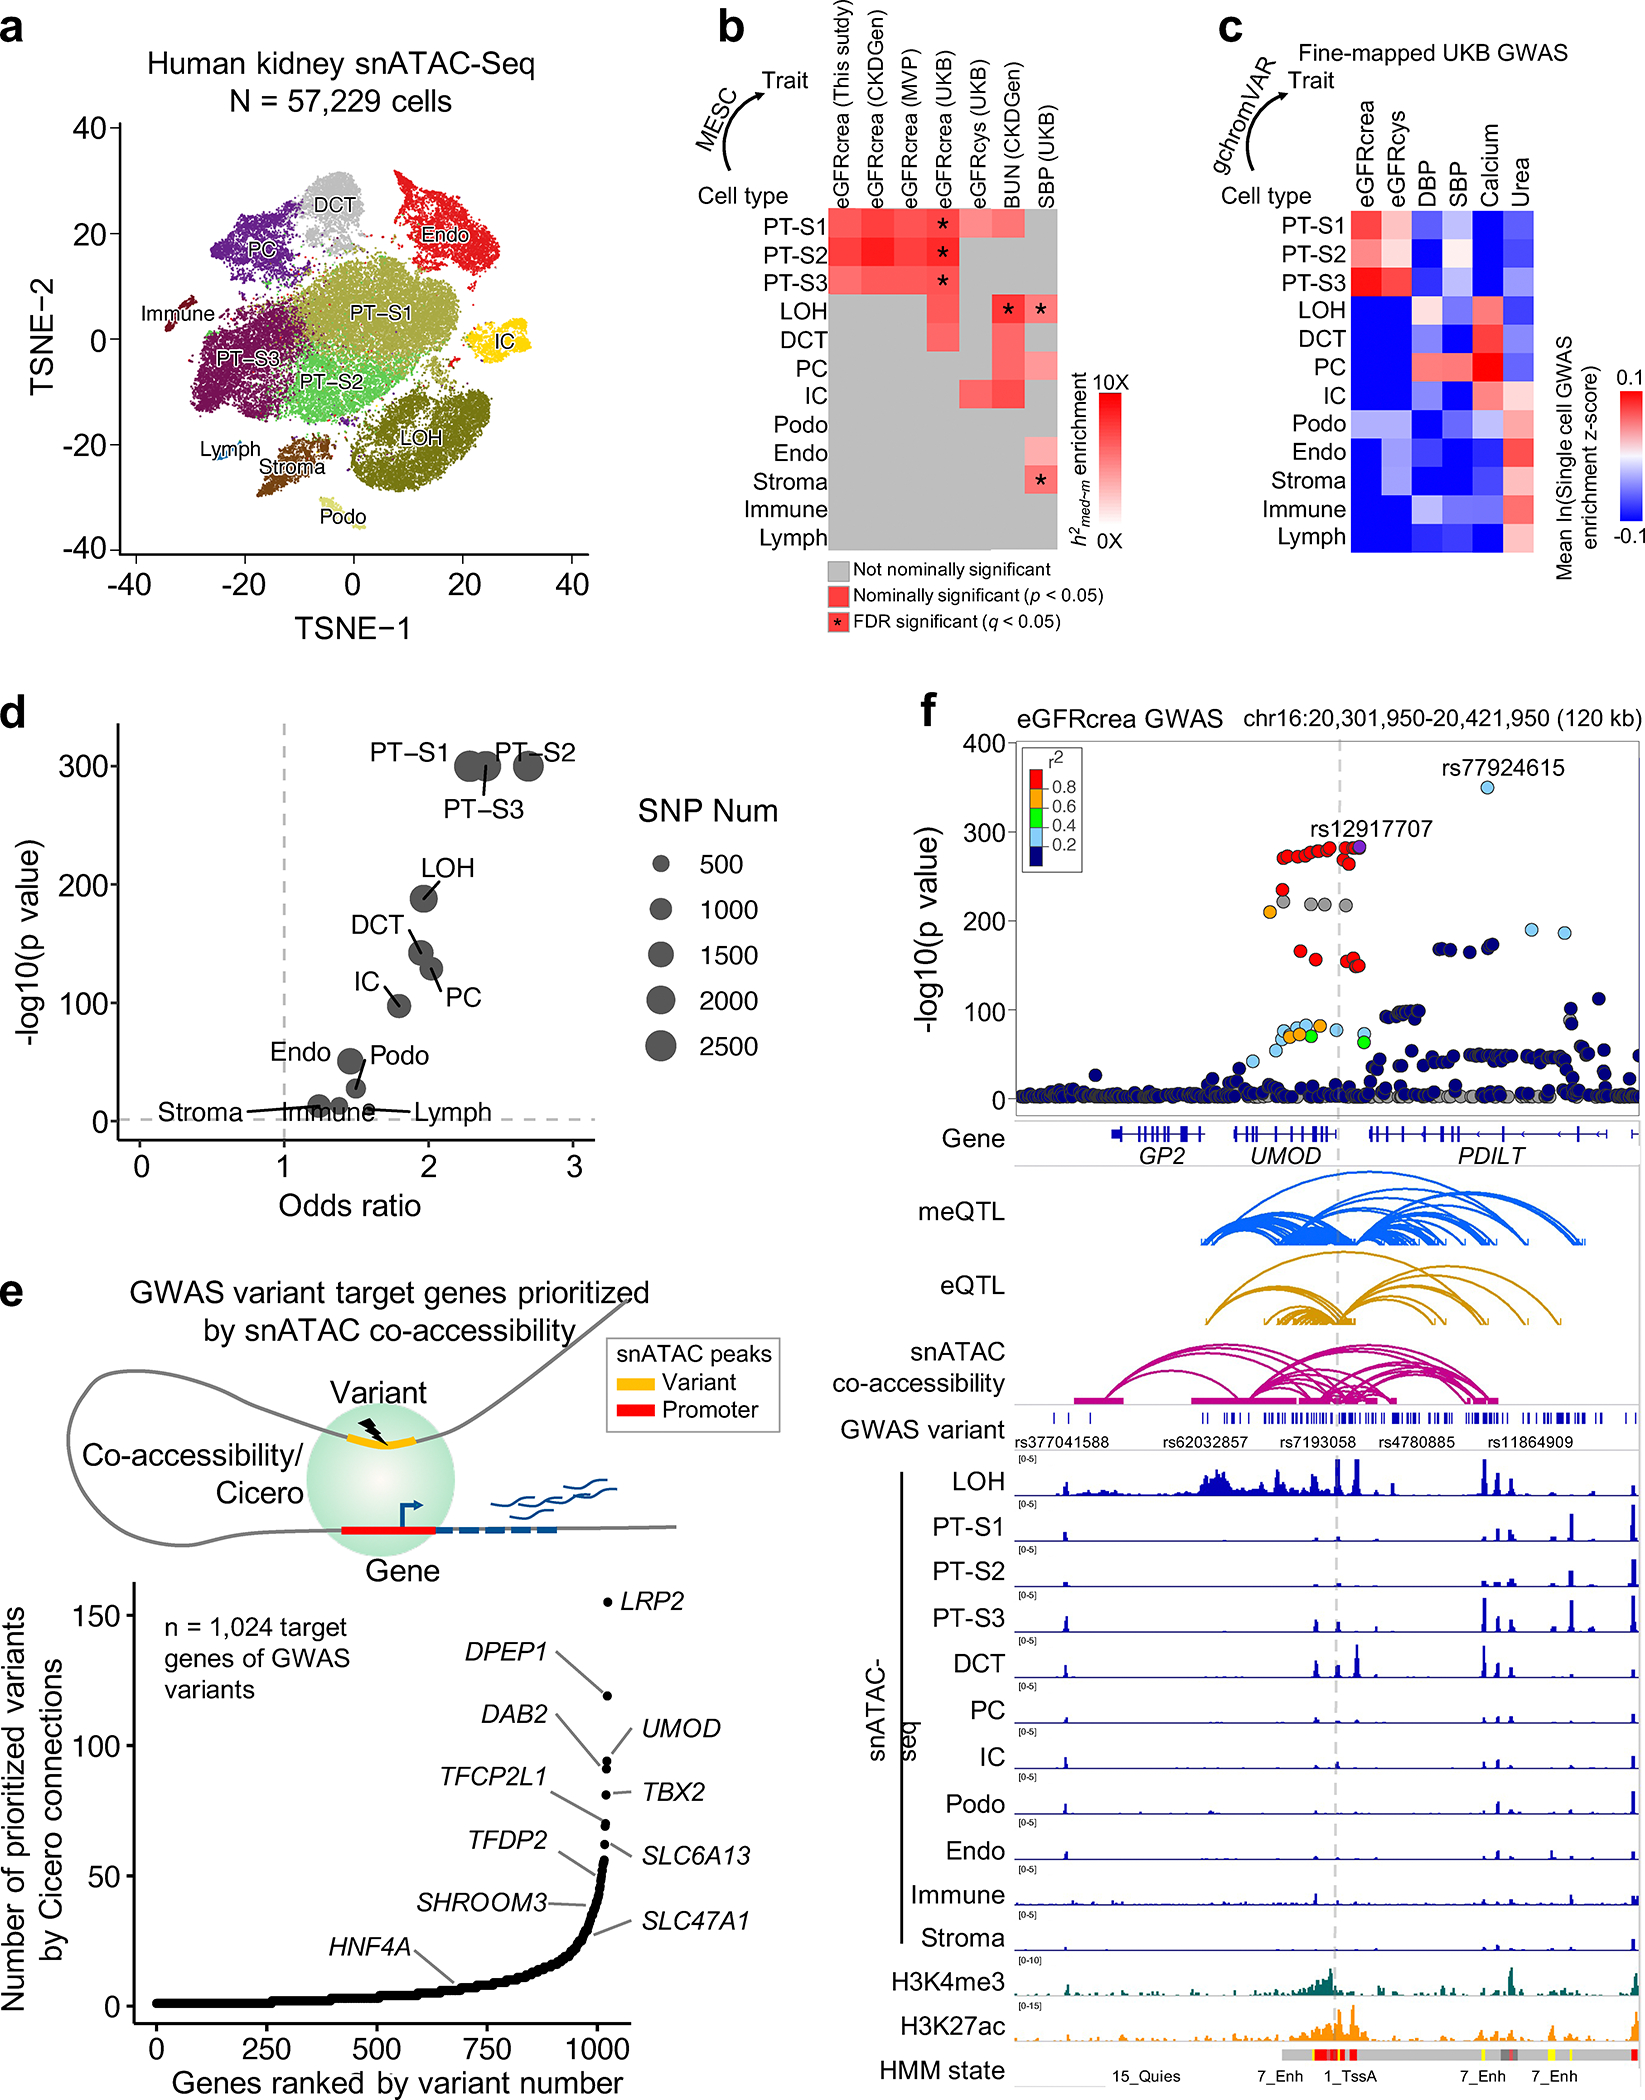
a. Single cell resolution accessibility maps for 57,229 human kidney cells by snATAC-seq. The x-axis and y-axis represent t-SNE dimension 1 and 2, respectively. Each dot represents a cell and color represents cell type such as PT-S1–3: proximal tubule S1–3 segment, LOH: loop of Henle, DCT: distal convoluted tubule, PC: principal cell of collecting duct, IC: intercalated cell of collecting duct, Endo: endothelial cells, Podo: Podocyte, Immune cell, Lymph cells, and Stroma cell.
b. Enrichment of kidney methylation-mediated heritability for kidney function GWAS traits (x-axis) in kidney cell type-specific accessible regions (y-axis). White to red indicates enrichment (nominal p < 0.05 calculated by MESC). Asterisk indicates enrichment passing FDR q < 0.05 (accounting for 408 tests for 12 cell type CpG sets and 34 GWAS traits, Supplementary Fig. 8a).
c. Single cell GWAS trait enrichment in human kidney cells by gchromVAR. X-axis shows fine-mapped GWAS traits, and y-axis cell types. The single cell GWAS enrichment z-score mean value of all cells in each cell type is represented by blue (low) to red (high). See estimates for all 63 GWAS traits in Supplementary Fig. 8b.
d. Enrichment of eGFRcrea GWAS variants in kidney cell type-specific accessible regions. X-axis is odds ratio, and y-axis is strength of enrichment -log10(p value of two-sided chi-square test). Dot size represents the number of variants overlapping with differentially accessible regions in given cell type.
e. GWAS variant target genes prioritized by Cicero co-accessibility. Upper panel is schematic representation of target gene prioritization using Cicero connections. Lower panel indicates 1,024 target genes (x-axis) ordered by number of prioritized variants (y-axis).
f. Upper panel. LocusZoom plot of eGFRcrea GWAS associations (n = 1,508,659 individuals) at the UMOD locus. Y-axis is strength of association -log10(p value calculated using z statistic from GWAS meta-analysis). The top variant (rs12917707) tagging the independent signal closest to UMOD was selected as the index variant to calculate LD (r2) with other variants, represented from low (blue) to high (red). Lower panel includes meQTL, eQTL, eGFRcrea GWAS variants, Cicero connections, snATAC-seq chromatin accessibility, histone modifications by ChIP-seq, and chromatin states.
Next, we used the snATAC-seq data to prioritize target genes for eGFRcrea GWAS variants. We found that most eGFRcrea GWAS variants were located on proximal tubule open chromatin areas (Fig. 5d and Supplementary Fig. 8c). We performed single-cell chromatin co-accessibility analysis by Cicero41 and identified 1,024 target genes associated with 7,829 eGFRcrea GWAS variants from 531 independent loci (Fig. 5e and Supplementary Table 16). To illustrate the key role of single cell co-accessibility information, we highlight the UMOD locus in which variants showed strong GWAS association. Our co-accessibility analysis prioritized 96 GWAS variants in this locus, most (93.8%) of which showed co-accessibility with the UMOD promoter, including the locus lead variant (rs77924615~eGFRcrea association p = 1.2×10−348; rs77924615~UMOD co-accessibility score = 0.68) (Fig. 5f). In summary, our results indicate that human kidney single cell accessibility maps enable identification of cell types and genes related to kidney functions.
Integrative analysis improves target gene prioritization
To prioritize target genes for kidney function GWAS loci, we first used Bayesian colocalization (coloc) to identify loci where the genotype effect on eGFRcrea, methylation and gene expression were shared (Methods and Supplementary Fig. 9a). Using a strict posterior probability cutoff (H4 > 0.8), we observed colocalization events between at least two traits for 44,819 variants from 576 (66% of total) independent loci (Fig. 6a and Supplementary Fig. 9b), 4,613 mCpG and 626 coding eGenes (Fig. 6b and Supplementary Tables 17–19). We prioritized 330 target genes with colocalization between eGFRcrea GWAS and kidney eQTL, including 188 novel genes, more than previously reported4,5,7,11,24 (Supplementary Fig. 9c–e). In particular, we identified multiple-trait colocalization (moloc, PPA.abc > 0.8) among eGFRcrea GWAS, meQTL, and eQTL in 152 independent loci for 236 eGenes including 13 Mendelian nephropathy genes42 (Fig. 6b,c and Supplementary Table 20). These moloc prioritized genes showed greater protein-protein interaction (p = 4.2×10⁻⁸, Supplementary Fig. 9f) and were enriched for metabolic functions (Supplementary Table 21).
Fig. 6. Integrative analysis of epigenetic and gene expression data improves kidney disease target gene prioritization.
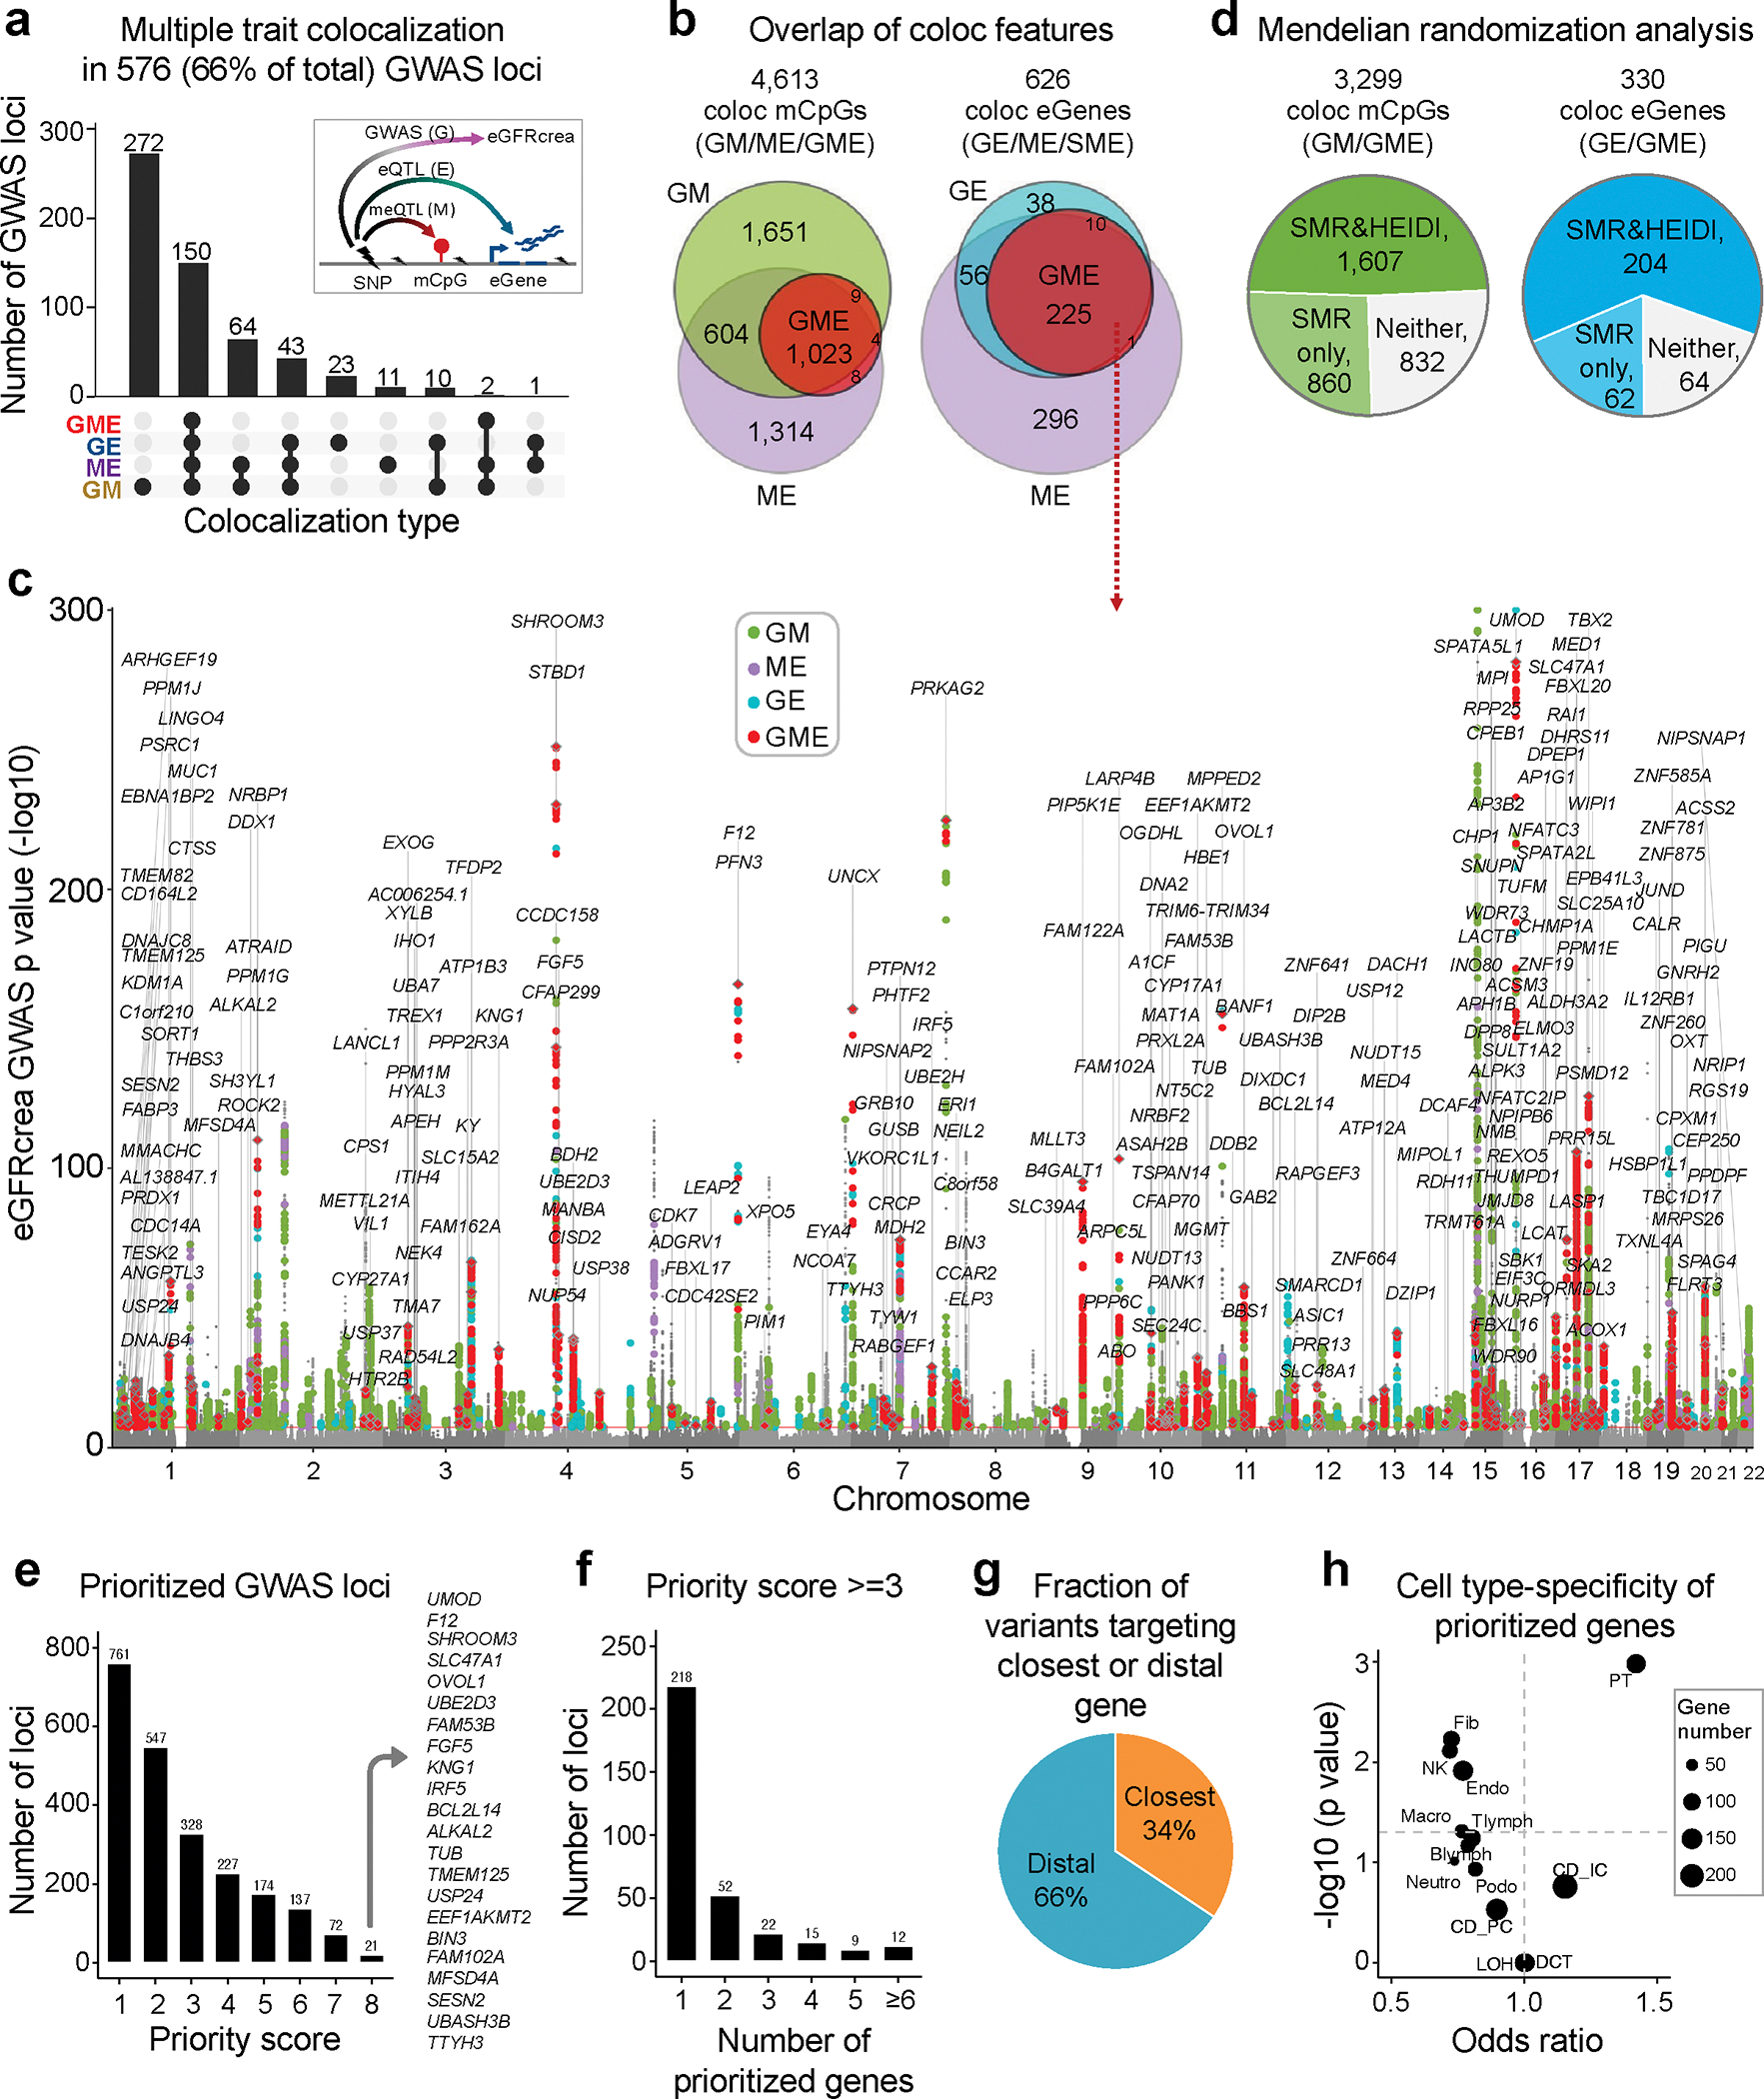
a. Number of eGFRcrea GWAS independent loci showing colocalization across eGFRcrea GWAS, meQTL and eQTL. The x-axis showed different combination of colocalization types and the y-axis is number of loci with given colocalization types.
b. Venn diagram showing number of mCpGs and eGenes with different colocalization types across eGFRcrea GWAS, meQTL and eQTL.
c. Manhattan plot highlighting 330 genes with evidence of multiple traits colocalization. The x-axis is chromosomal location of the SNP. The y-axis is strength of association -log10(p value calculated using z statistic from GWAS meta-analysis) (the scale is capped at 300). The color indicates different type of colocalizations; green: GWAS and methylation; purple: methylation and expression; blue: GWAS and expression; red: GWAS, methylation and expression.
d. Number of colocalization mCpGs and eGenes passing SMR and/or HEIDI tests in Mendelian randomization analysis across eGFRcrea GWAS, meQTL and eQTL.
e. Number of eGFRcrea GWAS independent loci prioritized based on different priority scores. The y-axis is number of independent loci including at least one prioritized gene with equal or higher priority score (number of supporting evidence) given on the x-axis. The list shows genes with priority score of 8.
f. Number of genes prioritized for eGFRcrea GWAS loci by priority score ≥ 3.
g. Fraction of variants targeting closest gene or distal gene (priority score ≥ 3). For each variant, its target gene is defined as the closest gene if the target gene’s transcript start site is the closest one to the variant.
h. Mouse kidney cell type expression enrichment of prioritized genes (priority score ≥ 3). The x-axis represented the odds ratio and the y-axis represented enrichment significance (-log10 of hypergeometric test p) for the prioritized genes and cell type-specific gene overlap.
Next, we performed summary-data-based mendelian randomization (SMR). We detected 2,467 mCpGs (74.8% of coloc mCpGs) associated with eGFRcrea GWAS at PSMR < 1.52×10⁻⁵ (Bonferroni threshold accounting for 3,286 tested CpGs, i.e. 0.05/3,286) and 266 coding eGenes (80.6% of coloc eGenes) associated with eGFRcrea GWAS at PSMR < 1.52×10⁻⁴ (i.e. 0.05/330 tested genes) (Fig. 6d and Supplementary Table 17,18,19,22). To distinguish pleiotropy from linkage, a follow-up test for heterogeneity in dependent instruments (HEIDI) identified 1,607 mCpGs (48.7% of coloc mCpGs) and 204 eGenes (61.8% of coloc eGenes) whose associations with eGFRcrea GWAS were caused by pleiotropy at PHEIDI > 0.0143 (Fig. 6d).
Further, we developed a prioritization scoring system to identify target genes for eGFRcrea GWAS loci by integrating evidence from eight different omics datasets or analytical tools, such as eQTL, meQTL and eQTM, coloc (GWAS and eQTL), moloc (GWAS, eQTL and meQTL), SMR, HEIDI, single cell co-accessibility, and Activity-by-Contact Model44 (Methods and Extended Data Fig. 8a). For each significant GWAS variant, we searched for potential target genes within 1Mb window and the top gene with most supporting data was assigned. This strategy enabled us to prioritize target genes for 55,825 variants from 761 (86.7% from total 878) independent loci, including 498 newly prioritized loci without overlap with previously prioritized GWAS signals24 or creatinine-associated exome rare variants25,26 (Fig. 6e, Extended Data Fig. 8b,c and Supplementary Table 23,24).
Finally, we focused on 328 independent eGFRcrea GWAS loci with priority score ≥ 3 (Extended Data Fig. 8d). A single target gene could be assigned to majority (66.5%) of 328 loci. Some (110) loci had multiple prioritized target genes, most of which showed strongly correlated expression between nearby genes or had multiple GWAS signals at the same locus (Fig. 6f and Supplementary Fig. 10). For more than 60% of variants, the prioritized gene was not the closest gene, indicating the importance of multi-omics datasets (Fig. 6g). Next, we examined features of the top prioritized variants in these loci, and observed that 83% of the top prioritized variants were supported by eQTL associations and 75% of these variants were localized to human kidney open chromatin regions (snATAC-seq) (Extended Data Fig. 8d). We found 559 prioritized genes that were significantly enriched for kidney cortex expression (hypergeometric test p = 1.3×10⁻¹²) (Fig. 6h and Extended Data Fig. 8e,f). These prioritized genes were significantly enriched for kidney function traits and biological processes related to metabolism (Supplementary Table 25,26). Furthermore, a large number (n=92) of prioritized genes can be targeted by drugs already approved by the FDA45 (Supplementary Table 27).
Identification of SLC47A1 as a kidney disease risk gene
Finally, we focused on the eGFRcrea GWAS locus on chromosome 17 where causal variants underlying kidney function and target gene SLC47A1 were prioritized by all 8 omics datasets and statistical models (Fig. 6e and Supplementary Table 24). The top prioritized variant rs2252281 showed significant association with kidney function (eGFRcrea GWAS p = 2.5×10−75), CpG methylation (cg15971010 meQTL p = 1.5×10−39) and SLC47A1 expression (eQTL p = 5.4×10⁻⁸), and colocalization among all these associations (moloc PPA.abc=0.98) (Fig. 7a–c). Summary Mendelian randomization showed that SLC47A1 expression mediated the genotype effect of kidney function by pleiotropy (Supplementary Table 18). Cg15971010 methylation negatively correlated with SLC47A1 expression which was validated in multiple datasets (Supplementary Fig. 11a). Furthermore, more severe kidney disease (higher fibrosis and worse kidney function) was associated with higher methylation of cg15971010 and lower expression of SLC47A1 (Supplementary Fig. 11b). The prioritized variants in this locus showed kidney-specific open chromatin, promoter (H3K4me3) and enhancer (H3K27ac and H3K4me1) marks, and lower methylation level in human and mouse kidneys (Supplementary Fig. 12,13). Slc47a1 expression was restricted to the proximal tubules in the mouse kidney single-cell RNA-seq data (Supplementary Fig. 13c).
Fig. 7. Identification of SLC47A1 as a kidney disease risk gene.
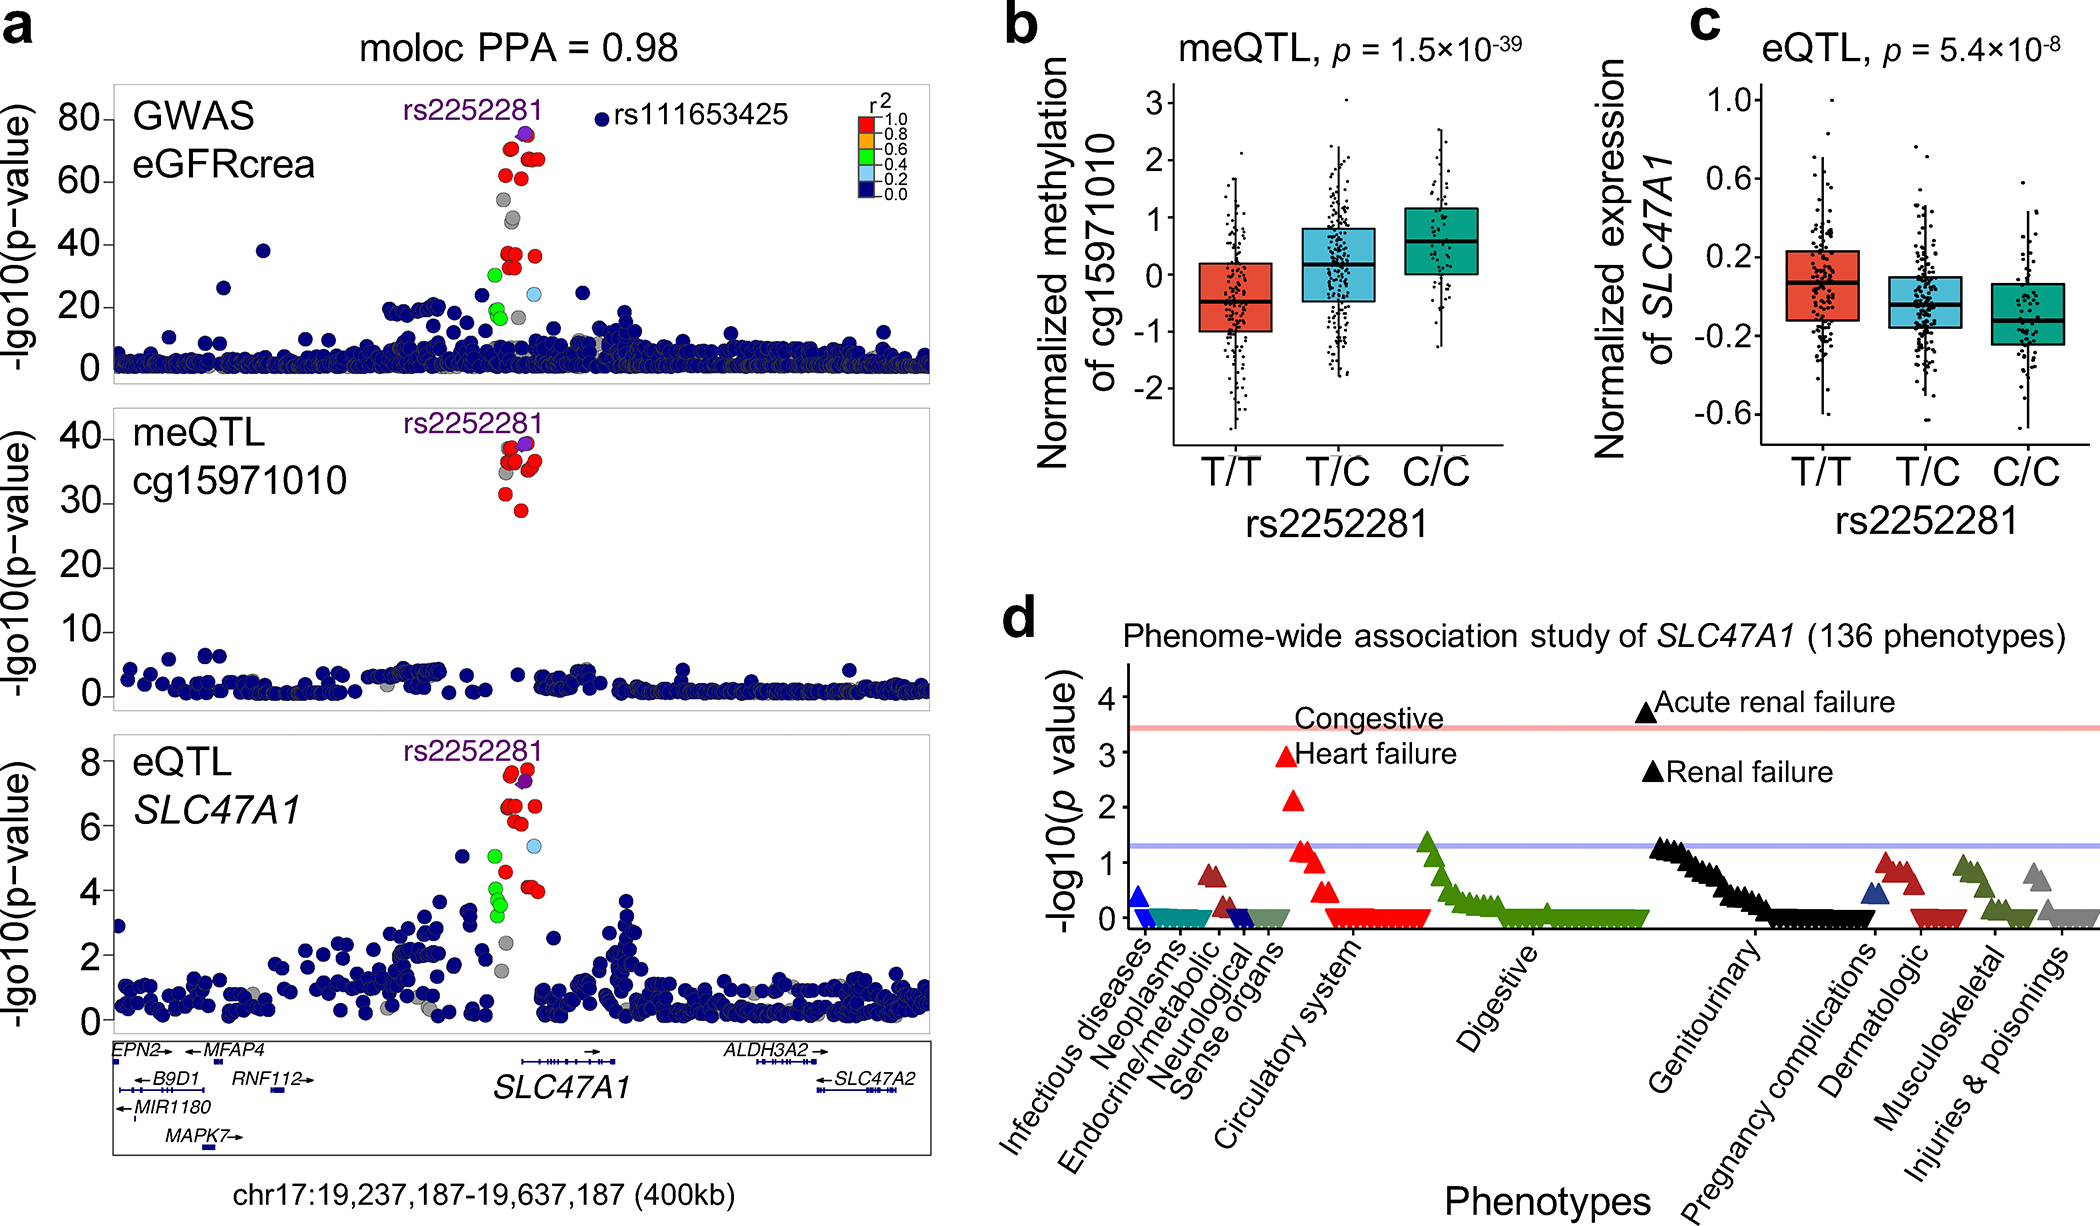
a. LocusZoom plots of GWAS (genotype and eGFRcrea association, n = 1,508,659), kidney CpG cg15971010 meQTL (genotype and cg15971010 methylation association, n = 443) and kidney SLC47A1 eQTLs (genotype and SLC47A1 expression association, n = 686). The y axis shows -log10(p) of association tests from GWAS, meQTL and eQTL. Highlighted variants are rs2252281 with top priority score and rs111653425 (a rare coding variant with MAF 1.1%) with top GWAS association.
b. Genotype (rs2252281, x-axis) and normalized CpG methylation (cg15971010, y-axis) association in human kidneys (n=443). Each dot represents a sample. Center lines show the medians; box limits indicate the 25th and 75th percentiles; whiskers extend to the 5th and 95th percentiles. p value was calculated by linear regression meQTL model.
c. Genotype (rs2252281 x-axis) and normalized gene expression (SLC47A1, y-axis) association in human kidney tubule samples (n=356). Each dot represents a sample. Center lines show the medians; box limits indicate the 25th and 75th percentiles; whiskers extend to the 5th and 95th percentiles. p value was calculated by eQTL meta-analysis in 686 samples.
d. Manhattan plot of phenome-wide association study of predicted loss-of-function (pLOF) variants in SLC47A1 in UKBB. The x-axis represents phenotypes ordered by p-value within each disease group and the y-axis the strength of association -log10(p) value calculated by linear regression PheWAS model. Blue line is p = 0.05 and red line is Bonferroni adjusted p = 0.05.
To define the causal role of SLC47A1 in kidney disease development, we performed a predicted loss-of-function (pLOF)-based gene burden phenome-wide association study (PheWAS) using phenotypes of 32,268 individuals with whole exome sequencing data in the UK Biobank. We found a significant association (Bonferroni adjusted p = 0.030) of acute renal failure in individuals with loss-of-function variants (Fig. 7d). Similar PheWAS in the BioMe Biobank showed enrichment for renal dialysis (p = 0.043) (Extended Data Fig. 9a). Furthermore, even a single variant rs111653425 (the local top variant of eGFRcrea GWAS, p = 1.0×10−79) PheWAS indicated significant associations with renal phenotypes including acute renal failure (p = 0.047 in UK Biobank) and renal dialysis (p = 0.0066 in BioMe Biobank) (Extended Data Fig. 9b,c).
Finally, we found significant negative correlations between SLC47A1 expression and expression of markers of kidney injury (LCN2), fibrosis (COL1A1, COL3A1, VIM and ACTA2), inflammation (CCL2, TNF and IL1B), macrophages (ADGRE1), and necroptosis (RIPK3, MLKL and NLRP3) (Supplementary Fig. 14). These results support the causal role of SLC47A1 in kidney disease development in patients.
Slc47a1 loss confers kidney disease risk in mice
Slc47a1 is a multi-drug extrusion protein, playing a key role in transporting a large number of drugs and toxins, therefore several prior studies suggested that the gene is a creatinine secretion marker rather a true kidney disease gene46–49. Our results, however, indicated consistent association with cystatin C-based kidney function measurements as well (rs111653425 with p = 5.3×10⁵ in eGFRcys GWAS) (Supplementary Fig. 15).
To further support the causal role of SLC47A1 in kidney disease development, we characterized Slc47a1-deficient mice. Global knockout Slc47a1 mice were phenotypically normal. We reasoned that Slc47a1 loss might alter injury response, especially following a toxic injury, and thus we modeled kidney injury in wild-type (WT) and Slc47a1−/− (KO) mice (Fig. 8a,b). To recapitulate chronic kidney disease and fibrosis, we injected mice with low dose cisplatin repeatedly and sacrificed animals 4 weeks later. We found that markers of kidney dysfunction, such as serum creatinine and BUN levels were significantly higher in Slc47a1−/− mice when compared with wild-type animals (p < 0.01) following repeated low dose cisplatin injection (Fig. 8c,d).
Fig. 8. Slc47a1 loss confers kidney disease risk in mice.
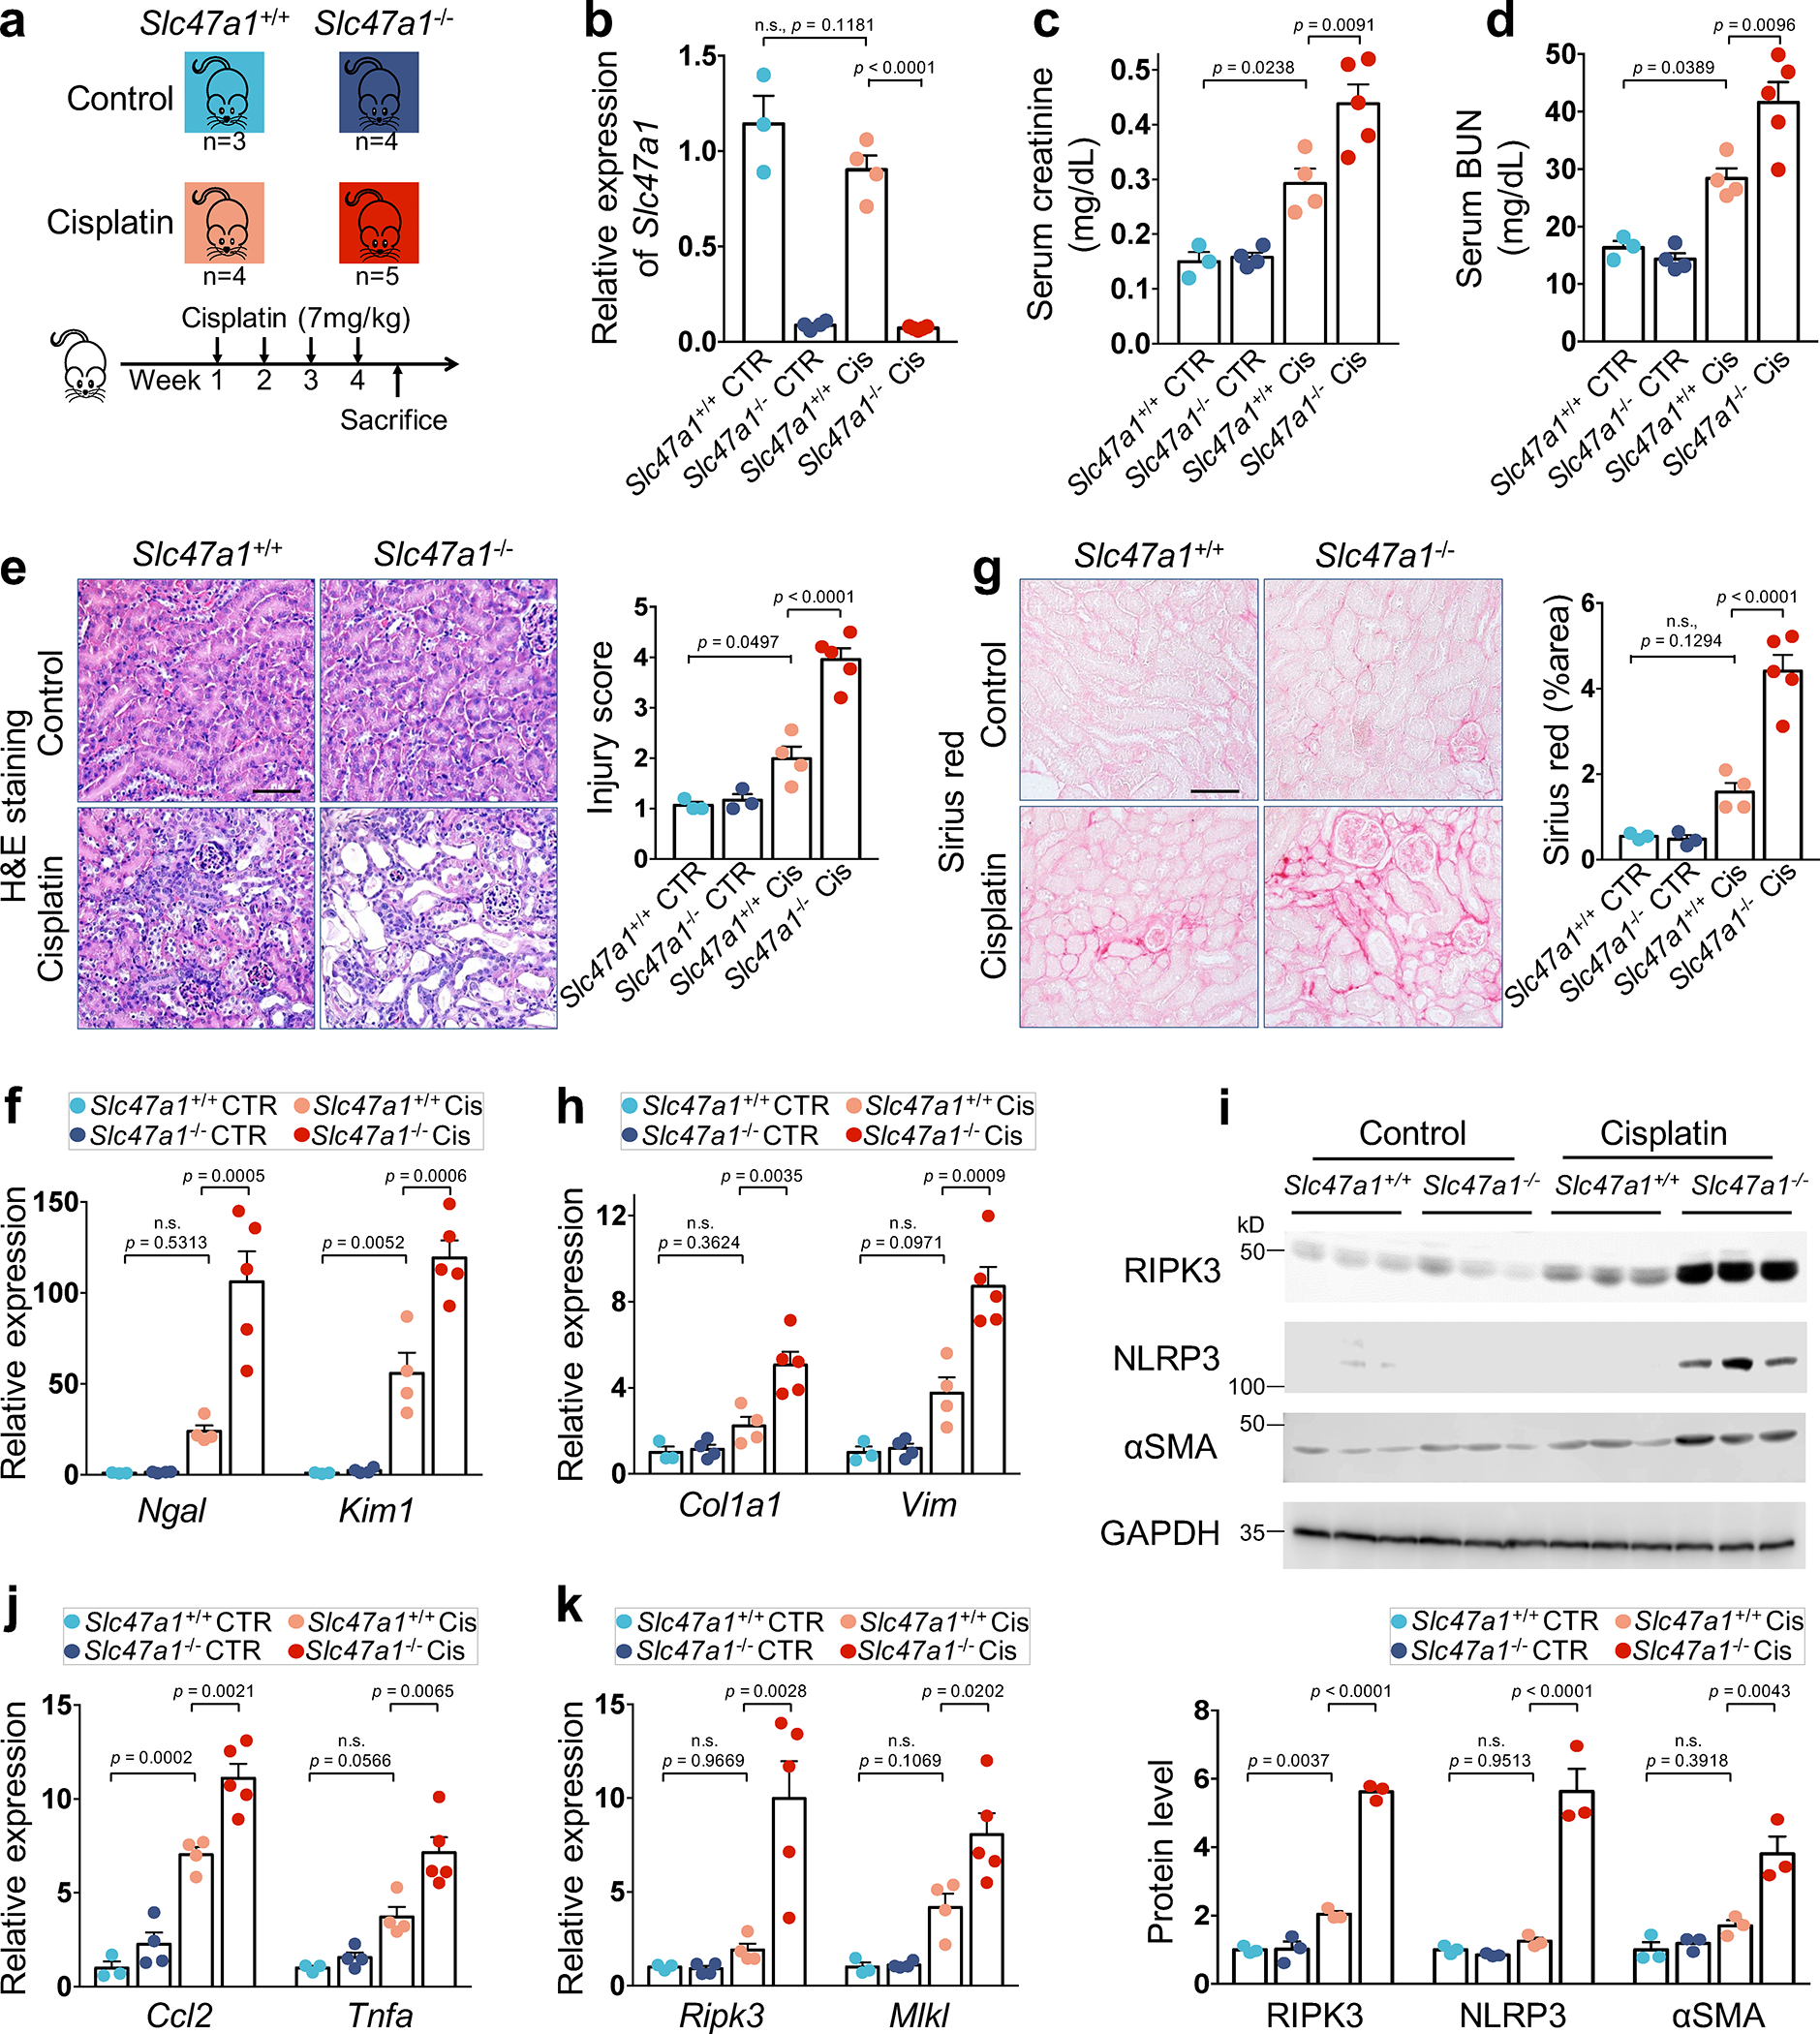
a. Experimental scheme of the cisplatin-induced kidney injury model in wild type (Slc47a1+/+) and Slc47a1 knockout (Slc47a1−/−) mice.
b. The relative expression of Slc47a1 (y-axis) in kidneys of Slc47a1+/+and Slc47a1−/− mice treated with cisplatin (Cis) or sham (CTR).
c. Serum creatinine levels (y-axis) in control or cisplatin treated Slc47a1+/+and Slc47a1−/− mice.
d. Serum BUN levels (y-axis) in control or cisplatin treated Slc47a1+/+and Slc47a1−/− mice.
e. Representative image (left panel) and quantification (right panel) of Hematoxylin and eosin (H&E) stained kidney sections of control or cisplatin treated Slc47a1+/+and Slc47a1−/− mice. Scale bars: 20μm.
f. The relative expression of injury markers Lipocalin 2 (Ngal) and kidney injury molecule 1 (Kim1) (y-axis) in kidneys of control or cisplatin treated Slc47a1+/+and Slc47a1−/− mice.
g. Representative image (left panel) and quantification (right panel) of Sirius red stained kidney sections of control or cisplatin treated Slc47a1+/+and Slc47a1−/− mice. Scale bar: 20μm.
h. The relative expression of fibrosis markers; Collagen 1 (Col1a1) and Vimentin (Vim) in kidneys of control or cisplatin treated Slc47a1+/+and Slc47a1−/− mice.
i. Representative western blot image (top panel) and quantification (bottom panel) of Receptor interacting serine/threonine kinase 3 (RIPK3), NLR family pyrin domain containing 3 (NLRP3), Actin alpha 2 (aSMA) in kidney of control or cisplatin treated Slc47a1+/+and Slc47a1−/− mice. GAPDH was used as a control.
j. Relative expression of markers of inflammation; Chemokine ligand 2 (Ccl2) and Tumor necrosis factor (Tnfa) in kidneys of control or cisplatin treated Slc47a1+/+and Slc47a1−/− mice.
k. Relative expression of cell death and inflammation marker genes; Receptor interacting serine/threonine kinase 1 (Ripk1), Ripk3 and Mixed lineage kinase domain like pseudokinase (Mlkl) in kidney from Slc47a1+/+and Slc47a1−/− mice treated with or without repeated cisplatin.
P values were calculated by one-way ANOVA with post hoc Tukey test (b-k, n=4 biologically independent Slc47a1+/+ cisplatin mice examined over n=3 independent Slc47a1+/+ control; n=5 biologically independent Slc47a1−/− cisplatin mice examined over n=4 independent Slc47a1+/+ cisplatin mice). n.s., not significant. Quantitative data are presented as mean ± SD.
Histological examination indicated increased hyaline casts, cytoplasmic vacuolization, loss of brush border and tubular lumen dilation in cisplatin-treated Slc47a1−/− mice (Fig. 8e). Tubule injury markers, for example, expression of Lipocalin-2 (Ngal) and kidney injury molecule 1 (Kim1) were markedly higher in cisplatin-treated Slc47a1−/− mice when compared to cisplatin-treated wild-type mice (Fig. 8f). We observed increased collagen accumulation by Sirius red staining and markedly higher pro-fibrotic gene expression (Col1a1, Col3a1, Col4a1, Fn1, Ctgf and Vim) and αSMA protein levels in cisplatin-treated Slc47a1−/− mice (Fig. 8g–i and Extended Data Fig. 10a). Expression of pro-inflammatory cytokines (Ccl2, Tnfa, Tnfsf12 and ll1b) and macrophage marker (F4/80, also known as Adgre1) were prominently increased in kidneys of cisplatin-treated Slc47a1−/− mice (Fig. 8j and Extended Data Fig. 10b).
To understand the pathomechanism of Slc47a1 loss-associated kidney disease development, we focused on necroptosis, a regulated cell death pathway playing an important role in acute kidney injury (AKI) to chronic kidney disease (CKD) progression50–52. Transcript levels of Ripk3 and Mlkl, were noticeably increased in kidneys of cisplatin-treated Slc47a1−/− mice when compared with cisplatin-treated wild-type mice (Fig. 8k). We further confirmed the increase in RIPK3 protein level in kidneys of cisplatin-treated Slc47a1−/− mice (Fig. 8i). We also observed a higher level of pyroptosis marker, NLRP3 (NOD-like receptor family pyrin domain-containing 3) in kidneys of cisplatin-treated Slc47a1−/− mice (Fig. 8i). These results suggest enhanced cisplatin-induced kidney injury in Slc47a1−/− mice, inducing inflammatory cell death pathways, cytokine secretion, and renal fibrosis.
Discussion
In this study, we provide a comprehensive analysis of genetic determinants of human kidney function. We generated genetic maps for eGFRcrea GWAS (n=1.5 million), human kidney eQTL (n=686), methylation quantitative trait loci (n=443) and human kidney single cell open chromatin and expression data. We identify more than 800 kidney function loci and prioritize disease-causing genes, cell types and regulatory circuits for 576 loci. We show that DNA methylation explains a higher portion of kidney disease heritability than gene expression12. We identify the critical convergence of kidney function-associated variants in kidney proximal tubules. Finally, we focus on the chromosome 17 locus and demonstrate that SLC47A1 is a kidney disease risk gene.
Recent studies, by estimating heritability mediated by expression, revealed that tissue eQTL information only explains a modest proportion (average 0.11) of GWAS trait heritability12,53. Consistently, we observed a similar proportion (average 0.10) of heritability of kidney function traits explained by non-kidney GTEx tissue eQTLs, and a higher proportion (average 0.20) of heritability mediated by kidney eQTLs (n=414 human kidney tissue samples). Recent studies reported splicing QTLs54 and mRNA N6-methyladenosine QTLs55 independently explained complex trait variation, but a smaller fraction than eQTLs8,55. Our analysis indicates that kidney meQTLs mediate a higher fraction (average 0.46) of heritability for kidney function traits using individual-level methylation profiles from the same human kidney samples (n=414), and underscores that new epigenetic datasets will be critical for GWAS functional follow-up studies.
Incorporating cell-type epigenome data such as human kidney single-nuclear ATAC-seq further improved causal cell type, target gene and variant identification. We observed a marked enrichment (averaging 6.7-fold) of heritability mediated by kidney methylation in proximal tubule-specific accessible regions for kidney function traits7,56,57. We also observed enrichment of heritability mediated by kidney methylation for blood pressure GWAS hits in the principal cells of the collecting tubule, consistent with our previous study11. This cell type plays key roles in sodium balance and blood pressure regulation.
Multiple factors can explain the more prominent role of tissue methylation and single cell epigenome variation mediating GWAS heritability compared to gene expression. Gene expression measures transcriptional output at a single time-point and condition. To reduce confounders in eQTL estimations, we often measure gene expression at baseline or at healthy state; however, genotype-driven differences in gene expression could become apparent in disease or stressed state, which would be missed by traditional eQTL analysis58. Our recent studies indicate that regulatory variants could play role in modulating gene expression changes during development (for example Uncx and Shroom3) and these genes could be silenced in adulthood59,60. The improved GWAS heritability mediation could also be explained by multiple factors, such as that the epigenome captures gene expression potentials, prior developmental trajectory and integrates effects from environmental variation.
Our data highlight the critical role of multi-staged omics for GWAS annotation. We show that our 8-pronged prioritization strategy has notably improved target variant, gene and cell type identification. It is important to mention that we found that the different omics datasets provided both complementary and confirmatory information for target prioritization; however it appears, that no single dataset and method can define the “ground truth”. Future studies should focus on integration and optimization of target identification strategies.
Finally, we show multiple lines of converging evidence indicating a causal role for SLC47A1 in kidney disease development. The association between kidney function traits and common non-coding variants in the SLC47A1 region has been identified in large eGFRcrea GWAS studies4,61. However, the exact causal variants and regulatory mechanisms involved at this locus remains unknown. In this study, we show a causal role of Slc47a1 in kidney disease development by analyzing the phenotypes of individuals with rare loss-of-function coding variants and Slc47a1 knock-out mice. SLC47A1 can transport creatinine, so the genetic variant can influence creatinine-based kidney function estimates. Here we show that SLC47A1 is also a kidney disease risk gene, most likely acting by influencing toxin uptake and secretion of tubule epithelial cells.
Overall, we report, a comprehensive analysis of the genetic determinant of human kidney function and show the key role of epigenetic changes mediating phenotype development. Our extensive post-GWAS annotation provide new biological insight into 576 GWAS identified loci. We highlight the key contribution of proximal tubules, metabolism and cell death pathways in kidney function. We define the role of SLC47A1 in kidney disease development and uncover potential new therapeutics for the treatment of kidney disease.
Methods
Sample procurement
Deidentified human kidney tissue collection was approved by the institutional review board (IRB) of the University of Pennsylvania. The study was deemed IRB exempt (exemption IV), as no identifiable private information was collected. Kidney samples were obtained from the non-neoplastic portion of surgical nephrectomies via the Cooperative Human Tissue Network. Laboratory and demographic and clinical information including age, sex, self-reported ethnicity, diabetes and hypertension status was collected from medical records by an honest broker (Supplementary Table 7). eGFRcrea values were calculated using the CKD Epidemiology Collaboration equation62. Histopathologic descriptor measurements including tubulointerstitial fibrosis were scored by a specialized renal pathologist using Periodic Acid-Schiff stained slides. DNA was isolated by the Qiagen DNAeasy or MagAttract High Molecular Weight DNA Kits (Qiagen No. 67563), according to the manufacturer’s instructions. DNA was quantified by the Invitrogen Quant-iT PicoGreen dsDNA Assay Kit (Invitrogen No. P11496).
Data generation
Genotype data. Genomic DNA isolated from kidney samples was used for genotyping. After quality control using PLINK (v1.9)63, genotypes were phased with SHAPEIT2 (v2.17)64 and imputed by IMPUTE2 (v2.3.2)65,66 (See Supplementary Table 8 and Supplementary Note).
DNA methylation data.
DNA methylation at over 850,000 methylation sites was measured in 506 kidney samples using Infinium Methylation EPIC BeadChip. SeSAMe (v1.5.3)67 was used for pre-processing and quality control steps, resulting 701,519 CpG sites (see Supplementary Table 9 and Supplementary Note).
Gene expression data.
RNA was isolated using RNeasy mini kit (Qiagen No. 74106) from tubular compartment and profiled by RNA-Seq. Reads were aligned to the human genome (hg19) using STAR (v2.4.1d)68, and expression was quantified by RSEM (v1.3.1)69 (See Supplementary Note).
Human kidney single nucleus ATAC seq (snATAC-seq).
Six fresh human kidneys were collected for single nucleus ATAC-seq. Reads were aligned to human genome (hg19) with SnapATAC (v2.0)70. After quality control and peak calling, 12 clusters (57,229 cells) were annotated using a published list of cell-type marker genes56, and cell type-specific differentially accessible regions (DARs) were identified for each cell type (See Supplementary Table 15 and Supplementary Note).
eGFRcrea GWAS meta-analysis
To identify genetic variants associated with kidney disease, we performed a meta-analysis of eGFRcrea GWAS based on the summary statistics obtained from five non-overlapping multi-ancestry studies from CKDGen, Pan-UK Biobank, MVP, PAGE, and SUMMIT consortium4,5,20,21 (see detailed information in Supplementary Table 1). For each GWAS dataset, low frequency variants with a minor allele frequency (MAF) of <0.1% were filtered out. Five GWAS results were pooled via sample size-weighted meta-analysis of z scores (Stouffer’s method71) implemented by METAL (version 2011–03-25)22, to allow for differences in eGFRcrea estimation and scaling72, with genomic control correction for each input study (genomic control score 1.322 for CKDGen, 1.438 for UKBB, 1.186 for MVP, 1.082 for PAGE and 1.047 for SUMMIT, respectively) and assessment of between-study heterogeneity with the Cochran’s Q-test and I2 statistic. After meta-analysis of 32,220,823 variants, 12,653,888 variants available in at least two studies and at least for 500,000 individuals were retained. We filtered out 84 unplaced and non-autosomal variants. Finally, our meta-analysis resulted in a comprehensive eGFRcrea GWAS of 12,653,804 variants with a sample size of 1,508,659 cross-ancestry individuals (~80% are of European ancestry, Supplementary Table 1). For the summary statistics of meta-analysis, we confirmed that the A1 and A2 alleles are matched with the alternate alleles and reference alleles based on the annotation of dbSNP (release version 151) and they were corrected if they were unmatched to make sure the effect was always reported to the alternate allele23. Effect sizes were estimated from the z statistics of the meta-analysis following a method proposed by Zhu et al.73, and then compared with effect sizes of each source GWAS summary statistics (Extended Data Fig. 1b).
Next, we defined variants associated with eGFRcrea by genome wide significance level (p < 5×10⁻⁸). Specifically, variants with between-study heterogeneity (Cochran’s Q-test HetISq > 50 or I2 statistic HetPVal < 0.05) were selected as significant variants only when they passed genome-wide significance level (p < 5×10⁻⁸) in the meta-analysis and at least one original study. In total, we identified 90,950 genome-wide significant variants associated with eGFRcrea, including 8,877 variants at the major histocompatibility complex (MHC) region. For validation, we obtained GWAS data for eGFR based on cystatin C (eGFRcys) of 421,714 individuals from Pan-UK Biobank and blood urea nitrogen (BUN) of 852,678 individuals from CKDGen Consortium24. For each eGFRcrea-associated variant, its relevance to kidney function was treated as “validated” if it showed nominally significant (p < 0.05) association with eGFRcys in the same effect direction or nominally significant (p < 0.05) association with BUN in the opposite effect direction (Extended Data Fig. 1c–e). The enrichment analysis of variants associated with eGFRcrea in different kidney cell types was performed by comparing the number of significant variants and non-significant variants overlapped with DARs identified in given cell type and those in other cell types.
Independent loci were defined for 82,073 non-MHC variants using the following method. First, we clumped (r2 > 0.1) the significant variants following clump command “plink1.9 --bfile <1000G Phase 3 European file> --clump <summary statistics of 82,073 significant variants> --clump-p1 5e-8 --clump-p2 5e-8 --clump-r2 0.1 --clump-kb 10000”23,63, resulting in 1,687 leading variants. The 1000 genome Phase 3 (European ancestry, n = 503) was used as reference panel for clumping because most (80%) individuals in meta-analysis GWAS were of European ancestry. To avoid calling multiple associations for very large signals, lead variants within 0.1cM of each other (derived from 1,000 Genomes phase 3 European samples, n = 503) were merged. The MHC region was treated as a single locus. Finally, we identified 878 independent loci (Supplementary Table 2). For each locus, the variant with the minimum p value was chosen to find the closest coding gene based on distance from variant to gene transcription start site.
To identify novel loci, we first collected the leading SNPs reported by six published GWAS studies4,5,20,21,23,24. Independent loci by meta-analysis were defined as novel if they fulfilled all following criteria: 1) did not pass genome-wide cutoff p < 5×10⁻⁸ in any previous study, 2) 500Kb away from any of previously reported sentinel variants tagging independent loci and 3) LD r2 < 0.001 with any of previously reported sentinel variants tagging independent loci (Extended Data Fig. 2a,b). Functional annotation for novel loci was performed using Genomic Regions Enrichment of Annotations Tool (GREAT v4.0.4)74, counting the variants validated by eGFRcys and/or BUN, literature search and single cell expression analysis (Extended Data Fig. 2c–g).
Cis-eQTL meta-analysis
To obtain a comprehensive cis-eQTL map, we performed a meta-analysis based on the eQTL summary statistics obtained from four non-overlapping studies8–11 (Supplementary Table 3), and identified 10,430 eGenes and 1,222,250 significant SNP-gene pairs (Supplementary Table 4). Novel eGenes were determined if they were not included in any of eGene lists in six reference studies7–11,30 (See Supplementary Note).
Cis-meQTL association analysis
We conducted cis-meQTL (referred to as meQTL) association analysis using 443 samples with imputed genotyping data of 5,736,252 SNPs and methylation data of 701,503 CpGs (See Supplementary Note). Missing values in methylation data were imputed based on nearest neighbor averaging implemented by R package impute (v1.64.0). Beta values of each CpG were transformed by inverse-normal transformation (INT)75. For each SNP-CpG pair within a cis window of ±1Mb from the queried CpG site, the association between INT transformed methylation and genotype dosage was quantified using MatrixQTL (v2.1.0) R package76 using an additive linear model. This model was fitted with covariates including general variables (sample collection site, age, sex, top five genotype PCs, degree of bisulfite conversion, sample plate, and sentrix position) and 35 PEER factors77 (See Supplementary Note).
The significance of the top associated variants per CpG was estimated by adaptive permutation in FastQTL78 using the covariates above and the setting “--permute 1000”. Beta distribution-adjusted empirical p-values from FastQTL were used to calculate q-values using Storey’s q method79, and a false discovery rate (FDR) threshold of < 0.01 was applied to identify CpGs with a significant meQTL (referred as mCpG). Then, a genome-wide nominal p threshold was defined as the empirical p of the CpG closest to the 0.01 FDR threshold, was further used to calculate a nominal p threshold for each CpG based on the beta distribution model (from FastQTL) of the minimum p distribution obtained from the permutations for the CpG site. For each mCpG, the variants with a nominal p below the cutoff was defined as significant SNPs. Totally, we identified 139,313 mCpGs and 13,771,378 significant SNP-mCpG pairs (Supplementary Table 10,11). For validation, meQTL effect sizes were compared to a recently published (smaller) meQTL dataset (using 195 kidney samples and total 374,826 CpGs) 30 (Supplementary Fig. 6). Further, kidney-specific meQTLs were identified and analyzed by comparing meQTLs from whole blood (n = 473)33 and skeletal muscle samples (n = 265)19, using METASOFT (v2.0.1)80 (See Supplementary Note).
Cis-eQTM associations mapping and analysis
To identify associations between methylation of CpG sites and expression of genes within a ±1Mb window of the queried gene TSS, expression quantitative trait methylation (eQTM) analysis was performed using a linear regression model implemented in 414 human kidney samples using the MatrixeQTL R package76 (See Supplementary Note).
GWAS heritability mediated by methylation and expression
To estimate kidney disease heritability mediated by CpG methylation levels and gene expression levels, we applied mediated expression score regression (MESC)12 for individual-level genotypes, methylation, and expression data of 414 human kidney samples (78.0% are of European ancestry) with all three datasets. In this study, MESC was used to estimate methylation-mediated heritability () for each of 34 GWAS traits (including six kidney function traits, Supplementary Table 14) by regressing GWAS summary statistics on kidney cis-meQTL effect summed across all CpGs. In brief, the meQTL effect sizes for each CpG was estimated using individual-level genotypes and methylation data, with covariates (general variables and PEER factors used in meQTL mapping above), and then multiplied by the element-wise squared LD matrix to obtain methylation scores. LD matrix was estimated using 503 European ancestry samples from the 1000 genome Phase 3, as most (78%) kidneys samples used in this analysis are of European ancestry. Methylation scores were further used to estimate methylation-mediated heritability based on GWAS summary statistics for each of 34 GWAS traits. The proportion of heritability mediated by methylation was defined as , where is the GWAS trait heritability estimated by stratified LD-score regression. For all quantities, standard errors and P values were estimated by jack-knifing over blocks of SNPs. Similarly, expression scores were estimated based on individual-level genotypes and expression data, and then used to estimate expression-mediated heritability () and proportion of heritability mediated by kidney expression ()for each trait. To validate these findings, we performed heritability analysis in 323 samples of European-ancestry, and different number of samples randomly selected from the 414 kidneys used above (See Supplementary Note).
To perform a comprehensive comparison, MESC was applied to estimate heritability mediated by non-kidney tissue expression for 34 GWAS traits, using expression scores computed for 48 non-kidney GTEx v8 tissues by Yao et al.12. For each GWAS trait, the best non-kidney tissue resulting in the highest estimates of among non-kidney GTEx tissues was identified to compare with kidney eQTL. Further, we also estimated eGFRcrea heritability mediated by blood meQTLs by applying MESC on individual-level genotypes and whole blood methylation data (n = 473), with covariates (including age, batch effect, top 10 PCs of genetic background, hypertension, and whole-blood cell subtype proportions, and 20 PEER factors33).
Single cell co-accessibility
To explore the regulatory function of distal open chromatin areas, we applied Cicero (version 1.0.15)41 to predict cis-regulatory interactions by examining the co-accessibility of snATAC peaks. We used function make_cicero_cds in Cicero package to aggregated cells based on 50 nearest neighbors and then calculated co-accessibility scores with a window size 500kb and distance constraint 250kb. Cicero connections between two peaks were determined by co-accessibility score > 0.2. To prioritize target genes of eGFRcrea GWAS variants, we extracted protein-coding genes within 1Mb from significant eGFRcrea variants and defined their promoters as regions ±2000bp from the transcription start sites of protein-coding transcripts (GENCODE v35lift37)81. For each eGFRcrea GWAS variant, potential target genes were identified by co-accessibility connections with one end covering variant and another end overlapping with gene promoters. Finally, target gene was defined for each variant as the gene with the highest co-accessibility score if multiple potential target genes were available for the same variant.
Bayesian colocalization analysis
We performed Bayesian colocalization analysis to identify the variants where the genotype effect on kidney function, methylation and gene expression were shared. Bayesian colocalization analysis was implemented using R package coloc (v5.1.0)82 and moloc (v0.1.0)83 to estimate posterior probability that a eGFR GWAS variant is associated with three traits (GWAS and meQTL and eQTL). Posterior probability > 0.8 was considered evidence of colocalization (See Supplementary Note).
Summary-data-based Mendelian Randomization
We performed summary-data-based mendelian randomization (SMR) analysis in three configurations, eGFRcrea GWAS and kidney meQTL, eGFRcrea GWAS and kidney eQTL, kidney meQTL and kidney eQTL, using package SMR (v1.03)43,73, and used heterogeneity in dependent instruments (HEIDI) to distinguish pleiotropy from linkage (See Supplementary Note).
Prioritization of disease genes for GWAS loci
To prioritize target genes for kidney function GWAS loci, we developed a priority scoring strategy by integrating evidence from eight different datasets: (1) significant SNP~gene associations by kidney eQTL (FDR < 0.05); (2) significant SNP~CpG~gene associations by kidney meQTL (FDR < 0.05) and eQTM (CpG level FDR <0.05); (3) SNP~gene pairs by coloc analysis between eGFRcrea GWAS and eQTL (H4 > 0.8); (4) SNP~gene pairs by moloc analysis among eGFRcrea GWAS, eQTL and meQTL (PPA.abc > 0.8); (5) significant SNP~gene pairs by mendelian randomization analysis between eGFRcrea GWAS and eQTL (PSMR < 1.38×10⁻⁴); (6) SNP~gene pairs passing HEIDI test between eGFRcrea GWAS and eQTL (PHEIDI > 0.01); (7) co-accessibility (Cicero connections) identified using 57,229 snATAC-seq cells (co-accessibility score > 0.2); and (8) Enhancer-promoter contacts identified by Activity-by-Contact (ABC) Model which predicts enhancers regulating genes based on estimating enhancer activity and enhancer-promoter contact frequency from epigenomic datasets (ABC scores >= 0.015). Promoters were defined as ±2000bp from the TSS of protein-coding transcripts from GENCODE v35lift3781 to annotate Cicero connections or ABC connections between gene promoters and eGFRcrea GWAS variants.
For each significant eGFRcrea GWAS variant, we extracted protein-coding genes within 1Mb from the SNP as potential targets. For each SNP~gene pair, we defined a priority score by counting the number of datasets supporting the association. For each variant, the gene with highest priority score was assigned as its target gene. If multiple genes shared the highest priority score, the closest gene with most significant eQTL was assigned as target gene. For each independent locus, the top target gene was determined according to highest priority score from all variant gene pairs in the same locus. If multiple genes shared the highest priority score, the gene targeted by the variant with the most significant GWAS association was assigned as the top target gene for the locus. Newly prioritized loci were defined if they did not overlap with 309 independent signals (using gene PrioritiSation score ≥ 1) prioritized in eGFRcrea GWAS by Stanzick et al.24 or 53 creatinine-associated exome rare variants identified in exome association studies by Backman et al.25 or Barton eta al.26.
Further, we focused on 328 GWAS loci with 559 target genes with a priority score at least 3. First, we inspected 110 loci with two or more target genes by counting the number of independent signals (fine-mapped in 1 million European ancestry individuals24) and co-expression gene pairs (FDR < 0.05 accounting for all correlation tests) for each locus. To explore the function of prioritized genes, we performed gene set enrichment for tissue specificity and GWAS catalog genes using GENE2FUNC of FUMA84 with protein coding genes as background gene-set. Functional enrichment analysis for these genes was performed using DAVID Bioinformatics Resources (v6.8)85. For enrichment to the cell type-specific genes, we obtained their mouse orthologs and overlapped with cell type-specific expressed genes identified using mouse scRNA-seq56. The cell type enrichment significance was determined using a hypergeometric test.
Phenome-wide association study of SLC47A1
To explore the association of a burden of rare loss-of-function variants of SLC47A1 with disease phenotypes, we performed rare predicted loss-of-function (pLOF)-based gene burden phenome-wide association (PheWAS) using whole exome sequencing data of 32,268 European ancestry individuals for the UK Biobank (UKBB)86. Rare predicted pLOF-based gene burden of SLC47A1 was defined as frameshift insertions/deletions, gain/loss of stop codon, or disruption of canonical splice site dinucleotides87. Phenotypes for each individual were determined by mapping ICD-10 codes to Phecodes via Phecode Map 1.2b1 using the R package PheWAS (https://phewascatalog.org/phecodes_icd10)88. Individuals were determined as phenotypic cases for a certain disease phenotype if they had at least two encounters for the corresponding Phecode diagnosis, while phenotypic controls consisted of individuals who never had the Phecode as well as those under Phecode exclusion criteria. Control group for acute renal failure, for instance, excluded acute renal failure, renal failure, chronic renal failure and several other related diseases of kidney and ureters (Phecodes ranging from 580 to 590.99). To avoid uncertainties due to low case numbers, 136 phenotypes with at least 300 cases were included for the PheWAS analysis. Association between each disease phenotype and gene burden of SLC47A1 was calculated using a logistic regression model adjusted for sex, age, and the first 10 principal components of genetic ancestry using the R package PheWAS88. As independent validation, we also performed PheWAS analysis for pLOF-based gene burden of SLC47A1 in 24,016 individuals in the BioMe Biobank, and for a single missense variant (rs111653425) of SLC47A1 in the UKBB and BioMe datasets (See Supplementary Note).
Mouse studies
Slc47a1 knock out mice was generated by the Yan Shu lab at the University of Maryland Baltimore89. All experimental protocols were approved by the Institutional Animal Care and Use Committee (IACUC) of the School of Pharmacy, University of Maryland Baltimore. All procedures were carried out in accordance with NIH guidelines for animal experimentation (See Supplementary Note).
Extended Data
Extended_Data_Fig 1. Meta-analysis of eGFRcrea GWAS and validation using eGFRcys and BUN GWAS.
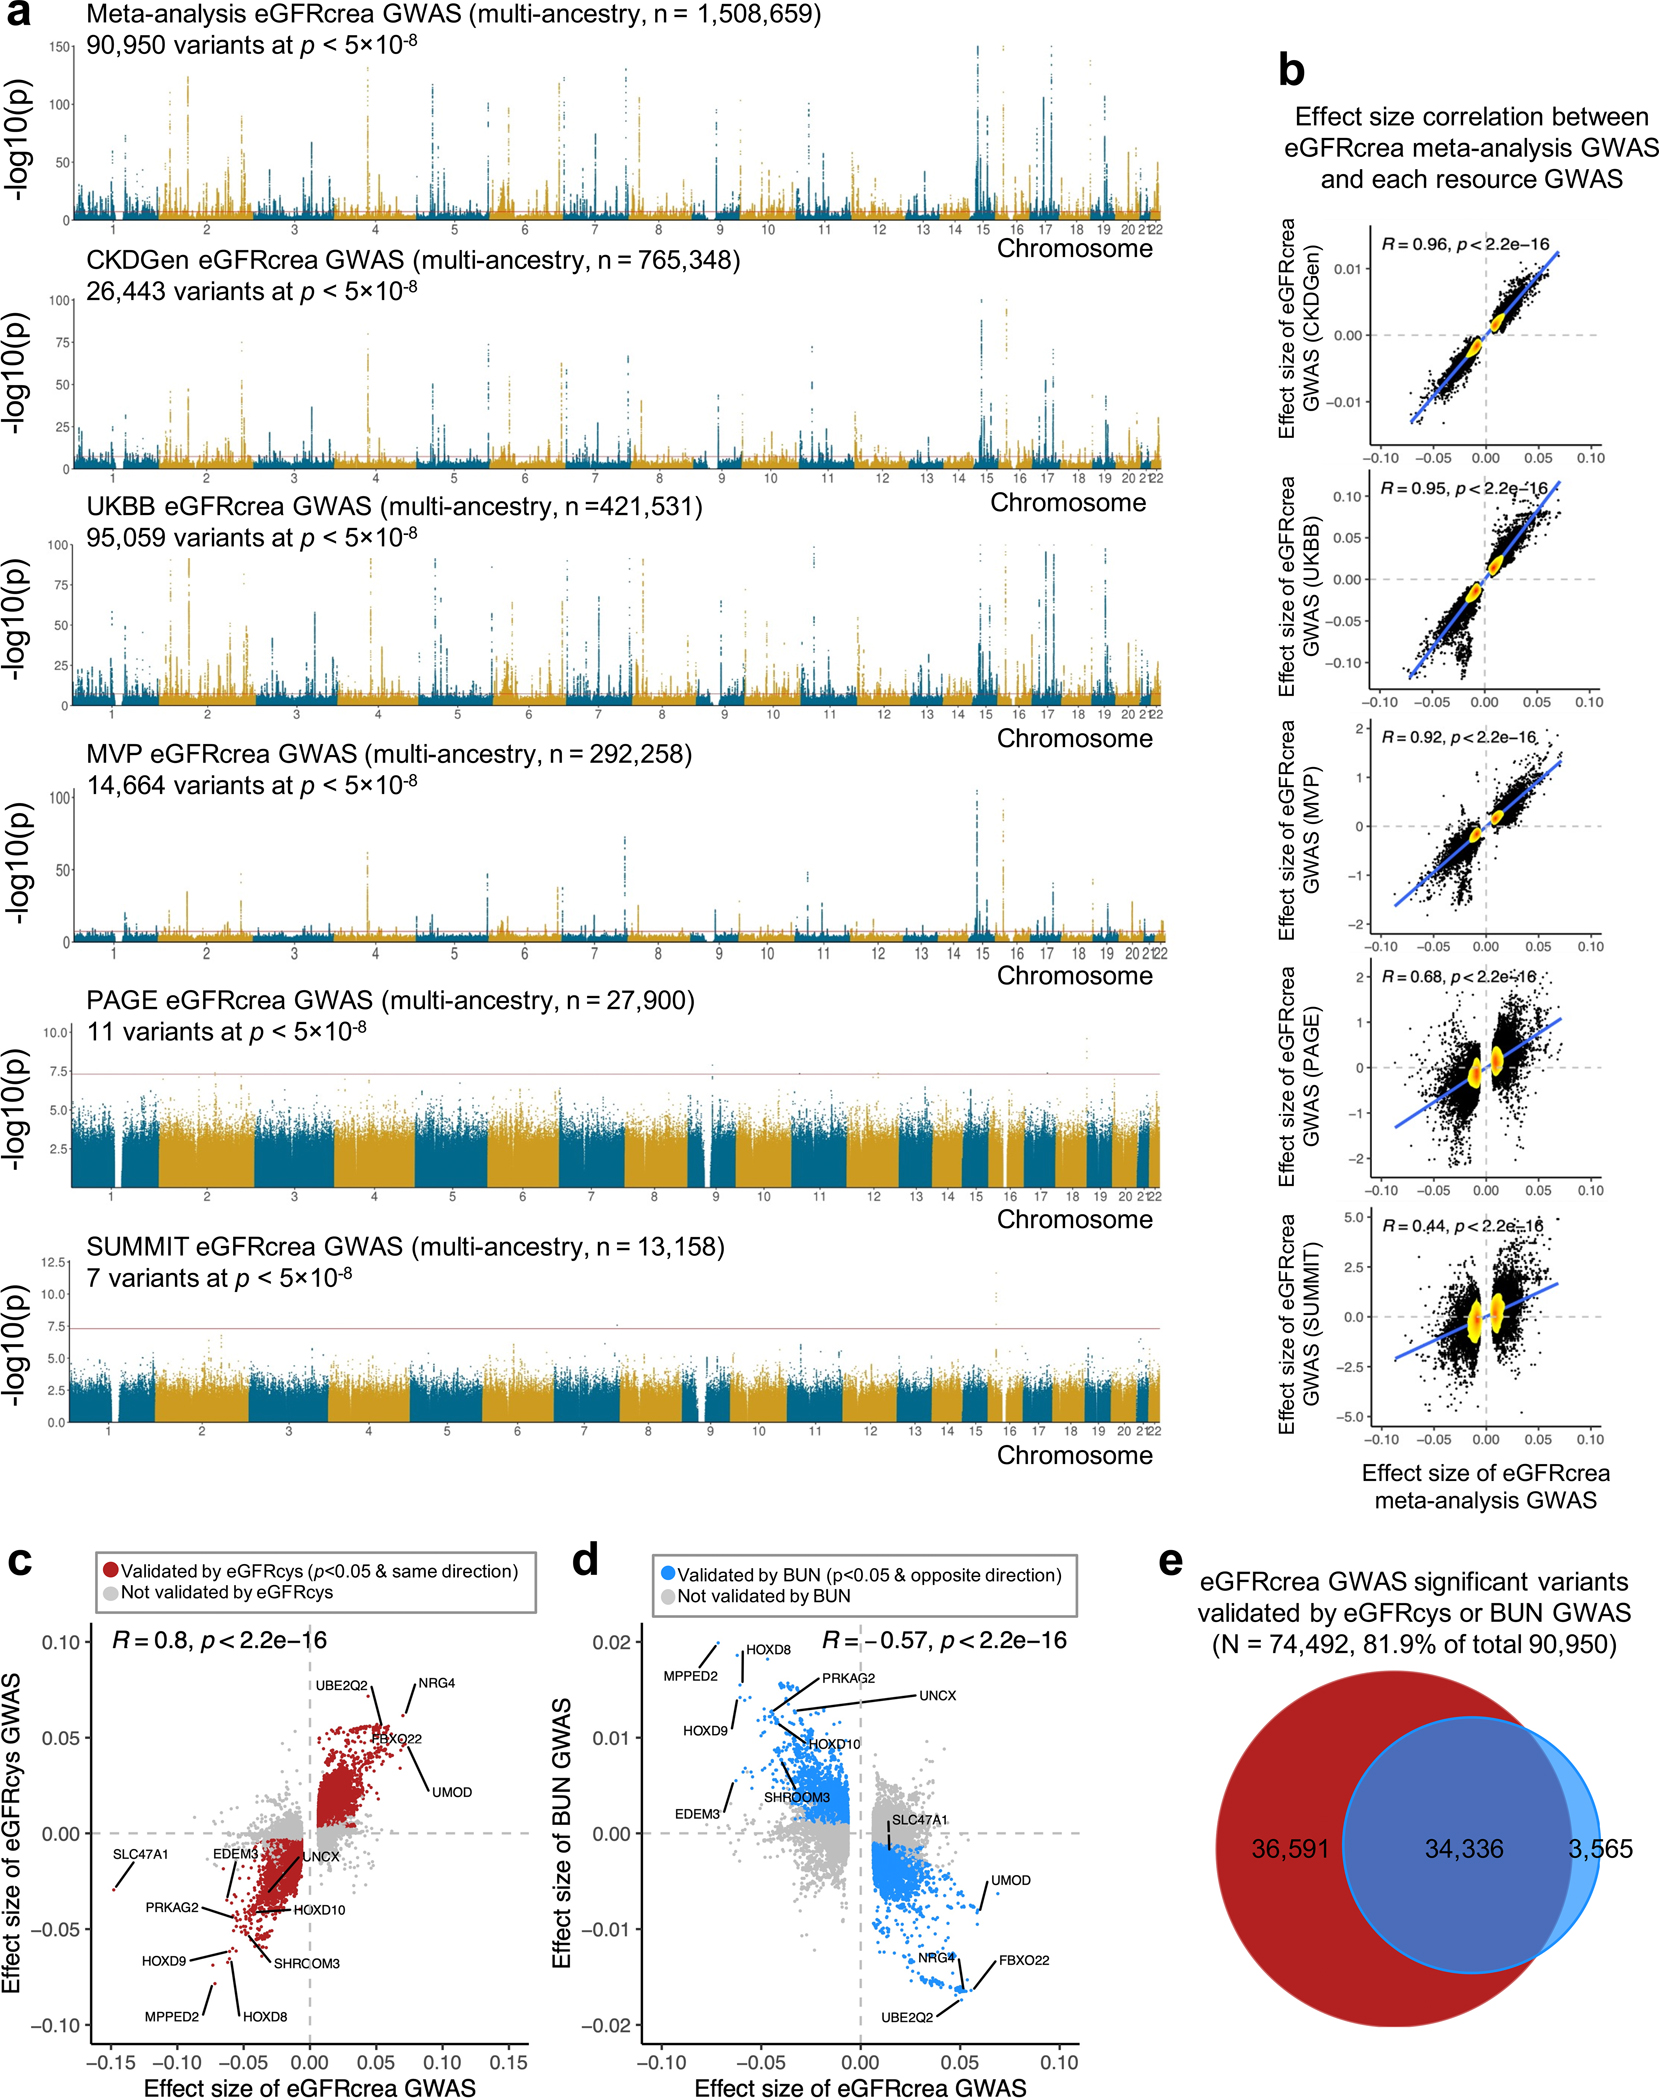
a. Manhattan plots of meta-analysis eGFRcrea GWAS (N=1,508,659 individuals) and eGFRcrea GWAS datasets including CKDGen, UKBB, MVP, PAGE and SUMMIT. For each panel, the x-axis is chromosomal location of SNP. The y-axis strength of association -log10(p). The two-sided p value was obtained from GWAS studies.
b. Scatter plot of effect size correlation between meta-analysis eGFRcrea GWAS (x-axis) and five source eGFRcrea GWAS data from CKDGen, UKBB, MVP, PAGE and SUMMIT (y-axis). The density of dots from low to high are shown from yellow to red. Correlation coefficient was calculated using Spearman's rho (R) statistic and two-sided p value was calculated using asymptotic t approximation.
c. Scatter plot of effect sizes between eGFRcrea GWAS (N=1,508,659 individuals) and eGFRcys GWAS (N=421,714 individuals). Significant eGFRcrea GWAS variants passing two-sided p < 5×10⁻⁸ in this study were used for the plot. Red dots represent validated variants showing nominally significant (two-sided GWAS p < 0.05) association with eGFRcys in the same effect direction. Correlation coefficient was calculated using Spearman's rho (R) statistic and two-sided p value was calculated using asymptotic t approximation.
d. Scatter plot of effect sizes between eGFRcrea GWAS (N=1,508,659 individuals) and BUN GWAS (N=852,678 individuals). Significant eGFRcrea GWAS variants passing two-sided p < 5×10⁻⁸ in this study were used for plot. Blue dots represent validated variants showing nominally significant (two-sided GWAS p < 0.05) association with BUN in the opposite effect direction. Correlation coefficient was calculated using Spearman's rho (R) statistic and two-sided p value was calculated using asymptotic t approximation.
e. Venn plot of eGFRcrea GWAS significant variants validated by eGFRcys GWAS or BUN GWAS. Y-axis is strength of GWAS association -log10(p value based of z statistic).
Extended_Data_Fig2. Identification and function annotation of independent eGFRcrea GWAS loci.
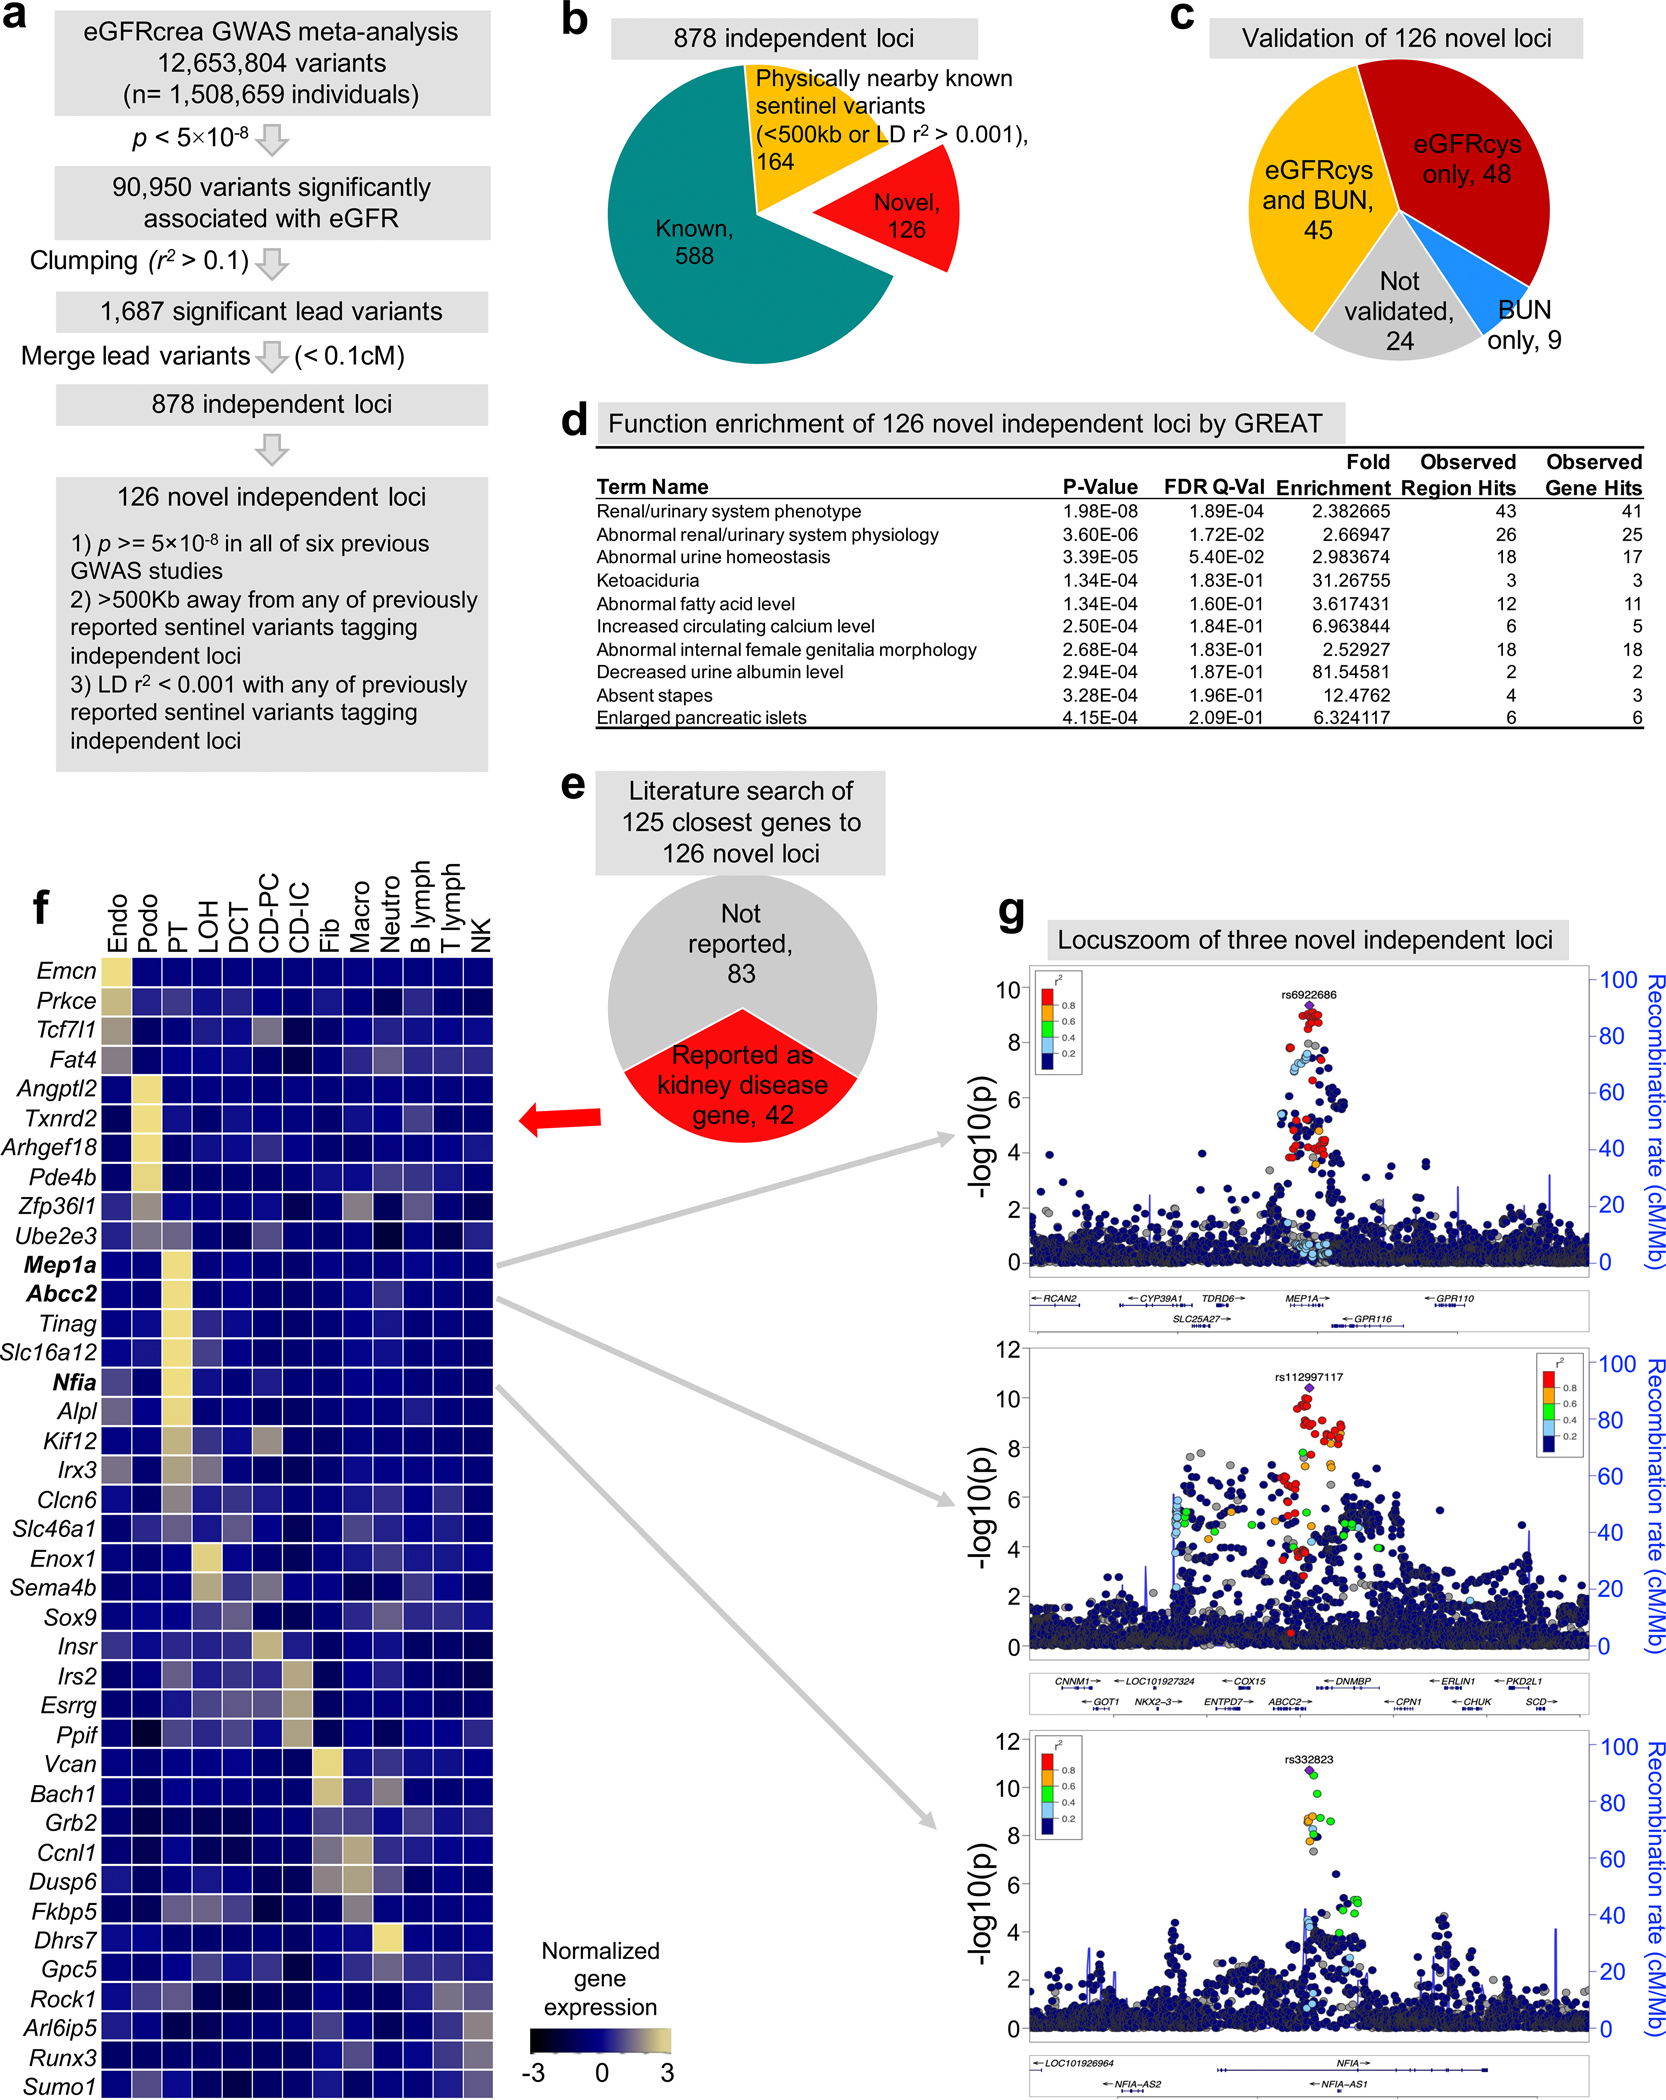
a. The strategy to identify independent loci and novel eGFRcrea GWAS loci.
b. Pie chart of the number of independent loci categorized into different groups by comparing previously reported sentinel variants tagging independent loci.
c. Pie chart of the number of novel independent loci validated by eGFRcys GWAS and/or BUN GWAS.
d. Functional enrichment analysis of 126 novel independent loci annotated by GREAT. The positions of lead SNPs were inputted into GREAT (http://great.stanford.edu/public/html/), and the two nearest genes within 1Mb were used for function enrichment in mouse phenotype catalogue. The two-sided uncorrected p-value was calculated by binomial test over inputted loci, and false discovery rate q-value was calculated for multiple test correction.
e. Literature-based gene function of the closest genes to the 126 novel kidney disease loci.
f. Expression of the mouse orthologues of 42 kidney disease genes (of the 126 newly identified GWAS genes) in adult mouse kidney samples (GSE107585). The mean expression was calculated for each cell types and z-scores were plotted.
g. LocusZoom view of three novel independent loci, MEP1A, ABCC2 and NFIA. Y-axis is strength of association -log10(two-sided p value from GWAS meta-analysis z-statistic).
Extended_Data_Fig3. Meta-analysis of the kidney cis-eQTL data.
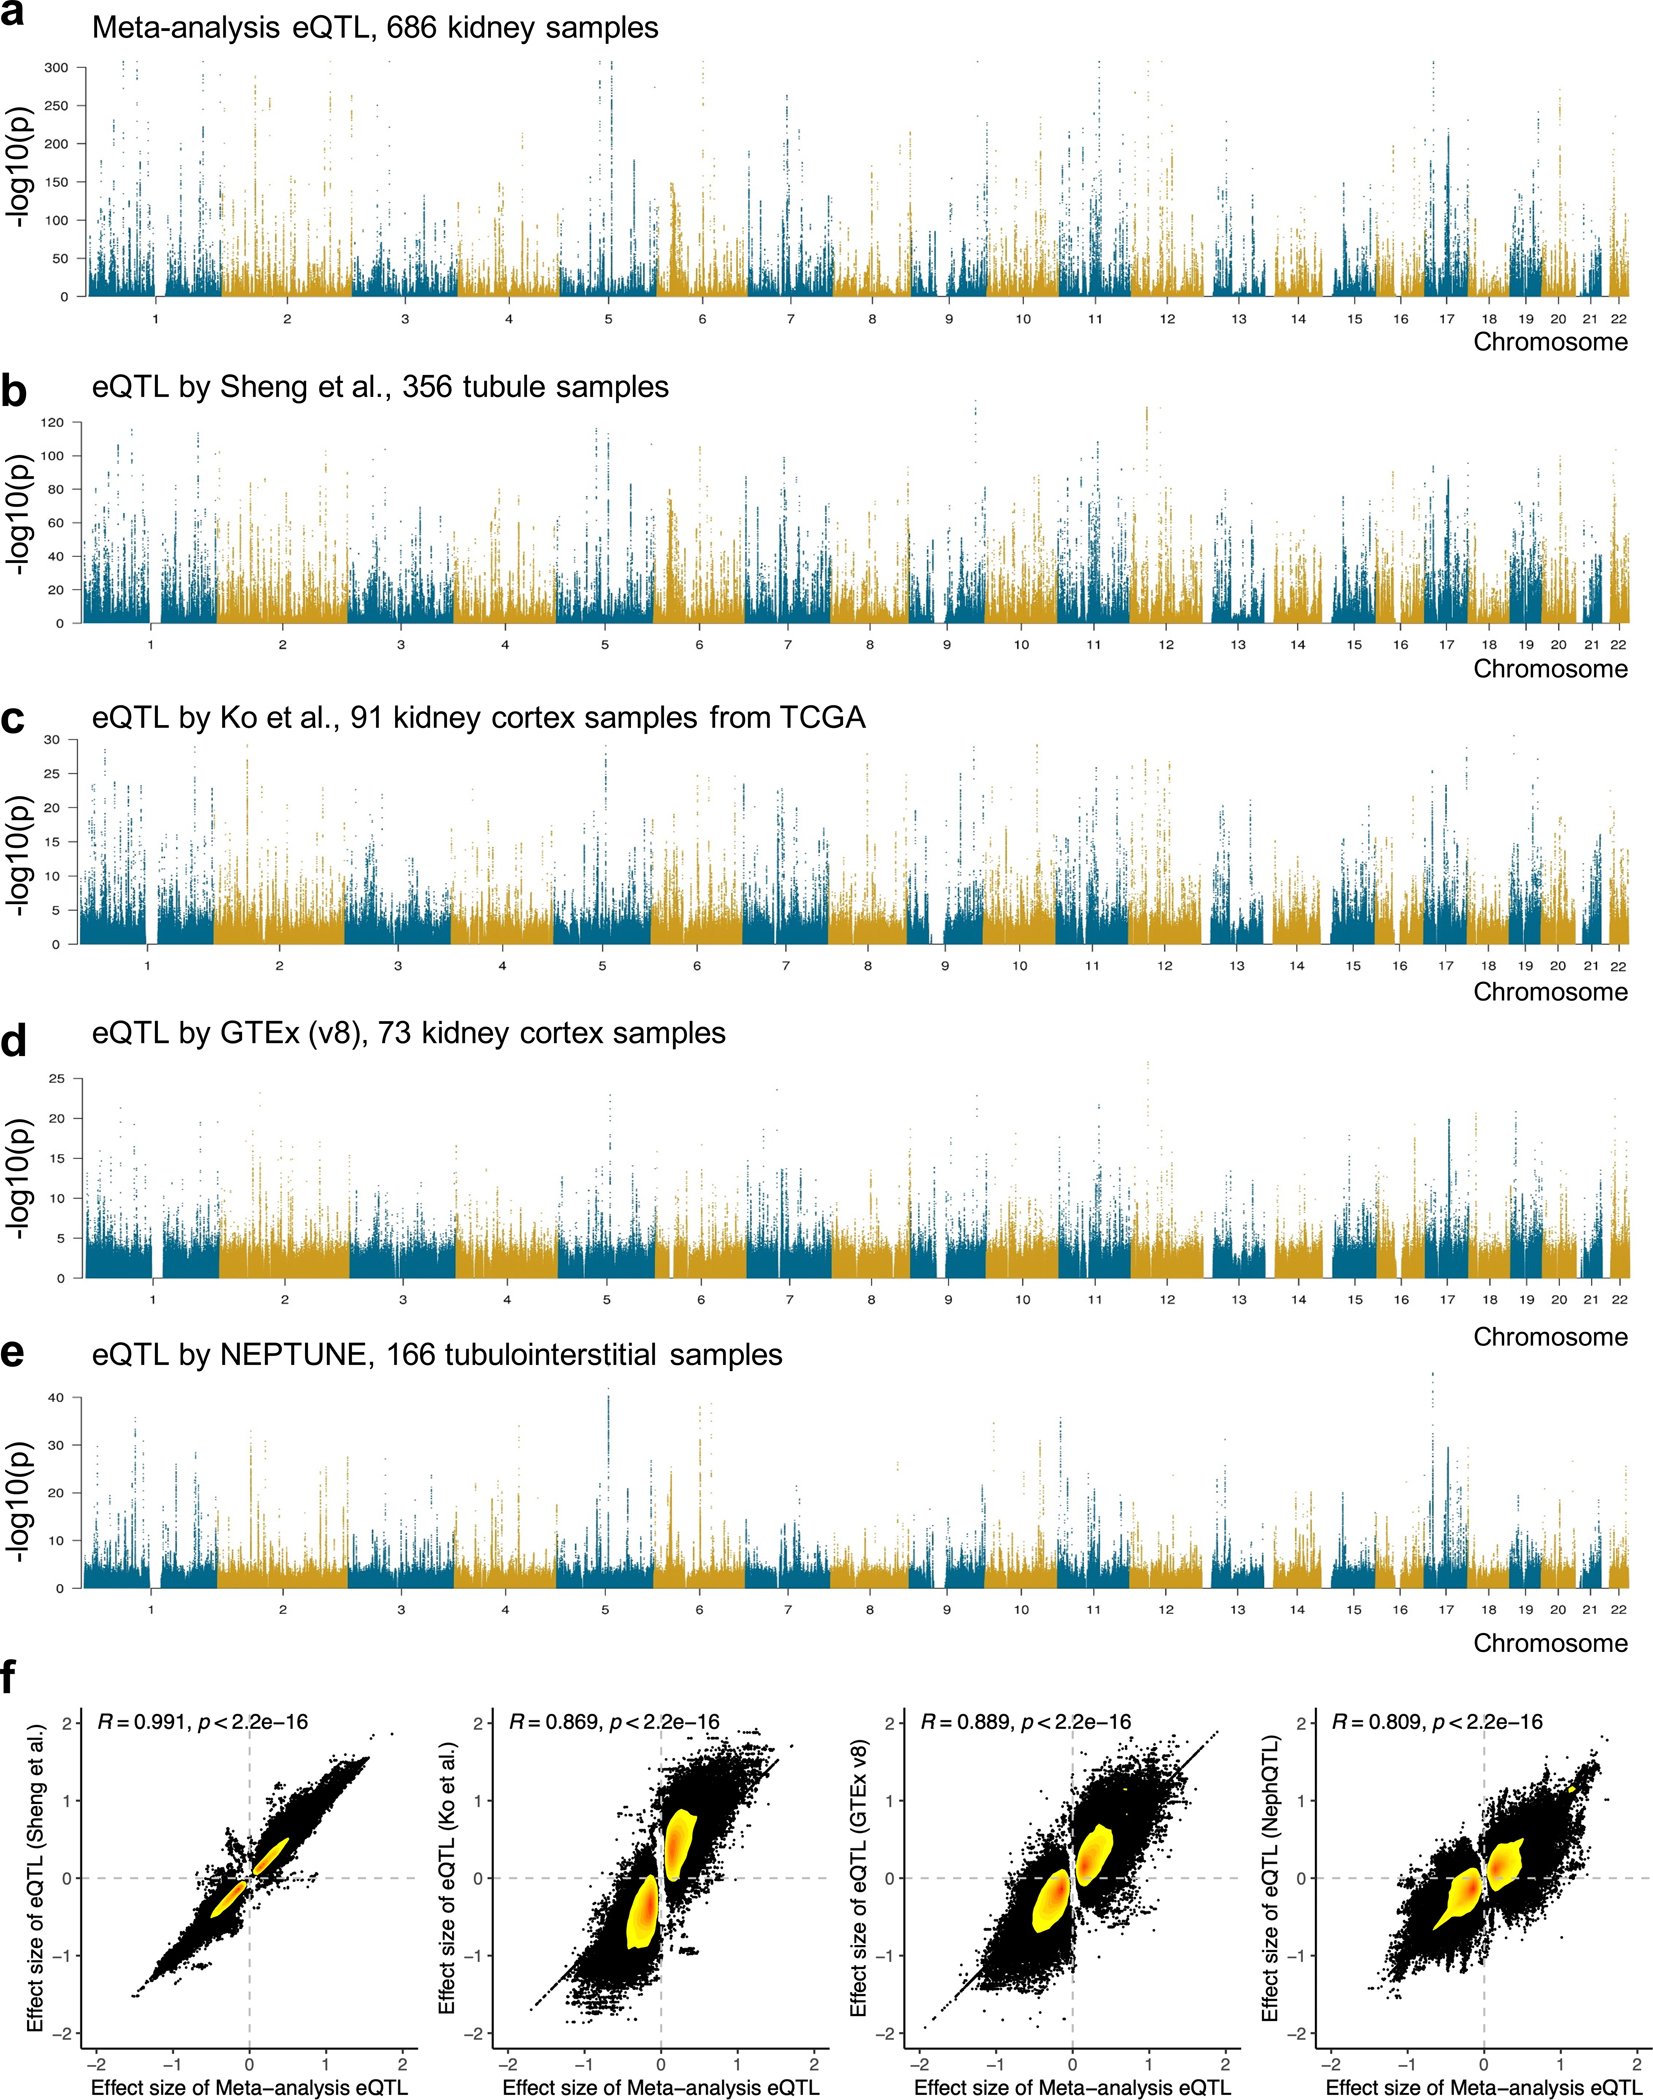
a. Manhattan plot of eQTL meta-analysis by integrating four eQTL datasets consisting of a total of 686 kidney samples. X-axis is chromosomal location of SNP, and y-axis is strength of association -log10 (two-sided p value based z-statistic from eQTL meta-analysis).
b. Manhattan plot of eQTLs by Sheng et al. (n=356 human kidney tubule samples). X-axis is chromosomal location of SNP, and y-axis is strength of association -log10 (two-sided p value from linear regression eQTL model).
c. Manhattan plot of eQTLs by Ko et al. (n=91 human kidney cortex samples). X-axis is chromosomal location of SNP, and y-axis is strength of association -log10 (two-sided p value from linear regression eQTL model).
d. Manhattan plot of eQTLs by GTEx (v8) (n= 73 human kidney cortex samples). X-axis is chromosomal location of SNP, and y-axis is strength of association -log10 (two-sided p value from linear regression eQTL model).
e. Manhattan plot of eQTLs by NephQTL (n=166 human kidney tubule samples). X-axis is chromosomal location of SNP, and y-axis is strength of association -log10 (two-sided p value from linear regression eQTL model).
f. Scatter plots of effect size correlation between eQTL meta-analysis and each individual eQTL datasets. The common variant-gene pairs passing eQTL p < 0.00001 in any of the two datasets were used for each plot. The density of dots from low to high was represented by yellow to red. Correlation coefficient was calculated using Spearman's rho (R) statistic and two-sided p value was calculated using asymptotic t approximation.
Extended_Data_Fig4. Functional annotation of kidney-specific meQTLs and mCpGs.
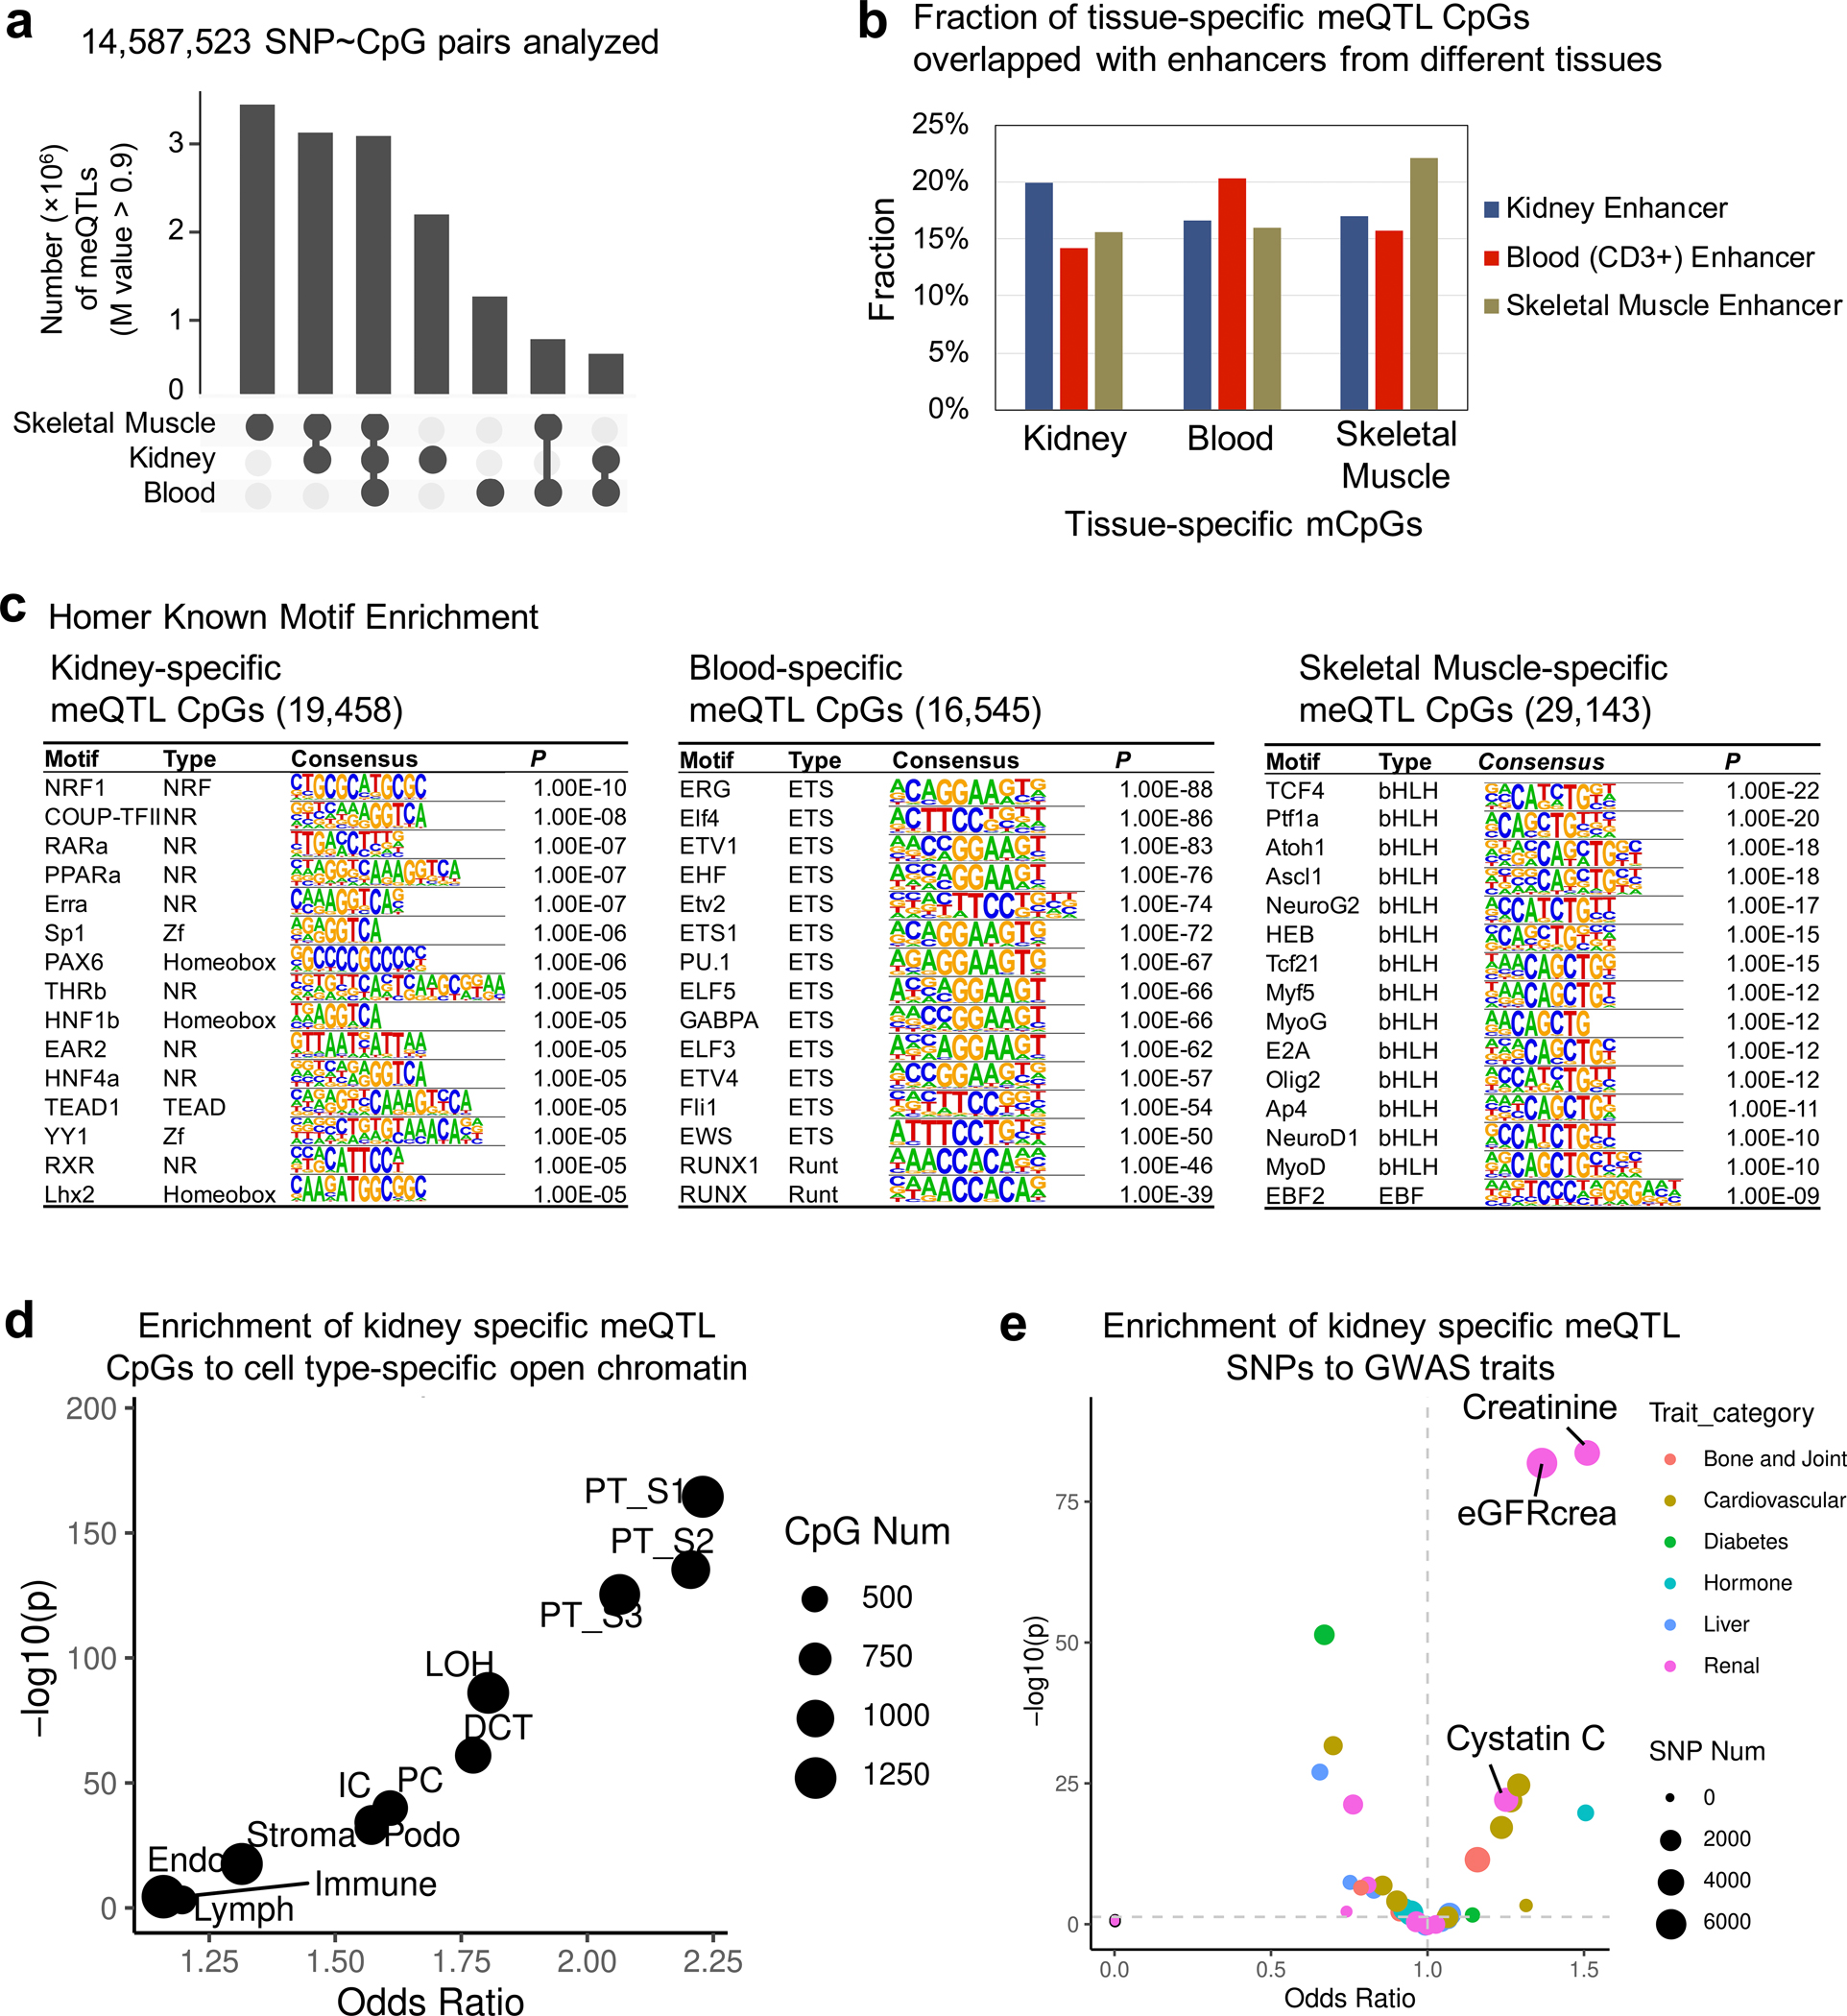
a. Tissue-specific and shared meQTLs across kidney, blood and skeletal muscle tissue. M value > 0.9 was used to define meQTL for each set.
b. Fraction of meQTL CpGs annotated by ChromHMM chromatin states in kidney, blood (CD3+) cell and skeletal muscle.
c. Transcription factor motif enrichment (HOMER) of tissue-specific mCpGs. The p value was calculated by binomial test.
d. Enrichment of kidney specific meQTL CpGs to cell type-specific open chromatin regions determined by snATAC-seq in human kidney. X-axis is odds ratio and Y-axis is strength of enrichment -log10(two-sided chi-square test p). Size of the dot represents the number of kidney-specific meQTL CpG sites.
e. Enrichment of kidney specific meQTL SNPs to GWAS traits. X-axis is odds ratio and Y-axis is strength of enrichment -log10(two-sided chi-square test p). Size of the dot represents the number of SNPs and colors represent the type of GWAS trait.
Extended_Data_Fig5. Human kidney expression quantitative trait methylation (eQTM).
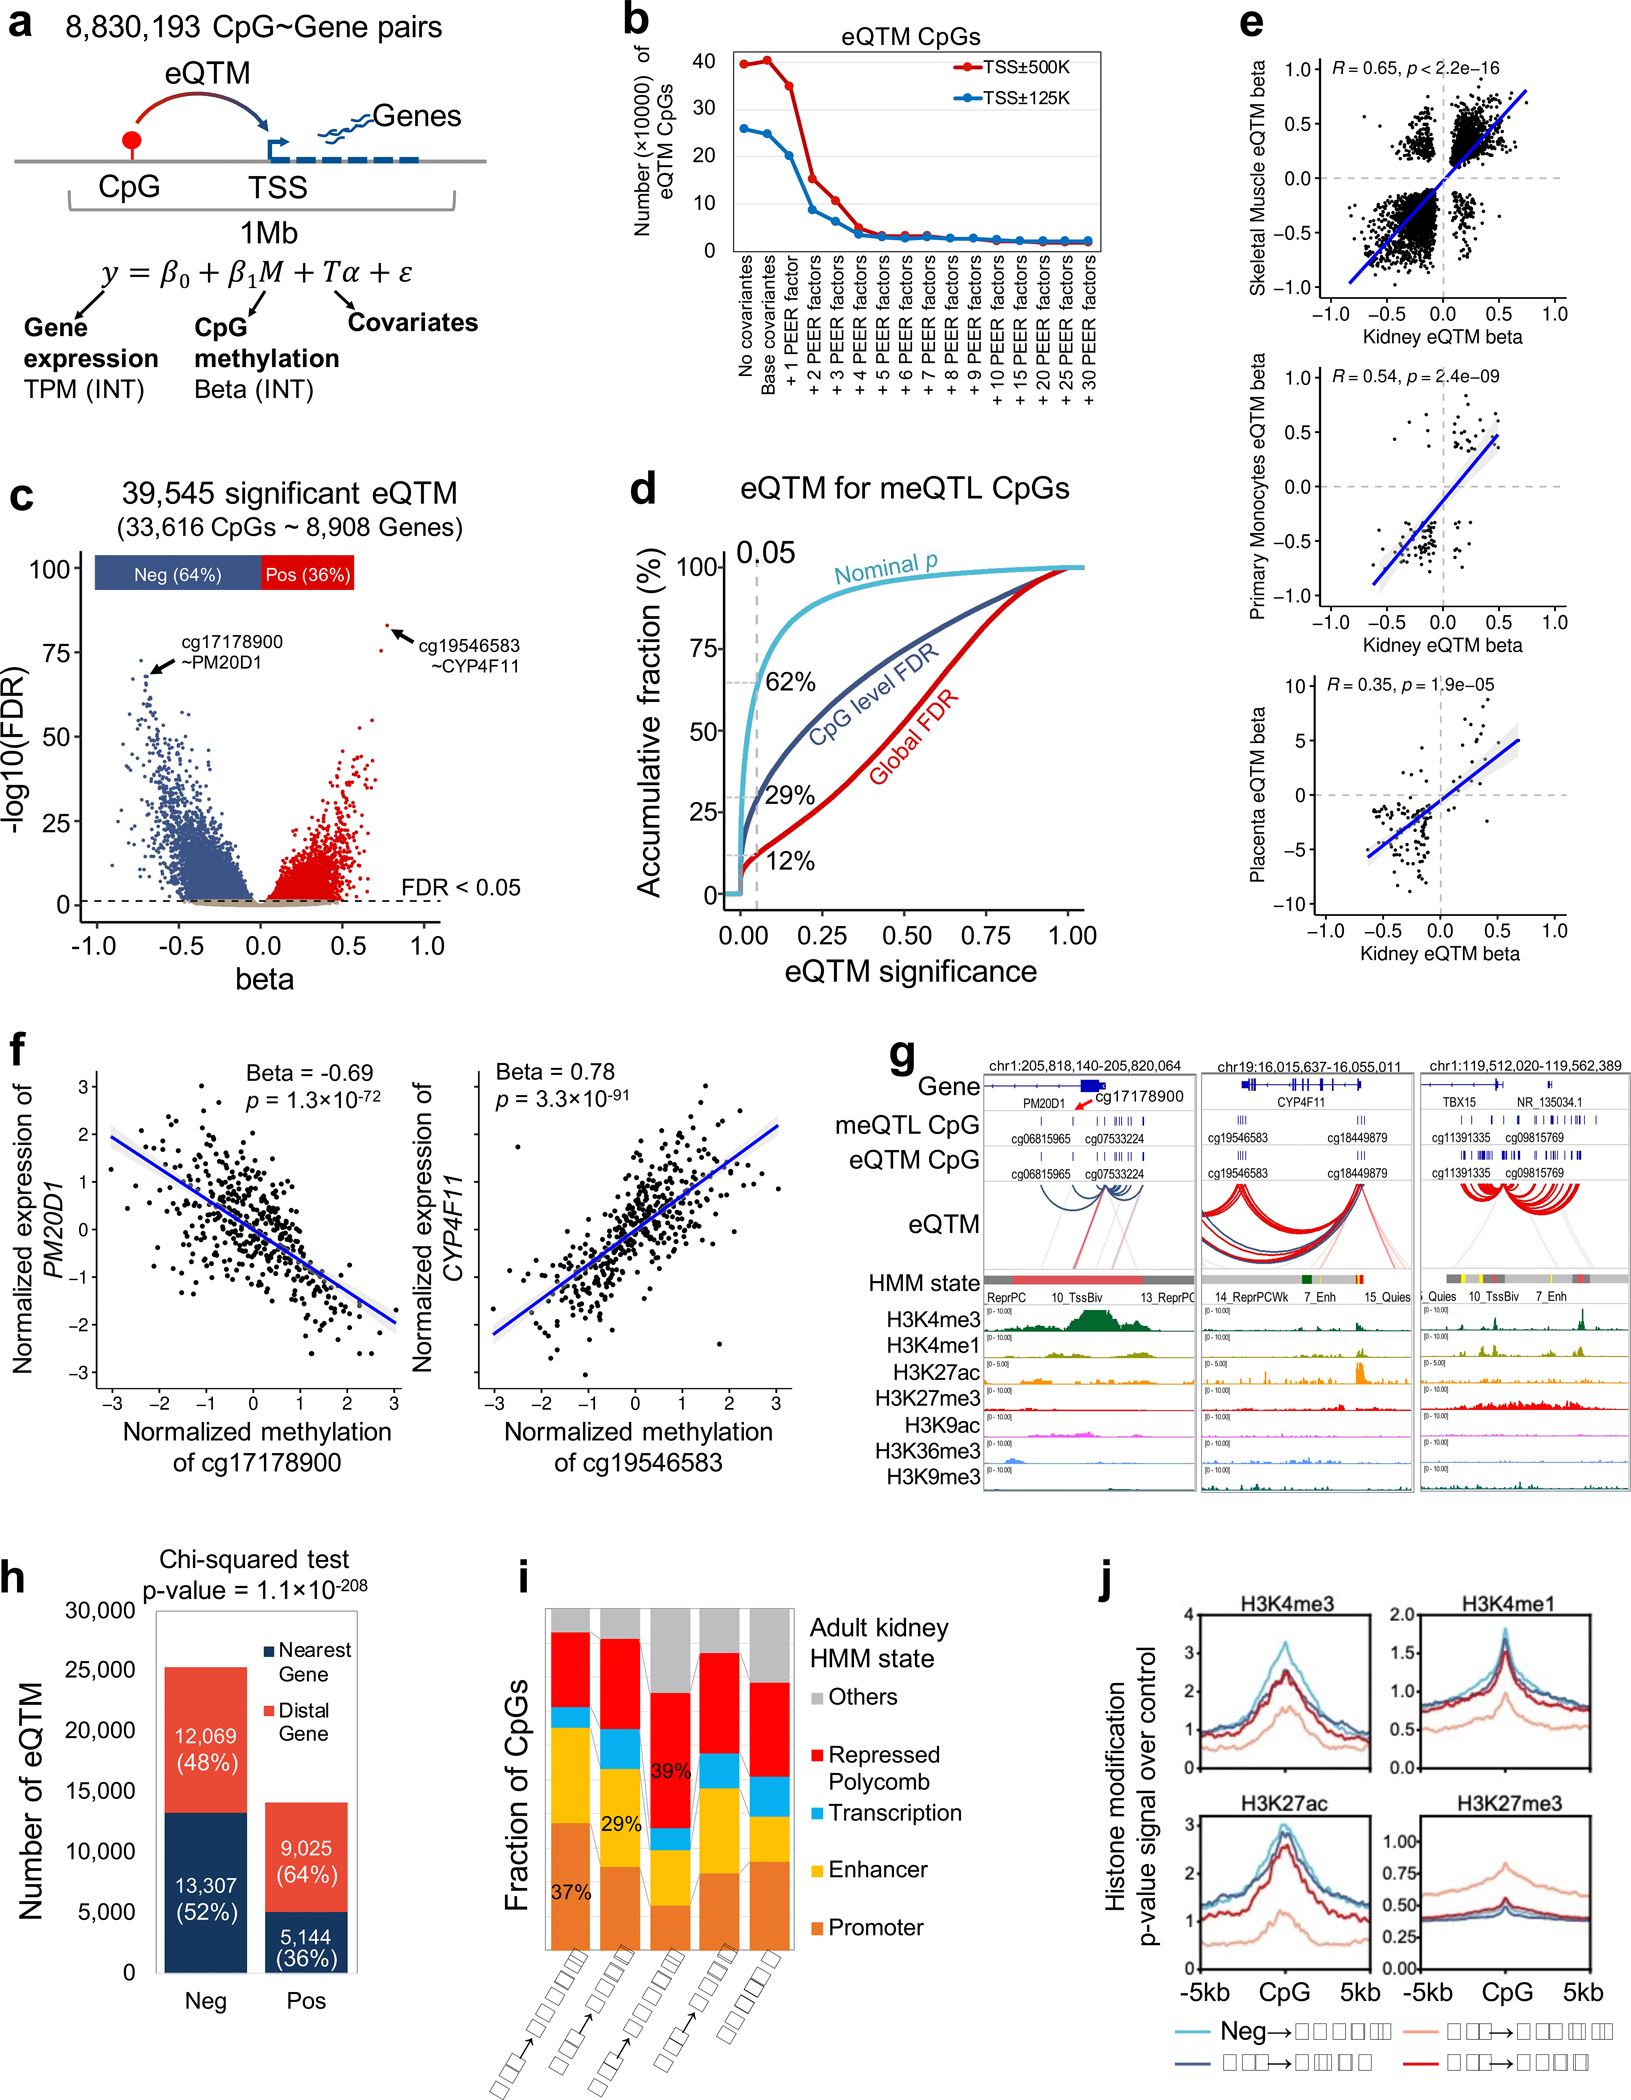
a. Schematic representation of the eQTM analysis.
b. eQTM discovery rate estimated by the number of identified CpG~Gene pairs using different number of PEER factors as covariates.
c. Volcano plot of eQTMs. The x-axis is the beta value and y-axis the strength of association (-log10(p)). Negative and positive eQTMs are colored in blue and red, respectively.
d. The fraction of identified meQTL CpGs by eQTM analysis. The red line is the global FDR, dark blue line CpG level FDR and light blue line is nominal significance threshold. The x-axis is the eQTM significance and the y-axis is the cumulative fraction of meQTL CpGs. Vertical line represents the significance cutoff 0.05.
e. Validation of the eQTMs in publicly available eQTM studies. Correlation coefficient was calculated using Spearman's rho (R) statistic and two-sided p value was calculated using asymptotic t approximation.
f. Scatter plot of CpG methylation (x-axis) and gene expression of PMD201 and CYP4F1 (y-axis) in 414 kidney samples. Each dot represents one kidney sample. Correlation coefficient was calculated using Spearman's rho (R) statistic and two-sided p value was calculated using asymptotic t approximation.
g. IGV visualization of eQTM association at the PM20D1, CYP4F11 and TBX5 loci.
h. Number and fraction of negative and positive eQTM CpGs associated with the expression of nearest or distal genes. The nearest gene was defined based on the TSS (transcription start site) to eQTM CpG distance. The distal gene was defined if it was not the closest TSS to the eQTM CpG. Two-sided p value was calculated by chi-square test.
i. Relative fraction of negative and positive eQTM CpGs localized to regulatory regions in the kidney.
j. Profile plot of H3K4me3, H3K4me1, H3K27ac, and H3K27me3 histone modification across negative and positive eQTM CpGs and 5kb flanking regions.
Extended_Data_Fig6. Estimated proportion of heritability mediated by kidney methylation and expression.
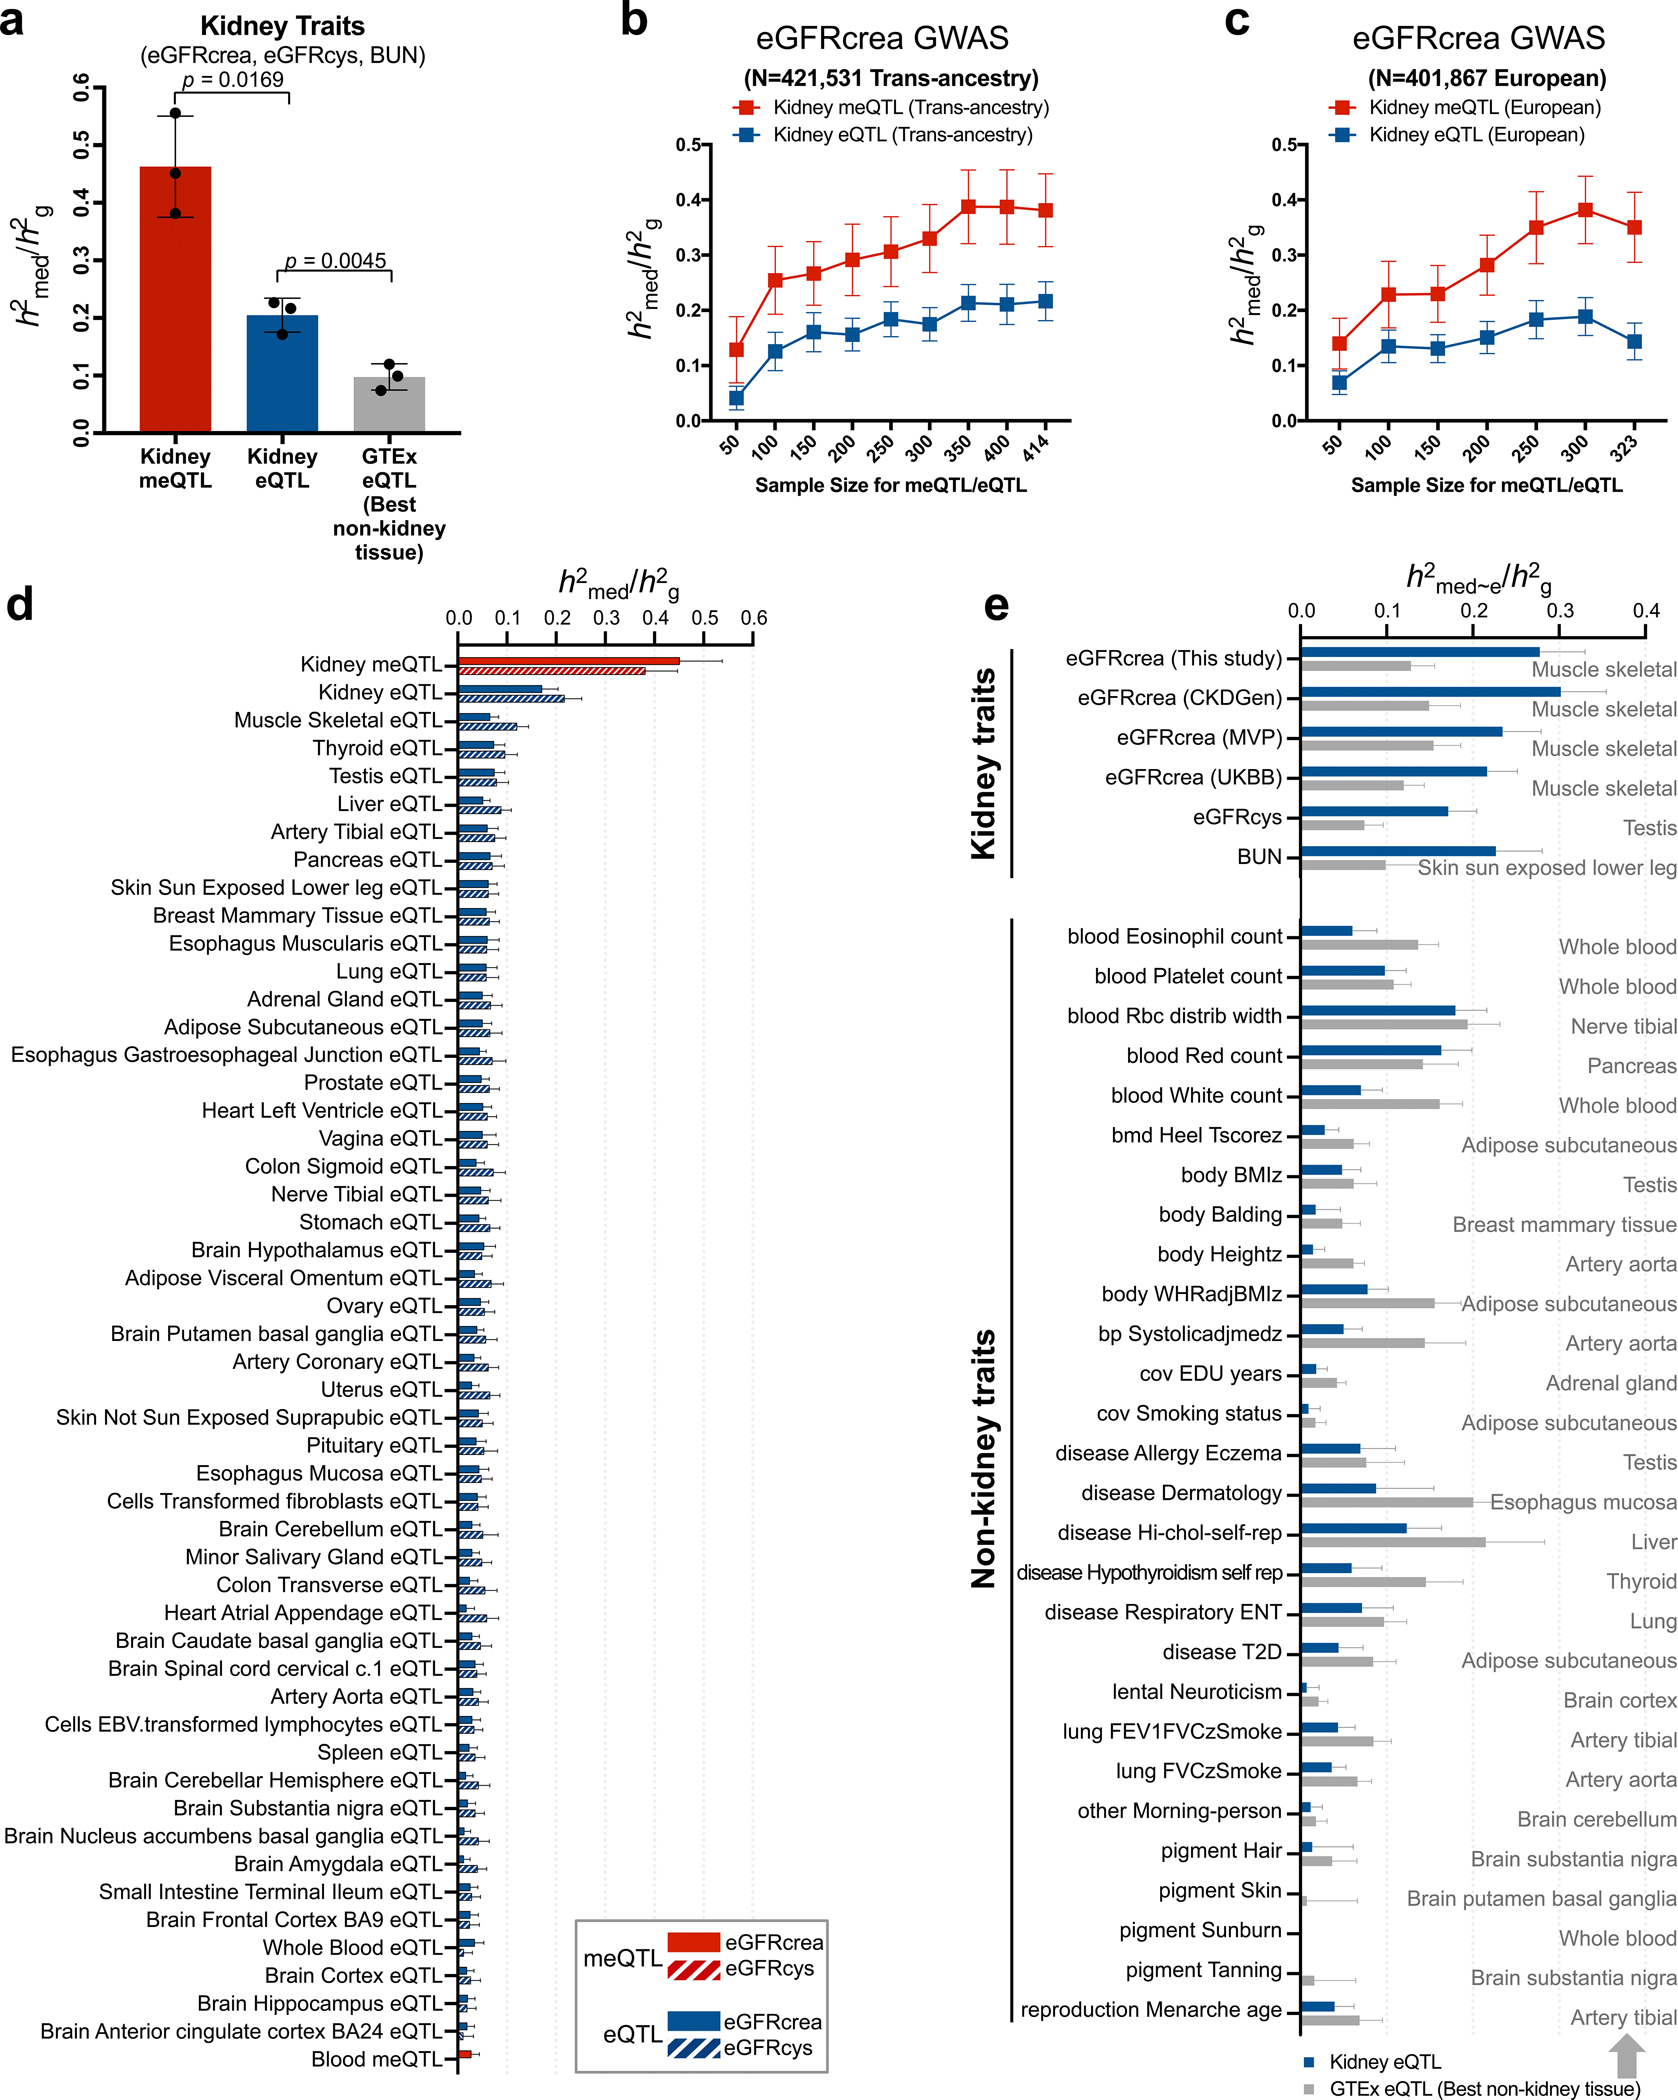
a. Estimation of heritability () mediated by kidney meQTL, kidney eQTL and the eQTL of best non-kidney GTEx tissue for three kidney function traits based three different biomarkers (eGFRcrea, eGFRcys and BUN). Here, best non-kidney GTEx tissue refers to the non-kidney tissue whose eQTL resulted in the highest estimates of compared to all other non-kidney tissues. The x-axis represents different QTL groups and y-axis for estimated for three kidney function traits Data are presented as mean ± SD. P values were calculated by one-tailed paired t test.
b-c. Estimation of eGFRcrea GWAS heritability () mediated by methylation and expression for different number of human kidneys using multi-ancestry datasets (b) and European-ancestry datasets(c). The x-axis represents sample sizes used for the meQTL and eQTL, and y-axis for estimated for eGFRcrea GWAS.
d. Estimation of eGFRcrea and eGFRcys GWAS heritability mediated by meQTL and eQTL from different tissues. The x-axis represents , while the y-axis represents eQTL or meQTL data obtained from different tissues. meQTL data is shown in red and eQTL in blue.
e. Estimation of heritability mediated by kidney eQTL and non-kidney eQTL for six kidney function traits and 28 independent non-kidney GWAS traits. The x-axis represents , while the y-axis represents different GWAS traits. For each trait, kidney eQTL data is shown in blue and best non-kidney GTEx tissue in gray. Here, best non-kidney GTEx tissue refers to the non-kidney tissue whose eQTL resulted in the highest estimates of compared to all other non-kidney tissues.
(b-e) For each bar plot, the centre of error bar represents the value of , and error bar represent jackknife standard error estimated for .
Extended_Data_Fig7. Enrichment of GWAS trait heritability mediated by enhancer methylation in 128 tissues/cell types.
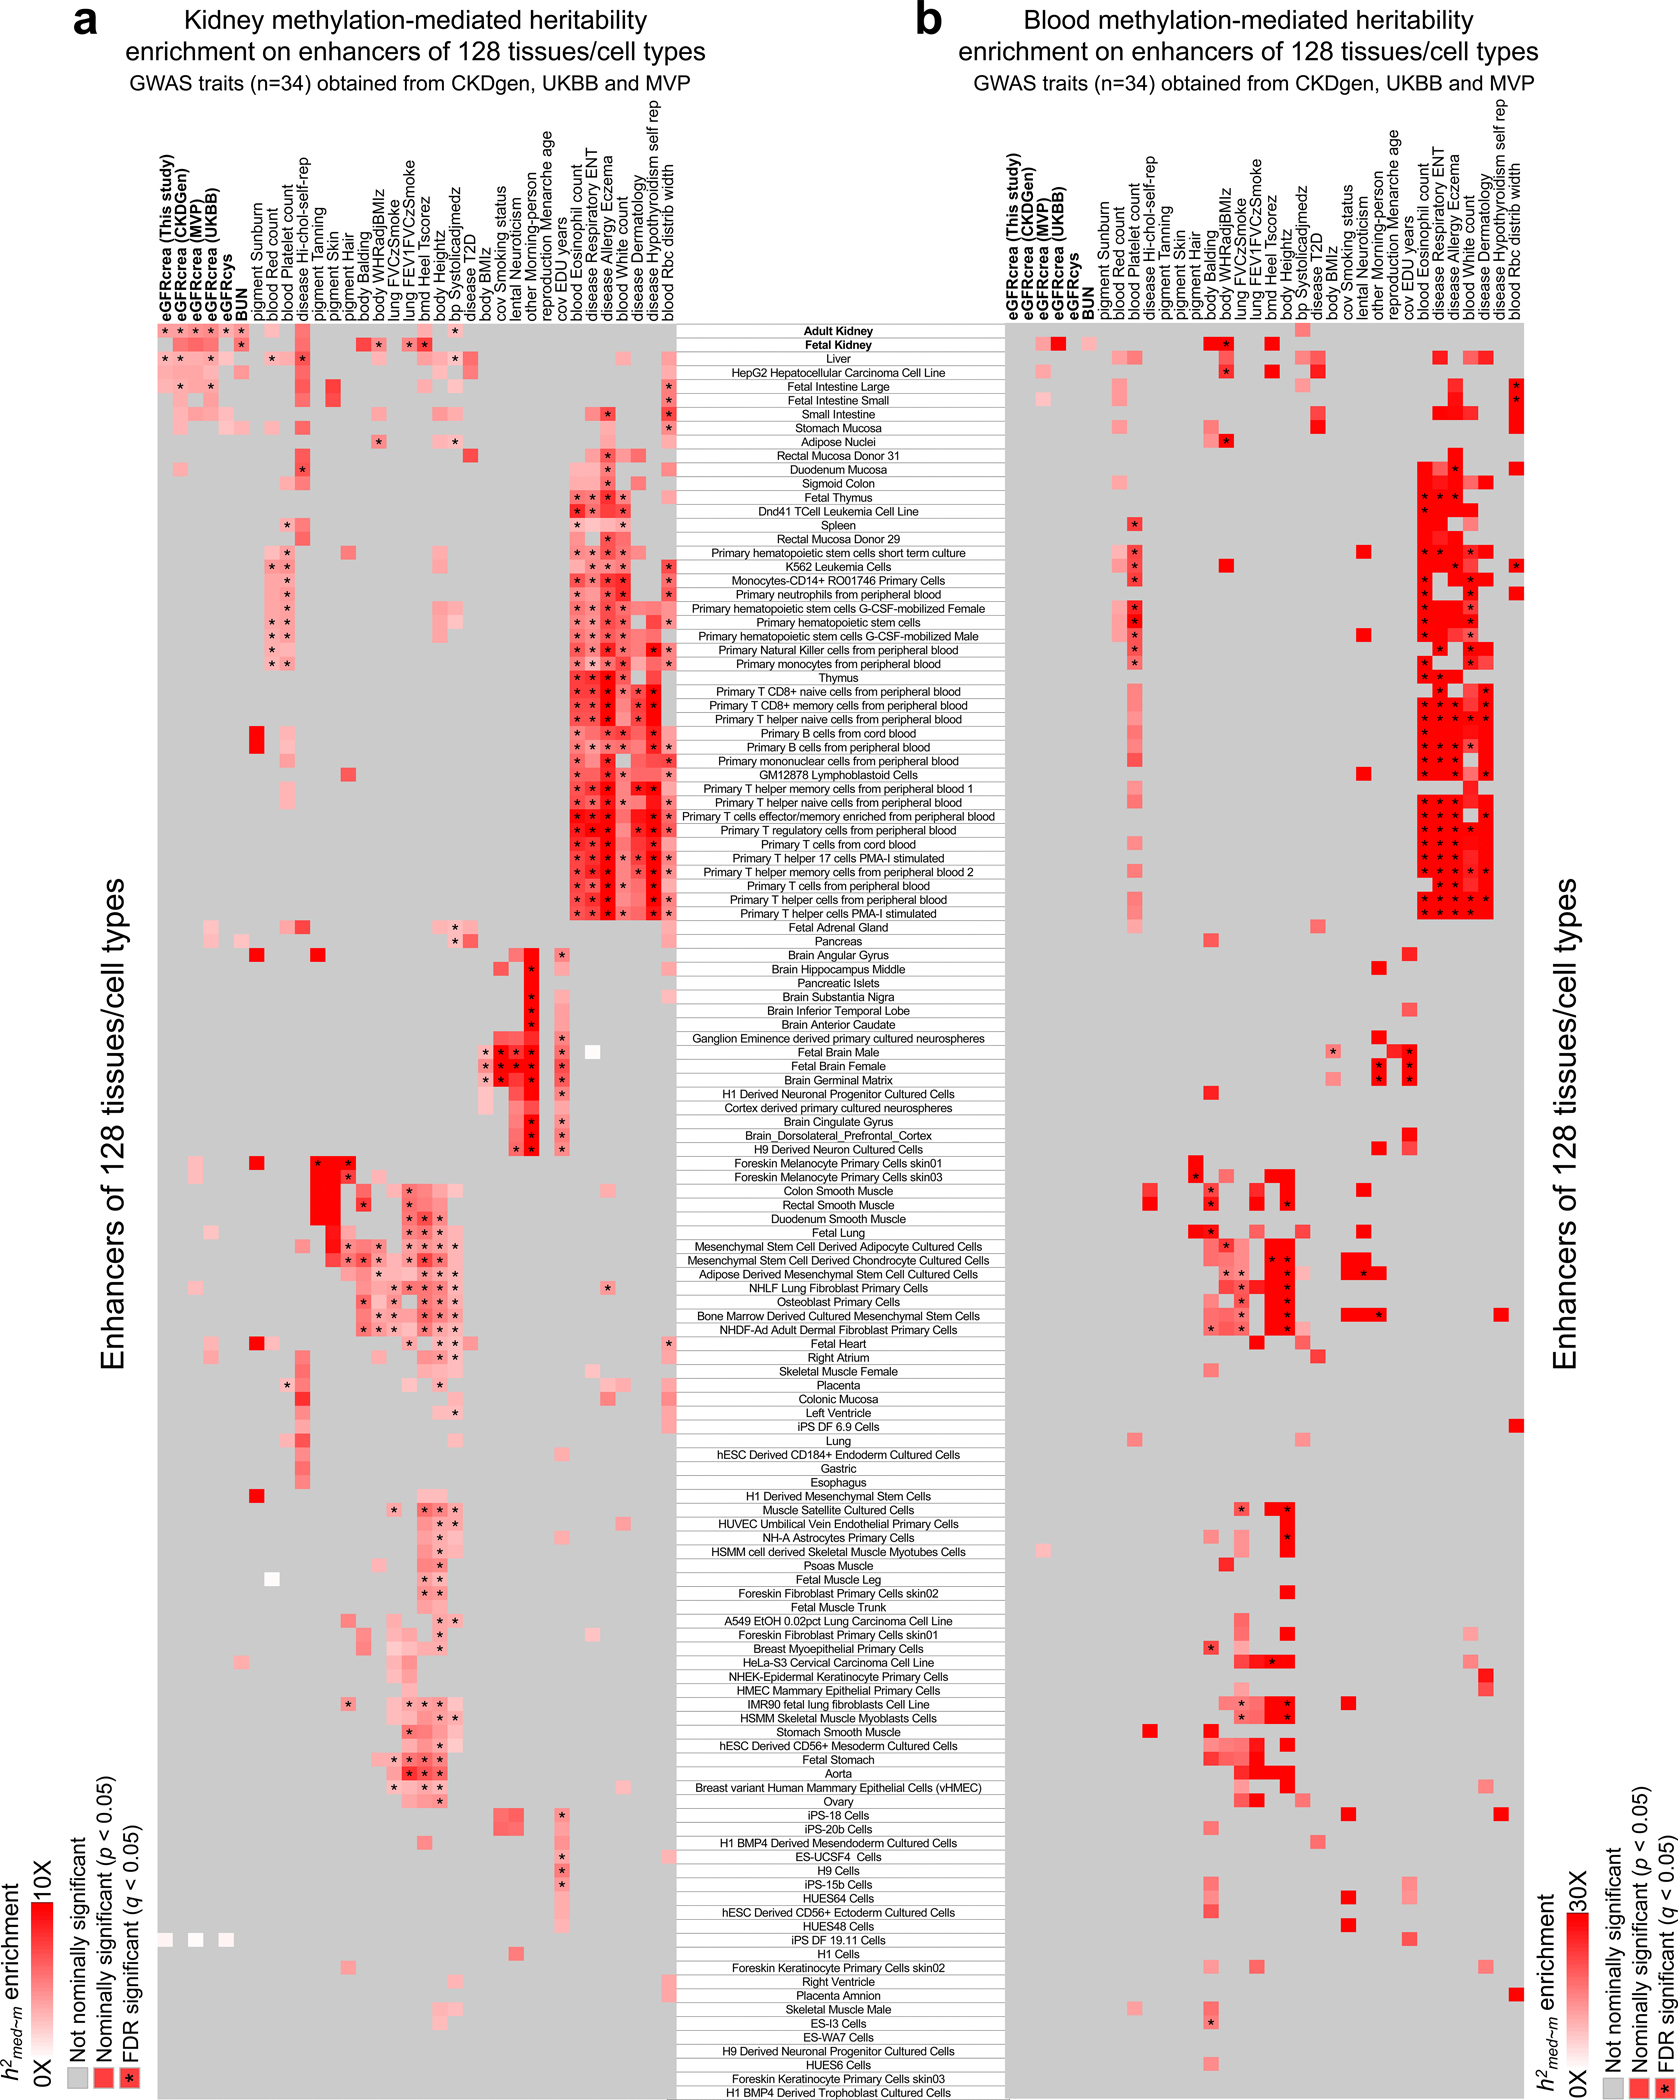
a. GWAS heritability mediated by kidney methylation categorized as enhancers in 128 tissues/cell types. The x-axis shows the GWAS traits, while the y-axis shows tissue enhancers in kidney and 127 other tissue samples from the Roadmap project ChromHMM data. Gray, non-significant, while white to red indicates significant enrichment (nominal two-sided p < 0.05 calculated by MESC). Asterisk indicates enrichment passing FDR q < 0.05 (accounting for 4,352 tests for 128 enhancer CpG sets and 34 GWAS traits).
b. GWAS heritability mediated by blood methylation categorized as enhancers in 128 tissues/cell types. The x-axis shows the GWAS traits, while the y-axis shows tissue enhancers in kidney and 127 other tissue samples from the Roadmap project ChromHMM data. Gray, non-significant, while white to red indicates significant enrichment (nominal two-sided p < 0.05 calculated by MESC). Asterisk indicates enrichment passing FDR q < 0.05 (accounting for 4,352 tests for 128 enhancer CpG sets and 34 GWAS traits).
Extended_Data_Fig8. Gene prioritization for eGFRcrea GWAS variants and functional annotation.
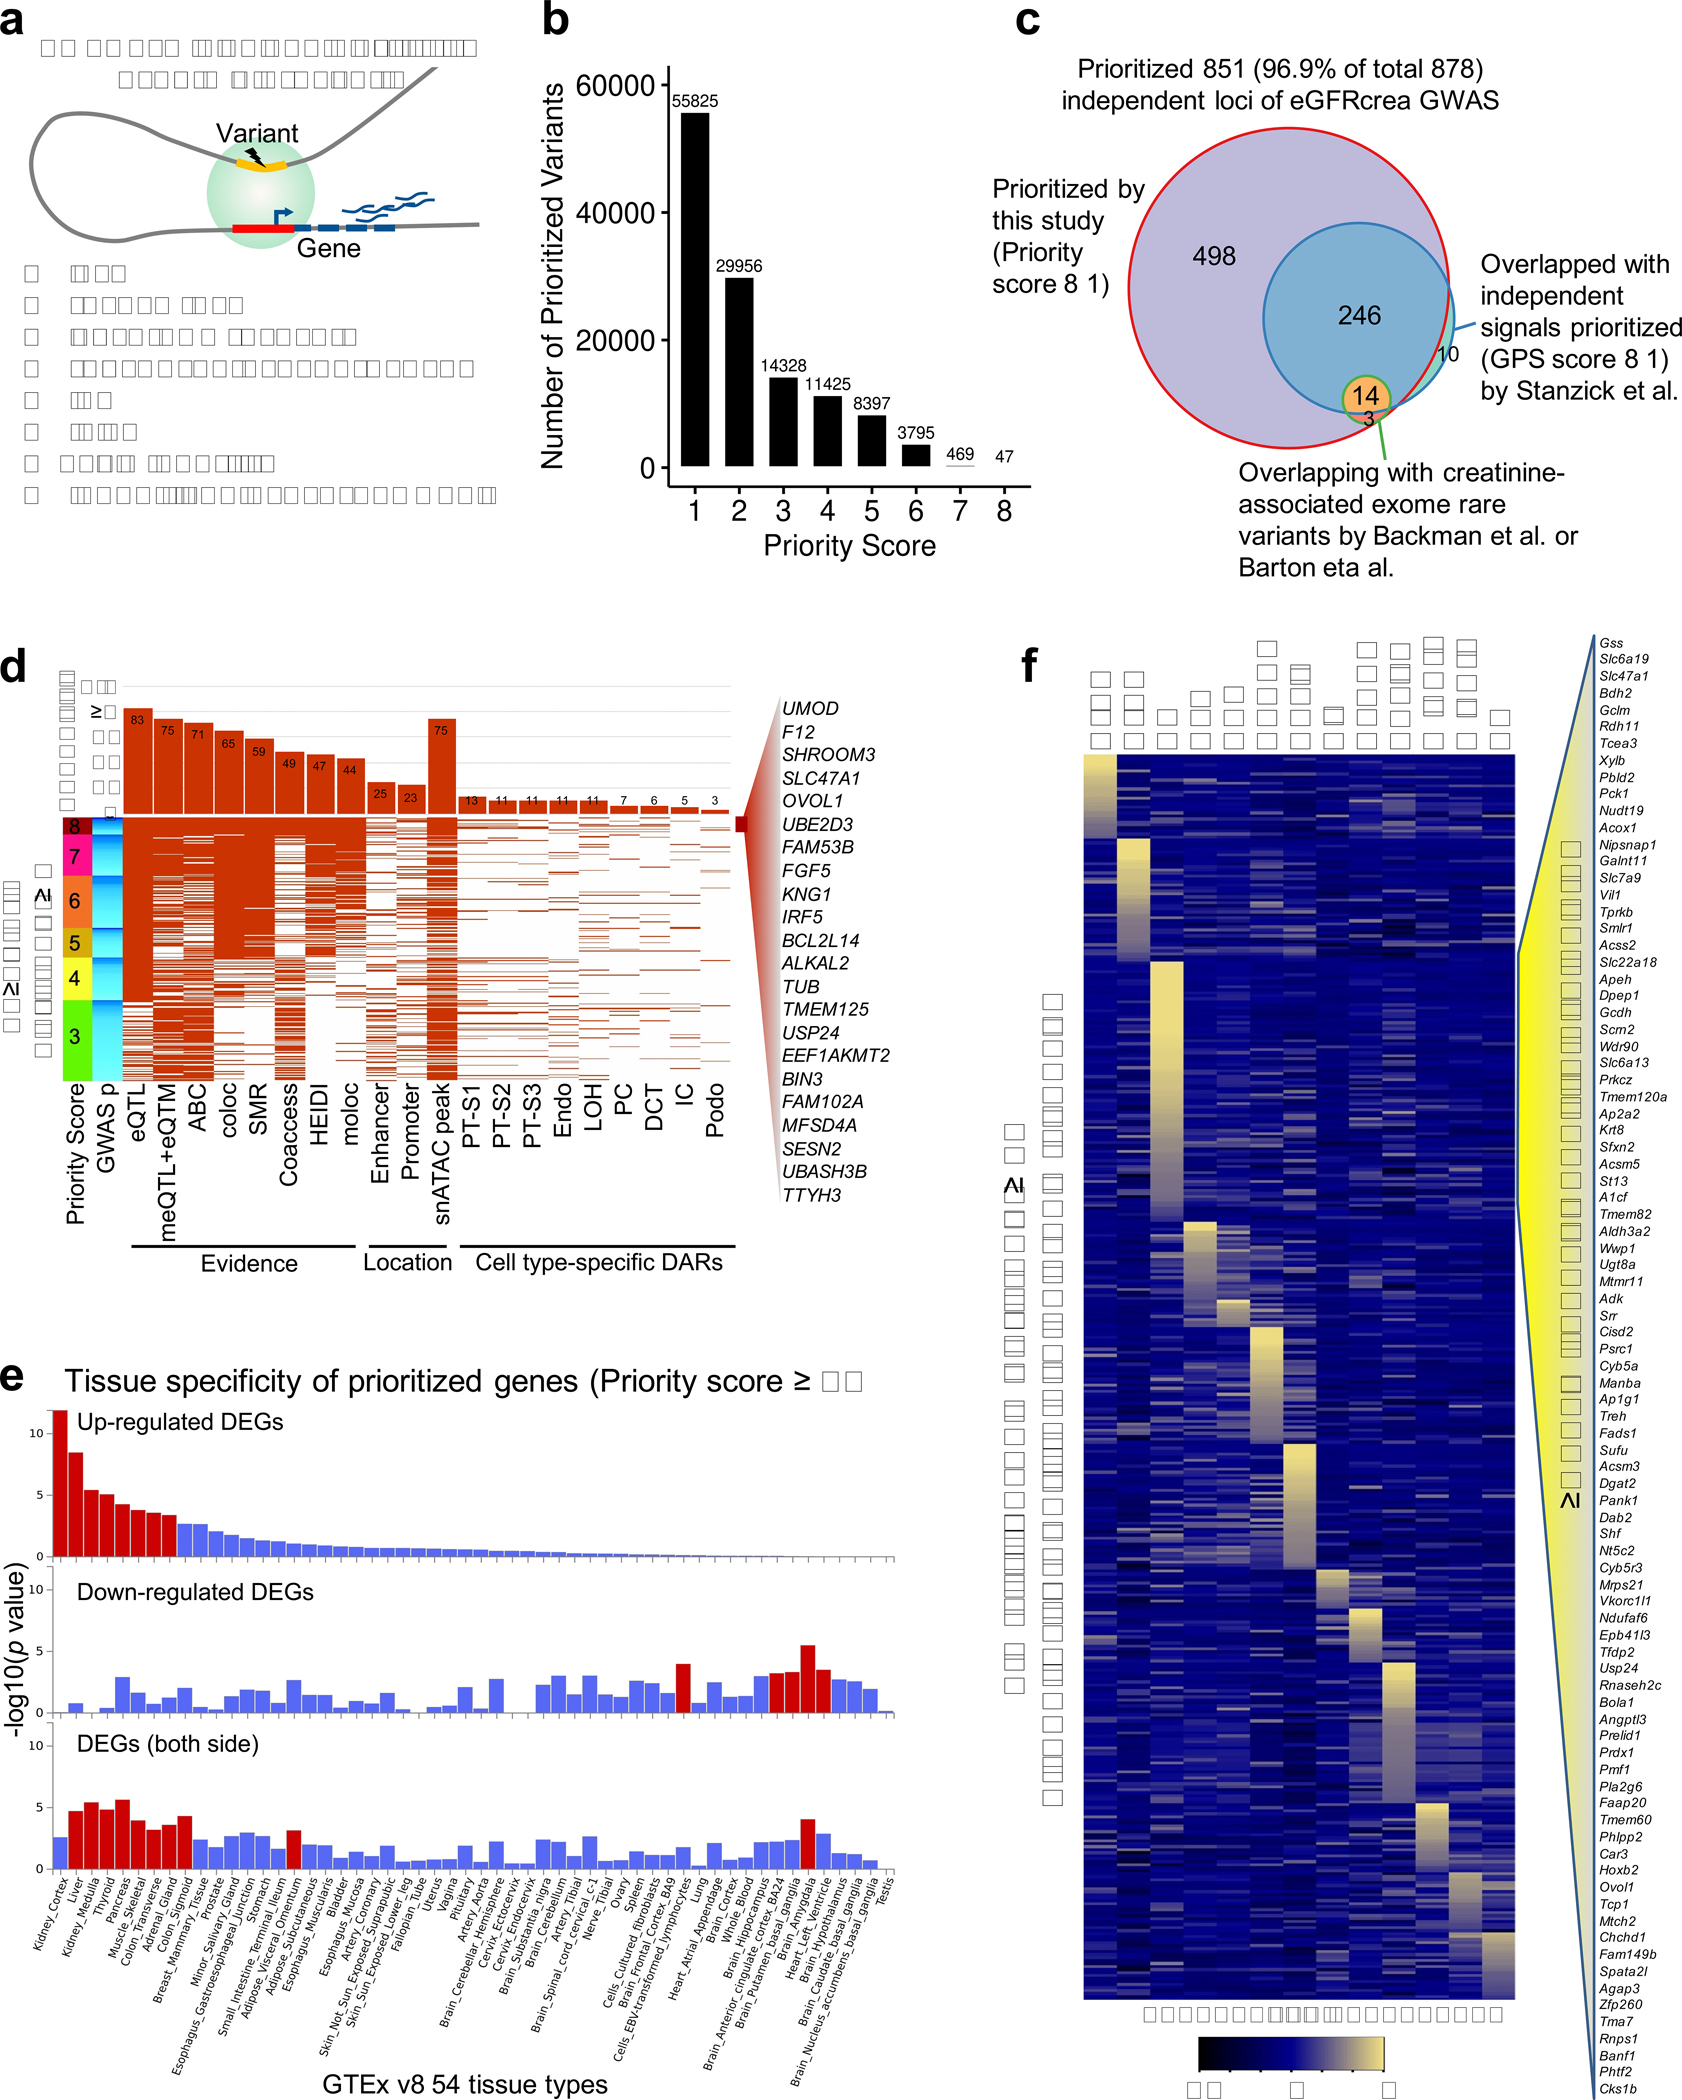
a. Schematic representation of gene prioritization strategy based on eight prioritization datasets and methods.
b. Number of eGFRcrea GWAS variants prioritized using different priority score threshold.
c. eGFRcrea GWAS independent loci prioritized by this study (priority score ≥ 1) and previous studies. The number represents the number of independent loci overlapping with independent signals prioritized (GPS score ≥ 1) by Stanzick et al. and/or creatinine-associated exome rare variants by Backman et al. or Barton et al.
d. Features of the top variants prioritized for the 328 loci with priority score ≥ 3. Each row shows the top variant for each locus. Loci were ordered from top to bottom based on priority scores from 8 to 3. Loci with the same priority score were ordered by GWAS significance from strongest (dark blue) to lowest (light blue). Each column represents a feature overlapped with the variant. For each feature, the fraction of overlapping variants is shown in the upper panel. 22 top prioritized genes supported by all eight datasets and methods were listed.
e. Tissue specificity of 566 prioritized genes (priority score ≥ 3) in 54 tissue types (GTEx v8) using GENE2FUNC of FUMA. The x-axis is the 54 tissue types ordered according to significance of enrichment in up-regulated differentially expressed gene sets. Y-axis represents enrichment significance -log10(p value calculated by hypergeometric test). Tissue with Bonferroni p value < 0.05 is shown in red.
f. Heatmap of the expression of 417 mouse orthologues of prioritized genes in adult mouse kidney single cell dataset. The mean expression was calculated for each cell types and z-scores were plotted. Right panel shows 87 genes with the highest level of expression in proximal tubule cells.
Extended_Data_Fig9. PheWAS analysis of rs111653425 SLC47A1 variants in UKBB and BioMe Biobanks.
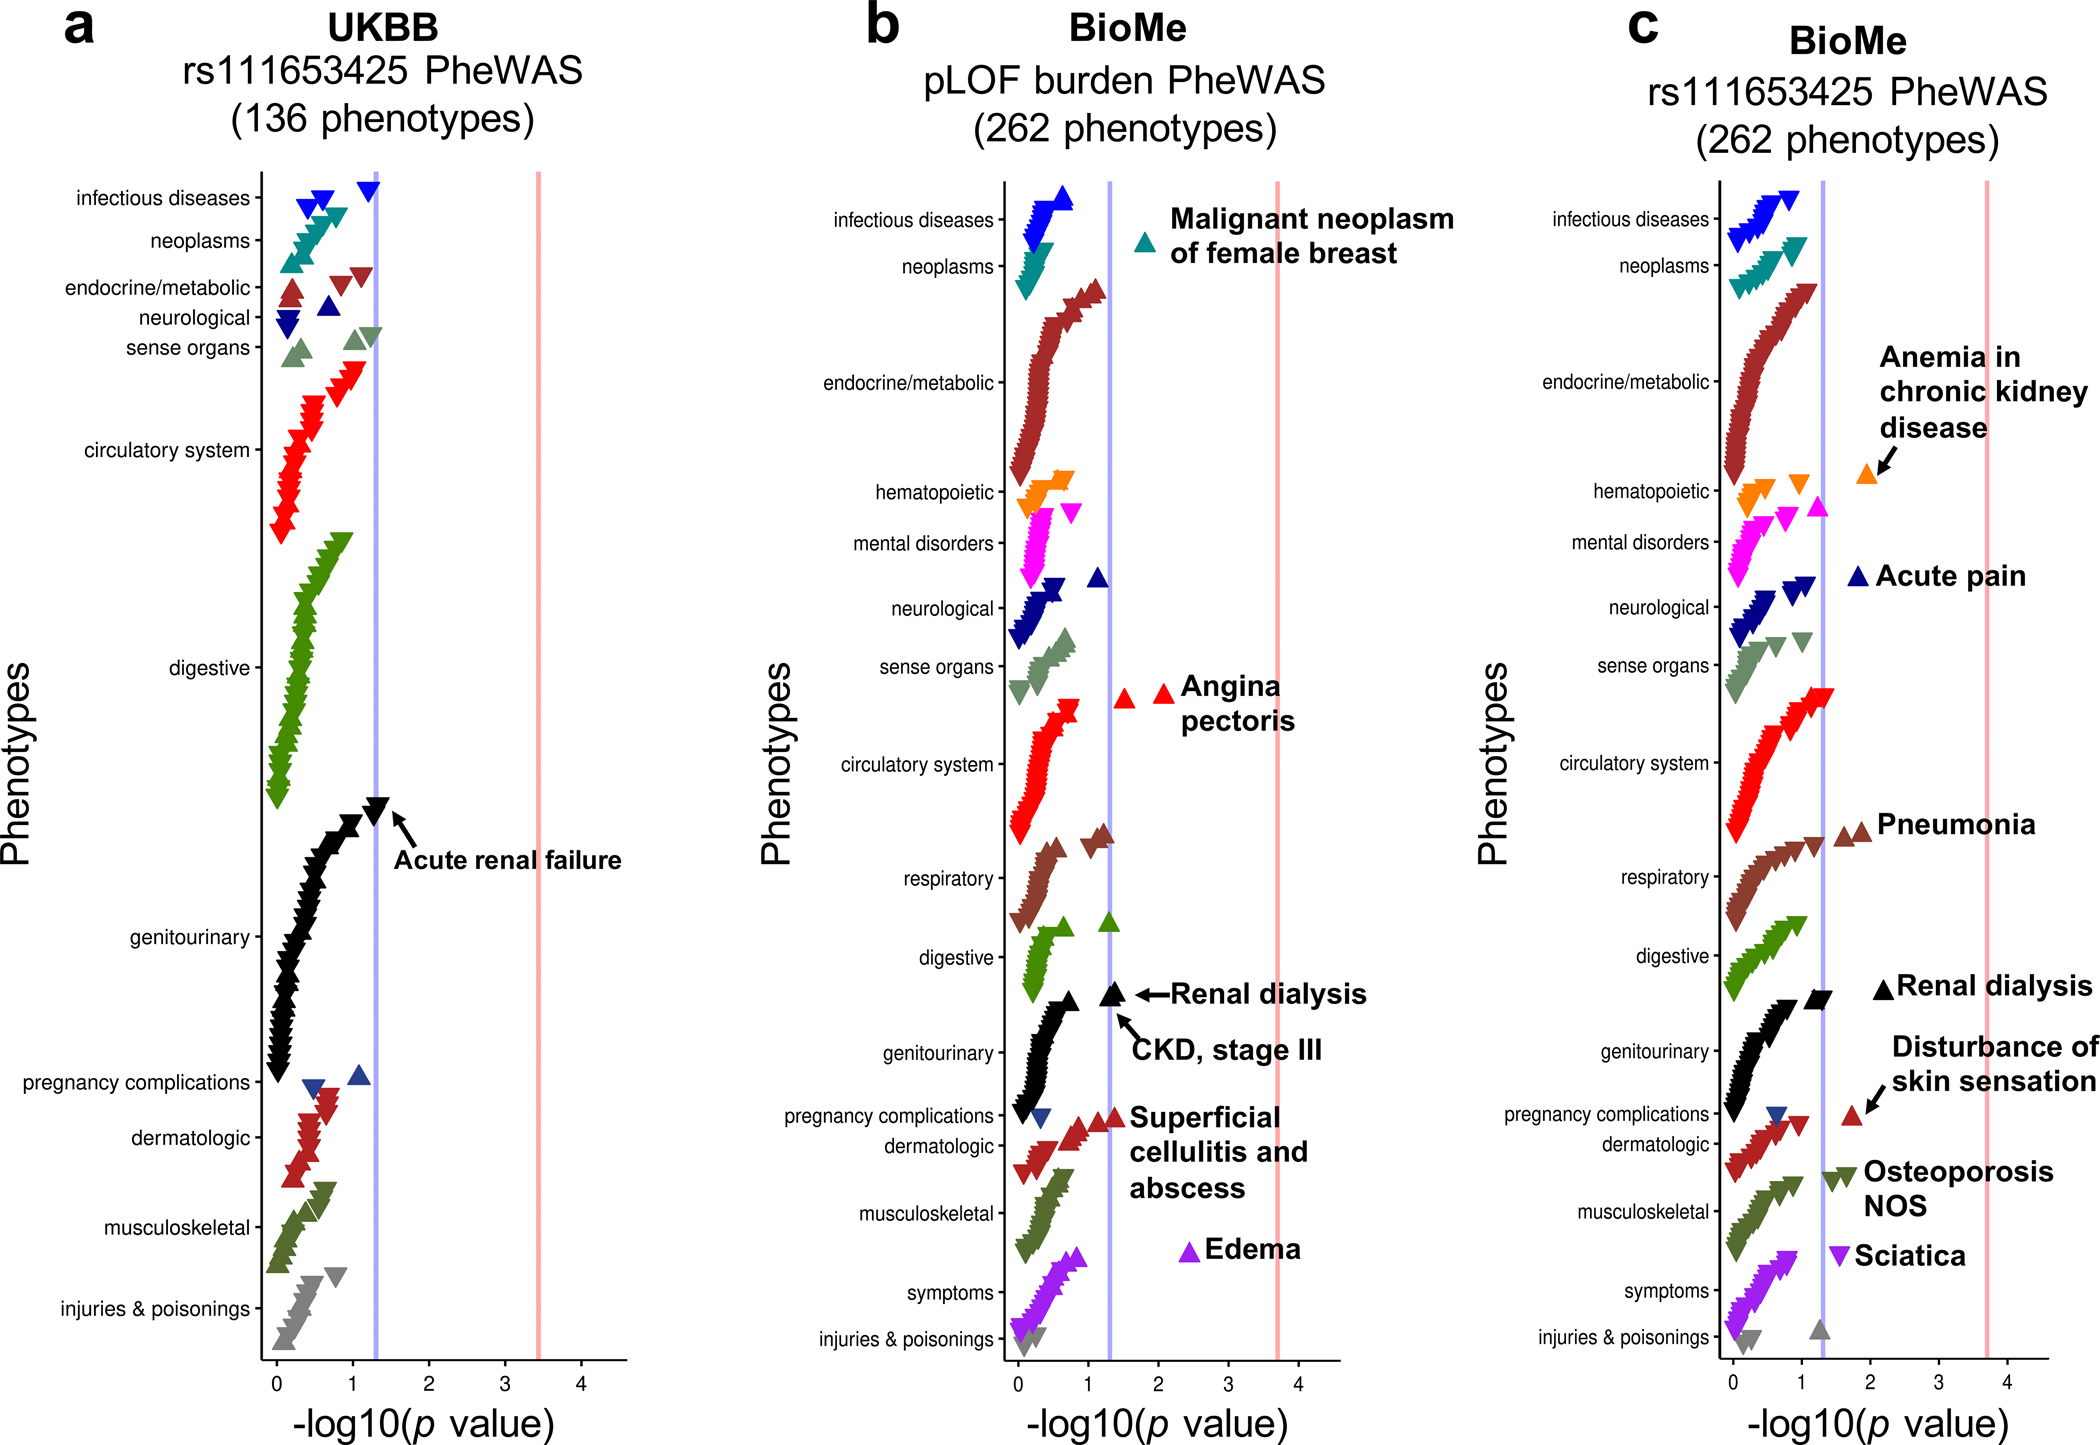
a. Single variant (rs111653425) PheWAS analysis of SLC47A1 in UKBB dataset. The x-axis is the strength of association -log10(p value calculated by linear regression PheWAS model). Blue line is p = 0.05 and red line is Bonferroni adjusted p = 0.05. The y-axis is the analyzed phenotype.
b. SLC47A1 pLOF burden pheWAS analysis in BioMe dataset. The x-axis is the strength of association -log10(p value calculated by linear regression PheWAS model). Blue line is p = 0.05 and red line is Bonferroni adjusted p = 0.05. The y-axis is the analyzed phenotype.
c. Single variant (rs111653425) pheWAS analysis of SLC47A1 in BioMe dataset. The x-axis is the strength of association -log10(p value calculated by linear regression PheWAS model). Blue line is p = 0.05 and red line is Bonferroni adjusted p = 0.05. The y-axis is the analyzed phenotype.
Extended_Data_Fig10. Slc47a1 loss confers kidney disease risk in mice.
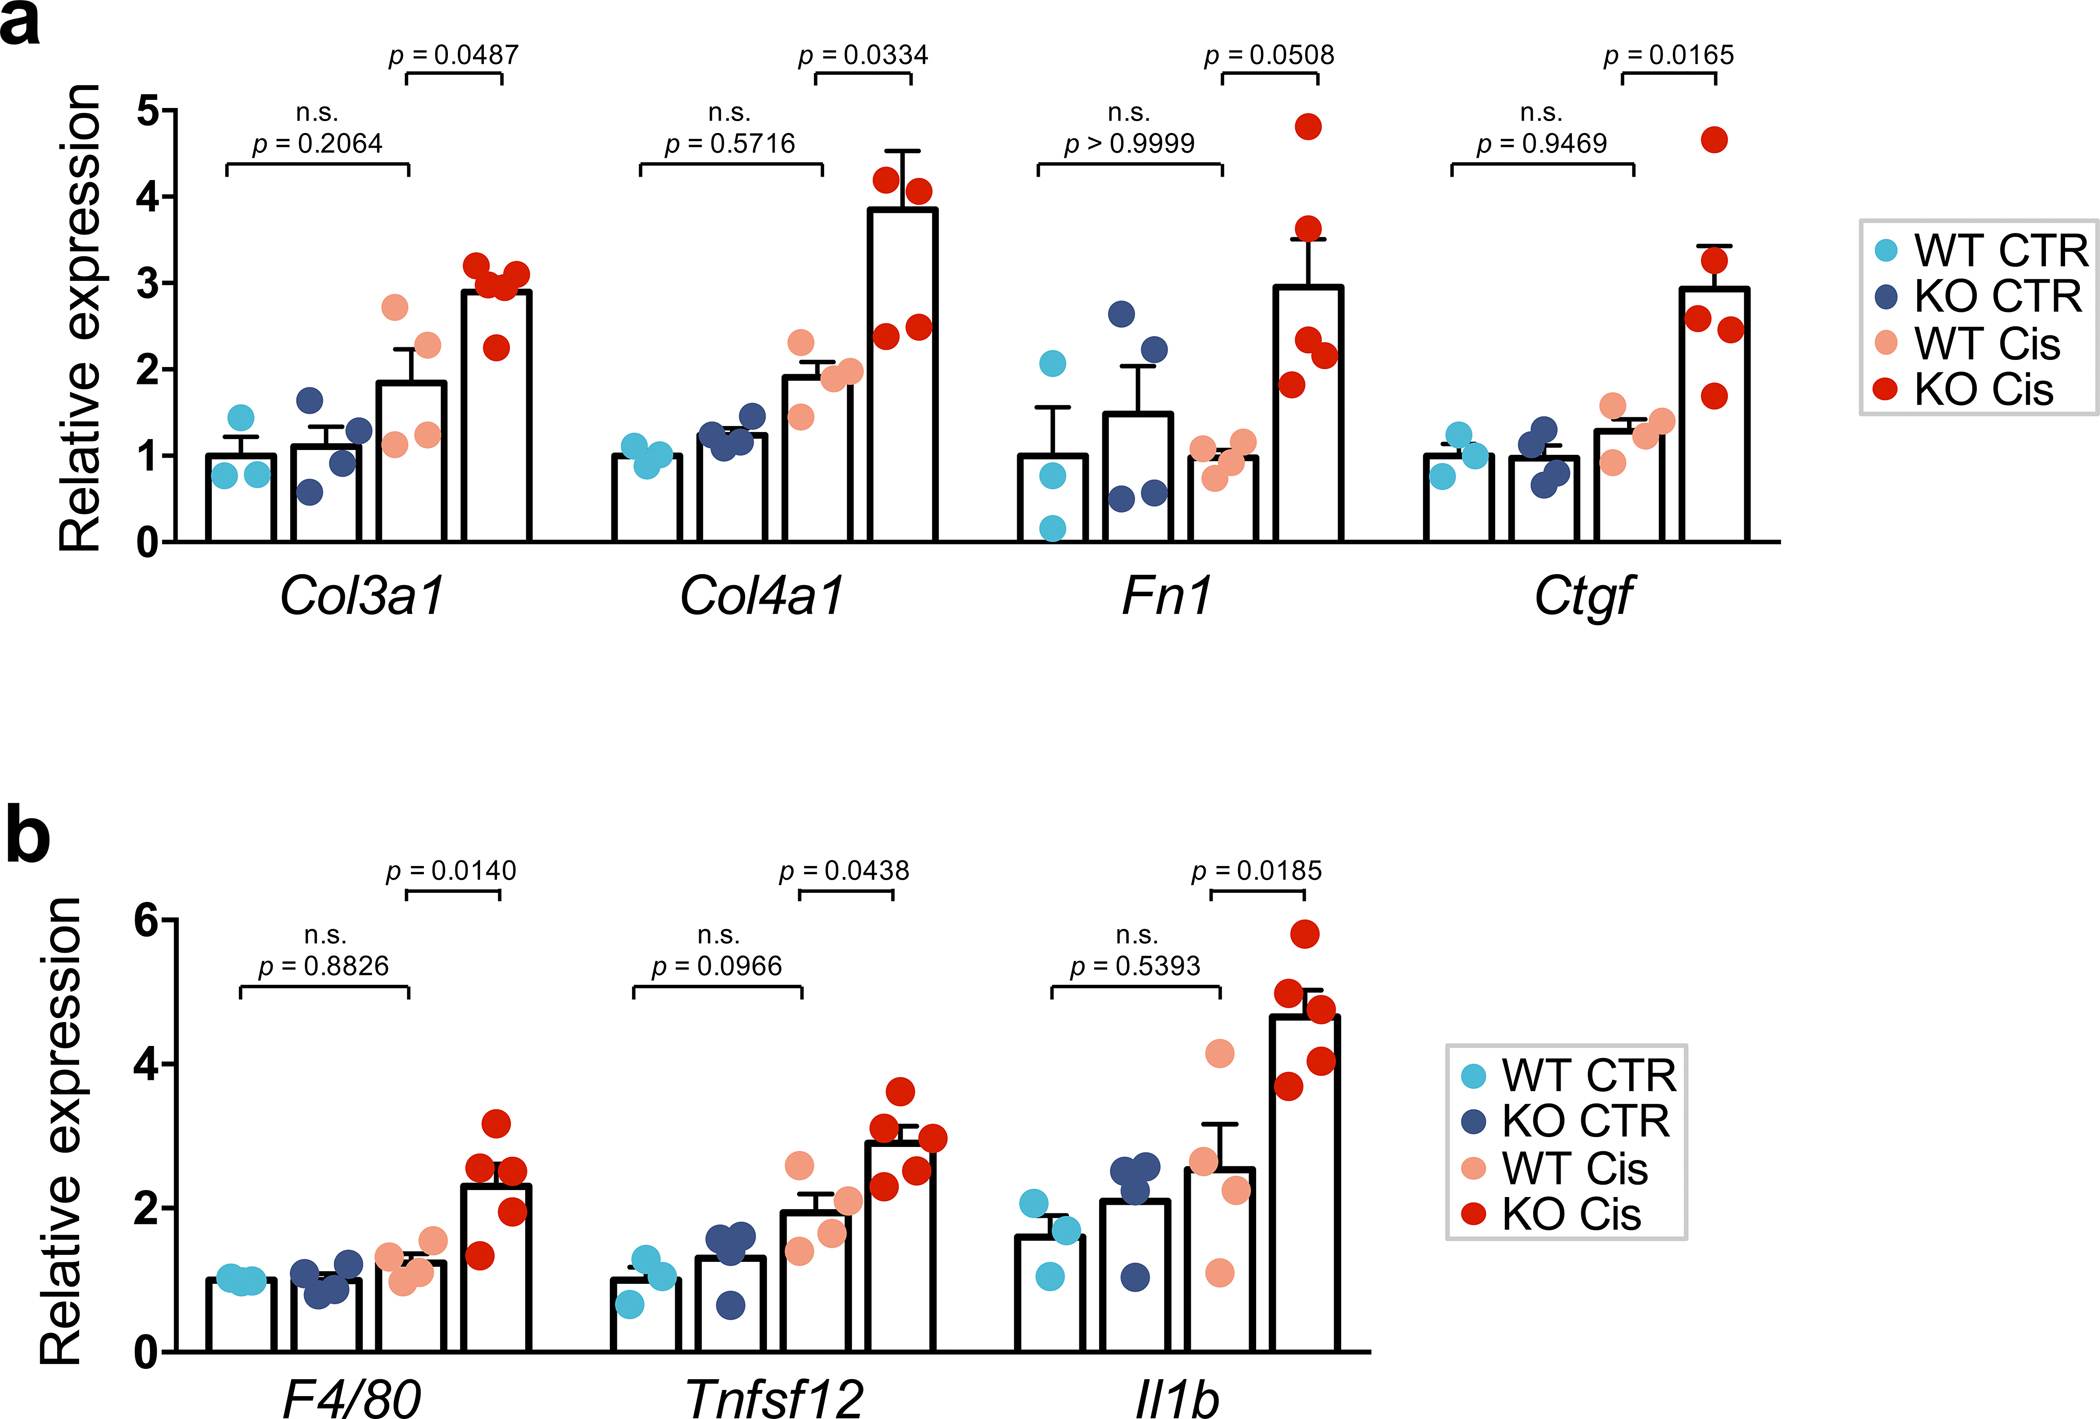
a. The relative expression of fibrosis markers; Collagen3 (Col3a1), Collagen4 (Col4a1), Fibronectin (Fn1), and Connective tissue growth factor (Ctgf) in kidney of control or cisplatin treated Slc47a1+/+and Slc47a1−/− mice. Data are presented as mean ± SD. P values were calculated by one-way ANOVA with post hoc Tukey test. n.s., not significant. n=4 biologically independent Slc47a1+/+ cisplatin mice examined over n=3 independent Slc47a1+/+ control; n=5 biologically independent Slc47a1−/− cisplatin mice examined over n=4 independent Slc47a1+/+ cisplatin mice).
b. Relative expression of markers of inflammation; Adhesion G protein-coupled receptor E1 (Adgre1), Tumor necrosis factor ligand (Tnfsf12), Interleukin 1beta (Il1b) in kidneys of control or cisplatin treated Slc47a1+/+and Slc47a1−/− mice. Data are presented as mean ± SD. P values were calculated by one-way ANOVA with post hoc Tukey test. n.s., not significant. n=4 biologically independent Slc47a1+/+ cisplatin mice examined over n=3 independent Slc47a1+/+ control; n=5 biologically independent Slc47a1−/− cisplatin mice examined over n=4 independent Slc47a1+/+ cisplatin mice).
Supplementary Material
Acknowledgements
We thank the Molecular Pathology and Imaging Core (no. P30-DK050306 to K.S.) and Diabetes Research Center (no. P30-DK19525 to K.S.) at the University of Pennsylvania for their services. This work in the Susztak laboratory has been supported by the National Institute of Health (NIH grant nos. R01 DK087635, R01DK076077 and R01DK105821 to K.S.).
Footnotes
Competing interests
The laboratory of Dr. Susztak receives funding from GSK, Regeneron, Gilead, Merck, Boehringer Ingelheim, Bayer, Novartis Maze, Jnana, Ventus and Novo Nordisk. The funders had no influence on the data analysis. Dr. Susztak serves on the SAB of Jnana pharmaceuticals and receives equity. Dr. Ritchie serves on the SAB for Goldfinch Bio and Cipherome. The other authors declare no competing interests.
Code availability
Custom code used in this study is available at github (https://github.com/hbliu/Kidney_Epi_Pri) and Zenodo (https://doi.org/10.5281/zenodo.6392494)91.
Data availability
The data of eGFRcrea GWAS, kidney meQTL, and kidney eQTL produced in this study are publicly available online at the Susztaklab Kidney Biobank (https://susztaklab.com/GWAS/; https://susztaklab.com/Kidney_meQTL/; https://susztaklab.com/Kidney_eQTL/) and figshare (https://doi.org/10.6084/m9.figshare.1518349590). The GWAS summary statistics are also available at the GWAS Catalog (Accession GCST90100220). The RNA-seq and human kidney snTAC-seq data have been deposited with the Gene Expression Omnibus under accession numbers (GSE115098, GSE173343, GSE172008 and GSE200547) and the Common Metabolic Diseases Genome Atlas (https://cmdga.org/search/?type=Experiment&searchTerm=FNIH0000000). Integrative Genomics Viewer visualization of human kidney snATAC-seq is publicly available at https://susztaklab.com/Human_snATAC/. The summary statistics of five eGFRcrea GWAS datasets used for GWAS meta-analysis were obtained from consortium websites (Download links provided in Supplementary Table 1). No consent was obtained to share individual-level genotype data for kidney samples. There is no mechanism to obtain consent since kidney tissue was collected as medical discard and the samples were permanently de-identified. Summary statistic for GWAS heritability analysis were obtained from the Alkes Price lab (https://alkesgroup.broadinstitute.org/LDSCORE/independent_sumstats/)37. Mouse kidney snATAC-seq data were obtained from GEO (GSE157079)60 and Mouse kidney scRNA-seq data were obtained from GEO (GSE107585)56. Drug-Gene interactions were identified using the Drug Gene Interaction Database (DGIdb v4.2.0, https://www.dgidb.org/)45.
References
- 1.Collaboration GBDCKD Global, regional, and national burden of chronic kidney disease, 1990–2017: a systematic analysis for the Global Burden of Disease Study 2017. Lancet 395, 709–733 (2020). [DOI] [PMC free article] [PubMed] [Google Scholar]
- 2.Kottgen A et al. Multiple loci associated with indices of renal function and chronic kidney disease. Nat Genet 41, 712–7 (2009). [DOI] [PMC free article] [PubMed] [Google Scholar]
- 3.Pattaro C et al. Genetic associations at 53 loci highlight cell types and biological pathways relevant for kidney function. Nat Commun 7, 10023 (2016). [DOI] [PMC free article] [PubMed] [Google Scholar]
- 4.Wuttke M et al. A catalog of genetic loci associated with kidney function from analyses of a million individuals. Nat Genet 51, 957–972 (2019). [DOI] [PMC free article] [PubMed] [Google Scholar]
- 5.Hellwege JN et al. Mapping eGFR loci to the renal transcriptome and phenome in the VA Million Veteran Program. Nat Commun 10, 3842 (2019). [DOI] [PMC free article] [PubMed] [Google Scholar]
- 6.Sullivan KM & Susztak K Unravelling the complex genetics of common kidney diseases: from variants to mechanisms. Nat Rev Nephrol 16, 628–640 (2020). [DOI] [PMC free article] [PubMed] [Google Scholar]
- 7.Qiu C et al. Renal compartment-specific genetic variation analyses identify new pathways in chronic kidney disease. Nat Med 24, 1721–1731 (2018). [DOI] [PMC free article] [PubMed] [Google Scholar]
- 8.Consortium GT The GTEx Consortium atlas of genetic regulatory effects across human tissues. Science 369, 1318–1330 (2020). [DOI] [PMC free article] [PubMed] [Google Scholar]
- 9.Ko YA et al. Genetic-Variation-Driven Gene-Expression Changes Highlight Genes with Important Functions for Kidney Disease. Am J Hum Genet 100, 940–953 (2017). [DOI] [PMC free article] [PubMed] [Google Scholar]
- 10.Gillies CE et al. An eQTL Landscape of Kidney Tissue in Human Nephrotic Syndrome. Am J Hum Genet 103, 232–244 (2018). [DOI] [PMC free article] [PubMed] [Google Scholar]
- 11.Sheng X et al. Mapping the genetic architecture of human traits to cell types in the kidney identifies mechanisms of disease and potential treatments. Nat Genet 53, 1322–1333 (2021). [DOI] [PMC free article] [PubMed] [Google Scholar]
- 12.Yao DW, O’Connor LJ, Price AL & Gusev A Quantifying genetic effects on disease mediated by assayed gene expression levels. Nat Genet 52, 626–633 (2020). [DOI] [PMC free article] [PubMed] [Google Scholar]
- 13.Reik W Stability and flexibility of epigenetic gene regulation in mammalian development. Nature 447, 425–32 (2007). [DOI] [PubMed] [Google Scholar]
- 14.Boix CA, James BT, Park YP, Meuleman W & Kellis M Regulatory genomic circuitry of human disease loci by integrative epigenomics. Nature 590, 300–307 (2021). [DOI] [PMC free article] [PubMed] [Google Scholar]
- 15.Jones PA Functions of DNA methylation: islands, start sites, gene bodies and beyond. Nat Rev Genet 13, 484–92 (2012). [DOI] [PubMed] [Google Scholar]
- 16.Ziller MJ et al. Charting a dynamic DNA methylation landscape of the human genome. Nature 500, 477–81 (2013). [DOI] [PMC free article] [PubMed] [Google Scholar]
- 17.Hannon E et al. Methylation QTLs in the developing brain and their enrichment in schizophrenia risk loci. Nat Neurosci 19, 48–54 (2016). [DOI] [PMC free article] [PubMed] [Google Scholar]
- 18.Chen L et al. Genetic Drivers of Epigenetic and Transcriptional Variation in Human Immune Cells. Cell 167, 1398–1414 e24 (2016). [DOI] [PMC free article] [PubMed] [Google Scholar]
- 19.Taylor DL et al. Integrative analysis of gene expression, DNA methylation, physiological traits, and genetic variation in human skeletal muscle. Proc Natl Acad Sci U S A 116, 10883–10888 (2019). [DOI] [PMC free article] [PubMed] [Google Scholar]
- 20.Wojcik GL et al. Genetic analyses of diverse populations improves discovery for complex traits. Nature 570, 514–518 (2019). [DOI] [PMC free article] [PubMed] [Google Scholar]
- 21.van Zuydam NR et al. A Genome-Wide Association Study of Diabetic Kidney Disease in Subjects With Type 2 Diabetes. Diabetes 67, 1414–1427 (2018). [DOI] [PMC free article] [PubMed] [Google Scholar]
- 22.Willer CJ, Li Y & Abecasis GR METAL: fast and efficient meta-analysis of genomewide association scans. Bioinformatics 26, 2190–1 (2010). [DOI] [PMC free article] [PubMed] [Google Scholar]
- 23.Sinnott-Armstrong N et al. Genetics of 35 blood and urine biomarkers in the UK Biobank. Nat Genet (2021). [DOI] [PMC free article] [PubMed] [Google Scholar]
- 24.Stanzick KJ et al. Discovery and prioritization of variants and genes for kidney function in >1.2 million individuals. Nat Commun 12, 4350 (2021). [DOI] [PMC free article] [PubMed] [Google Scholar]
- 25.Backman JD et al. Exome sequencing and analysis of 454,787 UK Biobank participants. Nature 599, 628–634 (2021). [DOI] [PMC free article] [PubMed] [Google Scholar]
- 26.Barton AR, Sherman MA, Mukamel RE & Loh PR Whole-exome imputation within UK Biobank powers rare coding variant association and fine-mapping analyses. Nat Genet 53, 1260–1269 (2021). [DOI] [PMC free article] [PubMed] [Google Scholar]
- 27.Kaushal GP, Haun RS, Herzog C & Shah SV Meprin A metalloproteinase and its role in acute kidney injury. Am J Physiol Renal Physiol 304, F1150–8 (2013). [DOI] [PMC free article] [PubMed] [Google Scholar]
- 28.Wen X et al. Transgenic expression of the human MRP2 transporter reduces cisplatin accumulation and nephrotoxicity in Mrp2-null mice. Am J Pathol 184, 1299–308 (2014). [DOI] [PMC free article] [PubMed] [Google Scholar]
- 29.Lu W et al. NFIA haploinsufficiency is associated with a CNS malformation syndrome and urinary tract defects. PLoS Genet 3, e80 (2007). [DOI] [PMC free article] [PubMed] [Google Scholar]
- 30.Eales JM et al. Uncovering genetic mechanisms of hypertension through multi-omic analysis of the kidney. Nat Genet 53, 630–637 (2021). [DOI] [PubMed] [Google Scholar]
- 31.Chambers BE et al. Tfap2a is a novel gatekeeper of nephron differentiation during kidney development. Development 146(2019). [DOI] [PMC free article] [PubMed] [Google Scholar]
- 32.Jonker JW, Wagenaar E, Van Eijl S & Schinkel AH Deficiency in the organic cation transporters 1 and 2 (Oct1/Oct2 [Slc22a1/Slc22a2]) in mice abolishes renal secretion of organic cations. Mol Cell Biol 23, 7902–8 (2003). [DOI] [PMC free article] [PubMed] [Google Scholar]
- 33.Sheng X et al. Systematic integrated analysis of genetic and epigenetic variation in diabetic kidney disease. Proc Natl Acad Sci U S A 117, 29013–29024 (2020). [DOI] [PMC free article] [PubMed] [Google Scholar]
- 34.Delahaye F et al. Genetic variants influence on the placenta regulatory landscape. PLoS Genet 14, e1007785 (2018). [DOI] [PMC free article] [PubMed] [Google Scholar]
- 35.Husquin LT et al. Exploring the genetic basis of human population differences in DNA methylation and their causal impact on immune gene regulation. Genome Biol 19, 222 (2018). [DOI] [PMC free article] [PubMed] [Google Scholar]
- 36.Bonder MJ et al. Disease variants alter transcription factor levels and methylation of their binding sites. Nat Genet 49, 131–138 (2017). [DOI] [PubMed] [Google Scholar]
- 37.Loh PR, Kichaev G, Gazal S, Schoech AP & Price AL Mixed-model association for biobank-scale datasets. Nat Genet 50, 906–908 (2018). [DOI] [PMC free article] [PubMed] [Google Scholar]
- 38.Hekselman I & Yeger-Lotem E Mechanisms of tissue and cell-type specificity in heritable traits and diseases. Nat Rev Genet 21, 137–150 (2020). [DOI] [PubMed] [Google Scholar]
- 39.Roadmap Epigenomics C et al. Integrative analysis of 111 reference human epigenomes. Nature 518, 317–30 (2015). [DOI] [PMC free article] [PubMed] [Google Scholar]
- 40.Ulirsch JC et al. Interrogation of human hematopoiesis at single-cell and single-variant resolution. Nat Genet 51, 683–693 (2019). [DOI] [PMC free article] [PubMed] [Google Scholar]
- 41.Pliner HA et al. Cicero Predicts cis-Regulatory DNA Interactions from Single-Cell Chromatin Accessibility Data. Mol Cell 71, 858–871 e8 (2018). [DOI] [PMC free article] [PubMed] [Google Scholar]
- 42.Groopman EE et al. Diagnostic Utility of Exome Sequencing for Kidney Disease. N Engl J Med 380, 142–151 (2019). [DOI] [PMC free article] [PubMed] [Google Scholar]
- 43.Wu Y et al. Integrative analysis of omics summary data reveals putative mechanisms underlying complex traits. Nat Commun 9, 918 (2018). [DOI] [PMC free article] [PubMed] [Google Scholar]
- 44.Nasser J et al. Genome-wide enhancer maps link risk variants to disease genes. Nature 593, 238–243 (2021). [DOI] [PMC free article] [PubMed] [Google Scholar]
- 45.Freshour SL et al. Integration of the Drug-Gene Interaction Database (DGIdb 4.0) with open crowdsource efforts. Nucleic Acids Res 49, D1144–D1151 (2021). [DOI] [PMC free article] [PubMed] [Google Scholar]
- 46.Guo D et al. Selective Inhibition on Organic Cation Transporters by Carvedilol Protects Mice from Cisplatin-Induced Nephrotoxicity. Pharm Res 35, 204 (2018). [DOI] [PMC free article] [PubMed] [Google Scholar]
- 47.Sarhan M, von Mässenhausen A, Hugo C, Oberbauer R & Linkermann A Immunological consequences of kidney cell death. Cell Death Dis 9, 114 (2018). [DOI] [PMC free article] [PubMed] [Google Scholar]
- 48.Miao N et al. The cleavage of gasdermin D by caspase-11 promotes tubular epithelial cell pyroptosis and urinary IL-18 excretion in acute kidney injury. Kidney Int 96, 1105–1120 (2019). [DOI] [PubMed] [Google Scholar]
- 49.Tsuda M et al. Targeted disruption of the multidrug and toxin extrusion 1 (mate1) gene in mice reduces renal secretion of metformin. Mol Pharmacol 75, 1280–6 (2009). [DOI] [PubMed] [Google Scholar]
- 50.Vilaysane A et al. The NLRP3 inflammasome promotes renal inflammation and contributes to CKD. J Am Soc Nephrol 21, 1732–44 (2010). [DOI] [PMC free article] [PubMed] [Google Scholar]
- 51.Xu Y et al. A Role for Tubular Necroptosis in Cisplatin-Induced AKI. J Am Soc Nephrol 26, 2647–58 (2015). [DOI] [PMC free article] [PubMed] [Google Scholar]
- 52.Mulay SR, Linkermann A & Anders HJ Necroinflammation in Kidney Disease. J Am Soc Nephrol 27, 27–39 (2016). [DOI] [PMC free article] [PubMed] [Google Scholar]
- 53.Gamazon ER et al. Using an atlas of gene regulation across 44 human tissues to inform complex disease- and trait-associated variation. Nat Genet 50, 956–967 (2018). [DOI] [PMC free article] [PubMed] [Google Scholar]
- 54.Li YI et al. RNA splicing is a primary link between genetic variation and disease. Science 352, 600–4 (2016). [DOI] [PMC free article] [PubMed] [Google Scholar]
- 55.Zhang Z et al. Genetic analyses support the contribution of mRNA N(6)-methyladenosine (m(6)A) modification to human disease heritability. Nat Genet 52, 939–949 (2020). [DOI] [PMC free article] [PubMed] [Google Scholar]
- 56.Park J et al. Single-cell transcriptomics of the mouse kidney reveals potential cellular targets of kidney disease. Science 360, 758–763 (2018). [DOI] [PMC free article] [PubMed] [Google Scholar]
- 57.Li Y et al. Integration of GWAS Summary Statistics and Gene Expression Reveals Target Cell Types Underlying Kidney Function Traits. J Am Soc Nephrol 31, 2326–2340 (2020). [DOI] [PMC free article] [PubMed] [Google Scholar]
- 58.Fairfax BP et al. Innate immune activity conditions the effect of regulatory variants upon monocyte gene expression. Science 343, 1246949 (2014). [DOI] [PMC free article] [PubMed] [Google Scholar]
- 59.Guan Y et al. Dnmt3a and Dnmt3b-Decommissioned Fetal Enhancers are Linked to Kidney Disease. J Am Soc Nephrol 31, 765–782 (2020). [DOI] [PMC free article] [PubMed] [Google Scholar]
- 60.Miao Z et al. Single cell regulatory landscape of the mouse kidney highlights cellular differentiation programs and disease targets. Nat Commun 12, 2277 (2021). [DOI] [PMC free article] [PubMed] [Google Scholar]
- 61.Sveinbjornsson G et al. Rare mutations associating with serum creatinine and chronic kidney disease. Hum Mol Genet 23, 6935–43 (2014). [DOI] [PubMed] [Google Scholar]
- 62.Levey AS et al. A new equation to estimate glomerular filtration rate. Ann Intern Med 150, 604–12 (2009). [DOI] [PMC free article] [PubMed] [Google Scholar]
Methods-only references
- 63.Purcell S et al. PLINK: a tool set for whole-genome association and population-based linkage analyses. Am J Hum Genet 81, 559–75 (2007). [DOI] [PMC free article] [PubMed] [Google Scholar]
- 64.Delaneau O, Zagury J-F & Marchini J Improved whole-chromosome phasing for disease and population genetic studies. Nature methods 10, 5 (2013). [DOI] [PubMed] [Google Scholar]
- 65.Howie BN, Donnelly P & Marchini J A flexible and accurate genotype imputation method for the next generation of genome-wide association studies. PLoS genetics 5, e1000529 (2009). [DOI] [PMC free article] [PubMed] [Google Scholar]
- 66.Howie B, Marchini J & Stephens M Genotype imputation with thousands of genomes. G3 (Bethesda) 1, 457–70 (2011). [DOI] [PMC free article] [PubMed] [Google Scholar]
- 67.Zhou W, Triche TJ Jr., Laird PW & Shen H SeSAMe: reducing artifactual detection of DNA methylation by Infinium BeadChips in genomic deletions. Nucleic Acids Res 46, e123 (2018). [DOI] [PMC free article] [PubMed] [Google Scholar]
- 68.Dobin A et al. STAR: ultrafast universal RNA-seq aligner. Bioinformatics 29, 15–21 (2013). [DOI] [PMC free article] [PubMed] [Google Scholar]
- 69.Li B & Dewey CN RSEM: accurate transcript quantification from RNA-Seq data with or without a reference genome. BMC bioinformatics 12, 323 (2011). [DOI] [PMC free article] [PubMed] [Google Scholar]
- 70.Fang R et al. Comprehensive analysis of single cell ATAC-seq data with SnapATAC. Nat Commun 12, 1337 (2021). [DOI] [PMC free article] [PubMed] [Google Scholar]
- 71.Stouffer SA, Suchman EA, Devinney LC, Star SA & Williams RM Jr The American soldier: Adjustment during army life. (Studies in social psychology in World War II), Vol. 1, xii, 599–xii, 599 (Princeton Univ. Press, Oxford, England, 1949). [Google Scholar]
- 72.Chu AY et al. Multiethnic genome-wide meta-analysis of ectopic fat depots identifies loci associated with adipocyte development and differentiation. Nat Genet 49, 125–130 (2017). [DOI] [PMC free article] [PubMed] [Google Scholar]
- 73.Zhu Z et al. Integration of summary data from GWAS and eQTL studies predicts complex trait gene targets. Nat Genet 48, 481–7 (2016). [DOI] [PubMed] [Google Scholar]
- 74.McLean CY et al. GREAT improves functional interpretation of cis-regulatory regions. Nat Biotechnol 28, 495–501 (2010). [DOI] [PMC free article] [PubMed] [Google Scholar]
- 75.Yang J et al. FTO genotype is associated with phenotypic variability of body mass index. Nature 490, 267–72 (2012). [DOI] [PMC free article] [PubMed] [Google Scholar]
- 76.Shabalin AA Matrix eQTL: ultra fast eQTL analysis via large matrix operations. Bioinformatics 28, 1353–8 (2012). [DOI] [PMC free article] [PubMed] [Google Scholar]
- 77.Stegle O, Parts L, Durbin R & Winn J A Bayesian framework to account for complex non-genetic factors in gene expression levels greatly increases power in eQTL studies. PLoS Comput Biol 6, e1000770 (2010). [DOI] [PMC free article] [PubMed] [Google Scholar]
- 78.Ongen H, Buil A, Brown AA, Dermitzakis ET & Delaneau O Fast and efficient QTL mapper for thousands of molecular phenotypes. Bioinformatics 32, 1479–85 (2016). [DOI] [PMC free article] [PubMed] [Google Scholar]
- 79.Storey JD & Tibshirani R Statistical significance for genomewide studies. Proc Natl Acad Sci U S A 100, 9440–5 (2003). [DOI] [PMC free article] [PubMed] [Google Scholar]
- 80.Han B & Eskin E Interpreting meta-analyses of genome-wide association studies. PLoS Genet 8, e1002555 (2012). [DOI] [PMC free article] [PubMed] [Google Scholar]
- 81.Frankish A et al. GENCODE reference annotation for the human and mouse genomes. Nucleic Acids Res 47, D766–D773 (2019). [DOI] [PMC free article] [PubMed] [Google Scholar]
- 82.Giambartolomei C et al. Bayesian test for colocalisation between pairs of genetic association studies using summary statistics. PLoS Genet 10, e1004383 (2014). [DOI] [PMC free article] [PubMed] [Google Scholar]
- 83.Giambartolomei C et al. A Bayesian framework for multiple trait colocalization from summary association statistics. Bioinformatics 34, 2538–2545 (2018). [DOI] [PMC free article] [PubMed] [Google Scholar]
- 84.Watanabe K, Taskesen E, van Bochoven A & Posthuma D Functional mapping and annotation of genetic associations with FUMA. Nat Commun 8, 1826 (2017). [DOI] [PMC free article] [PubMed] [Google Scholar]
- 85.Huang da W, Sherman BT & Lempicki RA Systematic and integrative analysis of large gene lists using DAVID bioinformatics resources. Nat Protoc 4, 44–57 (2009). [DOI] [PubMed] [Google Scholar]
- 86.Bycroft C et al. The UK Biobank resource with deep phenotyping and genomic data. Nature 562, 203–209 (2018). [DOI] [PMC free article] [PubMed] [Google Scholar]
- 87.Park J et al. Exome-wide evaluation of rare coding variants using electronic health records identifies new gene-phenotype associations. Nat Med 27, 66–72 (2021). [DOI] [PMC free article] [PubMed] [Google Scholar]
- 88.Carroll RJ, Bastarache L & Denny JC R PheWAS: data analysis and plotting tools for phenome-wide association studies in the R environment. Bioinformatics 30, 2375–6 (2014). [DOI] [PMC free article] [PubMed] [Google Scholar]
- 89.Li Q, Peng X, Yang H, Wang H & Shu Y Deficiency of multidrug and toxin extrusion 1 enhances renal accumulation of paraquat and deteriorates kidney injury in mice. Mol Pharm 8, 2476–83 (2011). [DOI] [PMC free article] [PubMed] [Google Scholar]
- 90.Liu H et al. Epigenomic and transcriptomic analyses define core cell types, genes and targetable mechanisms for kidney disease (Data Set). (figshare 10.6084/m9.figshare.15183495, 2022). [DOI] [PMC free article] [PubMed] [Google Scholar]
- 91.Liu H et al. Epigenomic and transcriptomic analyses define core cell types, genes and targetable mechanisms for kidney disease (Code). (Zenodo 10.5281/zenodo.6392494, 2022). [DOI] [PMC free article] [PubMed] [Google Scholar]
Associated Data
This section collects any data citations, data availability statements, or supplementary materials included in this article.
Supplementary Materials
Data Availability Statement
The data of eGFRcrea GWAS, kidney meQTL, and kidney eQTL produced in this study are publicly available online at the Susztaklab Kidney Biobank (https://susztaklab.com/GWAS/; https://susztaklab.com/Kidney_meQTL/; https://susztaklab.com/Kidney_eQTL/) and figshare (https://doi.org/10.6084/m9.figshare.1518349590). The GWAS summary statistics are also available at the GWAS Catalog (Accession GCST90100220). The RNA-seq and human kidney snTAC-seq data have been deposited with the Gene Expression Omnibus under accession numbers (GSE115098, GSE173343, GSE172008 and GSE200547) and the Common Metabolic Diseases Genome Atlas (https://cmdga.org/search/?type=Experiment&searchTerm=FNIH0000000). Integrative Genomics Viewer visualization of human kidney snATAC-seq is publicly available at https://susztaklab.com/Human_snATAC/. The summary statistics of five eGFRcrea GWAS datasets used for GWAS meta-analysis were obtained from consortium websites (Download links provided in Supplementary Table 1). No consent was obtained to share individual-level genotype data for kidney samples. There is no mechanism to obtain consent since kidney tissue was collected as medical discard and the samples were permanently de-identified. Summary statistic for GWAS heritability analysis were obtained from the Alkes Price lab (https://alkesgroup.broadinstitute.org/LDSCORE/independent_sumstats/)37. Mouse kidney snATAC-seq data were obtained from GEO (GSE157079)60 and Mouse kidney scRNA-seq data were obtained from GEO (GSE107585)56. Drug-Gene interactions were identified using the Drug Gene Interaction Database (DGIdb v4.2.0, https://www.dgidb.org/)45.


