Abstract
The prevalence and nature of somatic copy number alterations (CNAs) in breast epithelium and their role in tumor initiation and evolution remain poorly understood. Using single-cell DNA sequencing (49,238 cells) of epithelium from BRCA1 and BRCA2 carriers or wild-type individuals, we identified recurrent CNAs (for example, 1q-gain and 7q, 10q, 16q and 22q-loss) that are present in a rare population of cells across almost all samples (n = 28). In BRCA1/BRCA2 carriers, these occur before loss of heterozygosity (LOH) of wild-type alleles. These CNAs, common in malignant tumors, are enriched in luminal cells but absent in basal myoepithelial cells. Allele-specific analysis of prevalent CNAs reveals that they arose by independent mutational events, consistent with convergent evolution. BRCA1/BRCA2 carriers contained a small percentage of cells with extreme aneuploidy, featuring loss of TP53, BRCA1/BRCA2 LOH and multiple breast cancer-associated CNAs. Our findings suggest that CNAs arising in normal luminal breast epithelium are precursors to clonally expanded tumor genomes.
Subject terms: Breast cancer, Genome informatics
Single-cell DNA sequencing identifies recurrent copy number changes in healthy breast tissue from women with wild-type or germline BRCA1 or BRCA2 mutations.
Main
Somatic mutations are known to accumulate in normal tissues over time and, although the vast majority are inconsequential, contribute to cancer1–4. Most studies have measured and emphasized the role of single-nucleotide variants (SNVs) in normal tissues. Yet gene dosage mutations due to somatic copy number alterations (CNAs) occur in the majority of tumor types5,6 and are highly prevalent in breast cancers7–9, contributing important driver events such as ERBB2 amplification and PTEN loss. They also represent the dominant source of transcriptional variation in genomically unstable human cancers5,7,10–12, including breast cancer. Studies of pre-invasive ductal carcinoma in situ (DCIS) have noted that extensive CNAs and structural variants (SVs), resulting from duplication or loss of whole chromosome or chromosome segments, are already present with a landscape largely indistinguishable from invasive cancers13,14. Early precancer atypical ductal hyperplasias are also noted to have extensive CNA mutations15,16. These findings indicate that CNAs arise early in the evolution of breast cancer; however, a full understanding of the prevalence, evolutionary timing and distribution of the earliest CNAs arising in morphologically normal breast epithelium is lacking.
The vast majority of SNV mutations are private to single cells or form small clonal expansions that would be obscured by bulk short-read sequencing of tissues. We posit this is also the case for CNAs. Recent studies of SNVs in normal tissues have successfully used a combination of ultra-deep error-corrected sequencing17 or experimental cloning amplification of single cells subsequently characterized with bulk short-read next-generation sequencing18,19 to bypass these barriers. However, the prevalence of CNAs in most normal cells may be an order of magnitude or more lower than SNVs, and thus comprehensive characterization of CNAs is inaccessible to these approaches. A few studies have attempted to discover somatic CNAs in normal tissues20–24 by reanalyzing bulk sequencing data but have been limited to analysis of blood or to detecting large clonally expanded populations carrying CNAs. One study24 identified eight breast samples harboring CNAs using bulk RNA sequencing, which only permits the detection of high-frequency alterations, thus precluding the ability to define the underlying generative process of CNAs in individual cells. We have overcome these limitations by developing methods for scaled single-cell whole-genome sequencing (scWGS)25,26, which allow for the discovery of CNAs unique to single cells in thousands of individual genomes. By sampling without restriction directly from tissues, the progeny of single mitotic mutational events leading to cell-specific alterations can be ascertained.
Here we investigate the prevalence of CNAs in normal breast epithelial tissues at single-cell resolution to identify the earliest genetic alterations using Direct Library Preperation+ (DLP+) scWGS. We reveal the prevalence, chromosomal distribution and lineage specificity of CNA mutations in breast tissues from high-risk BRCA1/BRCA2 germline mutation carriers and contrast with BRCA-wild-type (WT) epithelium.
Results
Low CNA prevalence in normal mammary epithelia is cell type dependent
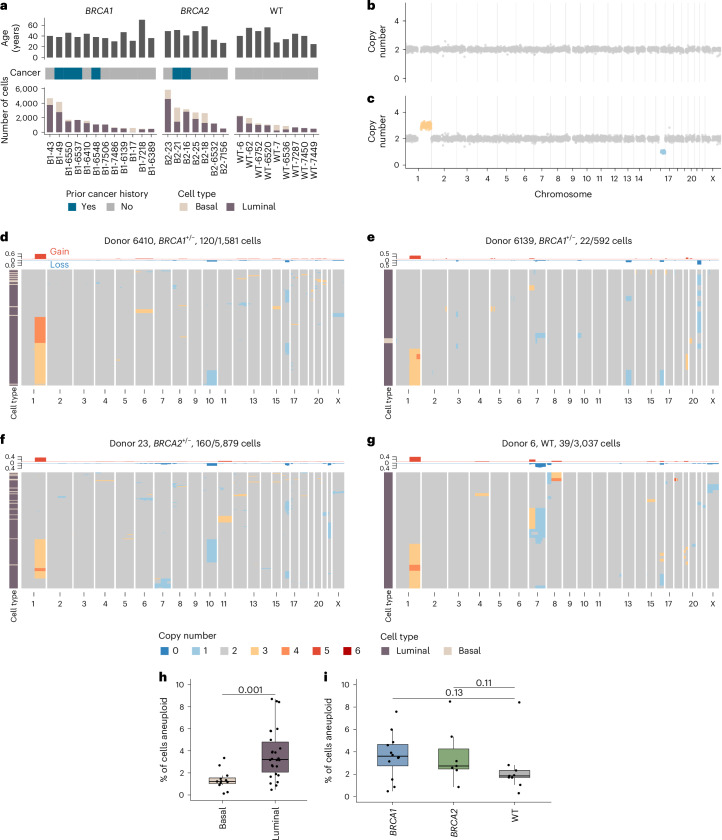
To assess the distribution and prevalence of CNAs in single breast epithelial cells of individuals with germline breast cancer predisposition alleles, we obtained breast tissues from women carrying germline pathogenic mutations in BRCA1 (n = 12) and BRCA2 (n = 7) undergoing risk-reducing surgery, as well as from those with the BRCA1/BRCA2 WT genotype (n = 9) from reductive mammoplasties. Some women had a history of breast cancer or other cancers and had previously undergone chemotherapy (Fig. 1a and see Supplementary Table 1 for all clinical details). For patients with a history of breast cancer, tissue was acquired from the contralateral breast. Macroscopically normal tissue was allocated for research purposes. Microscopic examination of representative formalin-fixed paraffin-embedded (FFPE) blocks of clinical and/or research tissue revealed no atypical hyperplasia or in situ carcinoma in 22/28 participants. Representative tissue samples from six donors revealed small foci (<1–2 mm) of in situ carcinoma or atypical hyperplasia—B2-16 (ductal carcinoma in-situ, DCIS), WT-7 (atypical ductal hyperplasia), WT-6752 (atypical lobular hyperplasia, ALH), B2-21 (ALH), B2-23 (lobular carcinoma in-situ, LCIS), B1-7218 (LCIS; Supplementary Table 1). Tissue samples were then dissociated into single cells, sorted into luminal and basal cell populations based on previously established surface markers27–29 (Methods) and the single-cell genomes were sequenced to an average genome-wide coverage of 0.030× using the DLP+ protocol25 (range = 0.001–0.361; Supplementary Table 2). At the sequencing depth used in this study, DLP+ detects copy number variations at 500 kb to megabase-scale resolution, enabling the identification of whole chromosome and chromosome-arm aneuploidies, high-level amplifications and complex genome rearrangements in single cells25,30–33. After removing low-quality genomes and discarding samples with fewer than 300 cells, 49,238 single-cell genomes from 28 donors were analyzed (Fig. 1a). Example genome-wide copy number profiles from a diploid genome and aneuploid genome are shown in Fig. 1b,c.
Fig. 1. Cohort summary and example CNA heatmaps.
a, Number of high-quality cells per sample per cell type along with cancer history and patient ages. b, Example diploid cell. c, Example aneuploid cell with chr1q gain (yellow) and chr16q loss (blue). d, Heatmap of aneuploid cells from donor B1-6410. Title shows the donor name, genotype and number of aneuploid cells out of the total number of cells. Above the heatmap is the frequency of gains and losses across the genome, and the left-hand side track annotates the two cell types (basal and luminal). e, Heatmap of aneuploid cells from donor B1-6550. f, Heatmap of aneuploid cells from donor B2-23. g, Heatmap of aneuploid cells from donor WT-6. h, Percentage of cells aneuploid between luminal (n = 26 samples) and basal (n = 12 samples) cell types. i, Percentage of cells aneuploid between BRCA1 (n = 12), BRCA2 (n = 7) and WT (n = 9) genotypes. In h and j, P values are from the two-sided Wilcoxon rank-sum test between groups. Box plots indicate the median, first and third quartiles (hinges) and the most extreme data points no farther than 1.5× IQR from the hinge (whiskers). IQR, interquartile range.
Aneuploid cells, defined as cells with at least one chromosome arm level gain or loss, were rare but observed in every sample. Overall, 3.25% of cells (range = 0.2–8.5%) contained between one and four aneuploid chromosome arms (simple aneuploidy). Notably, specific alterations such as gains of 1q and losses on 16q, 10q, 22q and 7q were recurrent across donors, as illustrated in the following four representative samples shown in Fig. 1d–g: two BRCA1+/− (B1-6410 and B1-6139), one BRCA2+/− (B2-23) and one WT (WT-6). Similar patterns were observed in all other donors (Supplementary Figs. 1–3). These results indicate that cells carrying a specific subset of CNAs accumulate in ostensibly normal breast epithelial cells.
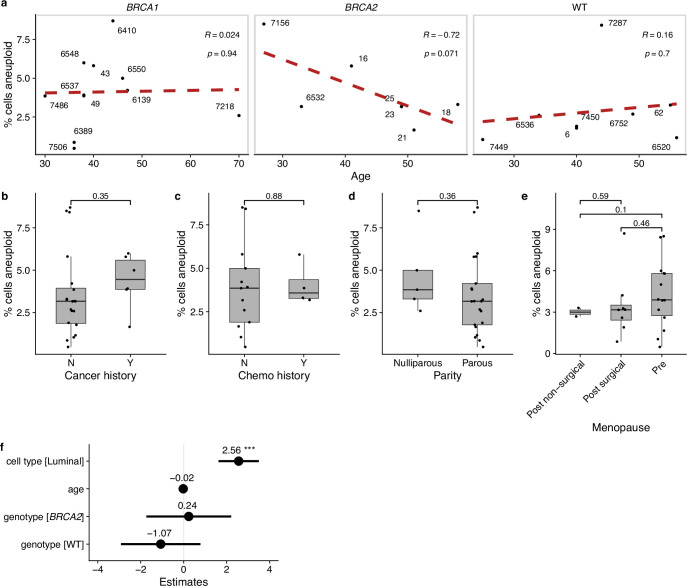
Aneuploid cells overall were more prevalent in luminal cells compared to basal cells (3.73% versus 1.38%, P = 0.001, Wilcoxon rank-sum test; Fig. 1h) and trended higher in BRCA carrier donors compared to WT donors with a rate of 3.63% in BRCA1 and 3.65% in BRCA2 compared with 2.45% in WT donors (P = 0.13 and P = 0.11 respectively, Wilcoxon rank-sum test; Fig. 1i)). We did not find any significant associations with other clinical covariates, including age, parity, menopause status or cancer history (Extended Data Fig. 1a–e). We note that we did not observe any enrichment of aneuploid cells in the small subset (n = 4/28) of the donors that received chemotherapy due to previous cancer history. In a multivariate regression that included age, genotype and cell type, luminal cells were associated with an increase in aneuploidy (P = 0.0002, linear mixed-effect model); no other groups showed a statistically significant association (Extended Data Fig. 1f).
Extended Data Fig. 1. Clinical and biological associations with aneuploidy.
a, Scatter plot of percentage of cells aneuploid vs age stratified by genotype. Red dashed lines are the linear regression line. Inset text (here refers to R = 0.024 p = 0.94, etc.) shows correlation coefficient and p-value from Pearson correlation test. Distribution of percentage of cells aneuploid for other clinical covariates: b, cancer history (# per group: Y = 6, N = 22); c, chemotherapy history (# per group: Y = 4, N = 13); d, parity (# per group: parous = 22, nulliparous = 6); e, menopause status (# per group: pre = 15, post surgical = 8, post non-surgical = 2). Plots annotated with p-values from two-sided Wilcoxon rank-sum test. Box plots indicate the median, first and third quartiles (hinges) and the most extreme data points no farther than 1.5× the IQR from the hinge (whiskers). f, Coefficients of linear multivariate mixed-effect model of the percentage of aneuploidy as a function of genotype, cell type and age. Lines show 95% confidence interval, circles show point estimate of the coefficients. ***p < 0.001.
Recurrent CNAs in luminal cells are similar to breast cancers
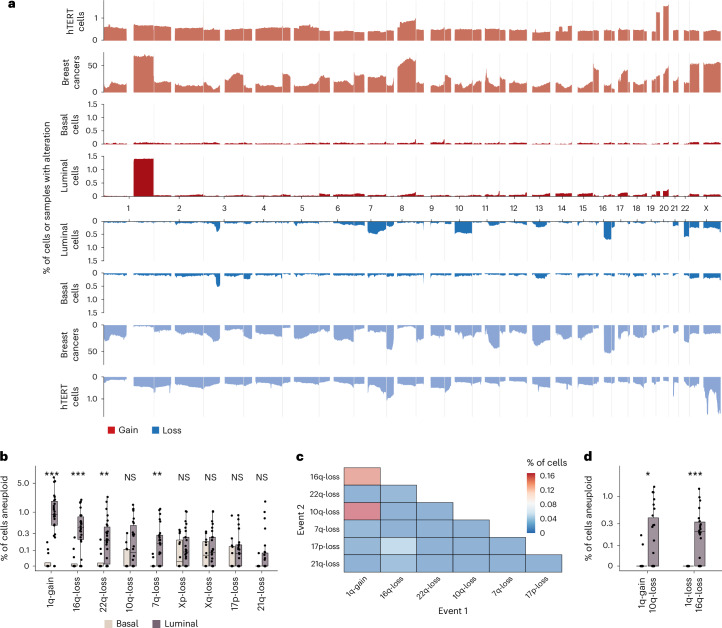
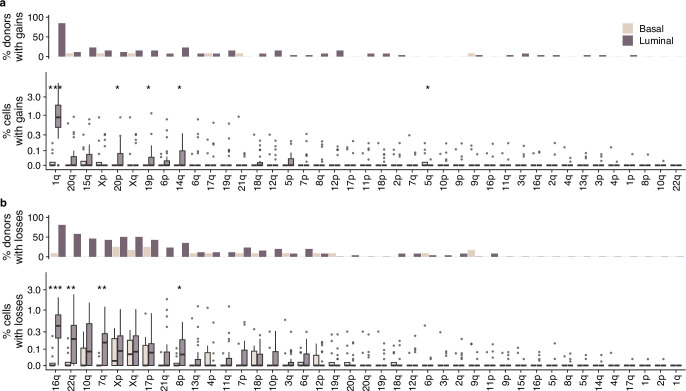
Next, we analyzed the distribution of CNAs across the genome and between cell types. Luminal and basal cells had distinct distributions of CNAs. CNAs observed recurrently across patients were restricted to luminal cells (Fig. 2a and Extended Data Fig. 2). These included a gain of 1q, the most common observed alteration (1.53% in luminal versus 0.03% in basal, P = 0.00002, Wilcoxon rank-sum test), loss of 16q (0.61% versus 0.03%, P = 0.00011), loss of 22q (0.39% versus 0.03%, P = 0.0022), loss of 7q (0.26% versus 0.01%, P = 0.0011) and loss of 10q (0.31% versus 0.07%, P = 0.083; Fig. 2b and Extended Data Fig. 2). Loss of chromosome X was also common but occurred at similar rates in both luminal and basal cell types (0.20% versus 0.11%, P = 0.58; Fig. 2a,b and Extended Data Fig. 2). Because chromosome X loss has been shown to increase with age and preferentially involve the inactive copy22, it is likely a selectively neutral event that would explain the approximately equal rate of loss in the two cell types. We did not identify any alterations that were statistically significantly more prevalent in basal cells compared to luminal cells.
Fig. 2. CNA landscape across cell types and in breast cancers.
a, Frequency of gains (red) and losses (blue) across the cohort; y axis is a fraction of cells or samples that have gains/losses. Three cohorts are shown. hTERT cells, 13,569 cells from an immortalized mammary epithelial cell line; breast cancers, 555 whole-genome sequence cancers from ref. 34; scWGS of luminal and basal cells from this study. The frequency of gains and losses for the scWGS data generated in this study are shown with a darker shade of red/blue. b, Percentage of cells aneuploid per patient split by luminal (n = 26 samples) and basal (n = 12 samples) cells for the nine most common chromosome alterations (mean percentage > 0.1%). Exact P values are as follows: gain of 1q (P = 0.00002), loss of 16q (P = 0.00011), loss of 22q (P = 0.0021), loss of 7q (P = 0.001), loss of 10q (P = 0.083), loss of Xp (P = 0.37), loss of Xq (P = 0.58), loss of 17p (P = 0.49) and loss of 21q (P = 0.057). c, Co-occurrence heatmap showing the percentage of cells that have two chromosomal aneuploidies concurrently for common alterations. d, Percentage of cells that have gain of 1q/loss of 16q and gain of 1q/loss of 10q per cell type (n = 26 luminal samples and n = 12 basal samples). Exact P values are as follows: gain of 1q/loss of 10q (P = 0.048) and gain of 1q/loss of 16q (P = 0.00026). Box plots indicate the median, first and third quartiles (hinges) and the most extreme data points no farther than 1.5× IQR from the hinge (whiskers). Asterisk indicates P values from the two-sided Wilcoxon rank-sum test: ***P < 0.001, **P < 0.01, *P < 0.05 in b and d. NS, not significant.
Extended Data Fig. 2. Prevalence of arm alterations per cell type.
a, Top: percentage of donors that have >1 cell with chromosome arm gained per cell type. Bottom: percentage of cells with gains per cell type (n = 12 basal samples, n = 26 luminal samples), each data point is a donor. b, Top: percentage of donors that have >1 cell with chromosome arm lost per cell type. Bottom: percentage of cells with losses per cell type (n = 12 basal samples, n = 26 luminal samples); each data point is a donor. Stars indicate p-values from two-sided Wilcoxon rank-sum test: ***p < 0.001, **p < 0.01, *p < 0.05. When no star is shown above comparisons, differences are not significant (p > 0). Box plots indicate the median, first and third quartiles (hinges) and the most extreme data points no farther than 1.5× the IQR from the hinge (whiskers). No adjustments for multiple comparisons were performed.
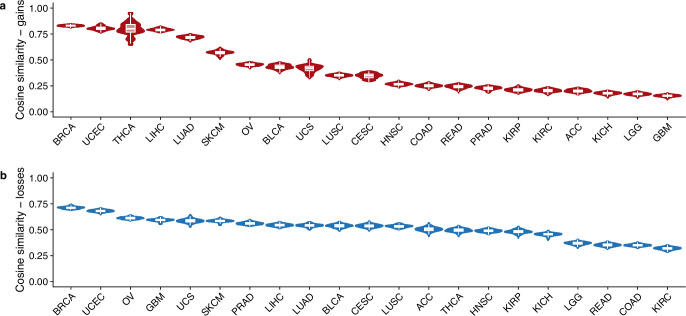
To assess how these patterns compare to those from invasive breast cancers, we compared the normal tissue CNA chromosomal distribution to 555 whole-genome sequenced breast cancers from ref. 34. A number of events that were common in the luminal cell population were also common in advanced cancers, including the gains of 1q and losses of 16q and 22q (Fig. 2a). Loss of 7q, which is common in our normal epithelium dataset, was comparatively rare in breast cancers (Fig. 2a). Conversely, there are some events, such as gains of 8q and 16p and loss of 11q, that are very common in breast cancers but are rare in normal breast epithelium. Computing the cosine similarity between normal tissue CNA distributions and all cancer types present in The Cancer Genome Atlas (TCGA), we found that breast cancers were the most similar cancer type for both gains and losses (Extended Data Fig. 3a,b). We note the similarity to some other cancer types, which reflects the fact that some of the common alterations (for example, gain of 1q) are also prevalent in other cancer types.
Extended Data Fig. 3. Cosine similarity with TCGA cancer subtypes.
Cosine similarity between landscape of CNAs in scWGS of normal breast epithelia and TCGA subtypes for gains (a) and losses (b). Plot shows the distribution over bootstrapped values (n = 25) as described in Methods. Box plots indicate the median, first and third quartiles (hinges) and the most extreme data points no farther than 1.5× the IQR from the hinge (whiskers).
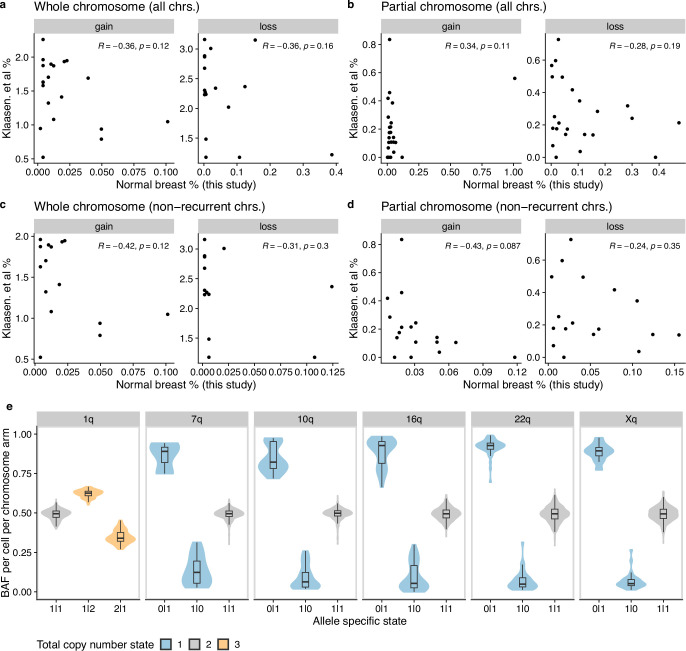
To determine whether the recurrent CNAs could be explained by underlying mutational bias, we compared our findings with the CNA distribution observed in 13,569 single-cell genomes from a WT immortalized breast tissue cell line (human telomerase reverse transcriptase (hTERT) cells). In contrast to the scWGS from normal breast epithelium, the distribution of CNAs in this cell line was relatively uniform across the genome (Fig. 2a). The prevalence and pattern of alterations were also different than those in a recent study that showed that mis-segregation rates are influenced by nuclear chromosome locations35 (Extended Data Fig. 4a–d). This suggests that the higher prevalence of CNAs within certain chromosomes in normal breast epithelium is a tissue- and cell-type-specific process, potentially linked to lineage differentiation and/or epithelial cell orientation within a tissue context36.
Extended Data Fig. 4. Comparison with ref. 35 and BAF distributions.
Aneuploidy rates per chromosome reported in ref. 35 vs this study. Analysis was performed separately for (a) whole chromosome events across all chromosomes, (b) partial chromosome events across all chromosomes, (c) whole chromosome events across non-recurrent chromosomes and (d) partial chromosome events across all non-recurrent chromosomes. Non-recurrent chromosomes are all chromosomes after removing chromosomes 1,7,10,16,22 and X. Each plot shows the Pearson correlation coefficient and associated p-value. Normal breast percentages are from all cells (luminal and basal cell populations). e, B allele frequency (BAF) distributions in chromosome arms across cells, stratified by allele-specific state. Non-diploid states are strongly skewed toward either 0.0 or 1.0 depending on which allele is gained/lost thus supporting the total copy number calls. Included are all cells in the dataset with these alterations. Box plots indicate the median, first and third quartiles (hinges) and the most extreme data points no farther than 1.5× the IQR from the hinge (whiskers). Number of cells included for each chromosome 1q: 1145, 7q: 1175, 10q: 1233, 16q:1191, 22q:1234, Xq: 1205.
Among cells that had more than one aneuploid chromosome arm, the most frequent events were gain of 1q/loss of 16q (present in 18 donors) and gain of 1q/loss of 10q (present in 13 donors; Fig. 2c). Both combinations were enriched in luminal cells with average frequencies of 0.29% (gain of 1q/loss of 16q) and 0.27% (gain of 1q/loss of 10q; Fig. 2d). Interestingly, loss of 10q was only ever observed in conjunction with gain of 1q, while loss of 16q was frequently observed in isolation (Supplementary Figs. 1–3). These data are consistent with a recent report37 that showed that clones carrying gain of 1q/loss of 16q events are precursors that emerge decades before cancer diagnosis.
Allele-specific alterations reveal multiple independent CNAs
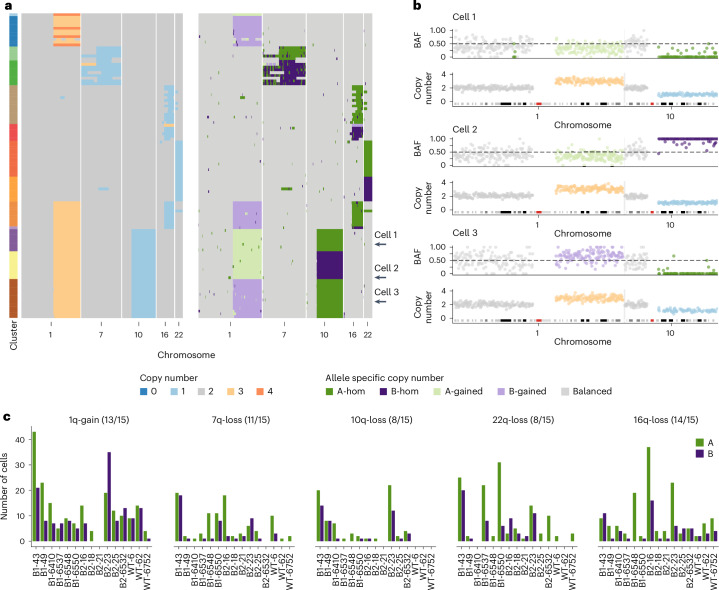
To address whether the recurrent aneuploidies that we observed arose from single clonal expansions or constituted multiple independent events, we phased chromosome gains and losses to parental alleles (here defined arbitrarily as allele A or B) using SIGNALS31. SIGNALS is a hidden Markov model that uses a measure of allelic imbalance derived from phased germline SNPs that are genotyped in single cells to infer the most likely allele-specific profile given a cell’s total copy number profile (Methods). Observing gains and losses of both alleles would indicate that these events had been acquired independently more than once and give a lower bound on the number of events.
We applied SIGNALS to 15 samples with a large number of aneuploid cells and confirmed that allelic distributions aggregated across chromosome arms are strongly skewed in individual cells as expected (Extended Data Fig. 4e). We found evidence that CNAs were independently acquired across all samples. For example, B2-23 had aneuploid cells with all the frequent CNAs (gain of 1q, loss of 7q, loss of 10q, loss of 16q and loss of 22q) and also several cells with both gain of 1q/loss of 10q and gain of 1q/loss of 16q (Fig. 3a). Allele-specific copy number analysis revealed gains and losses on each allele, indicating each event must have been acquired independently at least twice (Fig. 3a). In the case of cells with gain of 1q/loss of 10q, we could infer the following three separate configurations: 1q(A-gain)–10q(B-loss), 1q(B-gain)–10q(B-loss) and 1q(B-gain)–10q(A-loss) (Fig. 3b). Similarly, for cells with 1q-gain/16q-loss, most had lost the B allele on 16q, but we identified one cell that had lost the A allele (Fig. 3a).
Fig. 3. Allele-specific inference reveals the convergence of CNAs.
a, Total copy number heatmap and allele-specific copy number heatmap for B2-23 for chromosomes 1, 7, 19, 16 and 22. Cells are grouped into unique alterations based on allele-specific copy number. Total number of cells = 111. b, Three cells from the heatmap with chr1q gain and chr10q loss. For each cell, the BAF and copy number are shown for chromosomes 1 and 10. These three cells have distinct combinations of chr1-gain and 10 loss. Dashed line in BAF plots shows BAF = 0.5, colors in copy number and BAF plots are shown in the ‘’Copy number’ and ‘Allele specific copy number’ color legends, respectively. c, Number of cells with either allele A or B gained/lost across the six most common alterations in 15 donors. Title above each plot shows the event and the number of samples that have events on both alleles. Colors denote the allele lost or gained (green for A allele and purple for B allele). BAF, B allele frequency.
Applying the same analysis to an additional 14 samples, we found that there was evidence that the common alterations were acquired independently multiple times in the majority of cases (Fig. 3c). For example, cells with gain of 1q of both alleles were present in 13/15 samples, and losses of both alleles on 7q and 16q were observed in 11/15 and 14/15 samples, respectively (Fig. 3c). Taken together, these findings indicate that the aneuploid populations we observe are not part of a single clonal expansion but rather are consistent with multiple independent alterations, all of which are able to survive and proliferate. This suggests that maternal and paternal allele alterations may have similar fitness and phenotypic consequences, resulting in convergence due to equivalent fitness or neutral effects.
Extreme aneuploid cells are rare but present across individuals
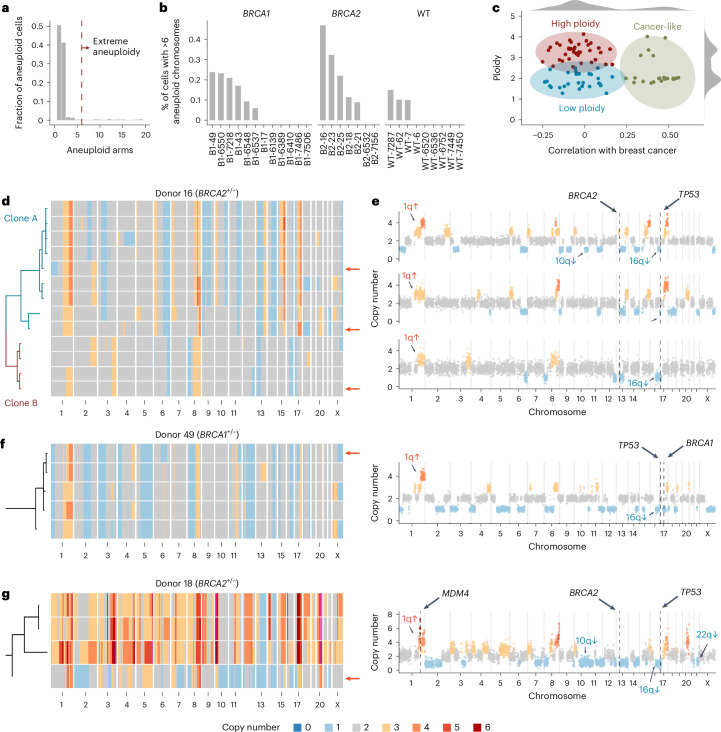
Some models of cancer evolution posit that highly aneuploid genomes of invasive breast cancers could emerge from a single catastrophic mitosis with multiple chromosomal defects as opposed to a progressive accumulation of events over multiple mitoses38. To shed light on this, we searched for cells with extreme aneuploidy. The majority of aneuploid cells have at most one or two CNAs; however, there exists a small population of cells with many CNAs (Fig. 4a). We classified extreme aneuploid cells as those exceeding six aneuploid chromosome arms, placing them in the upper 5% of the CNA burden distribution (Fig. 4a). Extreme aneuploid cells were rare but present across individuals with an average prevalence of 0.1% (range = 0–0.43%; Fig. 4b and see Extended Data Fig. 5 for heatmaps). We then calculated how similar these single-cell genomes were to the average breast cancer profile and identified 22 similar cells (Pearson correlation, ρ ≥ 0.25), labeling these ‘cancer-like’ genomes (Fig. 4c).
Fig. 4. A subset of extreme aneuploid genomes is similar to breast cancer genomes.
a, Fraction of the aneuploid cells that have n aneuploid arms. Dashed red line shows the cutoff (=6) used to classify cells having extreme aneuploidy. b, Percentage of cells in each sample with >6 aneuploid chromosomes. c, Scatter plot of ploidy versus correlation (Pearson) with cancers from ref. 34 highlighting the following three distinct groups: high ploidy, low ploidy and cancer-like. d, Heatmap of extreme aneuploid cancer-like cells in patient B2-16 ordered by a phylogenetic tree. e, Three cells from patient 16 with arrows showing their placement in the heatmap. f, Example cell and heatmap of extreme aneuploid cancer-like cells in patient B1-49. g, Example cell and heatmap of extreme aneuploid cancer-like cells in patient B2-18. For d–g, the location within the heatmap of single-cell profiles shown on the right-hand side is shown with red arrows.
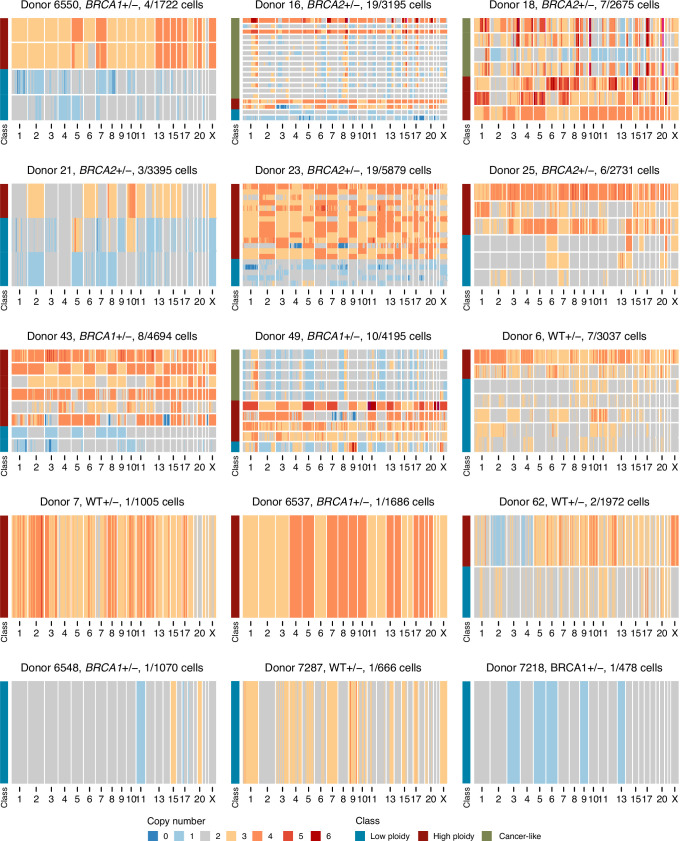
Extended Data Fig. 5. Additional extreme aneuploidy cells heatmaps.
All extreme aneuploid cells per patient. Title shows donor name, genotype and number of extreme aneuploid cells out of total number of cells.
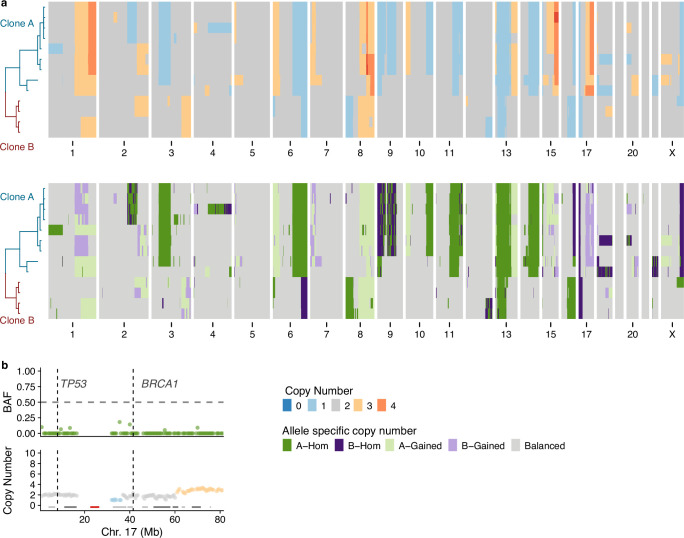
The 22 ‘cancer-like’ cells were derived from three high-risk donor samples. All ‘cancer-like’ cells had lost one copy of either BRCA1 or BRCA2, although we cannot be certain that the WT copy was lost due to the inability to confirm mutational status in individual cells due to the limited sequencing coverage per cell. All cells had also lost one allele on 17p, the location of TP53, suggesting that these cells had also lost P53 function. B2-16 has 13 cancer-like cells that through phylogenetic analysis could be subdivided into two independent clones, clone A and clone B (Fig. 4d,e). Although both these clones share similar features such as gains on 1q and 8q and losses on 6q, 16q, 13p (including BRCA2) and 17p (including TP53), the copy number changepoints for these events are distinct in each clone, strongly suggesting they are evolutionary independent clonal lineages. This is further supported by allele-specific analysis showing different alleles lost in chromosomes 6 and 16 in the two clones (Extended Data Fig. 6a). B1-49 had five ‘cancer-like’ cells that were all clonally related (Fig. 4f). All cells had gains of 1q and 8q and losses on 16q and 17q (including BRCA1). The allele-specific analysis also revealed copy-neutral loss of heterozygosity (LOH) in chromosome 17p (Extended Data Fig. 6b). B2-18 had four ‘cancer-like’ cells that, again, were all clonally related (Fig. 4g). These cells had gains on 1q, 8q and 17q and losses on 10q, 13q (including BRCA2), 17p (including TP53), 16q and 22q, among others. Interestingly, 3/4 cells had undergone a whole-genome doubling, while one cell—which likely resembles the ancestral state of the three other cells—remained in a diploid state. A pathological review of these breast tissues revealed a small DCIS lesion associated with one of the FFPE blocks of B2-16.
Extended Data Fig. 6. Haplotype-specific analysis of cancer-like cells in B2-16 and B1-49.
a, Total and allele-specific copy number for the cancer-like cells in B2-16. Top, total copy number. Bottom, allele-specific copy number. b, B allele frequency and total copy number of chromosome 17 from donor B1-49. Location of TP53 and BRCA1 are shown with dashed lines. Data are a merged pseudobulk across the five cancer-like cells.
We note that in samples with these cancer-like genomes, we did not observe cells with intermediate aneuploid states that might be expected from a stepwise, gradual accumulation of CNAs. This could reflect the possibility that intermediate states are unfavorable to cellular proliferation, cleared by immune cells, or that all the changes are acquired within a short period of time, plausibly a single mitotic event. Alternatively, copy number evolution may proceed in a stepwise, gradual way, but the intermediate states never reached a large enough size to be sampled in our study.
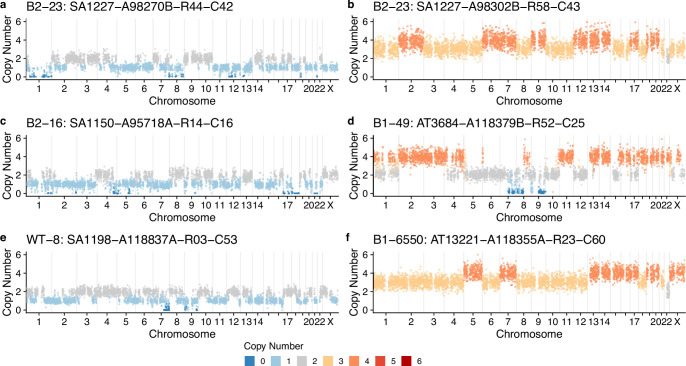
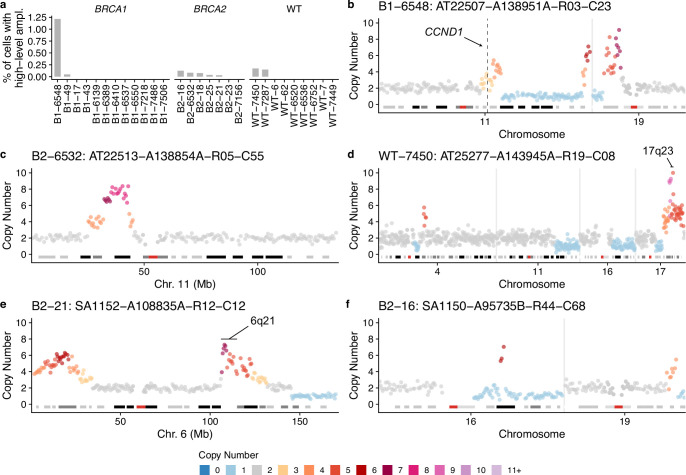
Among the cells that were not correlated with advanced breast cancers (ρ < 0.25; Fig. 4c), a significant proportion was characterized by a large number of whole chromosome losses relative to cell ploidy (Extended Data Figs. 5 and 7a–f). These cells are consistent with cytokinesis failure or multipolar divisions and are likely nonviable, as we rarely observed two cells with near identical genomes. Furthermore, in some cases, such cells had large regions that were homozygously deleted (Extended Data Fig. 7). However, there was a notable example of a clonally expanded genome doubled population (n = 14 cells) in donor B2-23 (Extended Data Fig. 5). We also found a rare subset of cells with focal high-level amplifications (copy number > 5) with minimal additional CNAs, including cells with gains of 17q23 and 6q21 (Extended Data Fig. 8a–f), common alterations found in breast cancers39,40. We did not find any evidence of cells harboring chromothripsis, another common event in breast cancer41, although chromothripsis patterns characterized by small deletions (<100 kb) would be difficult to detect in single-cell genomes without clonal amplification using standard resolution DLP+.
Extended Data Fig. 7. Examples of non-cancer-like extreme aneuploidy cells.
a–f, Examples of extreme aneuploid genomes that are not similar to breast cancer genomes.
Extended Data Fig. 8. Examples of focal amplifications.
a, Proportion of cells with focal amplifications (>4 copies in a segment >2 Mb but smaller than a chromosome arm) across all samples. Examples of single-cell genome copy number profiles with focal amplifications (b–f) showing only chromosomes with amplifications or other CNAs; all other chromosomes are diploid. Copy number profiles are annotated with regions known to be enriched in breast cancers.
Discussion
This study of scaled single-cell genome analysis of breast epithelium reveals several striking features of somatic CNAs in pathologically normal tissues. First, we show that aneuploidy is uncommon, comprising 3.25% overall of epithelial cells. Second, we observe a marked difference in epithelial lineages—luminal cells, the putative precursor compartment for breast malignancies, exhibit 3.73% aneuploid cells, whereas only 1.38% of basal myoepithelial cells carried CNAs. Third, we observed that CNAs occur with structured tissue architecture across the genome—the most abundant CNAs were largely limited to the luminal population and included gains on 1q and losses on 10q, 16q, 22q and 7q. Loss of chromosome X was similar in luminal and basal lineages, which may be explained by the loss of the inactive copy being selectively neutral. Fourth, this specific pattern of CNAs may be tissue context specific, as we did not observe it in cultured mammary epithelial cells, and is distinct from reported mis-segregation rates35. This difference could reflect the lack of full lineage differentiation under the normal propagation conditions of mammary epithelial cell lines. Thus, our data suggest that CNAs form a significant component of the somatic mutational spectrum of epithelial cells in normal breast tissues, and this is both chromosome- and cell lineage-specific, even within mammary epithelial sub-lineages.
When compiling individual CNA events across many single genomes into an aggregate, the normal cell CNA landscape we observe resembles copy number profiles derived from bulk sequencing data of invasive breast cancers. One of the most commonly observed alterations from our dataset was co-occurring gain of 1q and loss of 16q in luminal epithelial cells. Interestingly, these co-occurring CNAs are often found to be the only alteration present in low-grade DCIS and luminal A tumors8,42,43. Our data not only support that concurrent gain of 1q and loss of 16q are early events but also that it is almost exclusively associated with luminal epithelial cells and can occur through multiple independent allelic events. Concurrent gain of 1q/loss of 16q is most often generated through an unbalanced translocation event that results in the fusion of chromosome 1q and 16p arms, termed der(1;16)44,45. Interestingly, a recent phylogenetic analysis identified der(1;16) as a founder alteration that could be traced back to early pubertal breast epithelial cells. These clones expanded over time and acquired additional mutations that eventually led to cancer development37. While 1q/16q CNAs were found to be the only CNAs for some low-grade tumors, these alterations are also associated with high aneuploid tumors45. Due to limitations in the resolution of our sequencing data, we were unable to conclusively determine whether gain of 1q/loss of 16q events in our dataset were a result of der(1;16), although a statistical enrichment of reads with 1:16 split mapping was noted (Supplementary Table 3). It seems plausible that at least a subset of cells carries der(1;16) given the frequency of der(1;16) in breast cancers and the recent report on der(1;16) founder clones37. Nevertheless, our results strongly support the importance of premalignant alterations in 1q and 16q and raise the question whether targeting of early progenitors harboring gain of 1q/loss of 16q may be an effective therapeutic strategy for preventing or monitoring breast cancer development.
While gain of 1q was the most commonly detected event, additional alterations were repeatedly identified, including co-occurring gain of 1q and loss of 10q, loss of 7q and loss of 22q. All of these CNAs, except for loss of 7q, are enriched in breast tumors. We speculate that loss of 7q may impede tumorigenesis, analogous to the recent observation that NOTCH1 mutations in the esophagus are positively selected in normal epithelium but underrepresented in esophageal cancers relative to normal epithelium46. Some of the common alterations we detected have been implicated as predictive of subtype and prognosis7,8,43,47. For example, loss of 10q is of particular interest because PTEN is located on this chromosome arm, and deletions of PTEN are commonly associated with basal breast tumors (TCGA). PTEN loss has also been computationally predicted to occur before BRCA1 LOH in human breast tumors48. It has been suggested that haploinsufficiency in BRCA1/BRCA2 results in intermediate phenotypes of telomere erosion and metabolic alterations that can promote aneuploidy49,50. While we observed a trend toward increased rates of aneuploidy in BRCA1/BRCA2 carriers, suggesting haploinsufficiency of BRCA1/BRCA2 may contribute to the acquisition of CNAs, larger cohorts of samples will be needed to definitely demonstrate this.
We speculate that the CNA mutational events that accumulate later in the progression from normal epithelium to cancer may be dependent on these earlier alterations. For example, it is known that MYC overexpression sensitizes cells to apoptosis, and survival of high MYC cells requires anti-apoptotic alterations like p53 loss of function or gain of BCL2 anti-apoptotic proteins51–53. The MDM4 suppressor of p53 is on 1q, and gain of 1q in tumor cells has been shown to increase the expression of MDM4 and suppress p53 signaling54. The anti-apoptotic protein MCL1 is also located on 1q. Thus, it is possible that CNAs are required to tolerate significant alterations as cells undergo transformation. Activation of NOTCH signaling has also been suggested as a possible driver of 1q gains55. Notably, some common breast cancer-associated CNAs such as 8q are not prevalent in mammary epithelium, suggesting these are selected later in cancer evolution.
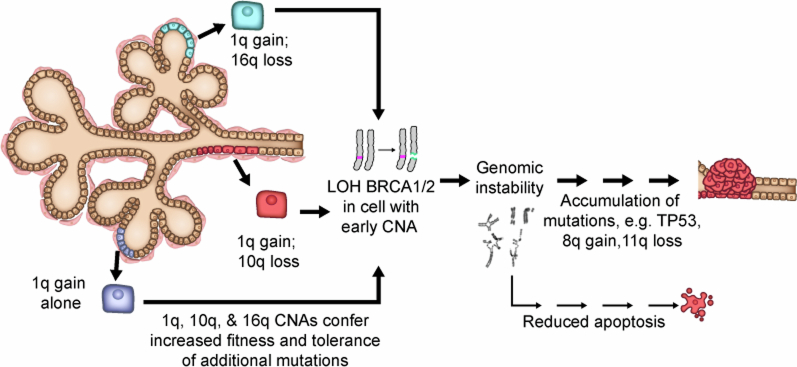
In addition to the cells with one or two CNAs, we also detected a small number of cells in BRCA1 and BRCA2 mutation carriers with extensive CNAs, which were similar to those that occur in BRCA-mutant cancers56,57. These cells may derive from microscopic premalignant lesions present in the donor tissue. Most of these cells also carried CNAs in 1q and 10q or 16q, raising the possibility that the presumed loss of the WT BRCA allele occurred in cells with the pre-existing CNAs. It is of interest that we did not observe an intermediate set of alterations progressing from minimal to extreme aneuploidy. The paucity of intermediate clones in our analysis supports a punctuated model of clonal evolution, which proposes tumor development as abrupt transitions rather than a gradual accumulation of alterations over time58,59. Therefore, we hypothesize (Extended Data Fig. 9) that cells with minimal aneuploidy may serve as founder cells that undergo rapid bursts of alterations triggered by catastrophic events like LOH of BRCA1 or BRCA2, TP53 loss of function, chromothripsis or whole-genome duplication. Alternatively, intermediate states may be more susceptible to immune surveillance leading to rapid elimination or require additional alterations to overcome LOH and undergo transformation, although it is unclear in general how large clones60 need to be and the degree to which CNAs stimulate immune surveillance61. These intriguing hypotheses require further investigation, with longitudinal studies potentially shedding light on the dynamics of clonal evolution of cells with CNAs as well as providing additional insights into the relationship between cancer-associated genetic alterations and immune activity during the early stages of tumorigenesis.
Extended Data Fig. 9. Proposed model of breast cancer initiation in BRCA1/2 carriers.
In the proposed model, CNAs that accumulate in normal breast tissues (for example, 1q-gain and 10q or 16q-loss) would enhance the fitness of the luminal epithelial cells. In BRCA1/2 mutation carriers, where inactivation of the wild-type (WT) copy of BRCA1/2 leads to defective DNA repair, genomic instability and apoptosis, luminal cells carrying these CNAs would be more tolerant of these stresses, thus allowing the homologous-recombination defective mutant cells to expand, acquire oncogenic mutations, and ultimately progress to cancer.
The patterns we observe could be due to a mutational bias (for example, preferential mis-segregation of certain chromosomes35,62 and contribution of chromosome-specific fragile sites) or differing relative fitness of cells carrying CNAs. Although the sampling method used here captures the single-cell background, largely bypassing purifying selection and not reliant on clonal amplification for detection of CNAs, measuring actual contributions of potential hypermutability and/or fitness to the landscape would require the timing and population fitness of individual CNAs to be measured. This is not currently tractable from human tissues at single-cell resolution. Nevertheless, taken together, our data suggest that the mechanisms of somatic CNAs and/or selection operate continuously in nonmalignant epithelium, emphasizing the need to better understand the mechanistic relationships between lineage-specific mutational and selection forces in tumor formation.
Methods
Tissue procurement
All donor samples analyzed in the study are listed in Supplementary Table 1. Specimens were obtained from Brigham & Women’s Hospital or Faulkner Hospital on the day of surgery. The protocol of acquistion of human tissue samples was approved by the DF/HCC Institutional Review Board (IRB) (number 10-458) and our study of the tissues was reviewed by the Harvard Medical School IRB and deemed ‘not human subjects research’. Donors gave their written, informed consent to have their anonymized tissues used for scientific research purposes. The single-cell DNA-sequencing (scDNA-seq) dataset contains 28 samples that include 9 elective reduction mammoplasties and 19 prophylactic mastectomies (11 BRCA1 mutation carriers, 7 BRCA2 mutation carriers and 1 BRCA1 (germline)/BRCA2(somatic) mutation carrier). The age range of the cohort is 25–70 years old.
Tissue processing and fluorescence-activated cell sorting (FACS)
Breast tissue samples were dissociated as previously described63. Briefly, each tissue was minced and transferred to a 50 ml conical tube containing a solution of Dulbecco’s Modified Eagle Medium/Nutrient Mixture F-12 (DMEM/F12, Thermo Fisher Scientific, 12634010), 1× Glutamax (Gibco, 35050), 10 mM HEPES (Gibco, 15630), 50 U ml−1 Penicillin–Streptomycin (Gibco, 15070) and 1 mg ml−1 collagenase (Sigma-Aldrich, C9407). Digestion was performed by constant shaking at ~150 to 200 rpm at 37 °C for 2–4 h. Tissue was then pelleted by centrifugation and further dissociated into single cells by treatment with TrypLE (Gibco, 12605010) for 5–15 min. After neutralization and pelleting by centrifugation, sequential pipetting with 25, 10 and 5 ml pipette tips was performed to further dissociate the tissue. The dissociated tissue was then filtered through a 100 μm and 40 μm filter to isolate single cells and counted manually under the microscope to assess yield and viability. Single cells were fixed with 1.6% paraformaldehyde for 10 min and cryopreserved until ready for FACS.
For FACS isolation of mammary epithelial cell types, single cells isolated from tissue were labeled for 30 min at room temperature with Alexa Fluor 647-conjugated anti-EpCAM (BioLegend, 324212; 1:50), PE-conjugated anti-CD49f (BioLegend, 313612; 1:100), FITC-conjugated anti-CD31 (BioLegend, 303103; 1:100) and Alexa Fluor 488 anti-CD45 (BioLegend, 304017; 1:100). The lineage-negative population was defined as CD31−CD45−. After staining, FACS was performed to isolate CD31/CD45−EpCAM+ CD49f+/− (luminal) and CD31/CD45− EpCAMlow CD49f+ (basal/myoepithelial) cells for scDNA-seq analysis. Representative FACS plots are shown in Supplementary Fig. 4.
scDNA-seq
We used the DLP+ protocol to generate low-pass WGS data25. Frozen single cells were thawed, washed and pelleted in DMEM (Corning, 10-013-CV) and resuspended in PBS (Corning, 21-040-CV) with 0.04% BSA (Cedarlane, 001-000-162). Single-cell suspensions were labeled with CellTrace CFSE dye (Thermo Fisher Scientific, C34554) and LIVE/DEAD Fixable Red stain (Thermo Fisher Scientific, L23102) by incubation at 37 °C for 20 min. Cells were resuspended in PBS with 0.04% BSA and aspirated into a contactless piezoelectric dispenser (Scienion CellenOne) for single-cell dispensing into open nanowell arrays (Takara Bio SmartChip) preprinted with unique custom dual indexed sequencing primers. Nanowell chips were subsequently scanned on a Nikon TI-E inverted fluorescence microscope (×10 magnification). Singly occupied wells and cell states were determined using our custom image analysis software, SmartChipApp (Java). Cell-spotted nanowell chips are covered with SmartChip Intermediate Film (Takara, 430-000104-10) and stored at −20 °C until library construction.
Lysis buffer comprising 6.73 nl DirectPCR lysis reagent (Viagen Biotech, 302-C), 2.69 nl protease (Qiagen, 19155), 0.5 nl glycerol (100%) and 0.09 nl pluronic (10%) was dispensed into each well. Nanowell chips were sealed with Microseal A (Bio-Rad, MSA5001) using a pneumatic sealer and centrifuged before each incubation step. Cells were allowed to soak overnight in lysis buffer for 18–19 h at 21 °C (30 °C lid) in a flatbed thermocycler (Thermo Fisher Scientific ProFlex Dual Flat PCR System, 4484078). Following overnight presoak, chips were incubated at 50 °C for 1 h to carry out thermal and enzymatic lysis. Lysis inactivation (75 °C for 15 min, 10 °C forever) was conducted after lysis. Tagmentation was performed with 7.5 nl Bead-Linked Transposomes (Illumina DNA Prep, 20060059), 7.5 nl tagmentation buffer 1 (Illumina DNA Prep, 20060059) and 15 nl nuclease-free water, incubated at 55 °C for 15 min. Neutralization was carried out with 9.9 nl protease (Qiagen, 19155) with 0.1 nl Tween20 (10%) at 50 °C for 15 min, followed by heat inactivation at 70 °C for 15 min. Limited-cycle PCR amplification was conducted with 44.53 nl enhanced PCR mix (Illumina DNA Prep, 20060059) and 0.47 nl Tween20 (10%) using the following conditions: 68 °C for 3 min; 98 °C for 3 min; 11 cycles of 98 °C for 45 s, 62 °C for 30 s, 68 °C for 2 min; 68 °C for 1 min; and hold at 10 °C. Single-cell whole-genome libraries were eluted from nanowell chips by centrifugation through a funnel into a recovery tube. Pooled libraries were cleaned by double-sided bead purification using sample purification beads (Illumina DNA Prep, 20060059) and eluted into a resuspension buffer (Illumina DNA Prep, 20060059).
Single-cell whole-genome libraries were quantified with the Qubit dsDNA High Sensitivity Assay (Thermo Fisher Scientific, Q32854) and the Bioanalyzer 2100 HS kit (Agilent, 5067-4626). Sequencing was conducted to a depth of 0.03× coverage per cell on either Illumina NextSeq 2000 (2 × 100 bp) at the UBC Biomedical Research Centre (Vancouver, British Columbia), Illumina HiSeq 2500 (2 × 150 bp) or Illumina NovaSeq 6000 (2 × 150 bp) at the BC Genome Sciences Centre (Vancouver, British Columbia).
scDNA processing and analysis
The single-cell pipeline outlined in ref. 25 was used to call copy numbers in single cells at 0.5 Mb resolution. Briefly, this pipeline aligns sequencing reads to the reference genome, counts the number of reads in 0.5 Mb bins across the genome, performs GC correction using a modal regression framework and then computes integer copy number states across the genome using HMMcopy64. We then applied the cell quality filter and removed cells with a quality <0.75. Bins with a mappability score <0.99 were removed. In addition, to remove possible low-quality cells not captured by the cell quality score, cells undergoing replication and cells with possible incorrect ploidy estimates, we also removed cells that had the following characteristics: (1) ploidy >5 and (2) >10 segments with size <5 Mb. When plotting the landscape plots (frequency of alterations across the genome), we removed bins within 3 Mb of the centromere as these bins show a tendency toward erroneous copy number calls in a small subset of cells due to mapping issues at these loci. We also removed a small subset of cells (n = 847) that had extreme GC bias that resulted in recurrent but erroneous copy number calls in a minority of bins (Supplementary Table 2). This does not affect the per-cell chromosome-arm aneuploidy calls as the erroneous copy number calls are restricted to one or two bins.
We computed allele-specific copy numbers for the aneuploid cells using SIGNALS for 15 donors. As input, SIGNALS requires haplotype block counts per cell, which in turn requires identifying heterozygous SNPs and phased haplotype blocks. To identify heterozygous SNPs, all cells were merged into a single pseudobulk BAM file and treated as a normal WGS sample. The ‘Haplotype Calling’ submodule (step 8: https://github.com/shahcompbio/single_cell_pipeline/blob/master/docs/source/index.md) was then used to infer haplotype blocks and genotype them in single cells. These results were then used in SIGNALS with default parameters apart from mincells, which was set to 4. Mincells is the size of the smallest cluster used to phase haplotype blocks and needed to be lower than what is typically recommended for cancer data due to the sparsity of CNAs. Allelic distributions aggregated across chromosome arms were used as a quality control metric for assessing total copy number calls of the most prevalent alterations (Extended Data Fig. 4e). Downstream analysis and all plotting were done using SIGNALS (v0.10.0)31.
Aneuploidy in single cells
Single cells were called aneuploid if they had at least one chromosome arm in a copy number state that was different from the ploidy of the cell. Integer cell ploidy was assigned to be the most common copy number state across the whole genome (unless this was 1, in which case ploidy was set to 2), and chromosome arm copy number states in each cell were assigned based on the most common copy number state of the bins within a chromosome arm (using per_chrarm_cn function in SIGNALS). Aneuploid arms with copy number state greater than cell ploidy were classed as gains and less than cell ploidy as losses. Cells were classed as ‘extreme aneuploid’ if they were in the top 5% of cells in terms of CNA abundance. This cutoff corresponded to seven or more aneuploid arms.
Additional datasets used in this study
To compare the distribution of CNAs to cancer cells, we made use of WGS data from ref. 34 and SNP array data from TCGA11. To facilitate comparison with scWGS DLP data, the various formats used in these studies were converted into a format that consisted of an integer copy number at 0.5 Mb across the genome. Gains and losses were defined relative to cell ploidy for the single-cell data. We also used a set of 13,569 hTERT immortalized WT mammary epithelial cells. Details of cultural conditions can be found in ref. 31.
Classifying extreme aneuploid cells
For each extreme aneuploid cell, we computed its correlation coefficient with the average copy number profile from 262 cancer samples that had purity >0.5 in ref. 34. Plotting the distribution of correlation coefficients, we observed a bimodal distribution, with a mode at 0, a mode at ~0.5 and an inflection point at 0.25. We, therefore, classified cells that had ≥0.25 correlation coefficient as ‘cancer-like’ and those with correlation <0.25 as low ploidy or high ploidy depending on their cell ploidy, which also exhibited a bimodal distribution.
Phylogenetic trees
We constructed phylogenetic trees for the cancer-like extreme aneuploid cells using sitka65, which uses copy number changepoints as phylogenetic markers. Here a copy number change point is the locus (bin), where the inferred integer copy number state changes between bin i and bin i + 1. The input to sitka is a binary matrix consisting of cells by changepoint bins. Default parameters were used. The length of branches in the trees represents the number of copy number changes.
Split read analysis
To explore whether our sequencing data contained any evidence for derivative chromosomes, we searched for read-level evidence of translocation breakpoints. Due to the rarity of these cells and the low coverage per cell, in most cases, we will not sequence the translocation breakpoint, and furthermore, standard SV calling approaches cannot be used. However, we reasoned that cells with gain of 1q/loss of 16q or gain of 1q/loss of 10q may be enriched for split alignment reads where a portion of the read aligns to chromosome 1 and a portion to chromosome 16. To test this, we searched for such split alignments in cells harboring 1q-16q and compared them to a set of randomly sampled diploid cells (n = 634) that closely matched the coverage of the 1q-16q cells. We restricted our search to alignments (mapping quality, MAPQ > 20) in regions in between the copy number transitions in each chromosome; these are in the vicinity of the centromere, where previous studies have reported that these translocations typically reside. Split alignment reads may be the consequence of chimeric sequence reads that arise during library preparation or be due to sequencing or mapping errors. We, therefore, expect a background rate of such alignments and thus tested for enrichment in the 1q-16q cells versus diploid. These statistics can be found in Supplementary Table 3.
Statistical analysis
For between-group comparisons, we used Wilcoxon rank-sum tests. To investigate multiple factors that might influence aneuploidy while taking into account that most donors have both basal and luminal cells, we performed a multilevel multivariate model (Extended Data Fig. 1f) that included cell type, age and donor genotype. We used the lme4 (v1.1.35.5) package in R with the following formula specification: percentage_aneuploidy ~ age + cell_type + genotype + (1|sample).
Statistics and reproducibility
Samples with fewer than 300 cells were excluded from the study. This cutoff was based on requiring a 95% probability of sequencing at least one aneuploid cell if the baseline rate of aneuploidy was 1% (ref. 66). No statistical method was used to predetermine the number of donor samples to include in the study.
Reporting summary
Further information on research design is available in the Nature Portfolio Reporting Summary linked to this article.
Online content
Any methods, additional references, Nature Portfolio reporting summaries, source data, extended data, supplementary information, acknowledgements, peer review information; details of author contributions and competing interests; and statements of data and code availability are available at 10.1038/s41588-024-01988-0.
Supplementary information
Supplementary Figs. 1–4.
Supplementary Table 1: Clinical details of the 28 donor patients including BRCA1/BRCA2 mutations, age, cancer history, chemotherapy history, details on pathological review, parity and menopause status. Final path status indicates the breast from which the tissue was acquired ((R)ight or (L)eft) and any notable abnormalities. Supplementary Table 2: Cell level statistics, including cell_id, sample, cell_type, cell coverage, number of aneuploid arms and extreme aneuploidy classification. Supplementary Table 3: Statistics related to the enrichment of split reads for cells containing 1q-gain/16q-loss or 1q-gain/10q-loss.
Acknowledgements
We gratefully acknowledge the teams who facilitated tissue collection for these studies, including the Brigham and Women’s Hospital (BWH) breast surgery team led by T. King; the BWH plastic surgery team; and the BWH Faulkner pathologists and technical staff led by T. Guidi. We thank R. Schackmann, A. Alsaadi, G. Rinaldi, K.-C. Chang and K. Moore for support in processing tissues. We thank J. Wang, J. Biele and J. Brimhall (BC Cancer) for assistance in generating the scDNAseq data. We also thank the Dana–Farber Cancer Institute Flow Cytometry Core led by J. Daley and S. Lazo. We deeply appreciate the invaluable editorial feedback provided by M.A. Martinez-Gakidis (J.S.B. Lab). This work was supported in part by a Gray Foundation Team Sciences Award (to J.S.B., S. Aparicio, D.A.D. and J.E.G.), a Gray Foundation Precancer Atlas Award (to J.S.B., S. Aparicio, D.A.D. and J.E.G.), a Goldberg Family Research Fund gift (to J.S.B.), the Breast Cancer Research Foundation (to J.S.B.), an Anbinder Cancer Research Fund gift (to J.S.B.) and a National Cancer Institute (NCI) grant (NCI R35 CA242428 to J.S.B.). M.J.W. is supported by a National Cancer Institute Pathway to Independence award (K99CA256508). M.U.J.O. is supported by the R35 Diversity Supplement (R35CA242428-04) and the Black in Cancer/Emerald Foundation Postdoctoral Career Transition Fellowship. S.P.S. holds the Nicholls Biondi Chair in Computational Oncology and is a Susan G. Komen Scholar (GC233085) and receives support from the Halvorsen Center for Computational Oncology. Additional funding to S.P.S. was provided by NCI SPORE (1P50CA247749-01) and NIH CEGS (1RM1HG011014-01) S. Aparicio holds the Nan and Lorraine Robertson Chair in Breast Cancer and is a Canada Research Chair in Molecular Oncology (950-230610). Additional funding was provided by a Terry Fox Research Institute grant (1082), CIHR grants (FDN-148429, 495630), Breast Cancer Research Foundation awards (BCRF-21-180, BCRF22-180 and BCRF23-180, BCRF-24-216), the Canada Foundation for Innovation (40044) and Royal Society Wolfson Award (RSWVFR1221020 to S. Aparicio). We also acknowledge DF/HCC Breast SPORE: Specialized Program of Research Excellence (SPORE), an NCI-funded program, Grant 1P50CA168504 for support of the human tissue acquisition. This work used resources from the High-Performance Computing Group at Memorial Sloan Kettering Cancer Center.
Extended data
Author contributions
J.S.B. and S. Aparicio conceived this study. M.J.W., M.U.J.O., J.S.B. and S. Aparicio wrote the manuscript with input from other authors. M.J.W. analyzed all scDNA-seq data. M.U.J.O. organized tissue sample processing, dissociated and processed tissues and carried out FACS sorting. L.O. and K.N. dissociated and processed tissues. W.L.G. processed and FACS-sorted samples. J.E.G., D.A.D., A.P. and M.M. orchestrated tissue procurement. S. Agarwal and A.P. acquired patient consent. V.P. performed tissue collection and initial processing after surgery. D.A.D. performed pathological reviews. S.P.S. supervised computational analysis. D.L., D.G., C.L., S.B., A.M., A.C.W. and J.C.H.Y. developed and ran computational pipelines. V.A. generated the scDNA-seq data with support from C.O.F., M.V.V. and C.B.
Peer review
Peer review information
Nature Genetics thanks Isidro Cortés-Ciriano, Benjamin Izar and Seishi Ogawa for their contribution to the peer review of this work. Peer reviewer reports are available.
Data availability
Raw sequencing data are available from the European Genome-Phenome Archive (EGA) under accession EGAS00001007716. Processed data including all single-cell copy number calls are available at 10.5281/zenodo.13645601 (ref. 67).
Code availability
Single-cell pipeline for processing DLP+ data is available at https://github.com/shahcompbio/single_cell_pipeline (v0.8.26). The SIGNALS R package (v.0.10.0) was used for the majority of plotting and downstream processing of scDNA-seq data (archived at 10.5281/zenodo.10285492 (ref. 68)). Code to reproduce all the figures is available at https://github.com/marcjwilliams1/normal_brca_scdna (archived at 10.5281/zenodo.13904325 (ref. 69)).
Competing interests
J.S.B. is a scientific advisory board (SAB) member of Frontier Medicines. D.A.D. is on the SAB for Oncology Analytics, has consulted for Novartis and receives research support from Canon. J.E.G. is a paid consultant for Helix and an uncompensated consultant for Konica Minolta and Earli. S.P.S. has consulted for AstraZeneca and has received funding from Bristol Meyers Squibb. S. Aparicio is cofounder and shareholder of Genome Therapeutics, uncompensated advisor to Chordia Therapeutics and advisor to Sangamo Therapeutics. The other authors declare no competing interests.
Footnotes
Publisher’s note Springer Nature remains neutral with regard to jurisdictional claims in published maps and institutional affiliations.
These authors contributed equally: Marc J. Williams, Michael U. J. Oliphant, Vinci Au.
Contributor Information
Sohrab P. Shah, Email: shahs3@mskcc.org
Joan S. Brugge, Email: joan_brugge@hms.harvard.edu
Samuel Aparicio, Email: saparicio@bccrc.ca.
Extended data
is available for this paper at 10.1038/s41588-024-01988-0.
Supplementary information
The online version contains supplementary material available at 10.1038/s41588-024-01988-0.
References
- 1.Martincorena, I. et al. Tumor evolution. High burden and pervasive positive selection of somatic mutations in normal human skin. Science348, 880–886 (2015). [DOI] [PMC free article] [PubMed] [Google Scholar]
- 2.Rockweiler, N. B. et al. The origins and functional effects of postzygotic mutations throughout the human life span. Science380, eabn7113 (2023). [DOI] [PMC free article] [PubMed] [Google Scholar]
- 3.Martincorena, I. et al. Somatic mutant clones colonize the human esophagus with age. Science362, 911–917 (2018). [DOI] [PMC free article] [PubMed] [Google Scholar]
- 4.Cereser, B. et al. The mutational landscape of the adult healthy parous and nulliparous human breast. Nat. Commun.14, 5136 (2023). [DOI] [PMC free article] [PubMed] [Google Scholar]
- 5.Li, Y. et al. Patterns of somatic structural variation in human cancer genomes. Nature578, 112–121 (2020). [DOI] [PMC free article] [PubMed] [Google Scholar]
- 6.ICGC/TCGA Pan-Cancer Analysis of Whole Genomes Consortium. Pan-cancer analysis of whole genomes. Nature578, 82–93 (2020). [DOI] [PMC free article] [PubMed] [Google Scholar]
- 7.Curtis, C. et al. The genomic and transcriptomic architecture of 2,000 breast tumours reveals novel subgroups. Nature486, 346–352 (2012). [DOI] [PMC free article] [PubMed] [Google Scholar]
- 8.Chin, K. et al. Genomic and transcriptional aberrations linked to breast cancer pathophysiologies. Cancer Cell10, 529–541 (2006). [DOI] [PubMed] [Google Scholar]
- 9.Stephens, P. J. et al. The landscape of cancer genes and mutational processes in breast cancer. Nature486, 400–404 (2012). [DOI] [PMC free article] [PubMed] [Google Scholar]
- 10.PCAWG Transcriptome Core Group et al. Genomic basis for RNA alterations in cancer. Nature578, 129–136 (2020). [DOI] [PMC free article] [PubMed]
- 11.Cancer Genome Atlas Network. Comprehensive molecular portraits of human breast tumours. Nature490, 61–70 (2012). [DOI] [PMC free article] [PubMed] [Google Scholar]
- 12.Shi, H. et al. Allele-specific transcriptional effects of subclonal copy number alterations enable genotype-phenotype mapping in cancer cells. Nat. Commun.15, 2482 (2024). [DOI] [PMC free article] [PubMed] [Google Scholar]
- 13.Wang, K. et al. Archival single-cell genomics reveals persistent subclones during DCIS progression. Cell186, 3968–3982 (2023). [DOI] [PubMed] [Google Scholar]
- 14.Lips, E. H. et al. Genomic analysis defines clonal relationships of ductal carcinoma in situ and recurrent invasive breast cancer. Nat. Genet.54, 850–860 (2022). [DOI] [PMC free article] [PubMed] [Google Scholar]
- 15.Lopez-Garcia, M. A., Geyer, F. C., Lacroix-Triki, M., Marchió, C. & Reis-Filho, J. S. Breast cancer precursors revisited: molecular features and progression pathways. Histopathology57, 171–192 (2010). [DOI] [PubMed] [Google Scholar]
- 16.Simpson, P. T., Reis-Filho, J. S., Gale, T. & Lakhani, S. R. Molecular evolution of breast cancer. J. Pathol.205, 248–254 (2005). [DOI] [PubMed] [Google Scholar]
- 17.Abascal, F. et al. Somatic mutation landscapes at single-molecule resolution. Nature593, 405–410 (2021). [DOI] [PubMed] [Google Scholar]
- 18.Ju, Y. S. et al. Somatic mutations reveal asymmetric cellular dynamics in the early human embryo. Nature543, 714–718 (2017). [DOI] [PMC free article] [PubMed] [Google Scholar]
- 19.Roerink, S. F. et al. Intra-tumour diversification in colorectal cancer at the single-cell level. Nature556, 457–462 (2018). [DOI] [PubMed] [Google Scholar]
- 20.Abyzov, A. et al. Somatic copy number mosaicism in human skin revealed by induced pluripotent stem cells. Nature492, 438–442 (2012). [DOI] [PMC free article] [PubMed] [Google Scholar]
- 21.Coorens, T. H. H. et al. Inherent mosaicism and extensive mutation of human placentas. Nature592, 80–85 (2021). [DOI] [PMC free article] [PubMed] [Google Scholar]
- 22.Machiela, M. J. et al. Female chromosome X mosaicism is age-related and preferentially affects the inactivated X chromosome. Nat. Commun.7, 11843 (2016). [DOI] [PMC free article] [PubMed] [Google Scholar]
- 23.Jakubek, Y. A. et al. Large-scale analysis of acquired chromosomal alterations in non-tumor samples from patients with cancer. Nat. Biotechnol.38, 90–96 (2020). [DOI] [PMC free article] [PubMed] [Google Scholar]
- 24.Gao, T. et al. A pan-tissue survey of mosaic chromosomal alterations in 948 individuals. Nat. Genet.55, 1901–1911 (2023). [DOI] [PMC free article] [PubMed] [Google Scholar]
- 25.Laks, E. et al. Clonal decomposition and DNA replication states defined by scaled single-cell genome sequencing. Cell179, 1207–1221 (2019). [DOI] [PMC free article] [PubMed] [Google Scholar]
- 26.Zahn, H. et al. Scalable whole-genome single-cell library preparation without preamplification. Nat. Methods14, 167–173 (2017). [DOI] [PubMed] [Google Scholar]
- 27.Stingl, J. et al. Purification and unique properties of mammary epithelial stem cells. Nature439, 993–997 (2006). [DOI] [PubMed] [Google Scholar]
- 28.Rios, A. C., Fu, N. Y., Lindeman, G. J. & Visvader, J. E. In situ identification of bipotent stem cells in the mammary gland. Nature506, 322–327 (2014). [DOI] [PubMed] [Google Scholar]
- 29.Rosenbluth, J. M. et al. Organoid cultures from normal and cancer-prone human breast tissues preserve complex epithelial lineages. Nat. Commun.11, 1711 (2020). [DOI] [PMC free article] [PubMed] [Google Scholar]
- 30.McPherson, A. W. et al. Ongoing genome doubling promotes evolvability and immune dysregulation in ovarian cancer. Preprint at bioRxiv10.1101/2024.07.11.602772 (2024).
- 31.Funnell, T. et al. Single-cell genomic variation induced by mutational processes in cancer. Nature612, 106–115 (2022). [DOI] [PMC free article] [PubMed] [Google Scholar]
- 32.Williams, M. J. et al. Tracking clonal evolution of drug resistance in ovarian cancer patients by exploiting structural variants in cfDNA. Preprint at bioRxiv10.1101/2024.08.21.609031 (2024).
- 33.Ng, A. W. T. et al. Disentangling oncogenic amplicons in esophageal adenocarcinoma. Nat. Commun.15, 4074 (2024). [DOI] [PMC free article] [PubMed] [Google Scholar]
- 34.Nik-Zainal, S. et al. Landscape of somatic mutations in 560 breast cancer whole-genome sequences. Nature534, 47–54 (2016). [DOI] [PMC free article] [PubMed] [Google Scholar]
- 35.Klaasen, S. J. et al. Nuclear chromosome locations dictate segregation error frequencies. Nature607, 604–609 (2022). [DOI] [PMC free article] [PubMed] [Google Scholar]
- 36.Knouse, K. A., Lopez, K. E., Bachofner, M. & Amon, A. Chromosome segregation fidelity in epithelia requires tissue architecture. Cell175, 200–211 (2018). [DOI] [PMC free article] [PubMed] [Google Scholar]
- 37.Nishimura, T. et al. Evolutionary histories of breast cancer and related clones. Nature620, 607–614 (2023). [DOI] [PMC free article] [PubMed] [Google Scholar]
- 38.Cross, W. C., Graham, T. A. & Wright, N. A. New paradigms in clonal evolution: punctuated equilibrium in cancer. J. Pathol.240, 126–136 (2016). [DOI] [PubMed] [Google Scholar]
- 39.Li, J. et al. Oncogenic properties of PPM1D located within a breast cancer amplification epicenter at 17q23. Nat. Genet.31, 133–134 (2002). [DOI] [PubMed] [Google Scholar]
- 40.Lee, J. J.-K. et al. ERα-associated translocations underlie oncogene amplifications in breast cancer. Nature618, 1024–1032 (2023). [DOI] [PMC free article] [PubMed] [Google Scholar]
- 41.Cortés-Ciriano, I. et al. Comprehensive analysis of chromothripsis in 2,658 human cancers using whole-genome sequencing. Nat. Genet.52, 331–341 (2020). [DOI] [PMC free article] [PubMed] [Google Scholar]
- 42.Farabegoli, F. et al. Simultaneous chromosome 1q gain and 16q loss is associated with steroid receptor presence and low proliferation in breast carcinoma. Mod. Pathol.17, 449–455 (2004). [DOI] [PubMed] [Google Scholar]
- 43.Russnes, H. G. et al. Genomic architecture characterizes tumor progression paths and fate in breast cancer patients. Sci. Transl. Med.2, 38ra47 (2010). [DOI] [PMC free article] [PubMed] [Google Scholar]
- 44.Rye, I. H. et al. Quantitative multigene FISH on breast carcinomas identifies der(1;16)(q10;p10) as an early event in luminal A tumors. Genes Chromosomes Cancer54, 235–248 (2015). [DOI] [PMC free article] [PubMed] [Google Scholar]
- 45.Privitera, A. P., Barresi, V. & Condorelli, D. F. Aberrations of chromosomes 1 and 16 in breast cancer: a framework for cooperation of transcriptionally dysregulated genes. Cancers13, 1585 (2021). [DOI] [PMC free article] [PubMed] [Google Scholar]
- 46.Abby, E. et al. Notch1 mutations drive clonal expansion in normal esophageal epithelium but impair tumor growth. Nat. Genet.55, 232–245 (2023). [DOI] [PMC free article] [PubMed] [Google Scholar]
- 47.Dawson, S. J., Rueda, O. M., Aparicio, S. & Caldas, C. A new genome-driven integrated classification of breast cancer and its implications. EMBO J.32, 617–628 (2013). [DOI] [PMC free article] [PubMed] [Google Scholar]
- 48.Martins, F. C. et al. Evolutionary pathways in BRCA1-associated breast tumors. Cancer Discov.2, 503–511 (2012). [DOI] [PMC free article] [PubMed] [Google Scholar]
- 49.Kong, L. R. et al. A glycolytic metabolite bypasses ‘two-hit’ tumor suppression by BRCA2. Cell187, 2269–2287 (2024). [DOI] [PubMed] [Google Scholar]
- 50.Sedic, M. et al. Haploinsufficiency for BRCA1 leads to cell-type-specific genomic instability and premature senescence. Nat. Commun.6, 7505 (2015). [DOI] [PMC free article] [PubMed] [Google Scholar]
- 51.Askew, D. S., Ashmun, R. A., Simmons, B. C. & Cleveland, J. L. Constitutive c-myc expression in an IL-3-dependent myeloid cell line suppresses cell cycle arrest and accelerates apoptosis. Oncogene6, 1915–1922 (1991). [PubMed] [Google Scholar]
- 52.Evan, G. I. et al. Induction of apoptosis in fibroblasts by c-myc protein. Cell69, 119–128 (1992). [DOI] [PubMed] [Google Scholar]
- 53.Strasser, A., Harris, A. W., Bath, M. L. & Cory, S. Novel primitive lymphoid tumours induced in transgenic mice by cooperation between myc and bcl-2. Nature348, 331–333 (1990). [DOI] [PubMed] [Google Scholar]
- 54.Girish, V. et al. Oncogene-like addiction to aneuploidy in human cancers. Science381, eadg4521 (2023). [DOI] [PMC free article] [PubMed] [Google Scholar]
- 55.Watson, E. V. et al. Chromosome evolution screens recapitulate tissue-specific tumor aneuploidy patterns. Nat. Genet.56, 900–912 (2024). [DOI] [PMC free article] [PubMed] [Google Scholar]
- 56.Tirkkonen, M. et al. Distinct somatic genetic changes associated with tumor progression in carriers of BRCA1 and BRCA2 germ-line mutations. Cancer Res.57, 1222–1227 (1997). [PubMed] [Google Scholar]
- 57.Davies, H. et al. HRDetect is a predictor of BRCA1 and BRCA2 deficiency based on mutational signatures. Nat. Med.23, 517–525 (2017). [DOI] [PMC free article] [PubMed] [Google Scholar]
- 58.Gould, S. J. & Eldredge, N. Punctuated equilibrium comes of age. Nature366, 223–227 (1993). [DOI] [PubMed] [Google Scholar]
- 59.Davis, A., Gao, R. & Navin, N. Tumor evolution: linear, branching, neutral or punctuated? Biochim. Biophys. Acta1867, 151–161 (2017). [DOI] [PMC free article] [PubMed] [Google Scholar]
- 60.Gejman, R. S. et al. Rejection of immunogenic tumor clones is limited by clonal fraction. eLife7, e41090 (2018). [DOI] [PMC free article] [PubMed] [Google Scholar]
- 61.Davoli, T., Uno, H., Wooten, E. C. & Elledge, S. J. Tumor aneuploidy correlates with markers of immune evasion and with reduced response to immunotherapy. Science355, eaaf8399 (2017). [DOI] [PMC free article] [PubMed] [Google Scholar]
- 62.Worrall, J. T. et al. Non-random mis-segregation of human chromosomes. Cell Rep.23, 3366–3380 (2018). [DOI] [PMC free article] [PubMed] [Google Scholar]
- 63.Gray, G. K. et al. A human breast atlas integrating single-cell proteomics and transcriptomics. Dev. Cell57, 1400–1420.e7 (2022). [DOI] [PMC free article] [PubMed] [Google Scholar]
- 64.Lai, D. & Shah, S. HMMcopy: copy number prediction with correction for GC and mappability bias for HTS data. R package version 1. 10.18129/B9.bioc.HMMcopy (2012).
- 65.Salehi, S. et al. Cancerphylo genetic tree inference at scale from 1000s of single cell genomes. Peer Commun. J.3, e63 (2023). [Google Scholar]
- 66.Davis, A., Gao, R. & Navin, N. E. SCOPIT: sample size calculations for single-cell sequencing experiments. BMC Bioinformatics20, 566 (2019). [DOI] [PMC free article] [PubMed] [Google Scholar]
- 67.Williams, M. Dataset for ‘Luminal breast epithelial cells from wildtype and BRCA mutation carriers harbor copy number alterations commonly associated with breast cancer’ (0.0.1). Zenodo10.5281/zenodo.13645601 (2024).
- 68.Williams, M. & Funnell, T. shahcompbio/signals: v0.10.0. Zenodo10.5281/zenodo.10285492 (2023).
- 69.Williams, M. marcjwilliams1/normal_brca_scdna: v0.1.0. Zenodo10.5281/zenodo.13904325 (2024).
Associated Data
This section collects any data citations, data availability statements, or supplementary materials included in this article.
Supplementary Materials
Supplementary Figs. 1–4.
Supplementary Table 1: Clinical details of the 28 donor patients including BRCA1/BRCA2 mutations, age, cancer history, chemotherapy history, details on pathological review, parity and menopause status. Final path status indicates the breast from which the tissue was acquired ((R)ight or (L)eft) and any notable abnormalities. Supplementary Table 2: Cell level statistics, including cell_id, sample, cell_type, cell coverage, number of aneuploid arms and extreme aneuploidy classification. Supplementary Table 3: Statistics related to the enrichment of split reads for cells containing 1q-gain/16q-loss or 1q-gain/10q-loss.
Data Availability Statement
Raw sequencing data are available from the European Genome-Phenome Archive (EGA) under accession EGAS00001007716. Processed data including all single-cell copy number calls are available at 10.5281/zenodo.13645601 (ref. 67).
Single-cell pipeline for processing DLP+ data is available at https://github.com/shahcompbio/single_cell_pipeline (v0.8.26). The SIGNALS R package (v.0.10.0) was used for the majority of plotting and downstream processing of scDNA-seq data (archived at 10.5281/zenodo.10285492 (ref. 68)). Code to reproduce all the figures is available at https://github.com/marcjwilliams1/normal_brca_scdna (archived at 10.5281/zenodo.13904325 (ref. 69)).


