

Abstract
Background:
Benign prostatic hyperplasia (BPH) is a common disease in middle-aged and elderly men, and its etiology is not completely clear. Late-onset hypogonadism (LOH) is a relatively common disease in the aging process of men. BPH is often accompanied by varying degrees of LOH, and the pathogenesis and progression of the two diseases are related. Sex hormone metabolism-related genes affect sex hormone metabolism, to determine androgen, estrogen, androgen/estrogen ratio, and their single nucleotide polymorphisms (SNPs) are common in the population. The relationship between BPH combined with LOH (LOH-BPH) and SNPs in genes related to sex hormone metabolism is still unclear. In this study, the authors hope to clarify the relationship between them through epidemiological investigation.
Objective:
To investigate the association between LOH-BPH and SNPs of sex hormone metabolism-related genes.
Materials and methods:
A total of 821 middle-aged and elderly men from 1 January 2017 to 31 December 2022, were retrospectively analyzed. According to the diagnosis of LOH-BPH, the patients were divided into LOH-BPH group and non-LOH-BPH group, and the related parameters of the two groups were compared. The parameters included age, total testosterone (tT), estradiol (E2), testosterone/estradiol ratio (T/E), dihydrotestosterone (DHT), sex hormone-binding globulin (SHBG), parameters associated with metabolic syndrome, parameters related to BPH, the International Index of Erectile Function 5 (IIEF-5) and erectile dysfunction (ED), and SNPs of genes related to sex hormone metabolism.
Results:
Sixty-eight participants were excluded from this study, and 753 eventually completed the study. ED accounted for 48.21%, LOH-BPH accounted for 41.30%, and non-LOH-BPH accounted for 58.70%. tT decreased with age and was negatively correlated with age (r=−0.68, P<0.0001). E2 increased with age and was positively correlated with age (r=0.61, P=0.032). T/E decreased with age and was negatively correlated with age (r=−0.71, P<0.0001). After adjusting for age, LOH-BPH is significantly correlated with tT (r=−0.754, OR=0.071, 95% CI: 0.0048–0.105, P<0.0001), E2 (r=0.765, OR=3.855, 95% CI: 1.828–5.833, P<0.0001), T/E (r=−0.751, OR=0.000, 95% CI: 0.000–0.000, P<0.0001) and ED (r=0.973, OR=5.02, 95% CI: 4.898–6.578, P=0.001). At the same time, the AA genotype of rs1843090 (r=−0.613, OR=0.052, 95% CI: 0.006–0.44, P=0.007), the CC genotype of rs2279357 (r=0.636, OR=20.963, 95% CI: 2.268–93.793, P=0.004), the GG genotype of rs743572 (r=0.681, OR=7.642, 95% CI: 5.005–11.668, P<0.0001), the AA genotype of rs712221 (r=−0.012, OR=0.468, 95% CI: 0.220–0.881, P=0.018), and the TT genotype of rs700518 (r=0.699, OR=26.04, 95% CI: 16.142–42.008, P<0.0001) were significantly associated with LOH-BPH.
Conclusions:
The morbidity of LOH-BPH can be associated with SNPs of genes related to sex hormone metabolism.
Keywords: benign prostatic hyperplasia, late-onset hypogonadism, sex hormone, single nucleotide polymorphisms
Introduction
Highlights
LOH-BPH can be predicted by single nucleotide polymorphisms of sex hormone metabolism-related genes.
The AA genotype of rs1843090 and rs712221 can be a protective factor for LOH-BPH.
The CC, GG, TT genotype of rs2279357, rs743572, rs700518 can be a risk factor for LOH-BPH.
The imbalance between androgen and estrogen can be the main mechanism of LOH-BPH.
Benign prostatic hyperplasia (BPH) is the most common benign neoplasm of aging men and is present in ~8% of men in the fourth decade of life but up to 90% of men in the ninth decade1–3. BPH can easily cause lower urinary tract symptoms, which affects the quality of life of patients, and its etiology is not completely clear1–3. Most scholars believe that the occurrence of BPH is related to the imbalance of sex hormone metabolism, mainly manifested in the increase of serum E2 to tT ratio, and estrogen directly or indirectly affects the growth and differentiation of the prostate4–6.
The term late-onset hypogonadism (LOH) was coined in 2002 and defined as a disease entity of clinical and biochemical syndrome associated with advancing age, characterized by symptoms and a deficiency in serum testosterone, and its reported prevalence varies from 2.1 to 12.3%7–13. LOH was classified as a combined primary and secondary hypogonadism since the endocrine capacity of the testes and the pituitary is impaired. Symptoms of LOH include loss of libido, erectile dysfunction, loss of muscle mass, increased body fat, anemia, osteoporosis, depressed mood, decreased vitality, sweating, and hot flushes7–13.
BPH combined with LOH (LOH-BPH) is common in clinical practice14–16. In our previous epidemiological investigation, it was found that the increase of estrogen and the decrease of androgen-to-estrogen ratio was high-risk factors for BPH, moreover, it was associated with rs700518 and rs743572 single nucleotide polymorphisms (SNP)17. The relationship between LOH-BPH and sex hormones and SNP of genes related to sex hormone metabolism is not well reported18–21.
Therefore, in this study, we will investigate whether there is a correlation between SNP of sex hormone metabolism-related genes in BPH patients with or without LOH, to provide a basis for the clinical implementation of the same treatment for different diseases, different treatment for the same disease, and precision medicine for LOH-BPH.
Materials and methods
Patients
This study was a retrospective cohort study. The present study was approved by the Institutional Review Board of Beijing Shijitan Hospital in December 2017 and the Ethics Committee of the Affiliated Hospital of Zunyi Medical University in March 2019 and 2022. All procedures performed in the present study involving human participants were in accordance with the ethical standards of the Institutional Committee and with the 1964 Helsinki Declaration and its later amendments or similar ethical standards. The work has been reported in line with the strengthening the reporting of cohort, cross-sectional, and case–control studies in surgery (STROCSS) criteria (Supplemental Digital Content 1, http://links.lww.com/JS9/C579) and in its references22. The study was registered with the Chinese Clinical Trials Registry, and its registration ID: ChiCTR2200057632. From October 2017 to March 2022, 821, community elderly men (age, 52–86 years) residents who had an international prostate symptom score (IPSS), international index of erectile function 5 (IIEF-5), aging male symptoms (AMS) questionnaire evaluations, and had consecutively participated in prostate examinations at Beijing Shijitan Hospital and Affiliated Hospital of Zunyi Medical University were recruited into this study.
Inclusion criteria: (i) middle-aged and elderly men in the community; (ii) completes the IPSS score and AMS questionnaire; (iii) participated in routine physical examination and the prostate examination; (iv) completed the detection of sex hormones and SNPs of genes related to sex hormone metabolism; (v) completed the blood prostate-specific antigen (PSA) detection, and routine biochemical index detection.
Exclusion criteria: (i) when a PSA greater than 4 ng/ml were encountered, a prostate biopsy was required provided that the criteria for prostate biopsy were met, and the diagnosis of prostate cancer was excluded before participants could be recruited into this study; (ii) to minimize latent confounding factors and bias, the participants who had a history of prostate or urethral surgery, those who had been diagnosed with urologic diseases, including prostatitis, epididymitis, orchitis, testicular tumor, testicular tuberculosis, testicular trauma, testicular absence, cryptorchidism, urethral stricture, urologic infections, malignancy, or neurogenic bladder; (iii) and those who had been taking medicine, including anticholinergics, 5a-reductase inhibitors, phosphodiesterase-5 inhibitors, and hormone replacement therapy were excluded from the study.
Blood specimen collection, detection, and cryopreservation
All the blood specimens were obtained from the subjects in the morning after an overnight fast. The serum PSA levels were determine to use radioimmunoassay. The serum total testosterone (tT), estradiol (E2), dihydrotestosterone (DHT), and androgen-binding globulin (SHBG) was determined by enzyme-linked immunosorbent assay (ELISA) at Beijing Huada Protein Research and Development Center Co., Ltd. Molecular testing laboratory (Beijing Protein Innovation) and the DRG Elisa kits were used. The T/E ratio was calculated using serum total testosterone divided by estradiol. The biochemical analyses, including fasting plasma glucose (FPG), triglycerides (TG), HDL-C, and total cholesterol (TC), were determined by fully automatic biochemical analyzer. The genomic DNA was extracted from peripheral blood (cryopreserved in advance) using standard phenol/chloroform method.
SNP selection and genotyping
A total of 29 SNP in 9 genes related to sex hormone metabolism was detected by matrix assisted laser resolution ionization flight time mass spectrometry (MALDI-TOF-MS), including the following: AR (rs1204038, rs1204039, rs1204040, rs2255702); ESR-α(rs2234693, rs712221, rs532010); CYP17A1(rs4919686, rs3781287, rs743572), CYP1B1(rs10012, rs1056827, rs1056836); SRD5A2 (rs523349, rs632148, rs9332975); SHBG (rs6259, rs2908809, rs858518, rs858521); CYP11A1 (rs2073475, rs2279357, rs7173655, rs1843090); CYP19A1 (rs700518, rs4646); INSL3 (rs6523, rs1003887, rs8112876). These SNPs were selected by Gene Bank database (http://www.ncbi.nlm.nih.gov/SNP) for analysis. Peripheral blood samples from each subject were stored in ethylenediaminetetraacetic acid in blood sampling tubes at −20°C. Genomic DNA was extracted using a standard phenol/chloroform method. PCR amplified target sequences were shown in Appendix Table (Supplemental Digital Content 2, http://links.lww.com/JS9/C580). The reaction contained 20 ng (2 μl) of genomic DNA. Universal reaction condition were detailed in reference17. MALDI-TOF-MS was used for detection, and Typer 4.0 software was used detecting the mass spectra and the target sites of the genotypes for each sample were read according to the mass spectra. Assay design, DNA isolation, PCR amplification, direct sequencing, and analysis was performed with the iPLEX MassARRAY platform (Sequenom)23,24.
Diagnosis of BPH
Medical histories were collected using a standardized structured questionnaire. The Chinese version of IPSS was administered to the subjects for evaluation of urinary symptoms. Prostate volume (PV) was measured and calculated and maximum urinary flow rate (Qmax) was determined (see reference17 for details). All subjects underwent digital examinations of the rectum to exclude palpable prostatic nodules. The reference value of PSA in BPH should meet the following requirements: (i) PSA less than 4 ng/ml; (ii) When PSA is in the gray zone range of 4–10 ng/ml, the ratio of free PSA to total PSA should be greater than 0.16, PSA density should be less than 0.15, PSA velocity should be less than 0.75 ng/ml.y, otherwise prostate biopsy should be performed to exclude prostate cancer; (iii) When PSA was more than 10 ng/ml, prostate biopsy was required to exclude prostate cancer before enrollment in this study. According to results from the placebo-arm study of the Medical Therapy of Prostatic Symptoms Study (MTOPS), TPV >20 cm3 were defined as prostatomegaly25.
Diagnosis of LOH
The diagnosis of LOH was based on the criteria for tT levels <12 nmol/l when accompanied by relevant symptoms, especially sexual ones (low sexual desire, reduced spontaneous erections, and erectile dysfunction)9,26,27. Psychological, somatic, and sexual symptoms were assessed for each participant using the AMS questionnaire. And the AMS scale includes 17 items to assess symptoms that may be associated with androgen decline in aging males. Each question is answered on a scale from 1 to 5. The 17 items comprise three subscale: psychological, somatic, and sexual symptoms – all of which were dichotomized into symptomatic (response 3–5) and asymptomatic (response 1–2) categories28.
Definition of LOH-BPH
It meets the diagnostic criteria of BPH and LOH. Additionally, LOH and BPH coexist in the same patient, which is called LOH-BPH9,25–27.
Definition of erectile dysfunction (ED)
An IIEF-5 score between 1 and 21 was defined as ED. An IIEF-5 score between 22 and 25 was defined as normal sexual function.
Definition of MetS
MetS was diagnosed using the 2005 National Cholesterol Education Program-Adult Treatment Panel III (NCEP-ATP III) criterion for Asian Americans (Grundy et al., 2005). The modi-fied NCEP-ATP III defined MetS as the simultaneous occurrence of at least three of the following five risk factors: (i) waist circumference ≥90 cm, (ii) triglycerides ≥1.70 mmol/l or drug treatment for elevated triglycerides, (iii) HDLC <1.04 mmol/l or medicine treatment for reduced HDL-C, (iv) blood pressure ≥130/85 mmHg or antihypertensive drug treatment with a history of hypertension, and (v) FPG ≥6.1 mmol/l, 2-h postprandial blood glucose (2hPG) ≥7.8 mmol/l or drug treatments for elevated glucose.
Cohort grouping and clinical data extraction
Among all participants with BPH, the cohort was divided into two groups according to the presence or absence of LOH: LOH-BPH group and Non-LOH-BPH group. The following parameters was obtained from each participant: age, the body height, body weight, waist circumference (WC), blood pressure includes systolic and diastolic blood pressure, PV, Qmax, tT, E2, DHT, SHBG, FPG, TG, HDL-C, PSA, and 29 SNPs in nine genes related to sex hormone metabolism, including the following: AR (rs1204038, rs1204039, rs1204040, rs2255702); ESR-α(rs2234693, rs712221, rs532010); CYP17A1(rs4919686, rs3781287, rs743572), CYP1B1(rs10012, rs1056827, rs1056836); SRD5A2 (rs523349, rs632148, rs9332975); SHBG (rs6259, rs2908809, rs858518, rs858521); CYP11A1 (rs2073475, rs2279357, rs7173655, rs1843090); CYP19A1 (rs700518, rs4646); INSL3 (rs6523, rs1003887, rs8112876), were genotyped. Whether BPH was diagnosed, whether LOH was diagnosed, whether ED was diagnosed, whether LOH-BPH was diagnosed. The parameters of the extracted data are detailed in Figure 1.
Figure 1.

Flow chart of the study design. AMS, aging male symptoms; BPH, benign prostatic hyperplasia; DHT, dihydrotestosterone; ED, erectile dysfunction; E2, estradiol; FPG, fasting plasma glucose; HDL-C, high-density lipoprotein cholesterol; IIEF-5, international index of erectile function 5; IPSS, international prostate symptom score; LOH, late-onset hypogonadism; MetS, metabolic syndrome; PSA, prostate-specific antigen; PV, prostate volume; Qmax, maximum urinary flow rate; SHBG, sex hormone-binding globulin; SNP, single nucleotide polymorphisms; TG, Triglycerides; tT, total testosterone; WC, Waist circumference.
Statistical analyses
Statistical analyses were performed using Statistical Package for the Social Sciences (IBM Corp.) version 29.0. Selected characteristics are expressed as mean and SD (mean±SD), as well as percentages (%) for comparisons between LOH-BPH and non-LOH-BPH groups. Student’s t-test and one-way analysis of variance (one-way ANOVA) was used for continuous variables. Allelic and genotypic associations were evaluated by χ 2 tests. Correlation coefficients (r) were evaluated by the correlation analysis. Multivariate-adjusted odds ratios (ORs) and 95% CIs were simultaneously estimated by logistic regression analyses. Differences are considered statistically significant when P<0.05.
Theory/calculation
The theory of this study was that SNPs of sex hormone metabolism-related genes affect the levels of sex hormones, resulting in sex hormone imbalance and resulting in the occurrence of LOH-BPH (See Fig. 2 for details).
Figure 2.
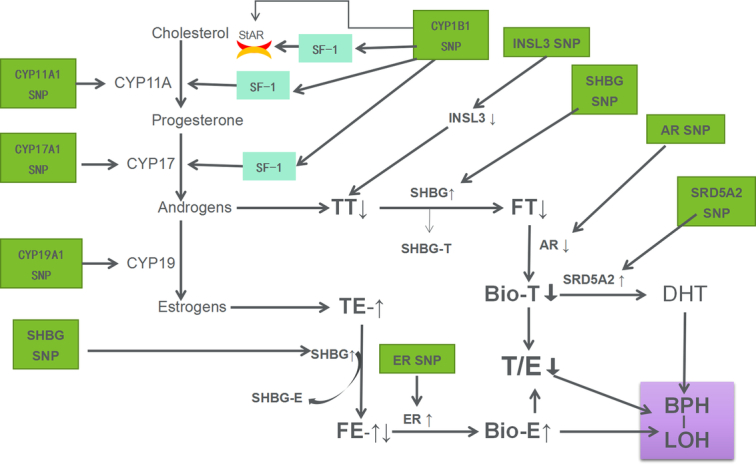
Schematic representation of possible mechanisms by which SNPs in genes involved in sex hormone metabolism affect sex hormone levels leading to LOH-BPH. AR, androgen receptor; BPH, benign prostatic hyperplasia; CPY, cytochrome C P450 enzyme; DHT, dihydrotestosterone; ER, estrogen receptor; FE, free estrogen; FT, free testosterone; INSL3, insulin-like growth factor-3; LOH, late-onset hypogonadism; SHBG, sex hormone-binding globulin; SRD5A2, Steroid 5-alpha reductase 2; SF-1, steroidogenic factor-1; StAR, steroidogenic acute regulatory proteins; SNP, single nucleotide polymorphisms; TT, total testosterone; TE, total estrogen.
Results
Patient characteristics
In this study, 68 participants were excluded, and 753 eventually accomplished the study. The principal characteristics of the study population are listed in Table 1. The age ranged from 52 to 86 years, tT ranged from 0.21 ng/ml to 32.50 ng/ml, E2 ranged from 12.09 pg/ml to 151.41 ng/ml, T/E ranged from 0.01 ng/pg to 0.89 ng/ml, IIEF-5 ranged from 8 to 24, DHT ranged from 82.62 pg/ml to 2761.41 pg/ml, PSA ranged from 0.03 ng/ml to 9.51 ng/ml, ED, hypertension, hypertriglyceridemia, type 2 diabetes mellitus, obesity, MetS accounted for 48.21, 38.38, 26.83, 38.91, 9.69, 28.55%, respectively. LOH-BPH accounted for 41.30%, and non-LOH-BPH accounted for 58.70%. Smoking, drinking, high-fat high-calorie diet and lack of exercise accounted for 45.15, 48.87, 32.14, and 66.03%, respectively. 69.59% of the patients lived in cities, and 30.41% lived in rural areas. Patients with higher education, secondary education, and lower education accounted for 64.94, 14.21, and 20.85%, respectively.
Table 1.
Baseline characteristics of the participants (n=753).
| Variables | Mean | SD | Min | Max |
|---|---|---|---|---|
| Age, years | 70.20 | 8.00 | 52 | 86 |
| tT, ng/ml | 5.11 | 2.22 | 0.21 | 32.50 |
| E2, pg/ml | 40.81 | 13.71 | 12.09 | 151.41 |
| T/E, ng/pg | 0.13 | 0.08 | 0.01 | 0.89 |
| IIEF-5 | 16.75 | 4.34 | 8 | 24 |
| DHT, pg/ml | 394.09 | 192.97 | 82.62 | 2761.41 |
| SHBG, nmol/l | 94.76 | 45.51 | 24.83 | 207.93 |
| PSA, ng/ml | 1.62 | 1.52 | 0.03 | 9.51 |
| FPG, mmol/l | 5.53 | 1.29 | 3.62 | 14.52 |
| IPSS | 20.35 | 5.93 | 7 | 34 |
| Qmax, ml/sec | 16.72 | 5.91 | 3.7 | 39.2 |
| PV, ml | 27.86 | 6.75 | 20.4 | 50.9 |
| BMI, kg/m2 | 25.75 | 3.01 | 17.6 | 38.2 |
| WC, cm | 90.59 | 9.19 | 64 | 119 |
| TG, mmol/l | 1.79 | 0.99 | 0.38 | 8.76 |
| HDL-C, mmol/l | 2.13 | 1.06 | 0.55 | 5.20 |
| Addiction of tobacco, % | 45.15 (340/753) | |||
| Addiction of alcohol, % | 48.87 (368/753) | |||
| Diet information | ||||
| High-fat high-calorie, % | 32.14 (242/753) | |||
| Regular, % | 67.86 (511/753) | |||
| Physical exercise situation | ||||
| Keep exercising, % | 33.07 (249/753) | |||
| Lack of exercise, % | 66.03 (504/753) | |||
| Dwelling environment | ||||
| Living in city, % | 69.59 (524/753) | |||
| Living in the country, % | 30.41 (229/753) | |||
| Education background | ||||
| ≤6 years, % | 20.85 (157/753) | |||
| 7–12 years, % | 14.21 (107/753) | |||
| ≥13 years, % | 64.94 (489/753) | |||
| Hypertension, % | 38.38 (289/753) | |||
| Hypertriglyceridemia, % | 26.83 (202/753) | |||
| Type 2 diabetes mellitus, % | 38.91 (293/753) | |||
| Obesity, % | 9.69 (73/753) | |||
| MetS, % | 28.55 (215/753) | |||
| ED, % | 48.21 (363/753) | |||
| Non-LOH-BPH, % | 58.70(442/753) | |||
| LOH-BPH, % | 41.30(311/753) | |||
BPH, benign prostatic hyperplasia; DHT, dihydrotestosterone; E2, estradiol; ED, erectile dysfunction; FPG, fasting plasma glucose; HDL-C, high-density lipoprotein cholesterol; IIEF-5, international index of erectile function 5; IPSS, international prostate symptom score; LOH, late-onset hypogonadism; MetS, metabolic syndrome; PSA, prostate-specific antigen; PV, prostate volume; Qmax, maximum urinary flow rate; SHBG, sex hormone-binding globulin; TG, triglycerides; tT, total testosterone; WC, waist circumference.
Changes of sex hormones (tT, E2, T/E) with age in patients with BPH with or without LOH
As shown in Figure 3, a total of 753 BPH patients with or without LOH was included in this study. We stratified the age by 5 years and analyzed the changes of sex hormones with age. The results showed that tT decreased with age and was negatively correlated with age (r=−0.68, P<0.0001). E2 increased with age and was positively correlated with age (r=0.61, P=0.032). T/E decreased with age and was negatively correlated with age (r=0.71, P<0.0001).
Figure 3.
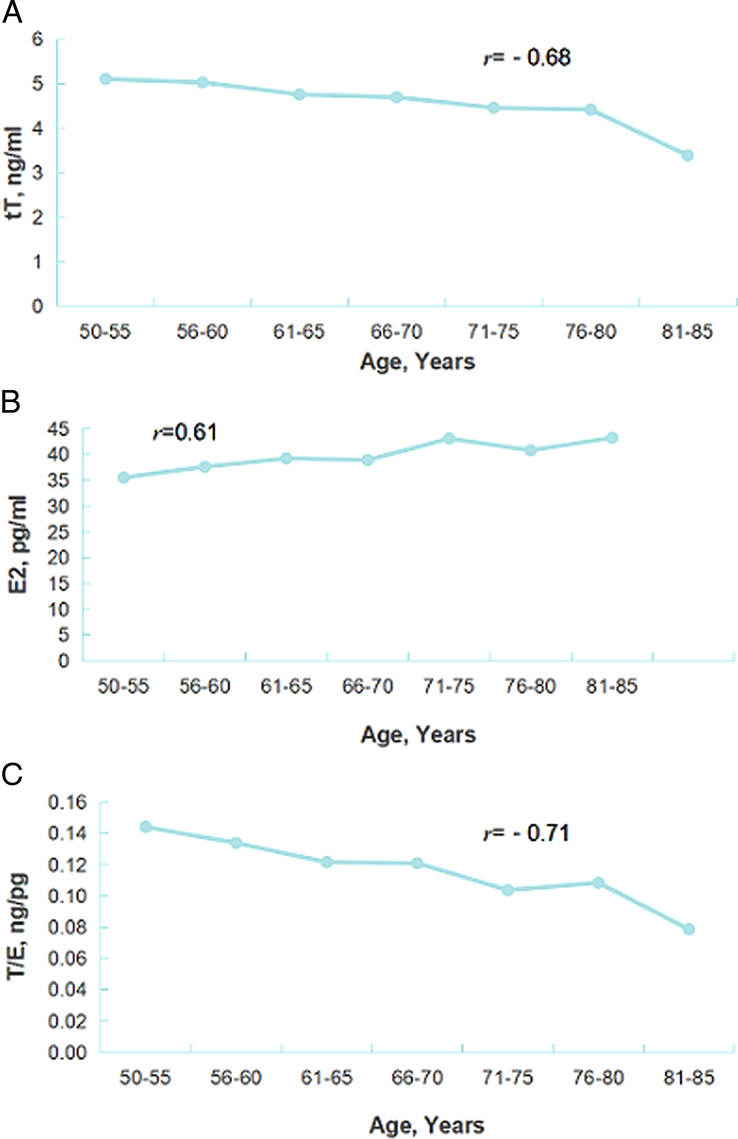
Changes of sex hormones (tT, E2, T/E) with age in patients with BPH with or without LOH. r stands for correlation coefficient for linear correlation analysis; A: P<0.0001; B: P=0.032; C: P<0.0001; BPH, benign prostatic hyperplasia; E2, estradiol; LOH, late-onset hypogonadism; tT, total testosterone; T/E, the ratio of total testosterone to estradiol.
Association between the disease of LOH-BPH and the related parameters of sex hormone
As shown in Table 2, LOH-BPH is significantly correlated with age (r=0.622, OR=2.834, 95% CI: 1.416–4.948, P=0.023), tT (r=−0.754, OR=0.071, 95% CI: 0.0048–0.105, P<0.0001), E2 (r=0.765, OR=3.855, 95% CI: 1.828–5.833, P<0.0001), T/E (r=−0.675, OR=0.000, 95% CI: 0.000–0.000, P<0.0001), smoking (r=0.758, OR=1.896, 95% CI: 1.241–2.898, P=0.003), drinking (r=0.833, OR=1.894, 95% CI: 1.233–2.908, P=0.004), BMI (r=0.742, OR=1.991, 95% CI: 1.103–3.267, P=0.038), WC (r=0.734, OR=1.985, 95% CI: 1.127–3.391, P=0.036), type 2 diabetes mellitus (r=0.686, OR=3.146, 95% CI: 1.212–5.226, P<0.0001), Obesity (r=0.672, OR=2.126, 95% CI: 1.104–4.095, P=0.024), MetS (r=0.776, OR=158.59, 95% CI: 101.887–257.505, P<0.0001), and ED (r=0.973, OR=5.02, 95% CI: 4.898–6.578, P=0.001). According to the negative correlation coefficient r, OR value less than 1, and 95% CI less than 1, it can be judged that LOH-BPH is negatively correlated with tT, and T/E, and the decreased tT and T/E value can be a risk factor for LOH-BPH. On the contrary, according to the positive correlation coefficient r, an OR value greater than 1, and a 95% CI greater than 1, it can be judged that they can be risk factors for LOH-BPH for age, smoking, drinking, ED, MetS, obesity, type 2 diabetes, the increased BMI and WC, and the elevated E2.
Table 2.
Association between the disease of LOH-BPH and the related parameters of sex hormone, BPH, and MetS (n=753).
| Parameters | Number | LOH-BPH | a P | b r | OR | cB | d P | 95% CI |
|---|---|---|---|---|---|---|---|---|
| Age, year | ||||||||
| e(–) | 442 | 69.13±8.37 | ||||||
| f(+) | 311 | 70.95±7.65 | 0.002 | 0.622 | 2.834 | 0.616 | 0.023 | 1.416–4.948 |
| tT, ng/ml | ||||||||
| e(–) | 442 | 5.66±2.46 | ||||||
| f(+) | 311 | 3.30±0.73 | <0.0001 | −0.754 | 0.071 | −2.643 | <0.0001 | 0.0048–0.105 |
| E2, pg/ml | ||||||||
| e(–) | 442 | 38.11±14.12 | ||||||
| f(+) | 311 | 44.64±12.14 | <0.0001 | 0.765 | 3.855 | 3.156 | <0.0001 | 1.828–5.883 |
| T/E, ng/pg | ||||||||
| e(–) | 442 | 0.17±0.09 | ||||||
| f(+) | 311 | 0.08±0.03 | <0.0001 | −0.675 | 0.000 | −96.428 | <0.0001 | 0.000–0.000 |
| SHBG, nmol/l | ||||||||
| e(–) | 442 | 87.47±34.81 | ||||||
| f(+) | 311 | 55.87±27.21 | <0.0001 | −0.435 | 0.996 | −0.004 | 0.689 | 0.978–1.015 |
| DHT, pg/ml | ||||||||
| e(–) | 442 | 427.24±261.23 | ||||||
| f(+) | 311 | 331.22±142.59 | 0.001 | −0.117 | 0.997 | −0.003 | 0.057 | 0.995-1 |
| ED | ||||||||
| e(–) | 52 | 6.91% | ||||||
| f(+) | 311 | 41.30% | <0.0001 | 0.973 | 5.02 | 24.64 | 0.001 | 4.898–6.578 |
| PSA, ng/ml | ||||||||
| e(–) | 442 | 1.64±1.58 | ||||||
| f(+) | 311 | 1.61±1.42 | 0.795 | −0.009 | 1.014 | 0.014 | 0.831 | 0.889–1.157 |
| FPG, mmol/l | ||||||||
| e(–) | 442 | 5.62±1.32 | ||||||
| f(+) | 311 | 6.50±1.65 | <0.0001 | 0.726 | 1.209 | 0.009 | 0.955 | 0.784–1.378 |
| IPSS | ||||||||
| e(–) | 442 | 20.55±5.99 | ||||||
| f(+) | 311 | 20.01±5.83 | 0.268 | −0.04 | 0.986 | −0.014 | 0.408 | 0.952–1.022 |
| Qmax, ml/sec | ||||||||
| e(–) | 442 | 16.77±5.79 | ||||||
| f(+) | 311 | 16.66±6.08 | 0.811 | −0.009 | 1.005 | 0.005 | 0.811 | 0.964–1.041 |
| PV, ml | ||||||||
| e(–) | 442 | 28.29±7.10 | ||||||
| f(+) | 311 | 27.26±6.17 | 0.038 | −0.075 | 0.996 | −0.004 | 0.811 | 0.966–1.028 |
| BMI, kg/m2 | ||||||||
| e(–) | 442 | 22.43±2.70 | ||||||
| f(+) | 311 | 25.99±3.14 | <0.0001 | 0.742 | 1.991 | 1.127 | 0.038 | 1.103–3.267 |
| WC, cm | ||||||||
| e(–) | 442 | 84.65±7.56 | ||||||
| f(+) | 311 | 89.23±8.97 | <0.0001 | 0.734 | 1.985 | 1.115 | 0.036 | 1.127–3.391 |
| TG, mmol/l | ||||||||
| e(–) | 442 | 1.17±0.68 | ||||||
| f(+) | 311 | 1.83±1.13 | <0.0001 | 0.659 | 0.817 | −0.202 | 0.235 | 0.586–1.140 |
| HDL-C, mmol/l | ||||||||
| e(–) | 442 | 2.67±0.79 | ||||||
| f(+) | 311 | 1.96±1.12 | <0.0001 | −0.348 | 0.986 | −0.015 | 0.942 | 0.668–1.455 |
| Addiction of tobacco | ||||||||
| e(–) | 155 | 20.58% | ||||||
| f(+) | 185 | 24.57% | <0.0001 | 0.758 | 1.896 | 0.640 | 0.003 | 1.241–2.898 |
| Addiction of alcohol | ||||||||
| e(–) | 185 | 24.57% | ||||||
| f(+) | 183 | 24.30% | <0.0001 | 0.833 | 1.894 | 0.639 | 0.004 | 1.233–2.908 |
| Diet information | ||||||||
| High-fat high-calorie, % | 242 | 40.50% (98/242) | 0.758 | 0.011 | 0.139 | −1.976 | 0.082 | 0.015–1.289 |
| Regular, % | 511 | 41.68% (213/511) | ||||||
| Physical exercise situation | ||||||||
| Keep exercising, % | 504 | 40.87% (206/504) | ||||||
| Lack of exercise, % | 249 | 42.17% (105/249) | 0.734 | 0.012 | 0.085 | −2.460 | 0.022 | 0.01–0.675 |
| Dwelling environment | ||||||||
| Living in city, % | 524 | 42.18% (221/524) | 0.462 | 0.027 | 0.808 | −0.213 | 0.724 | 0.249–2.628 |
| Living in the country, % | 229 | 39.30% (90/229) | ||||||
| Education background | ||||||||
| ≤6 years, % | 107 | 43.93% (47/107) | ||||||
| 7–12 years, % | 489 | 42.13% (206/489) | 0.324 | 0.324 | 0.837 | −0.136 | 0.718 | 0.416–1.830 |
| ≥13 years, % | 157 | 36.94% (58/157) | 0.324 | 0.036 | 0.644 | −0.440 | 0.355 | 0.253–1.638 |
| Hypertension | ||||||||
| e(-) | 82 | 11.02% | ||||||
| f(+) | 206 | 27.36% | <0.0001 | 0.586 | 1.653 | 0.503 | 0.123 | 0.873–3.132 |
| Hypertriglyceridemia | ||||||||
| e(–) | 43 | 5.71% | ||||||
| f(+) | 159 | 21.12% | <0.0001 | 0.560 | 0.751 | 0.286 | 0.509 | 0.322–1.754 |
| Type 2 diabetes mellitus | ||||||||
| e(–) | 107 | 14.21% | ||||||
| f(+) | 186 | 24.70% | <0.0001 | 0.686 | 3.146 | 2.961 | <0.0001 | 1.212–5.226 |
| Obesity | ||||||||
| e(–) | 26 | 3.45% | ||||||
| f(+) | 47 | 6.24% | 0.021 | 0.672 | 2.126 | 1.564 | 0.024 | 1.104–4.095 |
| MetS | ||||||||
| e(–) | 77 | 10.23% | ||||||
| f(+) | 138 | 18.33% | <0.0001 | 0.776 | 158.59 | 6.364 | <0.0001 | 101.887–257.505 |
Analysis of variance;
On behalf of the correlation coefficient;
On behalf of the regression coefficient;
Binary logistic/Linear regression analysis;
On behalf of the Non-LOH-BPH;
On behalf of the LOH-BPH;
The boldface represents statistical significance (P<0.05).
BPH, benign prostatic hyperplasia; DHT, dihydrotestosterone; E2, estradiol; ED, erectile dysfunction; FPG, fasting plasma glucose; HDL-C, high-density lipoprotein cholesterol; IPSS, international prostate symptom score; LOH, late-onset hypogonadism; MetS, metabolic syndrome; OR, odds ratio; PSA, prostate-specific antigen; PV, prostate volume; Qmax, maximum urinary flow rate; SHBG, sex hormone-binding globulin; TG, triglycerides; tT, total testosterone; WC, waist circumference.
The genotypes and allele distributions and association in LOH-BPH and Non-LOH-BPH group
As shown in Table 3, the AA genotype of rs1843090 (r=−0.613, OR=0.052, 95% CI: 0.006–0.44, P=0.007), the CC genotype of rs2279357 (r=0.636, OR=20.963, 95% CI: 2.268–93.793, P=0.004), the GG genotype of rs743572 (r=0.681, OR=7.642, 95% CI: 5.005–11.668, P<0.0001), the AA genotype of rs712221 (r=−0.012, OR=0.468, 95% CI: 0.220–0.881, P=0.018), and the TT genotype of rs700518 (r=0.699, OR=26.04, 95% CI: 16.142–42.008, P<0.0001) were significantly associated with LOH-BPH. According to the negative correlation coefficient r, OR value less than 1, and 95% CI less than 1, it can be judged that LOH-BPH is negatively correlated with AA genotype of rs1843090 and AA genotype of rs712221, and AA genotype of rs1843090 and AA genotype of rs712221 can be a protective factor for LOH-BPH. On the contrary, based on a positive correlation coefficient r, an OR value greater than 1, and a 95% CI greater than 1, it can be judged that LOH-BPH is positively correlated with CC genotype of rs2279357, GG genotype of rs743572, and TT genotype of rs700518, and CC genotype of rs2279357, GG genotype of rs743572, and TT genotype of rs700518 can be a risk factor for LOH-BPH.
Table 3.
The genotypes and allele distributions and association in LOH-BPH and Non-LOH-BPH group (n=753).
| CHR | SNP ID | Genes | Type | Model | LOH-BPH, n (%) | Non-BPH-LOH, n (%) | a P | b r | OR (95% CI) | cB | d P |
|---|---|---|---|---|---|---|---|---|---|---|---|
| 2 | rs10012 | CYP1B1 | 0.221 | −0.011 | |||||||
| GG | Allele | 200 (64.31) | 283 (64.03) | 0.410 (0.051–2.448) | −0.394 | 0.298 | |||||
| GC | 97 (31.19) | 171 (38.69) | … | … | |||||||
| CC | 14 (4.50) | 18 (4.08) | 0.124 (0.006–6.447) | −1.655 | 0.317 | ||||||
| 2 | rs1056827 | CYP1B1 | 0.294 | −0.053 | |||||||
| CC | Allele | 201 (64.63) | 285 (64.48) | 1.882 (0.275–12.726) | −0.849 | 0.521 | |||||
| CA | 97 (31.19) | 138 (31.22) | … | … | |||||||
| AA | 13 (4.18) | 19 (4.30) | 4.217 (0.096–282.662) | −0.107 | 0.41 | ||||||
| 2 | rs1056837 | CYP1B1 | 0.312 | −0.037 | |||||||
| GG | Allele | 230 (73.95) | 346 (78.28) | 2.253 (0.810–2.21) | −0.107 | 0.426 | |||||
| GA | 77 (24.76) | 87 (19.68) | … | … | |||||||
| AA | 4 (1.29) | 9 (2.04) | 1.013 (0.014–2.314) | −0.057 | 0.921 | ||||||
| 15 | rs1843090 | CYP11A1 | 0.037 | −0.613 | |||||||
| GG | Allele | 112 (34.66) | 130 (29.41) | 0.556 (0.233–1.046) | −3.65 | 0.089 | |||||
| GA | 133 (49.33) | 202 (45.70) | … | … | |||||||
| AA | 66 (16.01) | 110 (24.89) | 0.052 (0.006–0.44) | −2.961 | 0.007 | ||||||
| 15 | rs2073475 | CYP11A1 | 0.589 | −0.05 | |||||||
| CC | 106 (34.08) | 129 (29.19) | 0.559 (0.294–1.477) | −0.287 | 0.06 | ||||||
| CT | 148 (47.59) | 229 (51.81) | … | … | |||||||
| TT | Allele | 57 (18.33) | 84 (19.00) | 1.158 (0.505–2.119) | −0.068 | 0.891 | |||||
| 15 | rs2279357 | CYP11A1 | 0.041 | 0.636 | |||||||
| CC | Allele | 113 (36.33) | 128 (28.96) | 20.963 (2.268–93.793) | 3.043 | 0.004 | |||||
| CT | 141 (45.34) | 219 (49.55) | … | … | |||||||
| TT | 57 (18.33) | 95 (21.49) | 8.002 (0.901–71.092) | 2.08 | 0.062 | ||||||
| 15 | rs7173655 | CYP11A1 | 0.842 | 0.037 | |||||||
| CC | Allele | 122 (39.23) | 178 (40.27) | 0.584 (0.288–1.133) | 1.175 | 0.079 | |||||
| CT | 146 (46.95) | 205 (46.38) | … | … | |||||||
| TT | 43 (13.82) | 59 (13.35) | 2.520 (1.054–6.315) | 0.03 | 0.056 | ||||||
| 10 | rs743572 | CYP17A1 | <0.0001 | 0.681 | |||||||
| GG | 192 (30.66) | 128 (51.05) | 7.642 (5.005–11.668) | 2.504 | <0.0001 | ||||||
| GA | 67 (46.64) | 199 (26.71) | … | … | |||||||
| AA | Allele | 52 (22.70) | 115 (15.60) | 1.483 (0.841–4.797) | 0.129 | 0.236 | |||||
| 10 | rs3781287 | CYP17A1 | 0.573 | 0.033 | |||||||
| GG | 92 (29.58) | 142 (32.13) | 0.545 (0.293–1.013) | −0.607 | 0.055 | ||||||
| GT | 142 (45.66) | 188 (42.53) | … | … | |||||||
| TT | Allele | 77 (24.76) | 112 (25.34) | 1.233 (0.637–2.387) | 0.209 | 0.534 | |||||
| 10 | rs4919686 | CYP17A1 | 0.342 | 0.048 | |||||||
| CC | 7 (2.25) | 10 (2.26) | 0.495 (0.102–2.399) | 0.142 | 0.382 | ||||||
| CA | 59 (18.97) | 86 (19.46) | … | … | |||||||
| AA | Allele | 245 (78.78) | 346 (78.28) | 1.420 (0.792–2.545) | 1.634 | 0.239 | |||||
| 15 | rs4646 | CYP19A1 | 0.947 | −0.034 | |||||||
| CC | Allele | 158 (50.80) | 222 (50.23) | 0.754 (0.334–1.285) | −0.16 | 0.281 | |||||
| CA | 132 (42.45) | 185 (41.85) | |||||||||
| AA | 21 (6.75) | 35 (7.92) | 1.013 (0.280–2.764) | −0.398 | 0.964 | ||||||
| 15 | rs700518 | CYP19A1 | <0.0001 | 0.699 | |||||||
| CC | 27 (8.68) | 99 (22.40) | 0.894 (0.532–1.951) | 0.556 | 0.051 | ||||||
| CT | 64 (20.58) | 227 (51.36) | … | … | |||||||
| TT | Allele | 220 (70.74) | 116 (26.24) | 26.04 (16.142–42.008) | 3.745 | <0.0001 | |||||
| 6 | rs532010 | ESR1 | 0.025 | 0.015 | |||||||
| GG | 56 (18.01) | 82 (18.55) | 0.881 (0.333–2.280) | 0.679 | 0.678 | ||||||
| GA | 134 (43.09) | 198 (44.80) | … | … | |||||||
| AA | Allele | 121 (38.90) | 162 (36.65) | 0.547 (0.270–1.189) | 0.167 | 0.121 | |||||
| 6 | rs712221 | ESR1 | 0.008 | −0.012 | |||||||
| AA | Allele | 83 (26.69) | 180 (40.72) | 0.468 (0.220–0.881) | −0.061 | 0.018 | |||||
| AT | 157 (50.48) | 179 (40.50) | … | … | |||||||
| TT | 71 (22.83) | 83 (18.78) | 0.883 (0.533–1.462) | −0.124 | 0.629 | ||||||
| 6 | rs2234693 | ESR1 | 0.063 | 0.034 | |||||||
| CC | 56 (18.01) | 93 (21.04) | 1.041 (0.386–2.751) | 0.281 | 0.928 | ||||||
| CT | 158 (50.80) | 211 (47.74) | … | … | |||||||
| TT | Allele | 97 (31.19) | 138 (31.22) | 1.492 (0.671–3.313) | 0.346 | 0.316 | |||||
| 17 | rs6259 | SHBG | 0.974 | 0.008 | |||||||
| GG | Allele | 210 (67.52) | 300 (67.87) | 0.869 (0.337–2.236) | 0.259 | 0.789 | |||||
| GA | 87 (27.97) | 128 (28.96) | … | … | |||||||
| AA | 14 (4.51) | 14 (3.17) | 2.197 (0.697–6.929) | 0.787 | 0.179 | ||||||
| 17 | rs858518 | SHBG | 0.569 | 0.014 | |||||||
| GG | 43 (13.83) | 54 (12.22) | 0.744 (0.326–1.698) | 0.765 | 0.467 | ||||||
| GA | 128 (41.16) | 187 (42.31) | … | … | |||||||
| AA | Allele | 140 (45.01) | 201 (45.47) | 0.940 (0.501–1.773) | −1.333 | 0.839 | |||||
| 17 | rs858521 | SHBG | 0.278 | −0.003 | |||||||
| GG | Allele | 165 (53.05) | 232 (52.49) | 0.773 (0.277–1.847) | 0.608 | 0.495 | |||||
| GC | 124 (39.87) | 180 (24.43) | … | … | |||||||
| CC | 22 (7.08) | 30 (6.78) | 1.1917 (0.351–4.0673) | 0.323 | 0.876 | ||||||
| 17 | rs2908809 | SHBG | 0.368 | −0.009 | |||||||
| CC | 63 (20.26) | 82 (18.55) | 0.557 (0.143–1.481) | 0.679 | 0.261 | ||||||
| CT | 165 (53.05) | 245 (55.43) | … | … | |||||||
| TT | Allele | 83 (26.69) | 115 (20.02) | 0.767 (0.293–1.993) | 0.167 | 0.537 | |||||
| 2 | rs523349 | SRD5A2 | 0.799 | −0.049 | |||||||
| GG | 99 (31.83) | 152 (34.39) | 3.063 (0.347–28.28) | 0.501 | 0.372 | ||||||
| GC | 156 (50.16) | 206 (46.61) | … | … | |||||||
| CC | Allele | 56 (18.01) | 84 (19.00) | 0.447(0.063–2.451) | −0.029 | 0.379 | |||||
| 2 | rs632148 | SRD5A2 | 0.657 | −0.029 | |||||||
| GG | Allele | 67 (21.54) | 97 (21.95) | 2.124 (0.353–12.804) | −1.333 | 0.466 | |||||
| GC | 148 (47.59) | 196 (44.34) | … | … | |||||||
| CC | 96 (30.87) | 149 (33.71) | 0.241 (0.029–2.2478 | 0.765 | 0.239 | ||||||
| 2 | rs9332975 | SRD5A2 | 0.796 | 0.065 | |||||||
| CC | 9 (2.89) | 8 (1.81) | 4.496 (0.212–78.757) | 0.67 | 0.321 | ||||||
| CT | 46 (14.79) | 79 (17.87) | … | … | |||||||
| TT | Allele | 256 (82.32) | 355 (80.32) | 1.155 (0.501–2.307) | 0.051 | 0.679 | |||||
| 19 | rs6523 | INSL3 | 0.746 | −0.008 | |||||||
| TT | 82 (21.86) | 52 (13.75) | 10.20 (0.638–176.246) | −0.305 | 0.560 | ||||||
| TC | 141 (37.60 | 160 (42.32) | … | … | |||||||
| CC | Allele | 152 (40.54) | 166 (43.65) | 0.852 (0.172–5.148) | −0.843 | 0.974 | |||||
| 19 | rs1003887 | INSL3 | 0.470 | −0.032 | |||||||
| TT | Allele | 151 (40.26) | 167 (44.17) | 1.076 (0.458–2.516) | 0.025 | 0.887 | |||||
| TC | 134 (35.73) | 156 (41.26) | … | … | |||||||
| CC | 90 (24.01) | 55 (14.55) | 1.714 (0.582–5.204) | −0.372 | 0.364 | ||||||
| 19 | rs8112876 | INSL3 | 0.708 | 0.014 | |||||||
| AA | 151 (40.26) | 167 (44.17) | 1.076 (0.458–2.516) | 0.769 | 0.887 | ||||||
| AG | 134 (35.73) | 156 (41.26) | … | … | |||||||
| GG | Allele | 90 (24.01) | 55 (14.55) | 1.714 (0.582–5.204) | 0.403 | 0.364 | |||||
| X | rs1204038 | AR | GG | Allele | 375 (100) | 378 (100) | NS | … | … | ||
| X | rs1204039 | AR | GG | Allele | 375 (100) | 378 (100) | NS | … | … | ||
| X | rs1204040 | AR | CC | Allele | 375 (100) | 378 (100) | NS | … | … | ||
| X | rs2255702 | AR | CC | Allele | 375 (100) | 378 (100) | NS | … | … |
χ 2 test;
On behalf of the correlation coefficient;
On behalf of the regression coefficient;
Multivariate logistic regression analysis;
The boldface represents statistical significance (P<0.05).
BPH, benign prostatic hyperplasia; CHR, chromosome; LOH, late-onset hypogonadism; OR, odds ratio; SNP, single nucleotide polymorphisms.
Discussion
This study evaluated the association of sex hormones and SNPs in genes involved in sex hormone metabolism with LOH-BPH. It was found that tT decreased with age and was negatively correlated with age. E2 increased with age and was positively correlated with age. T/E decreased with age and was negatively correlated with age in patients with BPH with or without LOH. It was also discover that LOH-BPH was correlated with age, smoking, drinking, ED, MetS, type 2 diabetes mellitus, obesity, and the decreased tT and T/E, the increased BMI and WC, the elevated E2. At the same time, LOH-BPH was also correlated with the AA genotype of rs1843090, CC genotype of rs2279357, GG genotype of rs743572, AA genotype of rs712221, and the TT genotype of rs700518.
The results of this study showed that serum E2 level increases with age, which is not only positively correlated with age, but also can be a risk factor for LOH-BPH. At the same time, tT and T/E are not only negatively correlated with age, but also decreased tT and T/E can be risk factors for LOH-BPH. This phenomenon indicates that LOH-BPH is related to sex hormone imbalance, which is chiefly manifested in the increase of estrogen, the decrease of androgen and the decrease of androgen/estrogen ratio. According to the previous literature, BPH is considered an androgen target tissue and an estrogen target tissue2–6,29. Furthermore, our results showed a correlation between the decrease in tT and the increase in E2 (r=−0.57, P<0.0001, results not shown). Taken together with these results, we speculate that the elevation of estrogen can be secondary to androgen depletion and has an effect on BPH with or without LOH. According to Figure 2, our speculated mechanism of LOH-BPH shows that androgen can be converted to estrogen by aromatase, namely CYP19, which can be the main cause of sex hormone imbalance. This provides a basis for the treatment of androgen supplement and aromatase inhibitor to prevent the conversion of androgen to estrogens.
In terms of gene polymorphism, the results of this study showed that LOH-BPH was correlated with the AA genotype of rs1843090 of CYP11A1, CC genotype of rs2279357 of CYP11A1, GG genotype of rs743572 of CYP17A1, AA genotype of rs712221 of ESR1 and the TT genotype of rs700518 of CYP19A1. Moreover, AA genotype of rs1843090 of CYP11A1 and AA genotype of rs712221 of ESR1 was protective factors for LOH-BPH, and CC genotype of rs2279357 of CYP11A1, GG genotype of rs743572 of CYP17A1, and TT genotype of rs700518 of CYP19A1 were risk factors for LOH-BPH (see Table 3, Figs. 1 and 2). This finding has not been reported previously, which provides a basis for predicting the occurrence of LOH-BPH by detecting gene polymorphism, provides direction for further research, and provides a reference for the same treatment for different diseases and different treatment for the same disease17–21,30.
In this study, we confirmed the association between sex hormone imbalance and LOH-BPH, as well as the association between SNPs of genes related to sex hormone metabolism and LOH-BPH. In terms of SNPs, ESR1, CYP19A1, CYP17A1, CYP11A1 genes were associated with LOH-BPH. Nevertheless, no significant association was found for the other genes, which needs to be further studied.
In this study, we also discovered that LOH-BPH was associated with age, smoking, drinking, ED, obesity, type 2 diabetes mellitus, MetS, and they were risk factors for LOH-BPH. This is consistent with previous research reports, indicating that these diseases are related to living habits, dietary habits and aging2,7,12,13,17,26–28. At the same time, these diseases can be attributed to metabolic diseases, and may have the same etiology and pathogenesis, which provides a basis for further research.
The present study had some limitations. This study involved only Chinese people, with a majority of Han Chinese and a small number of Hui, Miao, Uighur, and Tibetan. There were differences in gene polymorphism of different ethnic groups. This study did not take these into consideration. Moreover, genetic polymorphism detection was targeted, not whole-genome sequencing. The research population was from only two centers of data and the sample size was relatively small. These limitations may have influenced actual results and conclusions. It is necessary for more central and large case studies to confirm the present conclusions.
Conclusion
Based on the above analysis, the conclusion of this study is that the morbidity of LOH-BPH can be associated with SNPs of genes related to sex hormone metabolism. Furthermore, the AA genotype of rs1843090 of CYP11A1 and AA genotype of rs712221 of ESR1 can be a protective factor for LOH-BPH, the CC genotype of rs2279357 of CYP11A1, GG genotype of rs743572 of CYP17A1 and TT genotype of rs700518 of CYP19A1 can be a risk factor for LOH-BPH.
Ethical approval
This study was approved by the Ethics Committee of the Affiliated Hospital of Zunyi Medical University, and the Ethics Approval number was KLL-2022-391. This work has been reported in line with the STROCSS criteria. The work has been reported in line with the STROCSS criteria and in it is references [see References 22].
Consent
Yes, we have included this part in the submission and manuscript.
Source of funding
This study did not win any fund support, which is very regrettable for us. So the funding Statement was not applicable.
Author contribution
X.A., Z.O., C.C., B.C., Y.C., M.W., J.S., N.P., and X.H: participated in the test and data collection; Q.R. and Y.Z.: participated in the test, data collection, and manuscript writing; B.L. and Y.X.: participated in summarizing the test data, data analysis, and manuscript writing; Z.P.C.: formed the project development and writing – review and editing.
Conflicts of interest disclosure
The author declares no conflict of interest.
Research registration unique identifying number (UIN)
Name of the registry: Chinese Clinical Trial Registry.
Unique identifying number or registration ID: ChiCTR2200057632.
Hyperlink to your specific registration:http://www.chictr.org.cn/showproj.aspx?proj=155496
Guarantor
Zongping Chen.
Data availability statement
The datasets generated and/or analyzed during the current study are available from the corresponding author upon reasonable request.
Provenance and peer review
Not commissioned, externally peer-reviewed.
Availability of data and materials
The datasets generated and/or analyzed during the current study are available from the corresponding author upon reasonable request. Or through the registered website Chinese Clinical Trial Registry to get it.
Supplementary Material
Acknowledgements
In this study, Professor Yuanzhong Zhou from the School of Public Health Management of Zunyi Medical University gave us guidance in data statistics. Thanks Professor Zhou! We also wish to acknowledge the efforts of the participants and investigators of the study. Additionally, the authors would like to thank Jichun Deng from New Oriental Education & Technology Group Inc. for proofreading.
Footnotes
Bengen Li, Congcong Chen, Qixu Ren, Youzhuang Zhong, You Xiang, and Bo Chen are co-first author.
Sponsorships or competing interests that may be relevant to content are disclosed at the end of this article.
Supplemental Digital Content is available for this article. Direct URL citations are provided in the HTML and PDF versions of this article on the journal's website, www.lww.com/international-journal-of-surgery.
Published online 20 May 2024
Contributor Information
Bengen Li, Email: 1136593110@qq.com.
Congcong Chen, Email: 13676081388@139.com.
Zongping Chen, Email: 2404259310@qq.com.
Qixu Ren, Email: 1350812088@qq.com.
Ningrui Pan, Email: 601044962@qq.com.
Xu He, Email: 732890412@qq.com.
Min Wang, Email: 2966415585@qq.com.
Xiaoyu Ai, Email: 945344295@qq.com.
Youzhuang Zhong, Email: 1146803345@qq.com.
You Xiang, Email: 573492721@qq.com.
Bo Chen, Email: 18300924543@163.com.
Jiawei Sun, Email: 1530184399@qq.com.
Yu Cao, Email: 1183928101@qq.com.
Zhengdong Ouyang, Email: Ouyangzhendong0713@163.com.
References
- 1.Devlin CM, Simms MS, Maitland NJ. Benign prostatic hyperplasia - what do we know? BJU Int 2021;127:389–399. [DOI] [PubMed] [Google Scholar]
- 2.G C, Research R J I J O I . Pathology of benign prostatic hyperplasia[J], 2008.
- 3.Langan RC. Benign Prostatic Hyperplasia. Prim Care 2019;46:223–2232. [DOI] [PubMed] [Google Scholar]
- 4.Roberts RO, Jacobson DJ, Rhodes T, et al. Serum sex hormones and measures of benign prostatic hyperplasia. Prostate 2004;61:124–131. [DOI] [PubMed] [Google Scholar]
- 5.Bélanger A, Candas B, Dupont A, et al. Changes in serum concentrations of conjugated and unconjugated steroids in 40- to 80-year-old men. J Clin Endocrinol Metab 1994;79:1086–1090. [DOI] [PubMed] [Google Scholar]
- 6.Yang Y, Sheng J, Hu S, et al. Estrogen and G protein-coupled estrogen receptor accelerate the progression of benign prostatic hyperplasia by inducing prostatic fibrosis. Cell Death Dis 2022;13:533. [DOI] [PMC free article] [PubMed] [Google Scholar]
- 7.Nieschlag E. Late-onset hypogonadism: a concept comes of age. Andrology 2020;8:1506–1511. [DOI] [PubMed] [Google Scholar]
- 8.Araujo AB, O’donnell AB, Brambilla DJ, et al. Prevalence and incidence of androgen deficiency in middle-aged and older men: estimates from the Massachusetts Male Aging Study. J Clin Endocrinol Metab 2004;89:5920–5926. [DOI] [PubMed] [Google Scholar]
- 9.Wu FC, Tajar A, Beynon JM, et al. Identification of late-onset hypogonadism in middle-aged and elderly men. N Engl J Med 2010;363:123–135. [DOI] [PubMed] [Google Scholar]
- 10.Liu ZY, Zhou RY, Lu X, et al. Identification of late-onset hypogonadism in middle-aged and elderly men from a community of China. Asian J Androl 2016;18:747–753. [DOI] [PMC free article] [PubMed] [Google Scholar]
- 11.Li H, Gu Y, Shang X, et al. Decreased testosterone secretion index and free testosterone level with multiple symptoms for late-onset hypogonadism identification: a nationwide multicenter study with 5980 aging males in China. Aging (Albany NY) 2020;12:26012–26028. [DOI] [PMC free article] [PubMed] [Google Scholar]
- 12.Lunenfeld B, Mskhalaya G, Zitzmann M, et al. Recommendations on the diagnosis, treatment and monitoring of testosterone deficiency in men. Aging Male 2021;24:119–138. [DOI] [PubMed] [Google Scholar]
- 13.Wang C, Nieschlag E, Swerdloff R, et al. Investigation, treatment and monitoring of late-onset hypogonadism in males: ISA, ISSAM, EAU, EAA and ASA recommendations. Eur J Endocrinol 2008;159:507–514. [DOI] [PMC free article] [PubMed] [Google Scholar]
- 14.Marberger M, Roehrborn CG, Marks LS, et al. Relationship among serum testosterone, sexual function, and response to treatment in men receiving dutasteride for benign prostatic hyperplasia. J Clin Endocrinol Metab 2006;91:1323–1328. [DOI] [PubMed] [Google Scholar]
- 15.Shigehara K, Sugimoto K, Konaka H, et al. Androgen replacement therapy contributes to improving lower urinary tract symptoms in patients with hypogonadism and benign prostate hypertrophy: a randomised controlled study. Aging Male 2011;14:53–58. [DOI] [PubMed] [Google Scholar]
- 16.Mcvary KT. Erectile dysfunction and lower urinary tract symptoms secondary to BPH. Eur Urol 2005;47:838–845. [DOI] [PubMed] [Google Scholar]
- 17.Chen ZP, Yan Y, Chen CJ, et al. The single nucleotide polymorphism rs700518 is an independent risk factor for metabolic syndrome and benign prostatic hyperplasia (MetS-BPH). Andrology 2018;6:568–578. [DOI] [PMC free article] [PubMed] [Google Scholar]
- 18.Habuchi T, Liqing Z, Suzuki T, et al. Increased risk of prostate cancer and benign prostatic hyperplasia associated with a CYP17 gene polymorphism with a gene dosage effect. Cancer Res 2000;60:5710–5713. [PubMed] [Google Scholar]
- 19.Konwar R, Chattopadhyay N, Bid HK. Genetic polymorphism and pathogenesis of benign prostatic hyperplasia. BJU Int 2008;102:536–544. [DOI] [PubMed] [Google Scholar]
- 20.Schatzl G, Gsur A, Bernhofer G, et al. Association of vitamin D receptor and 17 hydroxylase gene polymorphisms with benign prostatic hyperplasia and benign prostatic enlargement. Urology 2001;57:567–572. [DOI] [PubMed] [Google Scholar]
- 21.Sharp L, Cardy AH, Cotton SC, et al. CYP17 gene polymorphisms: prevalence and associations with hormone levels and related factors. a HuGE review. Am J Epidemiol 2004;160:729–740. [DOI] [PubMed] [Google Scholar]
- 22.Mathew G, Agha R, Albrecht J, et al. STROCSS 2021: strengthening the reporting of cohort, cross-sectional and case-control studies in surgery. Int J Surg 2021;96:106165. [DOI] [PubMed] [Google Scholar]
- 23.Tang K, Oeth P, Kammerer S, et al. Mining disease susceptibility genes through SNP analyses and expression profiling using MALDI-TOF mass spectrometry. J Proteome Res 2004;3:218–227. [DOI] [PubMed] [Google Scholar]
- 24.Beaulieu M. The iPLEX[TM] assay: a genotyping application for high-level multiplexing on the MassARRAY[R] system, 2005.
- 25.Bautista OM, Kusek JW, Nyberg LM, et al. Study design of the Medical Therapy of Prostatic Symptoms (MTOPS) trial. Control Clin Trials 2003;24:224–243. [DOI] [PubMed] [Google Scholar]
- 26.Wang C, Nieschlag E, Swerdloff RS, et al. ISA, ISSAM, EAU, EAA and ASA recommendations: investigation, treatment and monitoring of late-onset hypogonadism in males. Aging Male 2009;12:5–12. [DOI] [PubMed] [Google Scholar]
- 27.Isidori AM, Aversa A, Calogero A, et al. Adult- and late-onset male hypogonadism: the clinical practice guidelines of the Italian Society of Andrology and Sexual Medicine (SIAMS) and the Italian Society of Endocrinology (SIE). J Endocrinol Invest 2022;45:2385–2403. [DOI] [PMC free article] [PubMed] [Google Scholar]
- 28.Heinemann LJaM. A new Aging Males’ Symptoms (AMS) rating scale. Aging Male 1999;2:105–114. [Google Scholar]
- 29.Banerjee PP, Banerjee S, Brown TR, et al. Androgen action in prostate function and disease. Am J Clin Exp Urol 2018;6:62–77. [PMC free article] [PubMed] [Google Scholar]
- 30.Cornu JN, Audet-Walsh E, Drouin S, et al. Correlation between prostate volume and single nucleotide polymorphisms implicated in the steroid pathway. World J Urol 2017;35:293–298. [DOI] [PubMed] [Google Scholar]
Associated Data
This section collects any data citations, data availability statements, or supplementary materials included in this article.
Supplementary Materials
Data Availability Statement
The datasets generated and/or analyzed during the current study are available from the corresponding author upon reasonable request.
The datasets generated and/or analyzed during the current study are available from the corresponding author upon reasonable request. Or through the registered website Chinese Clinical Trial Registry to get it.