Abstract
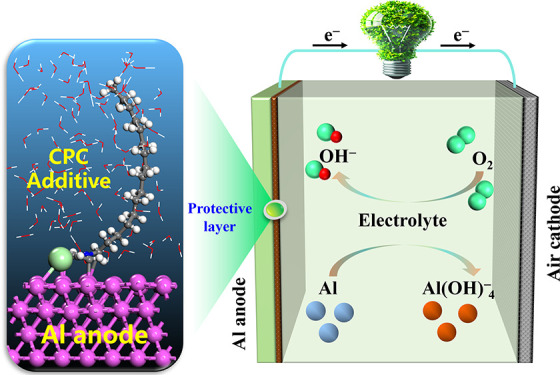
Aluminum-air batteries (AABs) are considered among high-power battery systems with various potential applications. However, the strong self-corrosion of Al in alkaline electrolytes negatively affects its Coulombic efficiency and significantly limits their large-scale application. This work presents the use of cetylpyridinium chloride (CPC) as an inexpensive and environmentally benign electrolyte additive in alkaline AABs. Hydrogen evolution test, electrochemical measurement, and surface analysis techniques were used to investigate the inhibition effects of CPC additive for the Al anode. The potentiodynamic polarization data indicated that the effectiveness of the CPC in inhibiting corrosion increased proportionally with higher CPC concentration. The maximum inhibition efficiency of 53.6% was achieved at a CPC dosage of 5 mM. The hydrogen evolution experiment revealed that the rate of hydrogen evolution decreased from 0.789 mL cm–2 min–1 for the pristine NaOH solution to 0.415 mL cm–2 min–1. The combination of X-ray photoelectron spectroscopy (XPS) and ab initio molecular dynamics (AIMD) provides conclusive evidence that CPC may adhere to the surface of Al and create a protective film. These findings indicate that CPC is successful in preventing the self-corrosion of the Al anode. Additionally, the Al anode has improved electrochemical characteristics, including a high specific capacity of 2041 mAh g–1 and a high energy density of 2874 Wh kg–1. This work focuses on the inhibition of self-corrosion of Al and provides novel insights for the design and development of effective additives for AABs.
1. Introduction
Owing to the increasing energy requirements of contemporary society, fossil fuel is insufficient to sustain the progress of human civilization in the future. Therefore, it is crucial to optimize the effective exploitation of renewable energy. A cost-effective, dependable, and environmentally friendly grid-scale energy storage technology is crucial for optimizing the energy infrastructure in this scenario. Despite their present popularity, the use of high-performance lithium-ion batteries is restricted due to their inflammability and limited availability.1 Metal-air batteries have garnered significant interest from both corporations and academics due to their potential as a viable energy source for the next generations of electric vehicles.2,3 The electrochemical pairings Li–air, Zn–air, Mg–air, Al–air, etc., are extensively studied because they utilize oxygen from the atmosphere as a primary reactant in batteries. This characteristic reduces the weight and expense of the battery, while also allowing for greater capacity for energy storage. Zn-air batteries (ZABs) have undergone extensive research and are now used in hearing aids and other popular devices.4
Al is the most plentiful metallic element found on earth. It is a well-known construction and manufacturing material due to its lightness and toughness and is extensively used in industries such as automotion and construction. Moreover, Al has desirable characteristics such as low equivalent weight, a high theoretical electrochemical capacity of 2980 mAh g–1, which is much more than that of Zn (820 mAh g–1), and relatively negative potential in alkaline environments.5,6 These characteristics, together with its availability and affordability, make it a desirable option as an anode material for AABs. AABs have a theoretical voltage of 2.76 V, which is larger than the 1.66 V of ZABs. The predicted theoretical energy density of AABs is 8076 Wh kg–1 due to the trivalent nature of Al3+ and the transfer of three electrons in the anodic process.7 Nonetheless, severe hydrogen evolution reaction of Al anode in alkaline electrolyte extremely limits its large-scale applicability. This process is exemplified by the subsequent reaction:8
| 1 |
This undesired self-corrosion leads to an excessively high level of energy loss during standby and poses a safety issue in battery use.
To mitigate the self-corrosion of Al anodes, two different strategies have been proposed to overcome these problems. The first strategy is to incorporate Al with various elements, such as manganese (Mn), magnesium (Mg), indium (In), gallium (Ga), bismuth (Bi), thallium (Tl), tin (Sn), mercury (Hg), zinc (Zn), and lead (Pb).9,10 The principal factor contributing to the reduction in hydrogen evolution and cathodic reaction on the surface of the Al alloy could be the high hydrogen overpotential. However, it is super expensive and time-consuming to polish high-purity manufacturing Al alloys using numerous elements. The second strategy is to include a tiny quantity of organic or inorganic additives in the electrolyte. These compounds frequently impede the self-corrosion of Al through physical and/or chemical adsorption.11 A limited number of scholars have conducted investigations into the impact of various inhibitory agents on the corrosion of Al in alkaline environments, including polymers,12 some organic matter containing heteroatoms (O, S, N, and P),13 amino acids,14 carboxylic acids,15 and ionic liquids.16 The development of environmentally benign, high-efficiency electrolyte additives for AABs remains challenging.
Recently, surfactants have received considerable attention, owing to their high efficiency, low cost, low toxicity, and easy production.17 Studies have shown that the unique amphiphilic groups of surfactants can adsorb onto metal surfaces and form a hydrophobic barrier, while also helping to optimize the electrode/electrolyte interface.18 Liu et al. studied three different types of cationic quaternary ammonium salt surfactants: hexadecyltrimethylammonium bromide, dodecyl dimethyl benzylammonium bromide, and docosyl dimethylammonium bromide.19 The results indicated that all the cationic surfactants dominantly suppress the cathode process of aluminum corrosion in an alkaline solution. Xie and collaborators proposed an effective dynamic molecular adsorption interface strategy. The purpose of introducing cetyltrimethylammonium chloride (CTAC) to the electrolyte is to mitigate corrosion and prevent the formation of aluminum dendrites, which will significantly improve overall battery performance.20 To better discuss the impact of corrosion inhibitors on battery performance, constructing the air battery model is essential. The battery consists of an anode made from an aluminum alloy, an electrolyte, and a cathode that employs air. The air cathode is composed of a nickel net, activated carbon, an oxygen reduction reaction (ORR) catalyst, and an adhesive. Different ORR catalysts have varying effects on batteries.21,22 In order to fulfill the requirements of extended operation, the air cathode carries the mixed ORR catalyst, which include precious metal catalysts, manganese oxide catalysts, and nickel–cobalt catalysts.
This study deeply investigates a new corrosion inhibitor, cationic quaternary ammonium salt (CPC), specifically for the aluminum anode utilized in alkaline electrolyte aluminum-air batteries. CPC is present in various products, including certain toothpastes, lozenges, mouthwashes, breath sprays, nasal sprays, and throat sprays. It is a germicide that eliminates bacteria and other germs.23 CPC molecules contain heteroatoms N and Cl, as well as long alkyl chains, providing the potential to adsorb onto metal surfaces and form a hydrophobic barrier. An in-depth analysis was conducted to evaluate the inhibitory effect of CPC on the electrochemical performance of the Al-air battery. The present study employs deep experimental findings with theoretical analysis to fill a knowledge gap and provides new insights for improving the electrochemical efficiency of alkaline AABs.
2. Experimental Section
2.1. Chemicals and Materials
Specimens of homemade Al alloy (Si 0.07%, Mg 2.15%, Mn 0.06%, Cr 0.18%, Zn 0.01%, Fe 0.19%, and the remainder is Al) were utilized in the experiments. Sodium hydroxide and hexadecylpyridinium chloride were obtained from the National Pharmaceutical Chemical Reagents Co., Ltd., Shanghai, P.R. China. All chemicals utilized in this work are analytical reagents without purification. The blank electrolyte solutions used were 4 M NaOH, prepared by dissolving sodium hydroxide (NaOH) in deionized water. The concentration range of CPC was 0.5–5 mM.
2.2. Hydrogen Evolution Tests
To assess the self-corrosion rate of Al, the volume of hydrogen gas evolved from the sample in 4 M NaOH solution was determined using the drainage and hydrogen collecting technique, both with and without varying amounts of CPC additive. As illustrated in Figure 1, the drainage device comprises a sealed conical cylinder, an acid buret, and a gas-guide tube. A 1 cm2 working space in the Al plate remains after the metal plate is sealed with epoxy resin. Measuring the volume of hydrogen gas (H2) was done every 5 min after the first droplet emerged. All the hydrogen evolution tests were repeated three times. The following formula was used to get the hydrogen evolution rate (RH2, in mL cm–2 min–1) based on the average values above:24
| 2 |
where A is the specimen region (in cm2), T is the duration (in min), and VH2 represents the volume of H2 (in mL). In addition, the inhibition effectiveness (ηH2) was determined according to the following equation:25
| 3 |
where RH2,blank and RH2,inh are the hydrogen evolution rates of the specimens in the NaOH solution without and with CPC additive, respectively.
Figure 1.
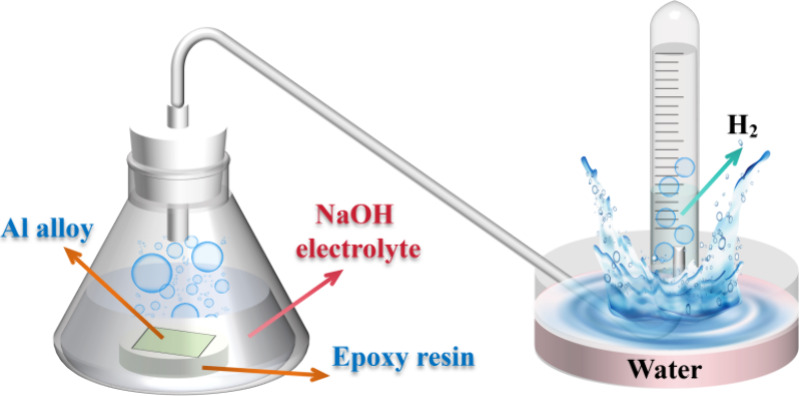
Schematic illustration of the hydrogen evolution test device.
2.3. Electrochemical Measurements
Electrochemical experiments are performed in traditional three-electrode setups using a CHI660E electrochemical workstation. The Hg/HgO electrode is used as a reference electrode, and the platinum electrode serves as a counter electrode. Figure S1 displays the photo of the setup. Similarly, the Al specimens were sealed with epoxy resin such that the area exposed to the electrolyte was 1.0 cm2. 4 M NaOH solution is utilized as the electrolyte in all experiments, and the CPC additive might be added or taken out of it. Before testing, all aluminum alloy samples were polished using SiC sandpaper with grits ranging from 200 to 1200, rinsed in an ultrasonic bath with pure alcohol, and then dried in cold air. Before the test, the open circuit potential (OCP) tests were performed for 0.5 h in order to stabilize the potential, until the potential did not exceed 1 mV within 100 s. Then the electrochemical impedance spectroscopy (EIS) measurements were conducted. The frequency ranged from 105 to 1 Hz with sinusoidal amplitudes of 5 mV. The impedance data was fitted using the ZSimpWin program. After the EIS tests, the potentiodynamic polarization (PDP) measurements were carried out with a scanning potential of +0.25 V to −0.25 V (versus OCP) and a scanning rate of 0.5 mV s–1. To ensure the authenticity and reliability of the experimental findings, all the corrosion electrochemical experiments were repeated three times.
Furthermore, galvanostatic discharge experiments were conducted to evaluate the impact of CPC addition on the Al anode. The testing parameters were set with a current density of 20 mA cm–2, sustained for a period of 1 h. To determine the weight loss, the Al alloy’s weight was recorded both before and after discharge. Several associated parameters were computed using the following formulas:26
| 4 |
| 5 |
| 6 |
where Ua means the anode utilization efficiency (%), I stands for the current (A), t represents the discharge time (h), Δm signifies the weight loss of Al (g), and F is the Faraday constant. Q is the specific capacity (mAh g–1), W is the actual energy density (Wh kg–1), and E is the average discharge voltage (V). The polarization curves and power density curve were obtained via linear sweep voltammetry (LSV) with a scan rate of 2 mV s–1.
2.4. Surface Analysis Technique
The polished Al alloy specimens with dimensions 1.0 cm × 1.0 cm × 0.5 cm were immersed in 4 M NaOH with and without the optimal concentration of CPC. One hour later, the specimen was removed from the test solutions, rinsed with ethyl alcohol, and dried through the air. The surface morphology of the samples was characterized using a scanning electron microscopy (SEM, JXA-8530F Plus) and atomic force microscopy (AFM, MFP-3D-BIO). XPS (Thermo Fisher Scientific) analysis was performed to ascertain the nature of the chemical bonds present on the surface of the specimen. The water contact angle of the surface of fresh Al and inhibitor-modified Al was analyzed using the water contact angle measuring device (CAM, JC2000D). The characterizations were performed under normal atmospheric conditions.
2.5. Quantum Chemical Calculations
The interfacial interactions between the CPC inhibitor and Al surface were investigated using density functional theory (DFT) simulations. All the calculations and visualization of results were accomplished with the DMol3 module incorporated into the BIOVIA Materials Studio program.27 We employed the generalized gradient approximation (GGA) with the Perdew–Burke–Ernzerhof (PBE) functional form to calculate the exchange–correlation energy. We employed the DFT semicore pseudopotentials (DSPP) approach and extended valence electron functions into a set of numerical atomic orbitals using a double numerical basis with polarization (DNP) functions.28 The Al(111), Al(220), and Al(200) surfaces were created using a periodic four-layer structure featuring a 6 × 6 supercell. A vacuum layer measuring 30 Å is implemented in the z-direction to prevent any possible spurious interactions that could occur between the slabs. The top two layers of Al atoms were allowed to relax along with the adsorbates, while the other layers were fixed in their bulk locations. The convergence criteria for geometric optimization were defined as 0.002 Ha/Å for maximum force, 1.0 × 10⁻⁵ Ha for energy, and 0.005 Å for maximum displacement. We used a DIIS (direct inversion in an iterative subspace) with a maximum size of 10 and a thermal smearing value of 0.005 Ha to accelerate convergence and enhance computing performance.29
Furthermore, at a temperature of 298 K, we employed the Nosé–Hoover thermostat technique to perform ab initio molecular dynamics (AIMD) simulations within the NVT ensemble, aiming to accurately investigate the stability of CPC on the Al(111) surface. To replicate an aqueous environment, a designated quantity of H2O molecules was integrated into the system. The time step for this simulation was set to 1 fs, and the entire simulation process lasted for 0.5 ps.
3. Results and Discussion
3.1. Hydrogen Evolution Tests
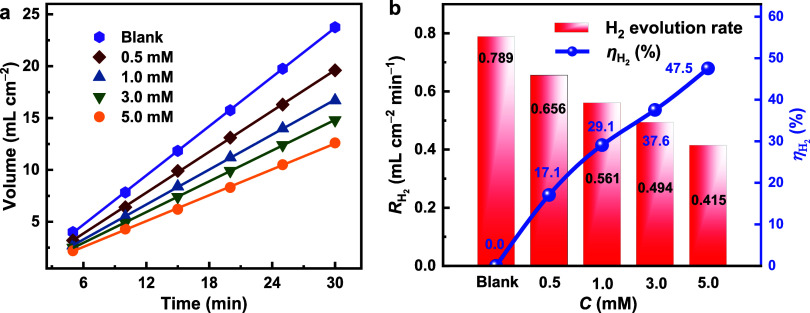
The corrosion of Al in 4 M NaOH solution with and without CPC additive was studied using the gas collection technology. The H2 gas evolution begins promptly upon immersing the Al sample in the test solution, as seen in Figure 2a. The emitted hydrogen volume increases in linearity with time but decreases when CPC is present. It is evident that in the absence of CPC, the rate of corrosion is significantly elevated and that the rate of H2 evolution lowers as the inhibitor concentration increases, indicating an increase in inhibition efficiency. The rate of hydrogen evolution in 4 M NaOH solution was 0.789 mL cm–2 min–1. When the CPC additive concentration reached 5.0 mM, the rate decreased to 0.415 mL cm–2 min–1, resulting in an inhibition efficacy of 47.5% (Figure 2b). The corrosion of aluminum is inhibited by CPC, likely due to the adsorption of CPC molecules onto the aluminum surface. This adsorption effectively blocks the substrate, thereby hindering the progression of the corrosion process.
Figure 2.
(a) Hydrogen evolution volume and (b) hydrogen evolution rate of Al alloy in the 4 M NaOH solutions containing varying concentrations of CPC.
3.2. Open Circuit Potential and Polarization Analysis
The self-corrosion of aluminum electrodes in basic electrolytes is widely acknowledged to consist of two distinct processes: the gradual dissolving of aluminum in the anodic area and the parasitic generation of hydrogen in the cathodic region.
Multistep Al dissolution process:30
| 7 |
| 8 |
| 9 |
| 10 |
The diffusion and transfer of the adsorbed substance Al(OH)–4,ads at the surface of the Al electrode is a critical step that determines the rate of the entire anodic process:31
Parasitic hydrogen evolution process:32
| 11 |
| 12 |
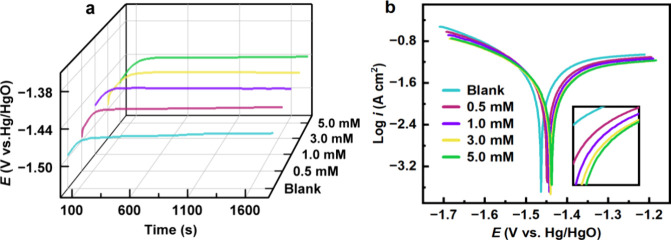
Figure 3a displays the OCP curves of Al alloy in the 4 M NaOH solution without and with different concentrations of CPC additive. The OCP curves initially shifted upward because of the passivation reaction of the Al anode, resulting in the formation of Al(OH)1–3,ads surface layers according to eqs 7 to 9. However, as the immersion duration increases, the potentials gradually stabilize as theAl(OH)–4,adsspecies dissolve, as described in eq 10. The OCP values somewhat increased when different concentrations of CPC were added relative to the blank solution.
Figure 3.
(a) Open circuit potential vs time and (b) potentiodynamic polarization curves for Al anode in 4 M NaOH electrolyte with and without CPC additive.
The Tafel curves of the Al electrode in 4 M NaOH corrosive media with different concentrations of CPC are given in Figure 3b. Several polarization parameters, including corrosion potential (Ecorr), corrosion current density (icorr), and slopes of anodic and cathodic branches (βa and βc), are listed in Table 1. In the pristine solution, the electrode potential of the Al anode is −1.461 V (vs Hg/HgO); the introduction of CPC results in a positive shift of the corrosion potential. Following the addition of 5 mM CPC, the value shifts to −1.437 V. Hence, the CPC inhibitor functions as a mixed-type inhibitor as the Ecorr value exhibits a variation of less than 85 mV.33 The cathodic and anodic curves clearly demonstrate a tendency to shift toward reduced current density; nevertheless, the overall forms of these curves remain consistent. This indicates that CPC inhibits cathodic hydrogen evolution and anodic dissolution reactions without altering the corrosion mechanism. The inhibition is likely due to the obstructive impact of the adsorbed suppression CPC species on the face of aluminum. The corrosion inhibition efficiency (ηPDP) can be calculated using the following formula:34
| 13 |
where icorr,0 and icorr are corrosion current densities of Al alloy in 4 M NaOH solution without and with CPC additive, respectively. It is clear that icorr values decrease and ηPDP increases by increasing the CPC concentration in NaOH solution. The corrosion current density drops from 59.72 to 27.71 A cm–2, and the inhibition efficiency rises to 53.6%. The superior performance of CPC may be attributed to the existence of polar groups in its architecture, which benefits the formation of the durable conservation layer on the Al surface.
Table 1. Polarization Parameters of Al Alloy in 4 M NaOH Electrolyte without and with Different Concentrations of CPC Additive.
| C (mM) | Ecorr | βa | –βc | icorr (mA cm–2) | ηPDP (%) |
|---|---|---|---|---|---|
| blank | –1.461 | 277.3 | 334.3 | 59.72 | |
| 0.5 mM | –1.448 | 339.9 | 552.6 | 34.47 | 42.2 |
| 1.0 mM | –1.443 | 351.3 | 547.1 | 31.21 | 47.7 |
| 3.0 mM | –1.440 | 328.0 | 514.4 | 29.83 | 50.0 |
| 5.0 mM | –1.437 | 357.1 | 560.5 | 27.71 | 53.6 |
3.3. EIS Measurements
As depicted in Figure 4a and 4b, the EIS results for the Al electrode submerged in a corrosive medium (4 M NaOH solution) were plotted using Nyquist and Bode graphs, respectively, in the absence and presence of different concentrations of CPC. The equivalent circuit diagram is illustrated in Figure 4c, where CPE1 and CPE2 represent the constant phase components, Rs represents the solution resistance, Rct,1 and Rct,2 represent the charge shift resistors, R is the inductive resistance, and L represents the inductive component.35 The model incorporated constant phase elements (CPE) because of the depressed semicircles generated by the inhomogeneity distribution (microscopically irregularity) on the Al electrode.36
Figure 4.

(a) Nyquist and (b) Bode plots of Al alloy in the NaOH solutions containing various concentrations of CPC. (c) Equivalent circuit used for fitting the EIS data.
The Nyquist plots have a consistent structure, with three distinct components: a capacitive arc in the high-frequency range, an inductive arc in the middle-frequency range, and another capacitive arc in the low-frequency range. The charge transfer rate is determined by the high-frequency large capacitance circuit about the redox Al → Al+ reaction.37 This process can be represented by CPE1 and Rct,1, with CPE1 denoting the double layer that exists between the electrode and electrolyte. A higher Rct,1 value indicates that the Al electrode has superior corrosion resistance. It is evident that the addition of CPC additive greatly increases the initial impedance arc. The presence of inductive arcs in the intermediate frequency range may be attributed to the ongoing generation and spending of middle outcome, such as Al(OH)ads,1–3 andAl(OH)–4,ads.38 Capacitive arcing at less frequencies might occur as a result of the quick complementarity oxidation reaction Al+ → Al3+.39 The reaction products’ formation of a surface film on the alloy’s surface can account for this phenomenon. Another constant phase element (CPE2) is connected in parallel to the charge transfer resistance element (Rct,2) in this circuit. Furthermore, the polarization resistance (Rp), which serves as a metric to quantify the corrosion resistance of the system, was calculated utilizing the equivalent circuit’s Rct,1, R, and Rct,2 variables by the following equation:40
| 14 |
The fitting parameters for impedance plots are provided in Table 2. The low values of χ2 (chi-square) suggest a strong agreement between the fitted data and the experimental data. The inclusion of CPC leads to an increase in the Rct,1, Rct,2, and Rp values of the equivalent circuit due to a restoration in the corrosion ratio of the aluminum electrode. The Rp values exhibited a greater magnitude in the presence of CPC compared to the blank solution. Furthermore, the Rp values demonstrated an upward trend with increasing concentration of the CPC additive. The findings may be validated by comparing them with the outcomes of hydrogen evolution test and polarization curve surveying.
Table 2. Impedance Fitting Parameters for Al Alloy in 4 M NaOH Solution without and with Different Concentrations of CPC.
| CPE1 |
CPE2 |
||||||||||
|---|---|---|---|---|---|---|---|---|---|---|---|
| C (mM) | Rs (Ω cm2) | Y0 (10–4 S sn cm–2) | n1 | Rct,1 (Ω cm2) | L (10–4 H cm2) | RL (Ω cm2) | Y0 (10–2 S sn cm–2) | n2 | Rct,2 (Ω cm2) | Rp (Ω cm2) | χ2 (10–3) |
| blank | 0.715 | 1.052 | 1.000 | 0.347 | 2.012 | 0.847 | 4.990 | 1.000 | 0.193 | 0.439 | 0.743 |
| 0.5 | 0.736 | 1.060 | 1.000 | 0.435 | 3.003 | 1.150 | 5.903 | 1.000 | 0.201 | 0.517 | 1.634 |
| 1.0 | 0.834 | 1.021 | 1.000 | 0.458 | 6.286 | 1.306 | 5.464 | 1.000 | 0.221 | 0.560 | 1.043 |
| 3.0 | 0.897 | 0.892 | 1.000 | 0.515 | 6.508 | 1.357 | 6.591 | 0.956 | 0.223 | 0.596 | 2.679 |
| 5.0 | 0.932 | 0.852 | 1.000 | 0.541 | 4.099 | 1.364 | 8.321 | 0.931 | 0.225 | 0.612 | 2.213 |
3.4. Surface Analysis
The morphology and surface changes of the aluminum were deeply examined after immersion in a 4 M NaOH solution for about 1 h, under two conditions: without the addition of any substances and with the addition of 5 mM CPC. The SEM findings indicate that the whole surface of the bare Al exhibits scratches from polishing, as shown in Figure 5a. The Al surface in the pristine solution is depicted in Figure 5b; distinct fissures and cavities are visible as a result of the severe damage caused by the OH– attack. The micrographs in Figure 5c show the presence of CPC. Because of the additive molecules’ adsorption, the Al surface sustains less damage, and both the quantity and size of these holes diminish. Consequently, the elemental distribution mapping images indicate that the Al surface element distribution with CPC additive is more uniform than that of the blank condition.
Figure 5.
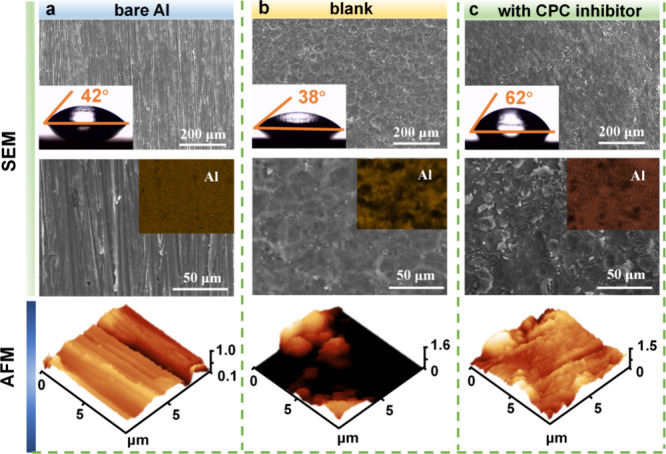
SEM and AFM images of the surface of Al alloy under various conditions: (a) bare Al, (b) blank solution, and (c) 4 M NaOH + 5 mM CPC additive.
The water contact angle tests were used to evaluate the wettability of the Al specimen under various situations. The bare Al surface has a contact angle of 42°. The low contact angle of 38° was caused by the water molecules forming hydrogen bonds with the oxidized products as a result of the significant coverage of corrupting products on the aluminum face. Nevertheless, the contact angle experiences an increase to 62° as a result of the presence of aliphatic carbon chains in the CPC molecules after the adsorption of the additives on the Al surface. AFM is a powerful technique for gathering surface roughness data (Ra), which is determined by calculating the average roughness of the tiny peaks and valleys on a surface.41 The polished Al substrate features small scratches and a surface roughness of 89.4 nm. Once Al is submerged in the blank solution, the average roughness value reaches 225.2 nm. After applying the CPC inhibitor, the surface seems more flat, homogeneous, and uniform, with a surface roughness of 141.9 nm. The findings indicate that the CPC additive exhibits significant resistance to corrosion.
3.5. XPS Analysis
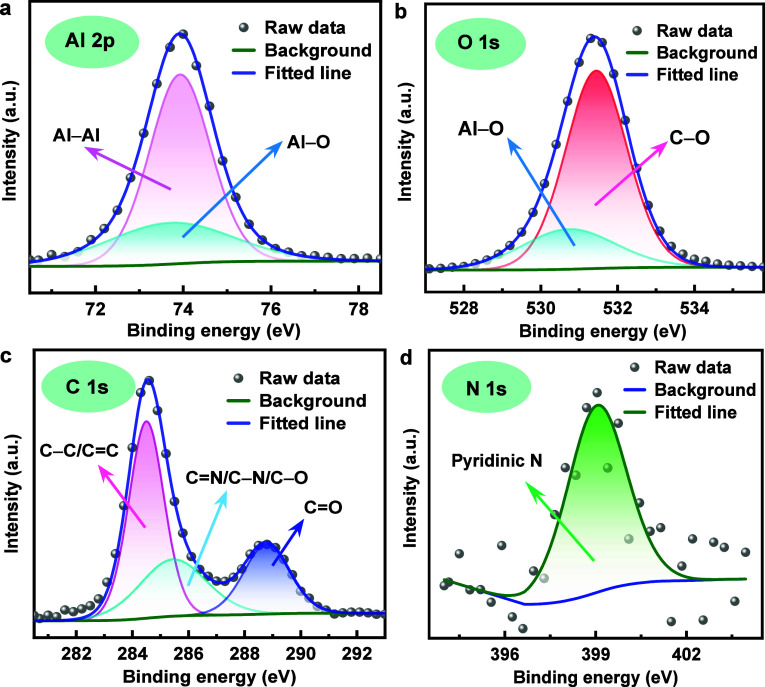
XPS measurements were used to evaluate the surface composition of an Al electrode submerged in a 4 M NaOH solution with a 5 mM CPC additive. Two distinct peaks, designated to Al–Al and Al–O, respectively, are shown in Figure 6a at 73.8 and 74.9 eV.42 The peaks seen at 530.7 and 531.4 eV in Figure 6b can be attributed to the presence of Al–O and C–O bonds, respectively.38 The Al–O bonds provide a favorable verification for the formation of Al hydroxide on the Al surface. The spectrum of C 1s demonstrates three deconvoluted peaks at 284.5, 285.0, and 288.8 eV for C–C/C=C, C=N/C–N/C–O, and C=O, respectively (Figure 6c).31 The peak at 399.4 eV relates to the pyridinic nitrogen of CPC in Figure 6d. This peak indicates the formation of a protected layer derived from the CPC structure on the Al substrate, which reduces the corrosion rate.
Figure 6.
High-resolution XPS spectra of (a) Al 2p, (b) O 1s, (c) C 1s, and (d) N 1s for Al alloy after 1 h immersion in 4 M NaOH with 5 mM CPC.
3.6. Discharge Performance
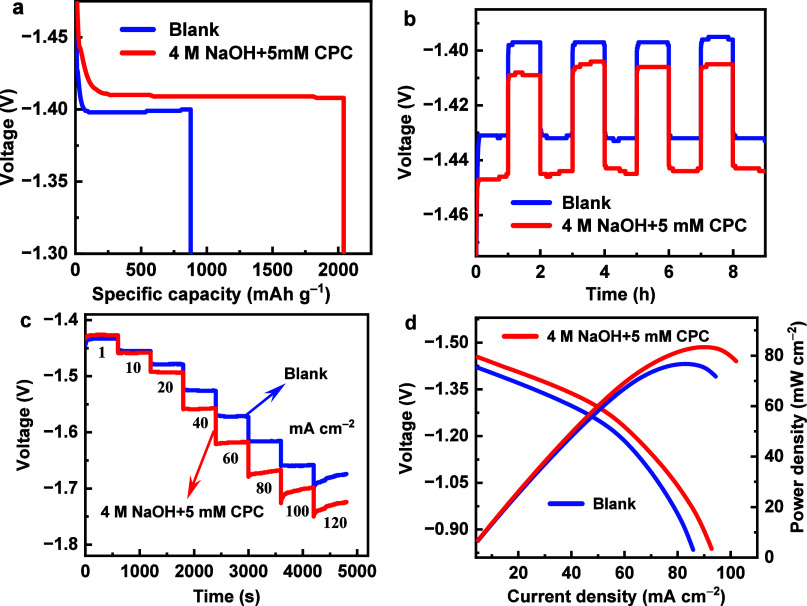
The capacity curves of the Al electrode during constant current discharge at a current density of 20 mA cm–2, for a duration of 1 h, both with and without CPC in the 4 M NaOH solution, are illustrated in Figure 7a. Table 3 contains a list of the corresponding battery performance parameters. After adding 5 mM CPC inhibitor, the Al anode’s discharge voltage rises slightly from 1.400 V of pristine electrolyte to 1.408 V. Additionally, the discharge-specific capacity increases from 877 to 2041 mAh g–1, and the anode utilization efficiency improves from 29.4 to 68.5%. The gravimetric energy density can reach up to 2874 Wh kg–1 in the presence of the CPC additive. Furthermore, to assess the durability of the Al alloy used as anodes for AABs during long intermittent use, intermittent discharge experiment was performed at a current density of 20 mA cm–2 with a duration of 1 h and an interval of 1 h for four cycles. As illustrated in Figure 7b, the discharge voltage remained higher than that of the blank electrolyte after the introduction of the CPC throughout the entire procedure. The stability of discharge performance of the Al electrode was estimated using multicurrent step experiments, which included continually fluctuating current densities (scope from 1 to 120 mA cm–2).43 The voltages were measured under each current density for 600 s (Figure 7c). At a current density of 1 mA cm–2, CPC results in a lower starting voltage than the blank electrolyte. After prolonged discharge at various current densities, the discharge voltage in the electrolyte containing CPC is much greater than in the blank electrolyte, indicating that the CPC-modified Al anode has superior electrochemical stability. Figure 7d depicts the fluctuations of polarization curves and their accompanying power density curves. Both experiments exhibit comparable activation polarization in the low-current density region. Nevertheless, when CPC was added to the electrolyte, the peak power density increased from 76.7 to 83.4 mW cm–2. In brief, the increase in associated battery parameters serves as a sufficient demonstration of the beneficial effects of CPC as an electrolyte additive on improving the discharge performance of the Al anode. Table S1 provides a comparison of the battery efficacy of AABs with other reported electrolytes.
Figure 7.
(a) Specific capacity curves of Al electrode after 1 h discharge at 20 mA cm–2, (b) intermittent discharge curves, (c) multistep chronopotentiometric curves, and (d) polarization curves and the corresponding power density plots.
Table 3. Battery Performance Characteristics of the Al Alloy Anode in 4 M NaOH Solution without and with 5 mM CPC.
| additive | voltage (V) | weight loss (g) | anode utilization (%) | specific capacity (mAh g–1) | energy density (Wh kg–1) |
|---|---|---|---|---|---|
| blank | –1.400 | 0.0228 | 29.4 | 877 | 1228 |
| 5 mM CPC | –1.408 | 0.0098 | 68.5 | 2041 | 2874 |
3.7. Theoretical Calculations
To gain a comprehensive understanding of the inhibition mechanism of CPC for the Al anode, DFT computes were employed to analyze the adsorption information. CPC molecules adsorb onto the Al surface via the bonding of the pyridine ring to Al atoms, as illustrated in Figure 8a–c. The hydrophobic alkyl chain of CPC is oriented away from the Al surface and extends into the aqueous solution with a certain angle. The adsorption energy (Eads) of the additive molecule on the Al surface can be quantitatively determined by the following formula:44
| 15 |
where Einh/slab symbolizes the general energy of the whole system where the molecule is adsorbed on the Al substrate, Einh denotes the energy of the isolated additive molecule, and Eslab indicates the energy of the Al slab. The calculated Eads values for the CPC inhibitor on Al(111), Al(200), and Al(220) surfaces are −2.81, −2.68, and −1.98 eV, respectively. The negative values indicate that the adsorption process is spontaneous, and it suggests that the Al(111) plane is more stable. The bond length of C–Al in CPC@Al(111) adsorption systems is 2.14 Å, which is approximately equal to the sum of the covalent radii of the C and Al atoms (0.75 and 1.26 Å, respectively).45
Figure 8.
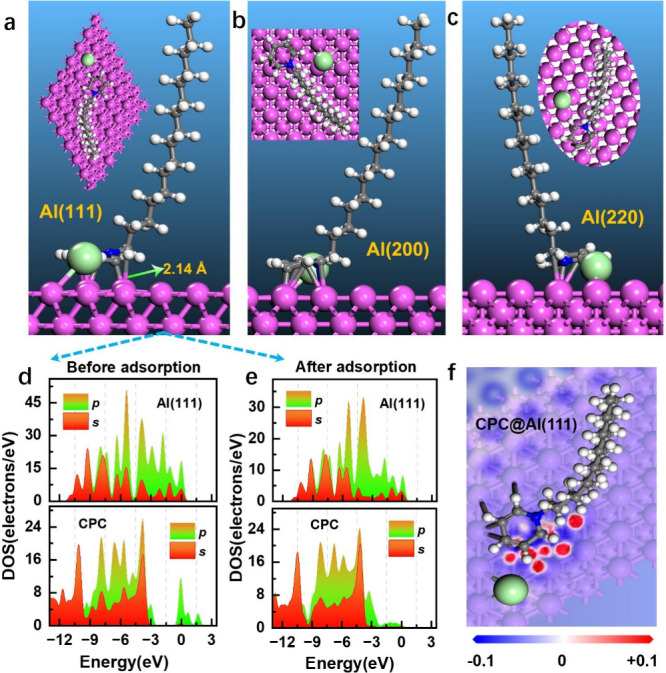
Most stable adsorption conformations of CPC molecule on (a) Al(111), (b) Al(200), (c) Al(220) surface, (d, e) density of states, and (f) electron density difference plots for the CPC@Al(111) adsorption system.
To get a better understanding of the reactivity and bonding processes in the CPC-Al(111) adsorption system, projected density of states (DOS) analysis was performed. The bonding mechanism can be well understood from the comparison between the projected density of states before and after the adsorption of additive molecules.46 As depicted in Figure 8d,e, the s and p orbitals of the C, N, and Cl atoms and the sp orbital of Al atoms present some overlapping distributions at a wide range of energy levels, which suggests the occurrence of substantial hybridization and the formation of coordination bonds. Moreover, electron density difference (Δρ) plots were generated according to the following definition:47,48
| 16 |
where ρsurf(r), ρinh(r), and ρinh/sur(r) denote the electron densities of the bare Al(111) surface, the isolated additive molecule, and the overall adsorption system, respectively. Figure 8f illustrates the presence of electron accumulation and deficiency, represented by the red and blue areas, respectively. There is clear evidence of charge redistribution taking place between the atoms of CPC and Al atoms. It is speculated that there may be a donation of lone pair electrons from the N atom on the pyridine ring to the metal, as well as a feedback effect of the electrons of Al with the π orbitals of the pyridine molecule. These two sites are considered to be the best sites for adsorption with Al.
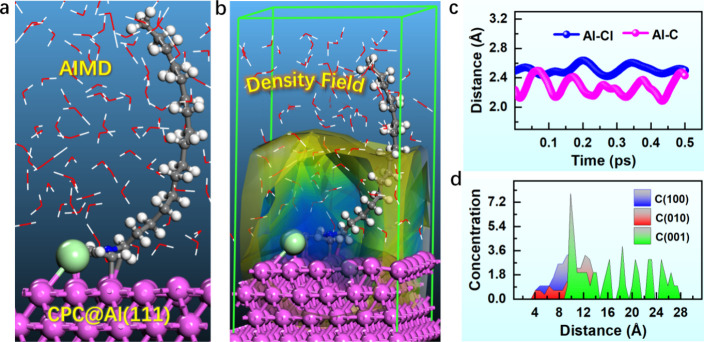
AIMD simulations can successfully study the stable configuration of inhibitor molecules adsorbed on metal surfaces. The findings demonstrate that the Al–C/Al–Cl bond between CPC and the Al surface remains stable after 0.5 ps (Figure 9a,c), indicating the enduring nature of CPC adsorption. Figure 9b displays the adsorption density field of CPC on the Al substrate, suggesting that the chosen additive efficiently adhered to the metal surface to form a dense and hydrophobic barrier. Figure 9d displays the spatial distribution of the CPC concentration in three dimensions as observed during the simulation. The C(001) direction (specifically, the z-axis) has the largest relative concentration value, which supports the adsorption of the polar functional group.
Figure 9.
(a) Equilibrium configuration, (b) density field distribution, (c) evolution of Al–Cl and Al–C bond distances with simulation time, and (d) relative inhibitor concentration for the CPC/Al(111) aqueous adsorption system.
4. Conclusions
In summary, we provide a reliable low-cost additive to inhibit the corrosion of the Al alloy anode. The introduction of CPC led to a decrease in the rate of hydrogen evolution. The energy density of the battery containing a CPC corrosion inhibitor in the AAB system is 2874 Wh kg–1, which is more than double that of the battery lacking the electrolyte adjuvant (1228 Wh kg–1). The enhancement of the electrochemical performance can be ascribed to the regulation of CPC on the boundary between the electrolyte and anode. The observed phenomenon is a result of the adsorption of CPC on the surface of the Al anode. This leads to the constitution of an evenness and compact barrier layer, which effectively suppresses the corrosion reaction and activates the Al alloy anode. This research is essential for comprehending the corrosion process in alkaline AABs and advancing the development of novel electrolyte additives. However, when CPC is used alone, its corrosion inhibition effect is limited, and the anode utilization needs further improvement. In future work, other inorganic/organic substances can be introduced to investigate the impact of the CPC hybrid system on corrosion inhibition efficiency and battery performance.
Acknowledgments
The authors extend their appreciation to the Deanship of Research and Graduate Studies at King Khalid University for funding this work through Large Research Project (No. R.G.P.2/560/45). This research was also funded by the National Natural Science Foundation of China (No. 22062022), the Foundation of the Department of Science and Technology of the Guizhou Province (Nos. QKHJCZK555, QKHPTRC5643, and QKHZDSYS006), the Student’s Platform for Innovation and Entrepreneurship Training Program (Nos. 202210665075 and S202310665030), the Opening Project of Material Corrosion and Protection Key Laboratory of Sichuan Province (No. 2020CL06), the Project of Tongren Science and Technology Bureau (No. [2024]15), and the Foundation of the Department of Education of the Guizhou Province (Nos. QJJ003 and QJJ026). In addition, the authors are very grateful to the assistance of the Analytical and Testing Center of Chongqing University for the support of surface characterization.
Data Availability Statement
Data used is available throughout the manuscript text.
Supporting Information Available
The Supporting Information is available free of charge at https://pubs.acs.org/doi/10.1021/acsomega.4c03790.
Schematic representation of the three-electrode setup, and comparison of battery performance of AABs with various electrolytes (PDF)
The authors declare no competing financial interest.
Supplementary Material
References
- Xu J.; Cai X.; Cai S.; Shao Y.; Hu C.; Lu S.; Ding S. High-energy lithium-ion batteries: Recent progress and a promising future in applications. Energy Environ. Mater. 2023, 6, e12450 10.1002/eem2.12450. [DOI] [Google Scholar]
- Liu Q.; Pan Z.; Wang E.; An L.; Sun G. Aqueous metal-air batteries: Fundamentals and applications. Energy Storage Mater. 2020, 27, 478–505. 10.1016/j.ensm.2019.12.011. [DOI] [Google Scholar]
- Xiang J. W.; Yang L. Y.; Yuan L. X.; Yuan K.; Zhang Y.; Huang Y. Y.; Lin J.; Pan F.; Huang Y. H. Alkali-Metal Anodes: From Lab to Market. Joule 2019, 3, 2334–2363. 10.1016/j.joule.2019.07.027. [DOI] [Google Scholar]
- Lianos P. A brief review on solar charging of Zn-air batteries. Phys. Chem. Chem. Phys. 2023, 25, 11883–11891. 10.1039/D3CP00307H. [DOI] [PubMed] [Google Scholar]
- Liu X.; Jiao H.; Wang M.; Song W.-l.; Xue J.; Jiao S. Current progresses and future prospects on aluminium–air batteries. Int. Mater. Rev. 2022, 67, 734–764. 10.1080/09506608.2021.2006968. [DOI] [Google Scholar]
- Liu T.-S.; Chen P.; Qiu F.; Yang H.-Y.; Jin N. T. Y.; Chew Y.; Wang D.; Li R.; Jiang Q.-C.; Tan C. Review on laser directed energy deposited aluminum alloys. Int. J. Extrem. Manuf. 2024, 6, 022004 10.1088/2631-7990/ad16bb. [DOI] [Google Scholar]
- Ryu J.; Park M.; Cho J. Advanced technologies for high-energy aluminum-air batteries. Adv. Mater. 2019, 31, 1804784. 10.1002/adma.201804784. [DOI] [PubMed] [Google Scholar]
- Zackrisson M.; Fransson K.; Hildenbrand J.; Lampic G.; O’Dwyer C. Life cycle assessment of lithium-air battery cells. J. Clean. Prod. 2016, 135, 299–311. 10.1016/j.jclepro.2016.06.104. [DOI] [Google Scholar]
- Meng A.; Sun Y.; Cheng W.; Huang L.; Chen Y. Discharge performance of Al-0.1Sn-0.1In-0.05Ga alloy for Al–air battery anodes. J. Energy Storage 2024, 81, 110414 10.1016/j.est.2023.110414. [DOI] [Google Scholar]
- Xu X.; Zhang J.; Deng Y. Discharge performance of the Al-Mg-Sn alloy anodes with different Sn content for Al-air batteries. J. Power Sources 2023, 576, 233236 10.1016/j.jpowsour.2023.233236. [DOI] [Google Scholar]
- Mokhtar M.; Talib M. Z. M.; Majlan E. H.; Tasirin S. M.; Ramli W. M. F. W.; Daud W. R. W.; Sahari J. Recent developments in materials for aluminum-air batteries: A review. J. Ind. Eng. Chem. 2015, 32, 1–20. 10.1016/j.jiec.2015.08.004. [DOI] [Google Scholar]
- Wu G.-X.; Wei Z.-S.; Li S.-Q.; Cui L.-Y.; Zhang G.-X.; Zeng R.-C. Corrosion inhibition of polyelectrolytes to the Al anode in Al-air battery: A comparative study of functional group effect. J. Power Sources 2024, 592, 233907 10.1016/j.jpowsour.2023.233907. [DOI] [Google Scholar]
- Lv C.; zhang Q.; zhang Y.; Yang Z.; Wu P.; Huang D.; Li H.; Wang H.; Tang Y. Synergistic regulating the aluminum corrosion by ellagic acid and sodium stannate hybrid additives for advanced aluminum-air battery. Electrochim. Acta 2022, 417, 140311 10.1016/j.electacta.2022.140311. [DOI] [Google Scholar]
- Guo L.; Huang Y.; Ritacca A. G.; Wang K.; Ritacco I.; Tan Y.; Qiang Y.; Al-Zaqri N.; Shi W.; Zheng X. Effect of indole-2-carboxylic acid on the self-corrosion and discharge activity of aluminum alloy anode in alkaline Al–air battery. Molecules 2023, 28, 4193. 10.3390/molecules28104193. [DOI] [PMC free article] [PubMed] [Google Scholar]
- Wysocka J.; Cieslik M.; Krakowiak S.; Ryl J. Carboxylic acids as efficient corrosion inhibitors of aluminium alloys in alkaline media. Electrochim. Acta 2018, 289, 175–192. 10.1016/j.electacta.2018.08.070. [DOI] [Google Scholar]
- Deyab M. A. 1-Allyl-3-methylimidazolium bis(trifluoromethylsulfonyl)imide as an effective organic additive in aluminum-air battery. Electrochim. Acta 2017, 244, 178–183. 10.1016/j.electacta.2017.05.116. [DOI] [Google Scholar]
- Luo H.; Liu T.; Rageloa J.; Liu Z.; Wang W. Effect of cetyl trimethyl ammonium bromide as an electrolyte additive on secondary discharge performance of aluminum-air battery. Ionics 2023, 29, 1887–1899. 10.1007/s11581-023-04934-y. [DOI] [Google Scholar]
- Wu S.; Zhang Q.; Sun D.; Luan J.; Shi H.; Hu S.; Tang Y.; Wang H. Understanding the synergistic effect of alkyl polyglucoside and potassium stannate as advanced hybrid corrosion inhibitor for alkaline aluminum-air battery. Chem. Eng. J. 2020, 383, 123162 10.1016/j.cej.2019.123162. [DOI] [Google Scholar]
- Liu Y.; Zhang H.; Liu Y.; Li J.; Li W. Inhibitive effect of quaternary ammonium-type surfactants on the self-corrosion of the anode in alkaline aluminium-air battery. J. Power Sources 2019, 434, 226723 10.1016/j.jpowsour.2019.226723. [DOI] [Google Scholar]
- Xie Y.; Du X.; Meng Y.; Liu Y.; Wang S.; You W.; Liu M.; Guo Y.; Liang Z.; Li D. Dynamic molecular adsorption interface strategy for stable aluminum batteries. Energy Storage Mater. 2024, 70, 103545 10.1016/j.ensm.2024.103545. [DOI] [Google Scholar]
- Wang J.; Lu H.; Hong Q.; Cao Y.; Li X.; Bai J. Porous N,S-codoped carbon architectures with bimetallic sulphide nanoparticles encapsulated in graphitic layers: Highly active and robust electrocatalysts for the oxygen reduction reaction in Al-air batteries. Chem. Eng. J. 2017, 330, 1342–1350. 10.1016/j.cej.2017.08.072. [DOI] [Google Scholar]
- Jiang M.; Fu C.; Cheng R.; Liu T.; Guo M.; Meng P.; Zhang J.; Sun B. Interface engineering of Co3Fe7-Fe3C heterostructure as an efficient oxygen reduction reaction electrocatalyst for aluminum-air batteries. Chem. Eng. J. 2021, 404, 127124 10.1016/j.cej.2020.127124. [DOI] [Google Scholar]
- Mao X.; Auer D. L.; Buchalla W.; Hiller K. A.; Maisch T.; Hellwig E.; Al-Ahmad A.; Cieplik F. Cetylpyridinium chloride: Mechanism of action, antimicrobial efficacy in biofilms, and potential risks of resistance. Antimicrob. Agents Chemother. 2020, 64, 00576 10.1128/AAC.00576-20. [DOI] [PMC free article] [PubMed] [Google Scholar]
- Zhu Y.; Hua Z. F.; Lu Y.; Wang Z. Y.; Tian Z. L.; Peng K. Effect factors on the performances of commercial Al alloy as anode for Al-air batteries. Energy Fuels 2023, 37, 11367–11375. 10.1021/acs.energyfuels.3c01504. [DOI] [Google Scholar]
- Huang Y.; Shi W.; Guo L.; Zhang Q.; Wang K.; Zheng X.; Verma C.; Qiang Y. Corrosion inhibition of L-tryptophan on Al-5052 anode for Al-air battery with alkaline electrolyte. J. Power Sources 2023, 564, 232866 10.1016/j.jpowsour.2023.232866. [DOI] [Google Scholar]
- Yang J.; Zhang D.; Gao L.; Li C. Corrosion inhibition of hybrid H2QS/CaO additives for AA5052 alloy in alkaline solution. J. Chem. Technol. Biotechnol. 2022, 97, 3065–3075. 10.1002/jctb.7171. [DOI] [Google Scholar]
- Delley B. From molecules to solids with the DMol3 approach. J. Chem. Phys. 2000, 113, 7756–7764. 10.1063/1.1316015. [DOI] [Google Scholar]
- Delley B. Hardness conserving semilocal pseudopotentials. Phys. Rev. B 2002, 66, 155125 10.1103/PhysRevB.66.155125. [DOI] [Google Scholar]
- Li X.; Frisch M. J. Energy-represented direct inversion in the iterative subspace within a hybrid geometry optimization method. J. Chem. Theory Comput. 2006, 2, 835–839. 10.1021/ct050275a. [DOI] [PubMed] [Google Scholar]
- Emregül K. C.; Aksüt A. A. The behavior of aluminum in alkaline media. Corros. Sci. 2000, 42, 2051–2067. 10.1016/S0010-938X(00)00055-X. [DOI] [Google Scholar]
- Zhu J.; Xu S.; Wu J.; Yin Y.; Cheng S.; Zhang C.; Qiang Y.; Wang W. Probing corrosion protective mechanism of an amide derivative additive on anode for enhanced alkaline Al-air battery performance. J. Power Sources 2024, 593, 233957 10.1016/j.jpowsour.2023.233957. [DOI] [Google Scholar]
- Zhu C.; Yan L.; Han Y.; Luo L.; Guo J.; Xiang B.; Zhou Y.; Zou X.; Guo L.; Bai Y. Synergistic modulation of alkaline aluminum-air battery based on localized water-in-salt electrolyte towards anodic self-corrosion. Chem. Eng. J. 2024, 485, 149600 10.1016/j.cej.2024.149600. [DOI] [Google Scholar]
- Ganjoo R.; Sharma S.; Sharma P. K.; Dagdag O.; Berisha A.; Ebenso E. E.; Kumar A.; Verma C. Coco monoethanolamide surfactant as a sustainable corrosion inhibitor for mild steel: theoretical and experimental investigations. Molecules 2023, 28, 1581. 10.3390/molecules28041581. [DOI] [PMC free article] [PubMed] [Google Scholar]
- McCafferty E. Validation of corrosion rates measured by the Tafel extrapolation method. Corros. Sci. 2005, 47, 3202–3215. 10.1016/j.corsci.2005.05.046. [DOI] [Google Scholar]
- Jeanmairet G.; Rotenberg B.; Salanne M. Microscopic simulations of electrochemical double-layer capacitors. Chem. Rev. 2022, 122, 10860–10898. 10.1021/acs.chemrev.1c00925. [DOI] [PMC free article] [PubMed] [Google Scholar]
- Li M. T.; Li F. T.; Hu J. W.; Cui N. N.; Su H. L.; Li L. Z.; Wang Z. K.; Sun S. Q.; Hu S. Q. Preparation and corrosion inhibition mechanism of a chitosan ionic liquid schiff base for the protection of N80 in HCl solution. New J. Chem. 2024, 48, 3064–3079. 10.1039/D3NJ05103J. [DOI] [Google Scholar]
- Zhu Y. M.; Zhao T. Y.; Yu X. H.; Zhu Y. L.; Shen Q. F.; Li R. X.; Xie G. Effect of gadolinium trioxide on anode performance of aluminum-air batteries. Ionics 2023, 29, 4723–4731. 10.1007/s11581-023-05174-w. [DOI] [Google Scholar]
- Luo L.; Zhu C.; Yan L.; Guo L.; Zhou Y.; Xiang B. Synergistic construction of bifunctional interface film on anode via a novel hybrid additive for enhanced alkaline Al-air battery performance. Chem. Eng. J. 2022, 450, 138175 10.1016/j.cej.2022.138175. [DOI] [Google Scholar]
- Zhan X.; Fang L.; Huang Y.; Li S.; Li M.; Nan Z.; Cao Z.; Zhang L.; Tian Z. Electrolyte solvation structure regulation promotes Aluminum-air batteries to approach theoretical discharge capacity. J. Phys. Chem. C 2023, 127, 4439–4450. 10.1021/acs.jpcc.2c09044. [DOI] [Google Scholar]
- Cai S.; Pan C.; Li J.; Zhang D. Effect of Tween 85 and calcium malate as hybrid inhibitors on the performance of alkaline aluminum-air batteries. J. Energy Storage 2024, 79, 110136 10.1016/j.est.2023.110136. [DOI] [Google Scholar]
- Bennett J. M. Recent developments in surface roughness characterization. Meas. Sci. Technol. 1992, 3, 1119–1127. 10.1088/0957-0233/3/12/001. [DOI] [Google Scholar]
- Zhang W.; Cai S.; Zhang D.; Gao L. Excellent performance of 8-hydroxyquinoline and alkyl polyglycolides hybrid electrolyte additives on aluminum-air battery. Chem. Eng. J. 2023, 472, 145139 10.1016/j.cej.2023.145139. [DOI] [Google Scholar]
- Lv Z.; Wang K.; Si Y.; Li Z.; Yu T.; Liu X.; Wang G.; Xie G.; Jiang L. High performance of multi-layered alternating Ni-Fe-P and Co-P films for hydrogen evolution. Green Energy Environ. 2022, 7, 75–85. 10.1016/j.gee.2020.07.023. [DOI] [Google Scholar]
- Zhang Q. H.; Hou B. S.; Li Y. Y.; Zhu G. Y.; Lei Y.; Wang X.; Liu H. F.; Zhang G. A. Dextran derivatives as highly efficient green corrosion inhibitors for carbon steel in CO2-saturated oilfield produced water: Experimental and theoretical approaches. Chem. Eng. J. 2021, 424, 130519 10.1016/j.cej.2021.130519. [DOI] [Google Scholar]
- Pyykkö P.; Atsumi M. Molecular single-bond covalent radii for elements 1–118. Chem. - Eur. J. 2009, 15, 186–197. 10.1002/chem.200800987. [DOI] [PubMed] [Google Scholar]
- Kubaib A.; Mohamed Imran P.; Aathif Basha A. Applications of the Vienna Ab initio simulation package, DFT and molecular interaction studies for investigating the electrochemical stability and solvation performance of non-aqueous NaMF6 electrolytes for sodium-ion batteries. Comput. Theor. Chem. 2022, 1217, 113934 10.1016/j.comptc.2022.113934. [DOI] [Google Scholar]
- Li S.; Li C.; Wang F. Computational experiments of metal corrosion studies: A review. Mater. Today Chem. 2024, 37, 101986 10.1016/j.mtchem.2024.101986. [DOI] [Google Scholar]
- Kumar D.; K V. M.; Jain V.; Rai B. Integrating experiments, DFT and characterization for comprehensive corrosion inhibition studies-A case for cinnamaldehyde as an excellent green inhibitor for steels in acidic media. Corros. Sci. 2022, 208, 110623 10.1016/j.corsci.2022.110623. [DOI] [Google Scholar]
Associated Data
This section collects any data citations, data availability statements, or supplementary materials included in this article.
Supplementary Materials
Data Availability Statement
Data used is available throughout the manuscript text.


