Abstract
Full automation of single-molecule localization microscopy (SMLM) is crucial for large-scale and high-throughput cellular imaging. It is well-known that SMLM typically consists of three major steps: immunofluorescence (IF) staining, optical imaging, and image processing. Currently, automation in optical imaging and image processing is almost complete; however, the automation of IF staining has been slow to advance, probably due to its complicated experimental operations. Here we present a low-cost automated method for IF staining, called super-resolution immunofluorescence staining by microfluidics (SRIF-fluidics). This method is suitable for both adherent and suspension cells and supports single-color and multi-color IF staining for SMLM. Our results show that SRIF-fluidics reduces antibody consumption by about 75% and shortens the sample preparation time from 5.6 hours (manual operation) to 2.5 ∼ 4.4 hours, depending on the sample types. Importantly, this method provides a satisfactory consistency of imaging results without sacrificing sample labeling quality. We believe that the method proposed in this paper is a necessary supplement to achieving fully automated SMLM and facilitating high-throughput SMLM in the near future.
1. Introduction
Single-molecule localization microscopy (SMLM), renowned for its excellent spatial resolution, has become a powerful tool for investigating the ultra-structure of cells [1–3]. SMLM primarily obtains the precise positions of a large number of fluorophores by a suitable localization algorithm, and then uses these positions to reconstruct a high-quality super-resolution image, which is beneficial for providing crucial insights on the spatial organization and function of biomolecules at single-molecule level [4,5]. Nowadays, SMLM is extensively used to quantify the size, content, and dynamics of the nanoscale organization of biomolecules, which are helpful for understanding the mechanisms of diseases, quantifying the effects of drug treatment, and developing new drugs for immunotherapy [6–11].
Based on its principle, SMLM includes mainly three steps: immunofluorescence (IF) staining, optical imaging, and image processing. These steps are very complex and easily influenced by numerous factors introduced by human operations, and thus normally require the assistance of well-trained researchers and a variety of complicated experimental operations to obtain reliable and stable results. Over the past decades, researchers have been actively exploring a full automation of SMLM to guaranty efficient and stable imaging results [12–15]. Currently, both the optical imaging and image processing steps have basically been automated in SMLM, but the automation in the IF staining still remains in its initial stage. As the first step in SMLM, the quality of IF staining directly affects the final experimental results [16–18]. Currently, limited by the complex, time-consuming and manual operations, the IF staining in SMLM is highly prone to human errors, which reduce the stability and reproducibility of imaging results. Therefore, addressing automated IF staining for sample preparation in SMLM is crucial to further improve the power and usability of SMLM.
On the other hand, researchers have been working on different approaches for the automation of IF staining, which involves a precise control of liquid flow for quantitative antigen-antibody binding and subsequent elution [19–21]. After considering the principles and performance of the reported IF staining approaches, we are particularly interested in the microfluidic-based approach, mainly because this approach requires a minimum amount of reagents.
Microfluidics is a novel technology for sample preparation that has gained widespread attention in the biomedical field [22–24]. It demonstrates high consistency, accuracy, stability, and integration in IF staining by the advantage of its high integration and automation [25–28]. In 2019, Pedro Almada et al. [13] developed the NanoJ-Fluidics system, which enables automates the IF staining of cells by using a syringe to directly exchange liquid through tubing directly above precultured cells in the confocal petri dish, without the need to simulate a sterile environment inside a microfluidic chip. The next year, Maja Klevanski et al. [12] developed the maS3TORM system based on a confocal petri dish, which achieved automated multi-color DNA-PAINT (a major variant in SMLM) of cell samples by switching different reagents at the bottom of the dish through an external robotic arm. Both the NanoJ-Fluidics and maS3TORM systems utilize open chambers for liquid exchange, bypassing the requirement of cell culture conditions in microfluidic chips and providing a new idea for automated IF staining in SMLM. However, this method of fluid exchange in open chambers results in higher reagent consumption, significantly limiting the development of large-scale SMLM.
Here we report a novel automated microfluidic device, called super-resolution immunofluorescence staining by microfluidics (SRIF-fluidics), for achieving automatic, stable and low-consumption IF staining. In the design of the microfluidic device, we take advantage of the inherent adhesiveness of polydimethylsiloxane (PDMS) material to form a closed chamber by attaching a PDMS layer to the small hole at the bottom of the confocal petri dish. Negative pressure is applied at the outlet to prevent leakage of liquid caused by excessive positive pressure in the chamber. All reagents are controlled within the closed chamber by integration to automatically perform IF staining of cells. Experimental results demonstrated that using the SRIF-fluidics device can reduce the antibody consumption in a single incubation from 200 μL to approximately 150 μL, saving about a quarter of the antibody used. Additionally, the total time of IF staining is shortened from 5.6 hours (manual operation) to 2.5 ∼ 4.4 hours, according to the sample types. Utilizing the SRIF-fluidics device, we can keep the reagents consumption used in the entire IF staining process under 5 mL. Furthermore, our experimental results show that SMLM images obtained with SRIF-fluidics not only exhibit superior signal-to-noise ratio (SNR), localization precision, and resolution, but also have greater consistency in results. Consequently, we believe that the SRIF-fluidics device is helpful to realize automatic SMLM, and provide an excellent IF staining solution for enabling high-throughput SMLM.
2. Method
2.1. Manual sample preparation protocol
COS-7 cells were fixed using a fixation solution (3% PFA, 0.1% GA, 0.2% Triton X-100 in PBS) for 15 min. After fixation, the cells were washed three times in PBS and then permeabilized with 0.2% Triton X-100 in PBS for 10 min, followed by three more PBS wishes. For blocking, the fixed cells were treated with a blocking buffer (3% BSA, 0.05% Triton X-100 in PBS) for 90 min. Then, the cells were incubated with primary antibody for 1 hour, followed by three washes, each lasting 10 min. Afterward, they were incubated with the secondary antibody for 40 min, followed by five washes, each lasting 10 min. The sample could be used for super-resolution imaging or stored at -20 ℃ for future use.
The erythrocytes were fixed using a fixation solution (3% PFA, 0.1% GA, 0.2% Triton X-100 in PBS) for 10 minutes. After fixation, erythrocytes were washed thrice in PBS and further blocked and permeabilized for 2 min with 3% BSA and 0.05% Triton X-100 in PBS. Then, the erythrocytes were stained with primary antibody for 2 hours, followed by three washes, each lasting 10 min. Afterwards, they were incubated with secondary antibody for 40 min, followed by five washes, each lasting 10 min. The sample could be used for super-resolution imaging or stored at 4 ℃ for a short time.
2.2. Design and fabrication of SRIF-fluidics
The SRIF-fluidics device was consisted of a single microchip layer and a confocal petri dish. The microchip layer was fabricated by a replica molding process using PDMS (DC184, Dow Corning). The device was featured by a multiphase liquid exchange chamber with the same diameter as the glass at the bottom of the confocal petri dish. The microchip layer was securely attached to the bottom of the confocal petri dish and reversibly sealed using negative pressure at the outlet. The internal multiphase liquid exchange chamber within the SRIF-fluidics device was a circular chamber with a diameter of 13 mm and a height of 50 μm. The volume between the microchip layer and bottom glass in the SRIF-fluidics device was approximately 150 µL.
2.3. Super-resolution imaging process of SRIF-fluidics
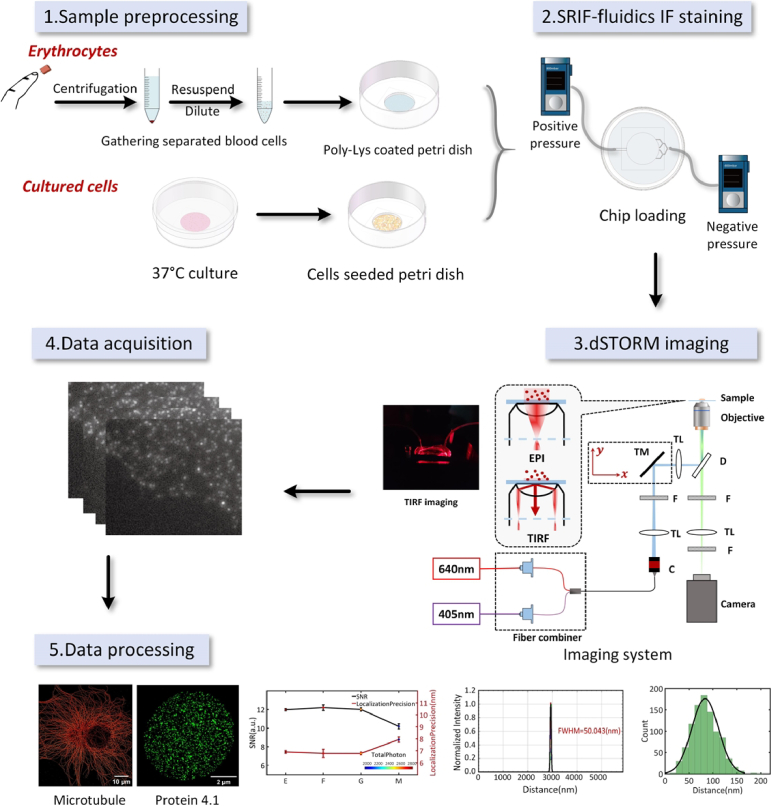
The microfluidic imaging platform (Fig. 1) is versatile for the immunofluorescence staining of various cell samples. For COS-7 cells, the operation process involves five steps described below.
Fig. 1.
Schematic illustration of procedures by microfluidic imaging platform.
Step 1 : Sample preprocessing. Cells were pre-seeded in a culture dish and allowed to adhere. Reagents were prepared as described in the Manual sample preparation protocol section and allocated to their respective reservoirs.
Step 2 : SRIF-fluidics IF staining. SRIF-fluidics device was installed according to the connection method described in Fig. S1 and Fig. S2 of the Supplementary Materials. The automated IF staining process was initiated at a flow rate of 10 µL/min. This process included fixation, permeabilization, blocking and antibody incubation, more detailed information could be found in the SRIF-fluidics-based IF staining protocol proposal section. Once the IF staining was complete, the imaging buffer was either automatically injected for super-resolution imaging, or the microchip layer was directly removed. The sample could be used for imaging or stored at 4 ℃ for subsequent imaging.
Step 3 : dSTORM imaging. For single-color super-resolution imaging of COS-7 cells, all samples were imaged using the same laser intensity (∼5.1 kw cm−2) and imaging buffer. For two-color super-resolution imaging of COS-7 cells, the Colorimetry camera [29] was substituted (refer to Supplementary Material for more details).
Step 4 : Data acquisition. Data acquisition involved capturing 10,000 frames with an exposure time of 10 ms for single-color SMLM and 40,000 frames with an exposure time of 30 ms for muti-color SMLM.
Step 5 : Data processing. The super-resolution images were processed using QC-STORM plug-in [30], and the localization data obtained were utilized for subsequent analysis. For COS-7 cells, the Full Width Half Maximum (FWHM) resolution of microtubule images was calculated, and parameters such as localization precision, signal-to-noise ratio (SNR), and total photon number could be analyzed based on the localization table data.
3. Result and discussion
3.1. SRIF-fluidics-based immunofluorescence staining protocol proposal
3.1.1. Manual immunofluorescence staining protocol
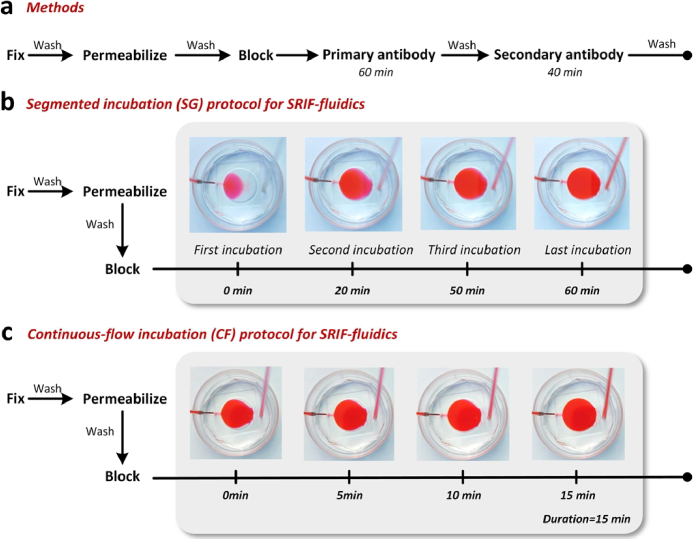
As shown in Fig. 2(a), the manual IF staining workflow for COS-7 cells, including fixation, permeabilization, blocking, primary antibody incubation, and secondary antibody incubation, each step necessitating repeated washing. The blocking solution was employed for antibody dilution and blocking. During our manual operation, each reagent was meticulously replaced using pipetting, ensuring that the introduced volume was uniformly distributed and covered the glass cavity at the dish's bottom (∼150 µL). To optimize antibody incubation, a slight excess of antibody solution (∼200 µL) was added at each incubation step. The entire experiment involves 38 additions and changes, with an estimated duration of approximately 5.6 hours.
Fig. 2.
Comparison of manual IF staining protocol with SRIF-fluidics-based IF staining protocol. (a) Workflow of the manual IF staining for COS-7 cells. (b) Simulation test of segmented incubation (SG) protocols using SRIF-fluidics. (c) Simulation test of continuous-flow incubation (CF) protocols using SRIF-fluidics.
3.1.2. Automated immunofluorescence staining protocol by SRIF-fluidics
We developed an automated IF staining protocol using SRIF-fluidics to replace the traditional manual IF staining protocol. Initially, we used a single incubation strategy to fill the entire SRIF-fluidics chamber for incubation, referring to the manual method. However, the resulting super-resolution imaging results (Fig. S3) revealed non-uniform staining, indicating inadequate diffusion of the antibody solution throughout the chamber. To address this issue, we changed to segmented incubation (SG) method, as illustrated for antibody incubation in Fig. 2(b). This new protocol involved replenishing the antibody solution four times. In the first segment, the antibody solution rested briefly at the critical portion of the SRIF-fluidics chamber to ensure a stable flow rate during the subsequent three segments. Automated incubation began with the second passage of the antibody solution into the chamber, maintaining a total incubation duration of 60 minutes, consistent with the manual labeling approach. The segmented incubation strategy produced super-resolution images with uniform labeling (Fig. S4).
To address the issue of antibody waste in concentrated solutions during segmental incubation, we introduced a continuous flow (CF) incubation protocol. The CF protocol utilized a constant flow rate of 10 µL/min for a continuous processing over 15 min, as shown in Fig. 2(c). Further optimization details are available in Section 3.2.
3.2. Optimizing the immunofluorescence staining protocol using SRIF-fluidics
To optimize the IF staining protocol using SRIF-fluidics, we conducted experiments to assess the impact of SG and CF protocols on microtubule labeling using different antibody concentrations. The α-tubulin in COS-7 cells was chosen as the target for IF staining. Additionally, we evaluated the applicability on mitochondrial structures using the CF protocol.
3.2.1. Super-resolution images obtained from the segmented incubation protocol
We investigated the impact of antibody concentration and incubation time on the IF staining process, as these factors are crucial in influencing the final image quality. To optimize the antibody incubation steps based on SRIF-fluidics, we modified existing manual IF staining protocol for microtubules. In the manual protocol, both primary and secondary antibodies were incubated at a 1:400 dilution. However, when using SRIF-fluidics for antibody incubation, the actual antibody concentration is diluted due to continuous liquid pass-through. To evaluate the efficacy of the SG protocol implemented with SRIF-fluidics, we established three groups with different antibody concentrations: 1:200 (SG-200), 1:400 (SG-400), 1:800 (SG-800). Additionally, a manual control group (Manual-400) was included. For all groups, the concentrations of primary and secondary antibodies were kept the same, and the volume of antibody solution was 300 µL.
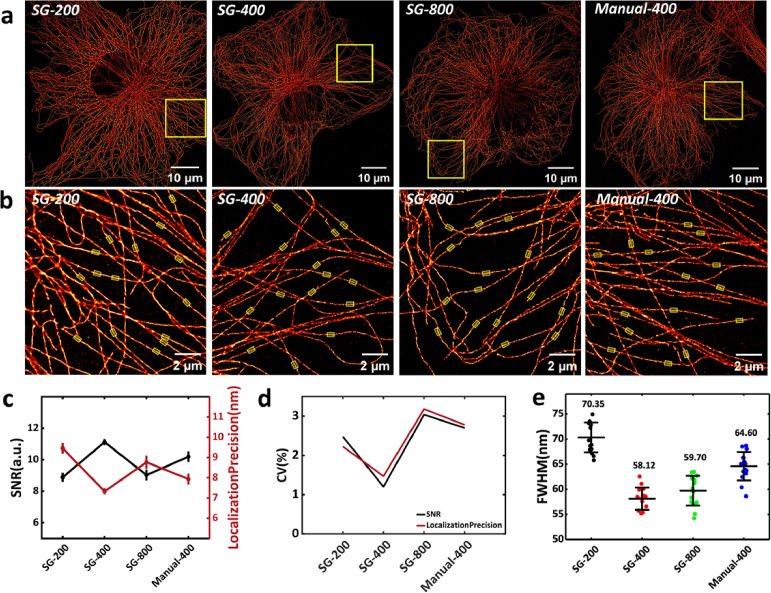
We conducted five replicate imaging experiments for each of the four groups. Figure 3(a) demonstrates the uniformity of IF staining across all four experimental conditions. For qualitative analysis of the quality of super-resolution images of four groups, the local magnification of super-resolution images (Fig. 3(b)) shows distinct differences among the groups. The SG-200 group exhibits a higher background with more non-specific labeling, particularly around the microtubule filamentous structures. The manual-400 group displays slight non-specific labeling. In contrast, both the SG-400 and SG-800 groups demonstrate relatively clean backgrounds with no apparent non-specific labeling.
Fig. 3.
Results of microtubule IF staining in COS-7 cells using the SG protocol under four conditions. (a) Overall super-resolution image of single-cell microtubule under four different conditions. (b) Enlarged view of the yellow boxed area in (a), with the yellow transparent regions highlighting the microtubules used for FWHM calculation. (c) Mean line graphs of showing the imaging localization precision and SNR for five randomly selected regions under four conditions. (d) Line graphs showing the Coefficient of Variation (CV) of localization precision and SNR for five randomly selected regions under four conditions. (e)Statistical distribution of the FWHM of microtubules (n = 15). (All error bars are the standard deviations.)
Next, a quantitative analysis of the super-resolution images from the four experimental groups was conducted. Four parameters were selected to comprehensively assess imaging experiment: SNR, localization precision, Coefficient of Variation (CV) of localization precision and SNR under four conditions, and FWHM values. The results are shown in Fig. 3(c-e). To calculate the FWHM value of microtubules under each of the four conditions, we randomly selected 15 regions highlighted in light yellow in Fig. 3(b). The average resolution of the Manual-400 group is 64.60 nm, while the average resolutions of the SG-200 group, SG-400 group, and SG-800 group are 70.35 nm, 58.12 nm, and 59.70 nm, respectively.
As shown in Fig. 3(c-e), the SG-400 group displayed the highest SNR, lowest localization precision, CV values and FWHM values, indicating superior overall image quality as well as better consistency. Interestingly, although the SG-200 group had the highest antibody concentration, its CV values was moderate, but its SNR, localization precision and FWHM values were the worst, even compared to the Manual-400 group. This proves that the labeling efficiency of the SG-200 group is actually lower than that of the SG-400 group. The reason is that the excessive antibodies in the SG-200 group fail to effectively bind to the target protein, resulting in excessive non-specific labeling, which reduced image quality and wasted a large amount of antibodies. For the SG-800 group, although it successfully labeled microtubules, the fluorescence signal of the labeled target proteins was relatively weak, leading to poorer SNR and localization precision, with greater variability in the statistical results. This suggests that an 800-fold antibody dilution is not suitable for the current SG protocol. Collectively, these findings suggest that antibody concentrations of 400-fold dilution are preferable under the SG protocol, and comprehensively improving the quality of super-resolution images and consistency compared to the manual protocol.
3.2.2. Super-resolution images obtained from the continuous-flow protocol
Through experiments in Section 3.2.1, we verified that the SRIF-fluidics-based SG protocol achieves better super-resolution imaging parameters than the manual protocol. The main reason is that increasing the total amount of antibodies can promptly replenish depleted antibody regions, thereby enhancing the labeling efficiency of super-resolution microscopy. However, high concentrations of antibodies can cause non-specific binding, resulting in decreased image quality and low antibody utilization. This issue can be considered as the low permeability of the cell membrane, which prevents antibodies from quickly entering the cells. To address this, we optimized the antibody incubation protocol by raising the concentration of Triton X-100 in the blocking solution from 0.05% to 0.2%. This adjustment improved the permeability of the cell membrane and facilitated a greater influx of antibodies into the cells. However, the heightened Triton X-100 concentration may result in protein degradation during prolonged antibody incubation. Experiments conducted following the conventional manual protocol resulted in damage to the microtubule structures inside the cells (refer to supporting material Fig. S5 for further details). Consequently, we halved the incubation time for both primary and secondary antibody (i.e. 30 min for the primary antibody and 20 min for the secondary antibody) and reduced the amount of antibody to 150 µL. The effect of halving the antibody incubation time (Fig. S6) demonstrated significant improvement over the SG-200 group, with a significant reduction in non-specific labeling, improved localization precision, total photon counts, and SNR. And the microtubule structure remained relatively intact.
After increasing the permeability of the cell membrane, the rate of antibody entry into the cells will be enhanced. However, the SG protocol will result in delayed replenishment of antibody levels, reducing the labeling efficiency. To address this, we propose a CF protocol (Fig. 2(c)) for antibody incubation. Considering the incubation time of primary and secondary antibodies, we selected a flow rate of 10 μL/min for the antibody solution. The incubation time of both primary and secondary antibodies was shortened to 15 min for the entire CF incubation protocol, resulting in a reduction of approximately 1 hour in the overall IF staining process. In the CF protocol, the liquid in SRIF-fluidics undergoes laminar flow, and the advection in microchips is mostly restricted to a laminar regime. The antibodies are delivered to the micrometer-sized fluidic layers adjacent to the solid-liquid interface (the contact area between cells and antibody solution), which can significantly enhance surface reaction kinetics, accelerating antigen-antibody binding by several orders of magnitude [31].
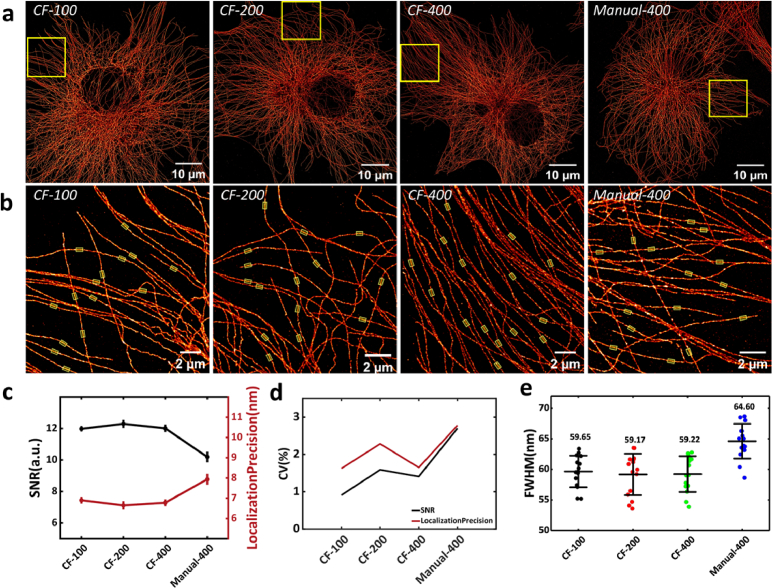
Utilizing the optimized CF protocol, we established three sets of CF incubation groups with different antibody concentrations for comparison with the manual group (Manual-400). These groups included concentrations of 1:100 (CF-100), 1:200 (CF-200), and 1:400 (CF-400), while keeping constant primary and secondary antibody concentrations with the volume of 150 µL. We conducted five replicate imaging experiments for all four groups, and the super-resolution images are shown in Fig. 4(a). The images of individual cells demonstrate that the microtubules remain intact under all four conditions, with a relatively clean background observed in the local magnification, as shown in Fig. 4(b). Moreover, all the results of experimental groups, as shown in Fig. 4(c-e), exhibit better super-resolution imaging results than the Manual-400 group.
Fig. 4.
Results of microtubule IF staining in COS-7 cells using the CF protocol under four conditions. (a) Overall super-resolution image of single-cell microtubules under four different conditions. (b) Enlarged view of the yellow boxed area in (a), with the yellow transparent regions highlighting the microtubules used for FWHM calculation. (c) Mean line graphs of showing the imaging localization precision and SNR for five randomly selected regions. (d) Line graphs showing the Coefficient of Variation (CV) of localization precision and SNR for five randomly selected regions under four conditions. (e) Statistical distribution of the FWHM of microtubules (n = 15). (All error bars are the standard deviations.)
Quantitative analysis of the super-resolution image quality across the three experimental groups (Fig. 4(c-e)) reveals that the localization precision, SNR, FWHM, and CV values of all three experimental groups were better than the Manual-400 group. The FWHM values of the microtubules in the CF-100, CF-200, and CF-400 groups (Fig. 4(e)) were measured as 59.65 nm, 59.17 nm, and 59.22 nm, respectively. The CF-100 group, which used the highest antibody concentration, showed lower SNR, localization precision and FWHM values compared to the other two groups. While the CF-200 had relatively higher SNR and localization precision than the CF-400 group, it did not show better SMLM parameters. This indicating that both the CF-100 and CF-200 group used excessive amount of antibodies. Under the CF protocol, antibody concentrations of 400-fold dilution is recommended for SMLM sample preparation.
To verify the staining capability of the SRIF-fluidics-based CF protocol in cell structures with varying distribution characteristics, we chosen mitochondria as the target for IF staining, as they exhibit a more concentrated distribution. Based on our findings, we selected the experimental conditions of the CF-200 group for IF staining validation of mitochondria structure. Additionally, we obtained high-quality super-resolution imaging by performing IF staining of Tomm20, an extra-membrane protein of mitochondria (refer to Fig. S7). The super-resolution images of mitochondria demonstrate the advantages of SRIF-fluidics in facilitating protein IF staining for proteins with diverse distribution patterns.
3.3. SRIF-fluidics-based multi-color SMLM
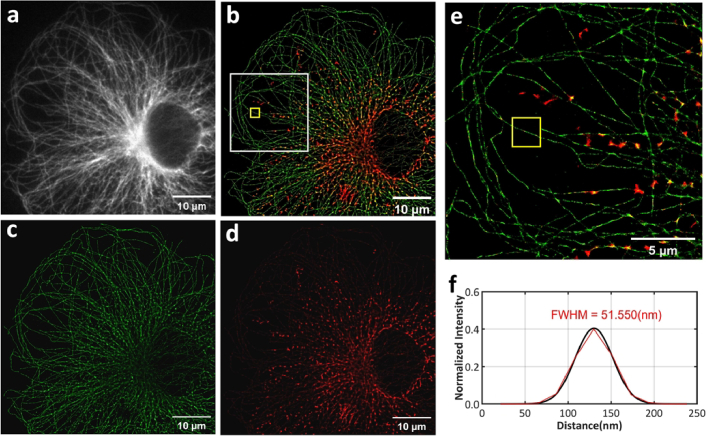
After verifying the IF staining capability of the SRIF-fluidics in cells, we performed multiple IF (mIF) staining on cellular microtubule and mitochondria using the CF protocol. The antibody dilution for mitochondria and microtubule in the CF protocol was the same as in the Section 3.2.2. And we selected CF680 (mitochondria) and DL633 (microtubule) as the dyes, and this dye combination proved to be optimal for achieving color separation using colorimetry camera for simultaneous multi-color SMLM [29]. The results of the SRIF-fluidic-based multi-color super-resolution imaging, as shown in Fig. 5, demonstrate that both microtubules and mitochondria were successfully labeled, with the width of the microtubules measured at 51.550 nm using FWHM analysis. Due to the chosen colorimetry camera being equipped with a color filter array, with half of the pixels as white pixels and the other half as color pixels (red (R), green (G), blue (B), and near infrared (NIR) pixels), the different color pixels respond differently to the wavelengths of emitters, resulting in pixelation in the wide-field fluorescence images. However, this effect does not impact super-resolution imaging. A demosaicking algorithm can eliminate this pixelation effect [32]. To better display the multi-color wide-field images, Fig. 5(a) shows the images after demosaicking processing.
Fig. 5.
Multi-color super-resolution imaging results. (a) Wide-field fluorescence image of microtubule and mitochondria after demosaicking processing. (b) Multi-color super-resolution result of microtubule and mitochondria. (c) Algorithmically separated microtubule channel image. (d) Algorithmically separated mitochondrial channel image. (e) Enlarged view of the white boxed area in (b). (f) FWHM value of microtubule at the yellow boxed area.
3.4. SRIF-fluidics-based super-resolution imaging of red blood cells
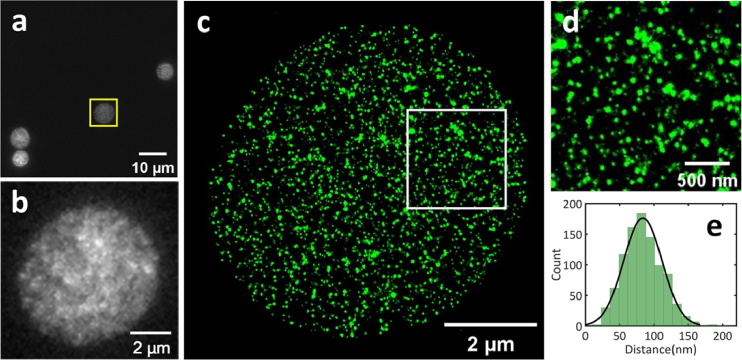
The above study successfully validated the IF staining capability of SRIF-fluidics in adherent cells. To further evaluate the effectiveness of SRIF-fluidics-based IF staining in suspension cells, we performed IF staining on the erythrocyte cytoskeleton protein (Protein 4.1). A key modification was the seeding of erythrocytes directly on the SRIF-fluidics device to enhance cell stability during seeding process. Experimental results showed that the retention of erythrocytes using the SRIF-fluidics-based IF staining protocol was higher than with the manual protocol, as shown in Fig. S8. The super-resolution imaging results of erythrocytes using SRIF-fluidics are shown in Fig. 6.
Fig. 6.
Single-color super-resolution imaging results of erythrocytes by SRIF-fluidics. (a) Wide-field fluorescence image of multiple erythrocytes, the cell within the yellow dotted box was selected for the super-resolution imaging. Scale bar: 10 µm. (b) Zoomed-in wide-field image of erythrocytes shown in (a). Scale bar: 2 µm. (c) Super-resolution image of erythrocytes in (b). Scale bar: 2 µm. (d) Enlarged view of image of the area within the white box in (c). Scale bar: 500 nm. (e) Distribution of distances between the nearest neighbors of clusters.
In Fig. 6(a), a uniform distribution of erythrocytes was observed within a single field of view, and regions with thin cell membranes were selected for super-resolution imaging, as shown in Fig. 6(c). Figure 6(d) shows the local magnification of erythrocytes. The statistical analysis of the erythrocyte cytoskeleton protein clusters, shown in Fig. 6(e), revealed that the distance between nearest neighbors of the clusters was around 70∼80 nm. These findings are consistent with previous literature reports [33] and demonstrate the feasibility of the SRIF-fluidics-based IF staining protocol for erythrocyte.
4. Conclusion
In summary, we have developed a microfluidic device called SRIF-fluidics for automated IF staining in SMLM. This device features a stable structure, user-friendly operation, and high integration. Compared to the manual IF staining methods, SRIF-fluidics significantly reduces the complexity of IF staining procedures with enhancing image quality. The device also improves the consistency of sample processing, reduces labor costs, and accelerates sample preparation. We demonstrated the versatility of SRIF-fluidics-based IF staining in both adherent cells (two different structures in COS-7 cells, including microtubule and mitochondrial) and suspended cells (cytoskeleton protein in erythrocyte), while supporting single-color and multi-color super-resolution IF staining. During the IF staining process, antibody incubation was optimized, leading to the development of SG and CF protocols. We established the most suitable CF protocol for SRIF-fluidics, which shortened the entire manual IF staining process from 5.6 hours to 2.5 ∼ 4.4 hours, while reducing total reagent consumption to less than 5 mL and antibody consumption by about 75%. Importantly, SRIF-fluidics allows for flexible adjustments to the IF staining protocol, optimizing parameters such as the SNR, localization precision, and resolution of super-resolution images, thus enabling higher image quality. In the near future, we will continue to refine the SRIF-fluidics-based CF protocol, aiming for faster and higher-throughput sample preparation for SMLM.
Supplemental information
Acknowledgements
We thank all the other members of Digital Theranostics and Optical Microscopy (DigiTOM) group for their technical support.
Funding
Matching Fund from Collaborative Innovation Center of One Health, Hainan University (XTCX2022JKC08); Innovational Fund for Scientific and Technological Personnel of Hainan Province (KJRC2023C03); National Key Research and Development Program of China10.13039/501100012166 (2022YFC3400601); National Natural Science Foundation of China10.13039/501100001809 (82260368, 82160345).
Disclosures
A patent is pending.
Data availability
Codes and data underlying the results presented in this paper are not publicly available at this time but may be obtained from the authors upon reasonable request.
Supplemental document
See Supplement 1 (943.2KB, pdf) for supporting content.
References
- 1.Hugelier S., Colosi P.L., Lakadamyali M., et al. , “Quantitative Single-Molecule Localization Microscopy,” Annu. Rev. Biophys. 52(1), 139–160 (2023). 10.1146/annurev-biophys-111622-091212 [DOI] [PMC free article] [PubMed] [Google Scholar]
- 2.Ghanam J., Chetty V. K., Zhu X., et al. , “Single Molecule Localization Microscopy for Studying Small Extracellular Vesicles,” Small 19(12), 2205030 (2023). 10.1002/smll.202205030 [DOI] [PubMed] [Google Scholar]
- 3.Liu S., Hoess P., Ries J., et al. , “Super-Resolution Microscopy for Structural Cell Biology,” Annu. Rev. Biophys. 51(1), 301–326 (2022). 10.1146/annurev-biophys-102521-112912 [DOI] [PubMed] [Google Scholar]
- 4.Lelek M., Gyparaki Melina T., Beliu G., et al. , “Single-molecule localization microscopy,” Nat. Rev. Methods Primers 1(1), 39 (2021). 10.1038/s43586-021-00038-x [DOI] [PMC free article] [PubMed] [Google Scholar]
- 5.Möckl L., Moerner W. E., “Super-resolution Microscopy with Single Molecules in Biology and Beyond–Essentials, Current Trends, and Future Challenges,” J. Am. Chem. Soc. 142(42), 17828–17844 (2020). 10.1021/jacs.0c08178 [DOI] [PMC free article] [PubMed] [Google Scholar]
- 6.Yu Y., Yu J., Huang Z.-L., et al. , “Application of super-resolution fluorescence microscopy in hematologic malignancies,” J. Innovative Opt. Health Sci. 15(02), 2230005 (2022). 10.1142/S1793545822300051 [DOI] [Google Scholar]
- 7.Yang X., Annaert W., “The Nanoscopic Organization of Synapse Structures: A Common Basis for Cell Communication,” Membranes 11(4), 248 (2021). 10.3390/membranes11040248 [DOI] [PMC free article] [PubMed] [Google Scholar]
- 8.Wei Y., Zhao M., He T., et al. , “Quantitatively Lighting up the Spatial Organization of CD47/SIRPα Immune Checkpoints on the Cellular Membrane with Single-Molecule Localization Microscopy,” ACS Nano 17(21), 21626–21638 (2023). 10.1021/acsnano.3c06709 [DOI] [PubMed] [Google Scholar]
- 9.Nerreter T., Letschert S., Doose S., et al. , “Super-resolution microscopy reveals ultra-low expression of CD19 on myeloma cells that triggers elimination by CAR-T cells,” Clin. Lymphoma, Myeloma Leuk. 19(10), e166 (2019). 10.1016/j.clml.2019.09.277 [DOI] [PMC free article] [PubMed] [Google Scholar]
- 10.García-Guerrero E., Götz R., Doose S., et al. , “Upregulation of CD38 expression on multiple myeloma cells by novel HDAC6 inhibitors is a class effect and augments the efficacy of daratumumab,” Leukemia 35(1), 201–214 (2021). 10.1038/s41375-020-0840-y [DOI] [PMC free article] [PubMed] [Google Scholar]
- 11.Xie J., Han D., Xu S., et al. , “An Image-Based High-Throughput and High-Content Drug Screening Method Based on Microarray and Expansion Microscopy,” ACS Nano 17(16), 15516–15528 (2023). 10.1021/acsnano.3c01865 [DOI] [PubMed] [Google Scholar]
- 12.Klevanski M., Herrmannsdoerfer F., Sass S., et al. , “Automated highly multiplexed super-resolution imaging of protein nano-architecture in cells and tissues,” Nat. Commun. 11(1), 1552 (2020). 10.1038/s41467-020-15362-1 [DOI] [PMC free article] [PubMed] [Google Scholar]
- 13.Almada P., Pereira P. M., Culley S., et al. , “Automating multimodal microscopy with NanoJ-Fluidics,” Nat. Commun. 10(1), 1223 (2019). 10.1038/s41467-019-09231-9 [DOI] [PMC free article] [PubMed] [Google Scholar]
- 14.Barentine A. E. S., Lin Y., Courvan E. M., et al. , “An integrated platform for high-throughput nanoscopy,” Nat. Biotechnol. 41(11), 1549–1556 (2023). 10.1038/s41587-023-01702-1 [DOI] [PMC free article] [PubMed] [Google Scholar]
- 15.Beghin A., Kechkar A., Butler C., et al. , “Localization-based super-resolution imaging meets high-content screening,” Nat. Methods 14(12), 1184–1190 (2017). 10.1038/nmeth.4486 [DOI] [PubMed] [Google Scholar]
- 16.Jimenez A., Friedl K., Leterrier C., “About samples, giving examples: Optimized Single Molecule Localization Microscopy,” Methods 174, 100–114 (2020). 10.1016/j.ymeth.2019.05.008 [DOI] [PubMed] [Google Scholar]
- 17.Pereira P. M., Albrecht D., Culley S., et al. , “Fix Your Membrane Receptor Imaging: Actin Cytoskeleton and CD4 Membrane Organization Disruption by Chemical Fixation,” Front. Immunol. 10, 00675 (2019). 10.3389/fimmu.2019.00675 [DOI] [PMC free article] [PubMed] [Google Scholar]
- 18.Allen J. R., Ross S. T., Davidson M. W., et al. , “Sample preparation for single molecule localization microscopy,” Phys. Chem. Chem. Phys. 15(43), 18771–18783 (2013). 10.1039/c3cp53719f [DOI] [PubMed] [Google Scholar]
- 19.May M., “Automated sample preparation,” Science 351(6270), 300–302 (2016). 10.1126/science.351.6270.300 [DOI] [Google Scholar]
- 20.Lim J. C. T., Yeong J. P. S., Lim C. J., et al. , “An automated staining protocol for seven-colour immunofluorescence of human tissue sections for diagnostic and prognostic use,” Pathology 50(3), 333–341 (2018). 10.1016/j.pathol.2017.11.087 [DOI] [PubMed] [Google Scholar]
- 21.More D., Khan N., Tekade R. K., et al. , “An Update on Current Trend in Sample Preparation Automation in Bioanalysis: strategies, Challenges and Future Direction,”Crit. Rev. Anal. Chem. (2024). [DOI] [PubMed]
- 22.Pattanayak P., Singh S. K., Gulati M., et al. , “Microfluidic chips: recent advances, critical strategies in design, applications and future perspectives,” Microfluid. Nanofluid. 25(12), 99 (2021). 10.1007/s10404-021-02502-2 [DOI] [PMC free article] [PubMed] [Google Scholar]
- 23.Oh K. W., “Microfluidic Devices for Biomedical Applications: Biomedical Microfluidic Devices 2019,” Micromachines 11(4), 370 (2020). 10.3390/mi11040370 [DOI] [PMC free article] [PubMed] [Google Scholar]
- 24.Huang Y., Liu C., Feng Q., et al. , “Microfluidic synthesis of nanomaterials for biomedical applications,” Nanoscale Horiz. 8(12), 1610–1627 (2023). 10.1039/D3NH00217A [DOI] [PubMed] [Google Scholar]
- 25.Li X., Brooks J. C., Hu J., et al. , “3D-templated, fully automated microfluidic input/output multiplexer for endocrine tissue culture and secretion sampling,” Lab Chip 17(2), 341–349 (2017). 10.1039/C6LC01201A [DOI] [PMC free article] [PubMed] [Google Scholar]
- 26.Khodayari Bavil A., Kim J., “A capillary flow-driven microfluidic system for microparticle-labeled immunoassays,” Analyst 143(14), 3335–3342 (2018). 10.1039/C8AN00898A [DOI] [PubMed] [Google Scholar]
- 27.Kwon T., Ko S. H., Hamel J.-F. P., et al. , “Continuous online protein quality monitoring during perfusion culture production using an integrated micro/nanofluidic system,” Anal. Chem. 92(7), 5267–5275 (2020). 10.1021/acs.analchem.9b05835 [DOI] [PMC free article] [PubMed] [Google Scholar]
- 28.Nunes P. S., Kjaerulff S., Dufva M., et al. , “Real-time direct cell concentration and viability determination using a fully automated microfluidic platform for standalone process monitoring,” Analyst 140(12), 4007–4020 (2015). 10.1039/C5AN00478K [DOI] [PubMed] [Google Scholar]
- 29.Wang Y., Kuang W., Shang M., et al. , “Two-color super-resolution localization microscopy via joint encoding of emitter location and color,” Opt. Express 29(21), 34797–34809 (2021). 10.1364/OE.440706 [DOI] [PubMed] [Google Scholar]
- 30.Li L., Xin B., Kuang W., et al. , “Divide and conquer: real-time maximum likelihood fitting of multiple emitters for super-resolution localization microscopy,” Opt. Express 27, 21029–21049 (2019). 10.1364/OE.27.021029 [DOI] [PubMed] [Google Scholar]
- 31.Pereiro I., Fomitcheva-Khartchenko A., Kaigala G. V., et al. , “Shake it or shrink it: mass transport and kinetics in surface bioassays using agitation and microfluidics,” Anal. Chem. 92(15), 10187–10195 (2020). 10.1021/acs.analchem.0c01625 [DOI] [PubMed] [Google Scholar]
- 32.Zhang Z., Kuang W., Shi B., et al. , “Pushing the colorimetry camera-based fluorescence microscopy to low light imaging by denoising and dye combination,” Opt. Express 30(19), 33680–33696 (2022). 10.1364/OE.466074 [DOI] [PubMed] [Google Scholar]
- 33.Pan L., Yan R., Li W., et al. , “Super-resolution microscopy reveals the native ultrastructure of the erythrocyte cytoskeleton,” Cell Rep. 22, 1151–1158 (2018). 10.1016/j.celrep.2017.12.107 [DOI] [PubMed] [Google Scholar]
Associated Data
This section collects any data citations, data availability statements, or supplementary materials included in this article.
Supplementary Materials
Data Availability Statement
Codes and data underlying the results presented in this paper are not publicly available at this time but may be obtained from the authors upon reasonable request.


