Abstract
Accurate 3D segmentation of fluid lesions in optical coherence tomography (OCT) is crucial for the early diagnosis of diabetic macular edema (DME). However, higher-dimensional spatial complexity and limited annotated data present significant challenges for effective 3D lesion segmentation. To address these issues, we propose a novel semi-supervised strategy using a correlation mutual learning framework for segmenting 3D DME lesions from 3D OCT images. Our method integrates three key innovations: (1) a shared encoder with three parallel, slightly different decoders, exhibiting cognitive biases and calculating statistical discrepancies among the decoders to represent uncertainty in unlabeled challenging regions. (2) a global reasoning attention module integrated into the encoder's output to transfer label prior knowledge to unlabeled data; and (3) a correlation mutual learning scheme, enforcing mutual consistency between one decoder's probability map and the soft pseudo labels generated by the other decoders. Extensive experiments demonstrate that our approach outperforms state-of-the-art (SOTA) methods, highlighting the potential of our framework for tackling the complex task of 3D retinal lesion segmentation.
1. Introduction
Diabetic macular edema (DME), a swelling of the central retina caused by the accumulation of leaked fluid from retinal capillaries within the intercellular spaces of the retina [1,2], has been the leading cause of vision impairment and blindness worldwide [3,4]. Optical coherence tomography (OCT), a non-invasive, high-resolution, and three-dimensional (3D) imaging technology, plays an important role in the diagnosis and monitoring of retinal DME disease [5,6]. In clinical ophthalmology, DME lesions detection and segmentation in OCT images is an essential step for early detection and monitoring [7–9].
Over the past few years, deep-learning approaches have shown significant potential in medical image analysis [10,11]. Several methods have been proposed for segmenting retinal 2D fluids and layers from 2D OCT images [12–14]. Particularly, M. Li et al. [15] introduced a novel multi-scale and cross-channel feature extraction network to obtain high-accuracy 3D segmentation results of wet AMD lesions. G. Xing et al. [16] adopted a novel curvature regularization term to incorporate shape-prior information for OCT fluid 2D segmentation. Considering the directional connectivity in biomarkers, Z. Yang and S. Farsiu [17] proposed the DconnNet to employ the directional information across the network. Attention mechanisms have also been widely used in medical image segmentation with great results in highlighting helpful information and capturing long-range dependencies. M. Wang et al. [18] developed the MsTGANet, a multi-scale transformer global attention network for drusen segmentation in retinal OCT images that combines non-local and multi-semantic information. R. Rasti et al. [19] introduced a novel model that leverages multi-attention and self-adaptive modules to segment multi-class retinal fluid segmentation.
Despite the remarkable advancements that have been achieved, many existing segmenting models work for 2D OCT B-scan frames, which cannot fully explore the OCT 3D voxels, leading to insufficient 3D segmenting performances and hindering further quantitative analyses. Therefore, robust and automated 3D segmentation methods for retinal fluid are highly desirable, as they can effectively leverage the 3D features of OCT imaging to achieve more accurate segmentation results and provide comprehensive, intuitive lesion information for clinical diagnosis and treatment. Meanwhile, another significant challenge for 3D segmentation tasks is data annotation. Most existing segmentation methods rely on abundant labeled data for training, which is more laborious and costly to obtain for 3D segmentation due to the hundreds to thousands of B-scan images in each OCT volume.
Recently, semi-supervised learning has emerged as a promising method for 2D medical image segmentation with limited annotation and has shown significant progress in various 2D segmentation tasks [20,21]. For example, L. Yu et al. [22] the uncertainty-aware mean teacher framework, which enforces consistency between the student and teacher models to enhance model learning. J. Su et al [23] presented a mutual comparison approach that incorporates intra-class consistency to assess the reliability of pseudo-labels. Y. Wang et al. [24] proposed a mutual correction framework to generate entropy-minimization results and explore network bias correction. Meanwhile, adversarial learning has been used for stronger consistency in semi-supervised learning, such as a self-training adversarial learning framework for 2D retinal OCT fluid segmentation [25], and a semi-supervised adversarial training strategy to reduce the negativity of increasing similarity between predicted results and erroneous predictions for unlabeled data [26]. Additionally, transformer-based self-supervised pre-trained models, such as UNETR [27] and Swin UNETR [28], have been proposed. These models demonstrate strong feature extraction capabilities and have achieved remarkable performances in multi-class medical image segmentation tasks. However, most of the previous semi-supervised learning focused on 2D segmentations, can not work well for retinal DME 3D segmentation.
Besides, current semi-supervised segmentation methods only focus on extracting information from unlabeled data, disregarding the potential of labeled data to further improve the performance of the model. Typically, there exist shared characteristics between labeled and unlabeled data, such as similar texture, shape, and distribution across different samples. Consequently, it can be hypothesized that establishing a connection between labeled and unlabeled data throughout the entire dataset can effectively transfer prior knowledge from labeled data to unlabeled data, enabling the extraction of information from unlabeled data. Effectively harnessing the potential of limited labeled data and extracting prior knowledge to transfer to unlabeled data can greatly enhance data utilization and significantly alleviate the burden of labeling work.
To tackle these problems and improve the retinal fluid 3D segmentation accuracy, we propose a novel semi-supervised consistency-informed mutual learning framework for retinal fluid segmentation from 3D OCT images, which can comprehensively explore DME features from multiple perspectives and explicitly model the consistency between labeled and unlabeled data to effectively leverage labeled data to guide the extraction of information from data. Our proposed model comprises one shared encoder and three parallel different decoders. At the end of the encoder, we introduce the global reasoning attention module to enable the effective transfer of labeled data information to unlabeled data. The discrepancies among the outputs of three distinct decoders can be leveraged to reinforce model training, enhancing the model’s ability to extract target features and thereby yielding consistent and accurate prediction results. In summary, our contributions are summarized as follows:
-
(1)
We propose a novel consistency-informed mutual learning framework that focuses on the efficient utilization of labeled data to address the challenge of semi-supervised retinal fluid 3D segmentation.
-
(2)
We introduce the Global Reasoning Attention (GRA) module to establish cross-sample relationships directly by enabling the transfer of label prior knowledge to unlabeled data and improve the 3D segmentation performance.
-
(3)
We propose a novel Correlation Mutual Learning (CML) scheme by enforcing mutual consistency constraints between the probability map of one decoder and the soft pseudo labels generated by other decoders. In this way, the proposed model can minimize the discrepancies among the outputs of different decoders during the training process, thereby enabling the model to produce consistent and robust predictions.
-
(4)
Experimental results on a customized DME dataset and the public RETOUCH dataset demonstrate significant improvements over previous SOTAs, especially when only a small number of labeled images are available.
2. Method
In this section, we first provide the structure details and core components of the proposed model. Then, we present the loss function for optimizing the model. Finally, the training strategy will be introduced.
2.1. Overview of model architecture
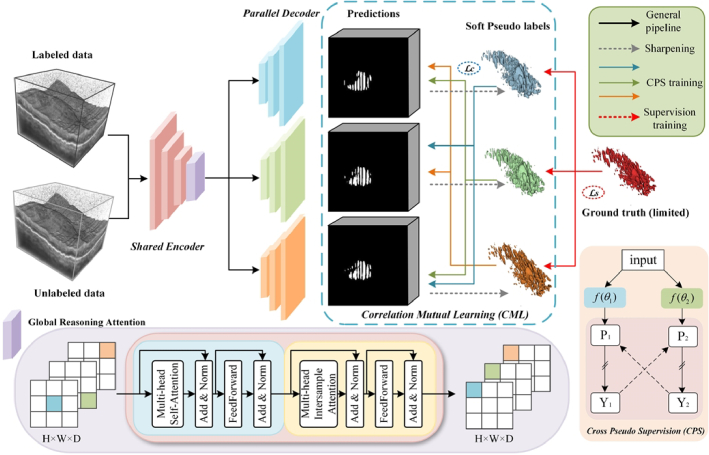
Figure 1 illustrates our framework for semi-supervised retinal lesion segmentation. This framework consists of a shared encoder and three slightly varied decoders, employing the transposed convolutional layer, the linear interpolation layer, and the nearest interpolation layer as up-sampling operations to introduce architectural heterogeneity. The inter-sample correlation attention module is utilized to achieve efficient cross-sample relationship modeling and facilitate information propagation between labeled and unlabeled data. Furthermore, we employ a novel cross-pseudo supervision scheme to take advantage of both the consistency and entropy-minimization constraints for model training, enhancing the regularization of representation learning for the unlabeled data.
Fig. 1.
The pipeline of our proposed model for semi-supervised 3D DME segmentation. The GRA module is incorporated at the end of the shared encoder, while the rest of the segmentation network retains the original VNet [29] structure.
2.2. Global reasoning attention module
The proposed GRA module generates a novel way for information propagation among individual pixels within a sample group, thereby concurrently enhancing the feature representation capacity of each cross-sample group. As shown in Fig. 1, the proposed GRA module consists of two attention blocks, one self-attention (SA) transformer block and one inter-sample attention (IA) transformer block. The self-attention transformer block consists of two sub-layers, the multi-head self-attention (MSA) layer, and the feed-forward (FF) layer, each followed by a residual connection and layer normalization (LN). The inter-sample attention transformer block has a structure similar to the previous self-attention transformer block, with the key difference being that the multi-head self-attention layer is replaced by an inter-sample attention layer. In this block, attention is computed across different samples within a batch, rather than being confined to the features of a single sample. Specifically, when the input data passes through the IA transformer block, it first concatenates the embeddings of each feature for a single data point and then computes attention across samples. This process enhances the representation of the current position by inspecting features from other locations. Additionally, when a feature in a row is missing or noisy, multi-head inter-sample attention enables the GRA module to borrow corresponding features from other similar samples in the batch, thereby improving the accuracy of the data representation. This module is employed to enable computation-efficient correlation attention among all samples. For an input feature map, where , h’, w′, and d’ represent the height, width, and depth of the input data, respectively, b represents the batch size and c is the dimension of x, the pipeline of the GRA module is described by Eq. (1):
| (1) |
where m2 represents the self-attention applied to the spatial dimension of each sample, facilitating the modeling of information propagation paths among all pixel positions within each sample. n2 denotes the inter-sample self-attention across the batch dimension, which enhances information propagation among different samples. Therefore, the GRA module necessitates a mini-batch size greater than 1 to enable the construct of cross-sample relationships by inputting the pixel situated at the same position across samples into a self-attention module.
2.3. Loss function
To optimize the proposed model, a joint loss function is adopted to guide the training process. The total loss function of our model can be defined as follows:
| (2) |
| (3) |
| (4) |
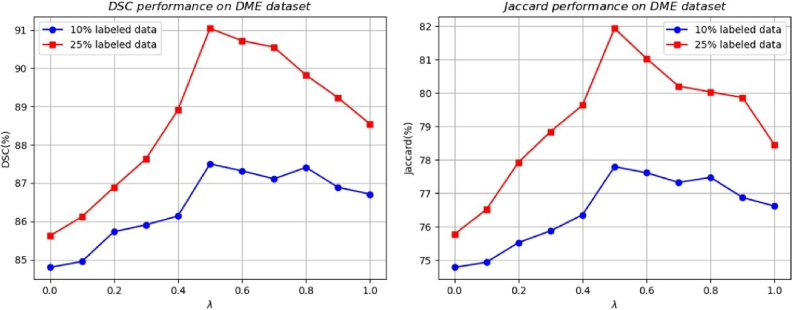
where ypred refers to the prediction generated by the model, and ytrue represents the ground truth segmentation mask, represents the dice loss, serving as the supervised loss to evaluate the quality of the model output on labeled inputs and denotes the mean squared error loss, employed as the cross-supervised consistency loss within the cross-pseudo supervision procedure. We set the optimal cross-supervision weight to 0.5 for all experiments, as this value yielded the best performance of the proposed model. Detailed results are shown in Fig. 5. And the weight coefficient for the loss term is adjusted using a time-dependent Gaussian warming-up function [30]. During the training process, a batch composed of mixed labeled and unlabeled samples is fed into the network. The supervised loss is specifically for labeled data, while all samples are utilized to enable cross-supervised learning.
Fig. 5.
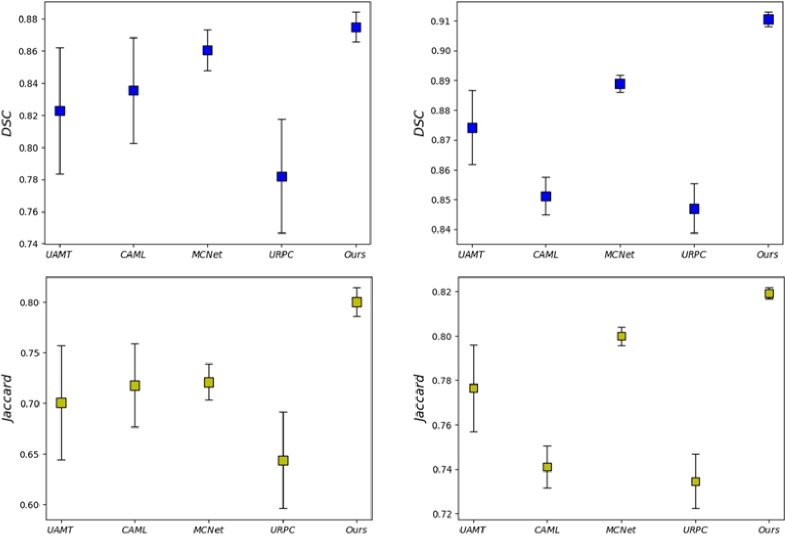
Mean-standard deviation charts of the segmentations result from methods in DSC and Jaccrad. The first and second columns show the model's results after training on 10% labeled data and 25% labeled data respectively.
2.4. Training strategy
Based on such a model design, we adopt a mutual learning paradigm that combines the predictions of three parallel decoders with the corresponding soft pseudo labels. The key GRA module is employed to effectively model cross-sample relationships and enable information propagation among labeled and unlabeled data in a mini-batch. Specifically, we use a sharpening function to convert a prediction into a soft pseudo-label, defined as follows:
| (5) |
where T is a hyperparameter that controls the temperature for sharpening and enforces the entropy minimization constraint to regularize the model.
Inspired by the cross-pseudo supervision [31], we implement mutual learning by aligning the predictions of one decoder with the soft pseudo-labels produced by other decoders, thereby enforcing consistency among the outputs of slightly varied decoders for the same sample. Considering that both the consistency constraint and the entropy minimization constraint enable the model to effectively utilize unlabeled data, we propose a novel mutual consistency training strategy that applies both of these constraints between one decoder’s prediction and other decoder’s soft pseudo labels to train our model in cross pseudo supervision procedure. In this way, the discrepancy of outputs is reduced to guide the model learning and the predictions in these highly hard regions should be consistent.
3. Experiment
3.1. Experiment settings
3.1.1. Datasets
Here we employ the customized volumetric DME datasets for both training and testing. This study included 80 DME patients, excluding those with poor imaging quality due to unclear refractive media, etc., and the dataset ultimately consisted of 60 DME patients (each consisting of 3D volume images (512 × 1044 × 512), a total of 30,702 B-scan images) who were diagnosed at Sichuan Provincial People’s Hospital from February 2022 to September 2023. All participants underwent a comprehensive ocular examination including refraction and best-corrected visual acuity, non-contact intraocular pressure (IOP), ocular axis, slit lamp, wide-angle fundus imaging, and OCT. This study was approved by the Ethics Committee of Sichuan Provincial People’s Hospital and adhered to the Declaration of Helsinki. All participants provided written informed consent after the nature and possible consequences of the study were explained. Data underlying the results presented in this paper will be publicly available at https://tianchi.aliyun.com/dataset/178512.
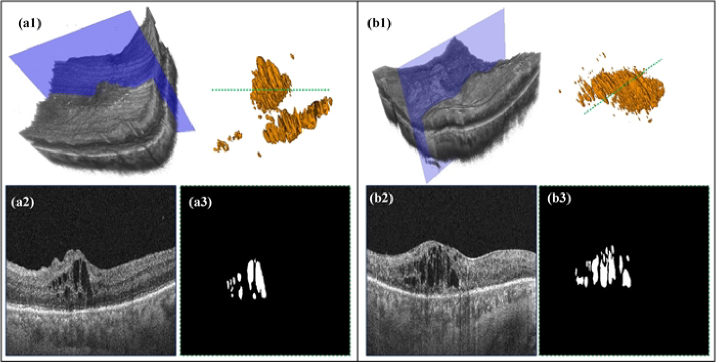
As shown in Fig. 2, (a1) represents the raw 3D data of the DME-related case, along with the corresponding 3D visualization of the annotations. (a2) demonstrates the B-scan image that corresponds to the blue slice of the raw data referenced in (a1). (a3) exhibits the label image corresponding to the green dotted line observed in the 3D visualization of the annotations. Included individuals underwent macular-centered swept OCT (BM-400 K BMizar, TowardPi, Beijing, China) over a range of 6 × 6 mm, which utilized a swept-source vertical-cavity surface-emitting laser with a wavelength of 1060 nm at a rate of 400,000 A-scans per second, providing 10 µm lateral resolution and 3.8 µm axial resolution. There are 512 B-scans within this 6 × 6 mm macular scan range and each B-scan consists of 512 × 1044 pixels. The initial 512 × 1044 pixels images contain a large amount of black background areas, which can introduce unnecessary training workload. Therefore, we first preprocessed all the B-scan images in volumes by cropping out the excess regions that do not contain retinal tissue information, resulting in images of size 512 × 512 pixels. Furthermore, the cropped images are resized to 256 × 256 pixels to obtain a unique field of view then normalized the values between 0 and 1 for model training. Moreover, we extracted 3D patches of size 160 × 160 × 80 voxels using a sliding window strategy. During testing, we reconstructed the final output by averaging the results from these patches. For our experiments, we employed a predetermined data split at the patient level, with the new training, and validation sets comprising 40 and 20 patients’ data, respectively.
Fig. 2.
3D visualization and B-scan samples of the customized DME datasets.
We also adopted the publicly available RETOUCH challenge dataset [32] for DME segmentation. The RETOUCH dataset was collected with three SD-OCT devices: Cirrus HD-OCT (Zeiss Meditec), Spectralis (Heidelberg Engineering), and Topcon, specifically to distinguish retinal fluid. In this study, we conducted validation experiments using the data collected from Cirrus and Spectralis to evaluate our proposed method. The Cirrus dataset consists of 24 volumes, each with dimensions of 512 × 1024 × 128, while the Spectralis dataset contains 24 volumes, each with dimensions of 512 × 496 × 49. For the limited number of 3D OCT images in the open-source RETOUCH dataset and to reliably validate the pre-trained semi-supervised model, we employed an unbiased k-fold cross-validation method to evaluate and generalize the performance of the pre-trained model. The folding was conducted at the subject level to ensure that data was not included in both the training and validation sets during any iteration. The model’s final performance was obtained by averaging the evaluation metrics on validation sets over iterations. All B-scan images underwent the same preprocessing steps as previously described. The only difference is that during training, the patch sizes were adjusted to 208 × 208 × 80 and 208 × 208 × 40, respectively, to ensure consistency with the dimensions of individual volumes in the different datasets.
3.1.2. Implementation details
We implemented the proposed model on Pytorch v1.9.1, CUDA 10.2, and Python 3.9. The training was conducted on a PC with NVIDIA RTX A6000 (48GB) and 64 GB of RAM. SGD was adopted as the optimizer to update the network parameters (initial learning rate = 0.01, momentum = 0.9, weight decay = 0.001). The batch size was set to 4, with each batch consisting of two labeled patches and two unlabeled patches, for a total of 15000 iterations. All experiments follow the identical setting to ensure fair comparisons and we consider the challenging semi-supervised settings to verify our model, where 10% and 25% labels are used and the remaining training data are regarded as unlabeled data.
3.1.3. Evaluation metrics
We employ four classical performance metrics to quantitatively evaluate the obtained segmentation results: Dice similarity coefficient (DSC), Jaccard, 95% Hausdorff Distance (95HD), and Average Surface Distance (ASD). They are calculated by the following equations:
| (6) |
| (7) |
| (8) |
| (9) |
where TP, FP, and FN are true positive, false positive, and false negative for pixel classification, respectively. denotes the directed Hausdorff distance and given by . represents a 3-D matrix consisting of the Euclidean distances between the two volumes X and Y.
3.2. Quantitative evaluation and comparison
As depicted in Fig. 3, our method achieves segmentation results that closely align with manual annotations, both on individual B-scans and throughout the entire three-dimensional volume, even when trained with only 25% annotated data. This suggests the applicability of our proposed approach to DME segmentation in 3D OCT images. Detailed files of 3D segmentation results and corresponding original 3D OCT images of Fig. 3, Fig. 4, Fig. 6, and Fig. 7 can be seen and downloaded from https://tianchi.aliyun.com/dataset/178512.
Fig. 3.
Automatic 3D segmentation results of freestanding individuals from the test dataset using our proposed semi-supervised learning framework. (a1)-(c1) demonstrate that raw 3D OCT data consist of massive B-scans. (a2)-(c2) show the manually annotated 3D results, (a3)-(c3) are the corresponding 3D segmentation results obtained by our method.
Fig. 4.
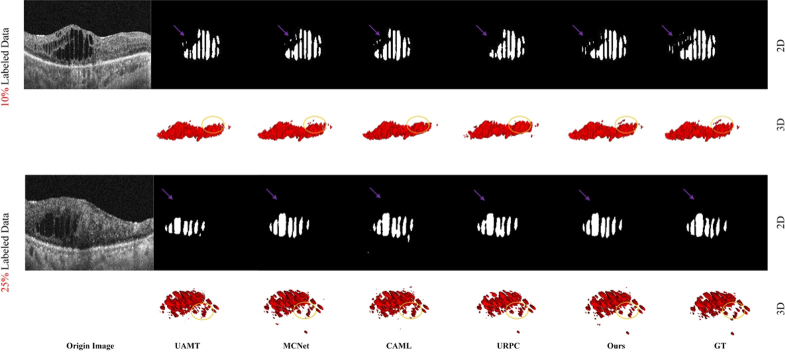
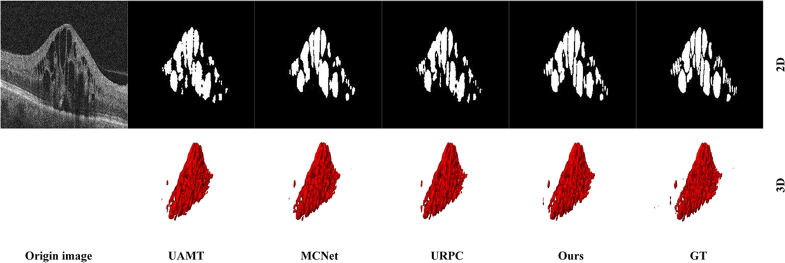
Visualization of the segmentations results from different methods.
Fig. 6.
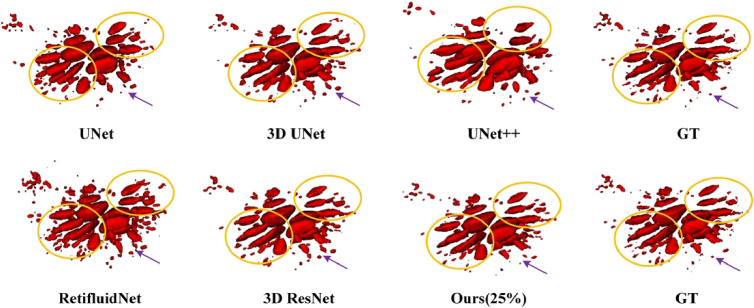
Visualization of the segmentations results from different fully supervised methods. The UNet, 3D UNet, UNet++, and 3D ResNet models are commonly employed for medical image segmentation tasks, while RetiFluidNet is specifically designed for 2D segmentation of retinal fluid. These models typically undergo supervised training utilizing all annotated datasets. In our approach, we adopt VNet as the backbone network and employ only 25% of the annotated data for training purposes.
Fig. 7.
Visualization of the segmentations results from different methods on RETOUCH-Cirrus dataset.
We further conduct a comparative analysis of our proposed method against the recently developed full-supervised 2D and 3D methods for medical image segmentation [10,11,19,33,34], and several state-of-the-art semi-supervised methods such as UAMT [22], MCNet [35], URPC [36] and CAML [37] on DME datasets. To ensure a fair comparison with existing methods, we use the VNet [29] as the backbone for all experiments. The results of our quantitative comparison are presented in Table 1 and Table 2. As shown in Table 1, the results of the full-supervised VNet model trained on different ratios serve as the reference for each ratio setting. The first group displays the performance of the baseline model when trained with 10%, 25%, and all available labeled data. The second group presents the results obtained when training with 10% labeled data and 90% unlabeled data. Finally, the last group shows the results achieved when training with 25% labeled data and 75% unlabeled data.
Table 1. Comparison with state-of-the-art semi-supervised methods on the DME dataset and Metrics reported the mean ± standard results with three random seeds.
| Method | Training | Metrics | ||||
|---|---|---|---|---|---|---|
|
| ||||||
| Labeled | Unlabeled | DSC(%)↑ | Jaccard(%)↑ | 95HD(voxel)↓ | ASD(voxel)↓ | |
|
| ||||||
| V-Net [29] | 4(10%) | 0 | 75.90 ± 6.13 | 61.36 ± 6.41 | 7.81 ± 5.51 | 2.87 ± 1.89 |
| V-Net [29] | 10(25%) | 0 | 83.13 ± 4.42 | 70.79 ± 5.29 | 5.34 ± 3.44 | 1.54 ± 1.21 |
| V-Net [29] | 40(All) | 0 | 88.23 ± 0.87 | 78.65 ± 1.24 | 1.86 ± 0.32 | 0.82 ± 0.43 |
|
| ||||||
| UAMT [22] | 4(10%) | 36(90%) | 82.28 ± 3.92 | 70.08 ± 5.67 | 5.69 ± 3.96 | 2.07 ± 1.62 |
| CAML [37] | 83.54 ± 3.31 | 71.77 ± 4.13 | 4.65 ± 1.72 | 1.53 ± 1.13 | ||
| MCNet [35] | 86.06 ± 1.28 | 72.10 ± 1.79 | 3.21 ± 1.79 | 0.89 ± 0.26 | ||
| URPC [36] | 78.21 ± 3.56 | 64.36 ± 4.80 | 5.90 ± 0.80 | 1.17 ± 0.77 | ||
| Ours | 87.50 ± 0.91 | 77.79 ± 1.43 | 2.77 ± 1.35 | 0.79 ± 0.38 | ||
|
| ||||||
| UAMT [22] | 10(25%) | 30(75%) | 87.42 ± 1.24 | 77.67 ± 1.95 | 2.21 ± 0.79 | 0.80 ± 0.39 |
| CAML [37] | 85.12 ± 0.63 | 74.10 ± 0.95 | 2.81 ± 0.36 | 0.80 ± 0.36 | ||
| MCNet [35] | 88.88 ± 0.29 | 79.99 ± 0.41 | 1.71 ± 0.29 | 0.67 ± 0.29 | ||
| URPC [36] | 84.70 ± 0.83 | 73.47 ± 1.24 | 3.50 ± 0.50 | 0.73 ± 0.26 | ||
| Ours | 91.04 ± 0.24 | 81.93 ± 0.24 | 1.38 ± 0.29 | 0.56 ± 0.27 | ||
Table 2. Comparison with state-of-the-art 2D and 3D methods on DME dataset.
| Methods | Metrics | |||
|---|---|---|---|---|
| DSC(%)↑ | Jaccard(%) | 95HD | ASD | |
| UNet [10] (2D) | 78.05 ± 6.42 | 64.46 ± 8.84 | 3.61 ± 1.13 | 1.01 ± 0.52 |
| UNet [33] (3D) | 88.04 ± 1.54 | 78.68 ± 2.47 | 1.82 ± 0.61 | 0.62 ± 0.28 |
| ResNet34[34] (3D) | 89.51 ± 0.78 | 79.33 ± 1.51 | 1.41 ± 0.44 | 0.63 ± 0.32 |
| UNet++[11] (2D) | 81.46 ± 6.37 | 69.84 ± 4.12 | 2.03 ± 0.81 | 0.98 ± 0.51 |
| RetifluidNet [19] (2D) | 82.07 ± 4.07 | 69.79 ± 5.89 | 2.24 ± 0.85 | 0.96 ± 0.44 |
| UNERT [27] (3D) | 85.79 ± 2.81 | 73.22 ± 3.82 | 1.97 ± 0.81 | 0.78 ± 0.42 |
| Swin UNETR [28] (3D) | 87.14 ± 1.96 | 75.92 ± 3.05 | 1.88 ± 0.75 | 0.67 ± 0.36 |
| Ours | 91.04 ± 0.24 | 81.93 ± 0.24 | 1.38 ± 0.29 | 0.56 ± 0.27 |
The quantitative comparisons between our proposed model and the other SOTA semi-supervised methods on the DME dataset are presented in Table 1. It is evident from Table 1 that our method demonstrates the effective transfer of knowledge between labeled and unlabeled data to enhance segmentation performance. When trained with 10% labeled data, the proposed model achieves impressive improvement in all four metrics, i.e., DSC improves from 75.90% to 87.50%, Jaccard boots from 61.36% to 77.79%, 95HD drops from 7.81 to 2.77, ASD drops from 2.87 to 0.79 in comparison to the baseline model. A similar situation occurs when only 25% of the labeled data is used for training. Specifically, our method outperforms other SOTA methods when trained with only 25% labeled data, with DSC, Jaccard, 95HD, and ASD values of 89.03%, 80.23%, 1.71 and 0.65, respectively. Furthermore, as illustrated in Fig. 4, it presents 2D and 3D visualizations of all the compared methods and the corresponding ground truth. We can easily find that the segmentation results of our method are closer to the ground truth. In particular, our approach preserves more fine details and boundary information of the lesions. Table 1 and Fig. 5 also suggest the effectiveness and robustness of our proposed model.
To showcase the effectiveness of our method, we performed quantitative experiments involving various 2D and 3D approaches. As shown in Table 2, our model trained with only 25% labeled data has achieved superior performance across all four metrics. For instance, when compared to the 3D UNet, our method demonstrates a 3.0% improvement for the DSC metric. Specifically, compared with the RetifluidNet, the proposed model still maintains an 8.97% improvement in the DSC. In contrast to 2D methods, 3D methods encompass a more comprehensive consideration of spatial features, thereby achieving superior performance in segmentation tasks. As illustrated in Fig. 6, the proposed model obtains higher segmentation performance, especially when segmenting small-sized targets. Another readily discernible result from Fig. 6 is that 2D methods often erroneously segment numerous non-lesion areas, whereas 3D methods alleviate this condition to a certain extent. By learning the inter-sample correlation and leveraging such correlation to effectively exploit the unlabeled data, our method shows significant improvements over previous methods.
To further validate the applicability of our proposed method, we compare it with the other existing methods on the RETOUCH dataset. As shown in Table 3, our model achieves the best DSC for DME segmentation, with values of 90.13% for the Cirrus dataset and 89.94% for the Spectralis dataset. Compared to RetifluidNet, our model demonstrates significant improvements of 6.42% in DSC and 8.60% in Jaccard. Additionally, when compared to the 3D ResNet34, our model shows notable enhancements of 3.40% in DSC and 6.87% in Jaccard. Even under identical training conditions, our proposed model outperforms the leading MCNet method by 2.17% in DSC. The experimental results show that the proposed model can significantly improve the DME segmentation performance by leveraging the consistency between labeled and unlabeled data. However, the use of three decoders and the need for attention calculations across all samples lead to a corresponding increase in both the number of parameters and computational complexity. Moreover, As shown in Fig. 7, we present the 2D and 3D segmentation results of several well-performing methods on the A dataset. While most methods can accurately capture the overall shape of the lesions, our approach notably excels in preserving edge details. Table 3 and Fig. 7 also further confirm the effectiveness and robustness of our proposed model.
Table 3. Comparison with SOTA 2D and 3D methods on RETOUCH Cirrus and Spectralis dataset with the 3-fold cross-validation method.
| Network | Scanner | Complexity | |||
|---|---|---|---|---|---|
|
| |||||
| Cirrus | Spectralis | ||||
|
| |||||
| Full-supervised | DSC(%)↑ | Jaccard(%)↑ | DSC(%)↑ | Jaccard(%)↑ | Parameters |
| UNet [10] | 73.24 ± 7.65 | 63.38 ± 6.03 | 72.75 ± 8.91 | 63.25 ± 6.57 | 5.71 M |
| UNet++[11] | 77.51 ± 6.01 | 67.04 ± 5.80 | 79.54 ± 5.46 | 68.14 ± 5.73 | 9.04 M |
| MsTGANet [18] | 78.84 ± 5.59 | 67.31 ± 5.72 | 81.32 ± 4.17 | 70.29 ± 4.81 | 11.61 M |
| RetifluidNet [19] | 83.27 ± 4.63 | 73.07 ± 3.43 | 83.16 ± 3.85 | 72.88 ± 3.60 | 34.27 M |
| UNet(3D) [33] | 84.87 ± 4.75 | 73.70 ± 3.22 | 82.84 ± 4.13 | 72.59 ± 3.86 | 12.94 M |
| ResNet34(3D) [34] | 87.32 ± 2.74 | 74.69 ± 2.87 | 85.04 ± 3.76 | 73.80 ± 3.14 | 17.93 M |
|
| |||||
| Semi-supervised (23%) | |||||
|
| |||||
| UAMT [22] | 83.15 ± 4.83 | 72.07 ± 3.81 | 77.68 ± 6.20 | 64.33 ± 5.97 | 9.44 M |
| URPC [36] | 83.76 ± 4.09 | 72.61 ± 3.56 | 77.15 ± 6.31 | 63.42 ± 6.04 | 5.89 M |
| MCNet [35] | 87.24 ± 2.81 | 77.70 ± 2.33 | 85.33 ± 3.52 | 74.16 ± 3.03 | 12.35 M |
| CAML [37] | 85.34 ± 3.67 | 76.02 ± 2.54 | 81.04 ± 4.68 | 72.09 ± 4.18 | 20.13 M |
| Ours | 89.83 ± 2.04 | 81.36 ± 1.41 | 88.54 ± 2.73 | 79.57 ± 2.45 | 15.64 M |
4. Discussion
4.1. Ablation study
Here we conduct an ablation study on the 3D DME dataset to investigate the effectiveness of each component and analyze the influence of the proposed GRA module and our semi-supervised training strategy. The V-Net model was adopted as our baseline model. As shown in Table 4, both the GRA module and customized CML scheme significantly improve the performance of the baseline trained with 10% labeled data. When trained with 10% labeled data, our model achieves an absolute improvement of 11.6% in DSC by combining these two designs. Under a labeled data ratio of 25%, the baseline performance is improved to 91.04% in DSC, which is approximately comparable to the fully-supervised model. When these two designs are individually integrated into the baseline model, there is an improvement in all segmentation metrics. These results support the effectiveness of our methods, demonstrating that incorporating the GRA module and CML scheme enhances the model’s performance during training.
Table 4. Ablation study of our proposed GRA module and CML training strategy on the DME dataset.
| Training | Designs | Metrics | |||||
|---|---|---|---|---|---|---|---|
|
| |||||||
| Labeled | Unlabeled | GRA | CML | DSC(%)↑ | Jaccard(%)↑ | 95HD(voxel)↓ | ASD(voxel)↓ |
|
| |||||||
| 4(10%) | 36(90%) | 75.90 ± 6.13 | 61.36 ± 6.41 | 7.81 ± 5.51 | 2.87 ± 1.89 | ||
| √ | 83.64 ± 3.22 | 72.45 ± 3.43 | 4.56 ± 1.57 | 1.55 ± 1.32 | |||
| √ | 86.36 ± 1.24 | 75.80 ± 1.69 | 2.41 ± 0.83 | 0.93 ± 0.34 | |||
| √ | √ | 87.50 ± 0.91 | 77.79 ± 1.43 | 2.77 ± 1.35 | 0.79 ± 0.38 | ||
|
| |||||||
| 10(25%) | 30(75%) | 83.13 ± 4.42 | 70.79 ± 5.29 | 5.34 ± 3.44 | 1.54 ± 1.21 | ||
| √ | 85.62 ± 1.53 | 74.78 ± 1.86 | 2.67 ± 0.35 | 0.79 ± 0.37 | |||
| √ | 88.36 ± 1.41 | 79.29 ± 1.53 | 1.74 ± 0.32 | 0.68 ± 0.29 | |||
| √ | √ | 91.04 ± 0.24 | 81.93 ± 0.24 | 1.38 ± 0.29 | 0.56 ± 0.27 | ||
Moreover, we conducted a parameter sensitivity analysis to investigate the impact of parameter on balancing the two losses and the number n of decoders. As Fig. 8 shows, to reliably validate the pre-trained semi-supervised model, we consistently used VNet + CML + GRA as the baseline network and tested it on the DME dataset with 10% and 25% labeled data. It can be seen that a smaller would decrease the performance, as the three decoders may produce inaccurate results due to insufficient labeled data for training. Conversely, a lager fails to apply adequate mutual consistency constraints, resulting in suboptimal performance. Therefore, we set the loss weight as 0.5 to balance the two losses in this study. It can be seen in Fig. 9, that adding more decoders improves performance, though the gains diminish as n increases. Since the labeled data is limited, models may generate incorrect predictions but with high confidence. Here we use three decoders to achieve a balance between effectiveness and efficiency. With a larger labeled dataset, our model with a more diverse set of decoders could further improve performance in 3D retinal fluid segmentation.
Fig. 8.
Result under different loss weight on the DME dataset.
Fig. 9.
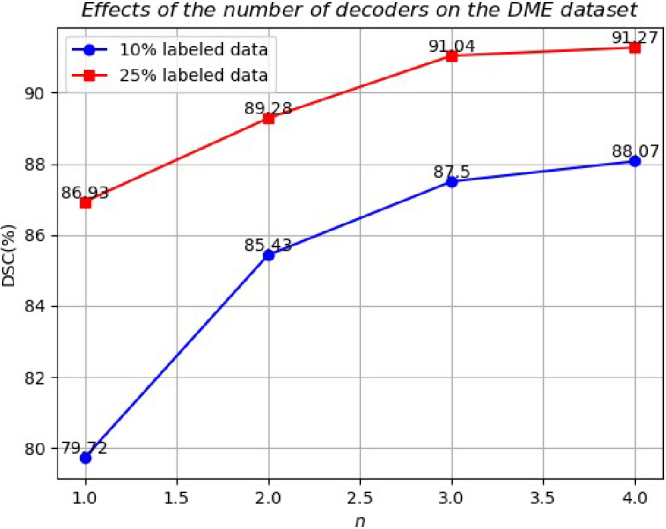
Effects of the number of decoders on the DME dataset.
To further validate the efficacy of our proposed semi-supervised learning framework, we conducted comparative experiments using various backbone networks. As depicted in Table 5, we initially assessed the performance of these backbone networks under fully supervised training. Subsequently, after implementing our proposed CML training strategy and integrating the GRA module into these base networks, it was noted that, in comparison to their original configurations, they achieved segmentation performance comparable to those results under fully supervised training, despite utilizing only 25% of labeled data. As shown in Table 5 compared with ResNet34, the performance of the proposed framework (ResNet34 + CML + GRA) has been improved significantly. The average DSC, Jaccard, 95HD, and ASD have been improved from 89.51%, 79.33%, 1.41, and 0.63 to 91.37%, 82.57%, 1.35 and 0.49, respectively. The experiment results demonstrate that the proposed semi-supervised learning framework can adeptly leverage the feature information within limited labeled data, consequently improving the DME segmentation accuracy in OCT volumetric images.
Table 5. Evaluation indices for the proposed semi-supervised learning framework with CNN-based methods on the DME dataset.
| Network | Metrics | |||
|---|---|---|---|---|
|
| ||||
| Full-supervised | DSC(%)↑ | Jaccard(%)↑ | 95HD(voxel)↓ | ASD(voxel)↓ |
| VNet [29] | 88.23 ± 0.87 | 78.65 ± 1.24 | 1.86 ± 0.32 | 0.82 ± 0.43 |
| UNet [33] | 88.04 ± 1.54 | 78.68 ± 2.47 | 1.82 ± 0.61 | 0.62 ± 0.28 |
| ResNet34[34] | 89.51 ± 0.78 | 79.33 ± 1.51 | 1.41 ± 0.44 | 0.63 ± 0.32 |
|
| ||||
| Semi-supervised (25%) | ||||
|
| ||||
| VNet + CML | 88.36 ± 1.41 | 79.29 ± 1.53 | 1.74 ± 0.32 | 0.68 ± 0.29 |
| UNet + CML | 88.10 ± 3.77 | 78.93 ± 5.96 | 2.33 ± 1.60 | 0.62 ± 0.40 |
| ResNet34 + CML | 89.41 ± 1.14 | 80.87 ± 1.88 | 1.47 ± 0.41 | 0.56 ± 0.31 |
| VNet + CML + GRA | 91.04 ± 0.24 | 81.93 ± 0.24 | 1.38 ± 0.29 | 0.56 ± 0.27 |
| UNet + CML + GRA | 90.28 ± 0.55 | 80.31 ± 0.47 | 1.48 ± 0.56 | 0.63 ± 0.37 |
| ResNet34 + CML + GRA | 91.37 ± 0.24 | 82.57 ± 0.22 | 1.35 ± 0.27 | 0.49 ± 0.22 |
4.2. Clinical analysis
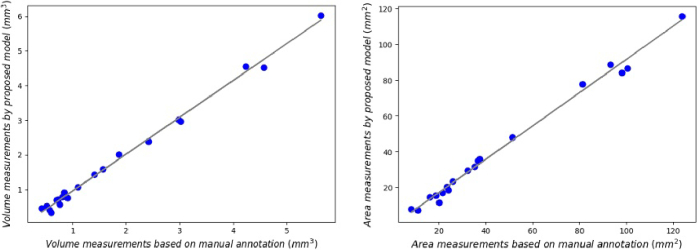
Morphological fluid features such as volume of fluid and retinal thickness can be used to evaluate the therapy for DME patients precisely [38]. Therefore, we conducted quantitative experiments on 21 freestanding individuals by measuring the volume and surface area of the lesions and analyzing the consistency as a way to validate the effectiveness of our proposed method. The results can be seen in Table 6 and Fig. 10, followed by conducting Pearson correlation analysis on the measurement results. As illustrated in Fig. 9, the left and right panels depict the volume and surface area measurement results of the segmentation by the proposed method trained with 25% labeled data and manual annotation, respectively. Figure 9 shows a significant correlation between the measurements of DME volume (r = 0.99756, p < 0.0001), as do the results in surface area (r = 0.99602, p < 0.0001). The model demonstrates strong performance in both volume and surface area metrics, showcasing its significant clinical utility for the diagnosis and monitoring of DME progression.
Table 6. Statistics Measurements of Volume and Surface Area on 21 sets of DME cases a .
| Metrics | Case 1 | Case 2 | Case 3 | Case 4 | Case 5 | Case 6 | Case 7 | |
|---|---|---|---|---|---|---|---|---|
| GT | Volume(mm3) | 3.0194399 | 5.63872862 | 0.73190832 | 1.8628521 | 0.5655942 | 0.51876926 | 0.42110252 |
| Area(mm2) | 98.037598 | 123.818115 | 23.5513916 | 51.5115967 | 11.1324463 | 21.5749512 | 8.38696289 | |
| Pred | Volume(mm3) | 2.965471745 | 6.02392387 | 0.71835136 | 2.01902103 | 0.42227411 | 0.52924919 | 0.45982933 |
| Area(mm2) | 83.9981689 | 115.705811 | 20.4818115 | 48.0476074 | 7.22900391 | 16.994751 | 8.06726074 | |
|
| ||||||||
| Case 8 | Case 9 | Case 10 | Case 11 | Case 12 | Case 13 | Case 14 | ||
|
| ||||||||
| GT | Volume(mm3) | 2.41632 | 4.23315 | 1.095873 | 2.974581 | 0.90495 | 0.8153577 | 0.846192 |
| Area(mm2) | 81.3469 | 93.13916 | 35.32709 | 51.5115967 | 18.79211 | 32.365224 | 25.968361 | |
| Pred | Volume(mm3) | 2.38911 | 4.54921 | 1.077531 | 3.0185132 | 0.7656483 | 0.795324 | 0.912475 |
| Area(mm2) | 77.83457 | 88.77524 | 31.72274 | 48.0476074 | 15.614604 | 29.452115 | 23.289135 | |
|
| ||||||||
| Case 15 | Case 16 | Case 17 | Case 18 | Case 19 | Case 20 | Case 21 | ||
|
| ||||||||
| GT | Volume(mm3) | 0.69959307 | 0.59419582 | 4.57061291 | 1.399871 | 0.7584242 | 1.5714597 | 1.7123652 |
| Area(mm2) | 16.2982178 | 20.0994873 | 100.50293 | 36.7984516 | 24.213739 | 37.515061 | 48.652231 | |
| Pred | Volume(mm3) | 0.70200062 | 0.34435701 | 4.52811384 | 1.431247 | 0.5709712 | 1.5839849 | 1.7581273 |
| Area(mm2) | 14.6854248 | 11.638916 | 86.4206543 | 34.80454 | 18.608472 | 35.7929553 | 49.086125 | |
GT stands for the ground truth. Pred represents the predictions generated by the proposed semi-supervised model.
Fig. 10.
Statistical analysis of DME volume and surface area measurements across 20 different cases.
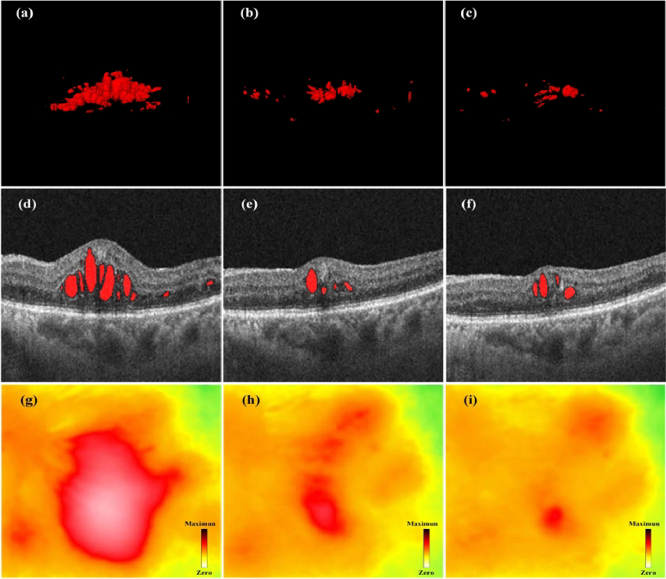
To further assess the feasibility of our approach in clinical practice, we conducted longitudinal monitoring and treatment experiments on multiple DME patients. As illustrated in Fig. 11, the retinal macular condition of the DME patient is presented before treatment, after the first intravitreal injection treatment, and following the second intravitreal injection treatment from left to right. It can be seen in Fig. 11(a) and (g) that the patient has significant abnormalities in lesion volume and central macular thickness (CMT) before initial treatment. At this point, the patient's CMT was measured to be 646 µm, and patients with CMT measured as ≥ 300 µm may undergo intravitreal anti-VEGF or steroid injections [39], [40]. To further demonstrate the effectiveness of treatment, B-scan images corresponding to the same scanning positions for this patient are presented in the second row of Fig. 11. Figure 11(g)–10(i) show the CMT heatmap for the three stages. The green and yellow parts represent the thicknesses at normal and critical values, respectively. The red part indicates the thickness exceeding the normal range; the redder the color, the thicker the thickness. One month after receiving the first treatment, the patient’s CMT dropped significantly to 409 µm (see Fig. 11(h)). Further diagnosis two months later showed the patient’s CMT had decreased to 386 µm (see Fig. 11(i)). Meanwhile, as shown in Fig. 11(a)-(c), the volume of DME lesions was significantly reduced after treatment. This patient had a significant CMT abnormality before treatment and the situation improved after treatment, which is consistent with the segmentation results of our method.
Fig. 11.
Condition monitoring of a patient with DME at different stages of treatment. (a), (b) and (c) are 3D visualization results of the DME lesions before, during, and after treatment, respectively. (d), (e) and (f) are corresponding B-scan images. (g), (h) and (i) are corresponding macular thickness heatmaps of (a), (b) and (c).
The above experiment demonstrates that the alterations in fundus conditions of patients with DME can be accurately and visually represented through the 3D segmentation results. Moreover, the 3D segmentation results align with the diagnostic findings obtained through existing clinical diagnostic methods. This approach can additionally offer comprehensive information regarding DME, thereby facilitating convenient diagnosis and monitoring of therapeutic efficacy. Furthermore, it enhances the acceptance and recognition of diagnostic outcomes among clinical patients. The 3D segmentation results of DME lesions also assist ophthalmologists in effectively communicating with patients by providing them with more visualized information.
5. Conclusion
In this study, we propose a novel mutual learning framework that leverages limited labeled data to guide the extraction of features from unlabeled data for semi-supervised 3D segmentation on 3D retinal OCT images. This framework consists of a shared encoder and three slightly varied decoders, employing the transposed convolutional layer, the linear interpolation layer, and the nearest interpolation layer as up-sampling operations to introduce architectural heterogeneity. We introduce the GRA module to establish inter-sample relationships directly and improve the 3D segmentation performance. The model design with three slightly different decoders is used to indicate highly hard regions and a new mutual consistency constraint for customized correlation mutual learning training strategy between the decoders’ outputs and corresponding soft pseudo labels. Extension experiments on the customized DME dataset and the public RETOUCH dataset have demonstrated that our model has achieved state-of-the-art performance compared with various semi-supervised and fully supervised methods. We have also conducted long-term clinical follow-up trials involving patients with DME, the results exhibit commendable 3D segmentation performance of our proposed method, potentially enhancing the comprehension of DME diseases and offering significant convenience for clinical diagnosis and treatment.
In our future works, we will explore domain adaptation algorithms to further improve the performance and generalization of the model. This is because there exists a certain variability in the distribution of images captured by different OCT scanning devices, and a model trained on a single dataset may not exhibit consistent excellent performance when working on out-of-domain test data.
Funding
National Natural Science Foundation of China10.13039/501100001809 (61905036); China Postdoctoral Science Foundation10.13039/501100002858 (2021T140090, 2019M663465); Medico-Engineering Cooperation Funds from University of Electronic Science and Technology of China (ZYGX2021YGCX019); Fundamental Research Funds for the Central Universities10.13039/501100012226 (ZYGX2021J012); Key Research and Development Project of Sichuan Provincial Health Commission (ZH2024-201).
Disclosures
The authors declare no conflicts of interest.
Data availability
Data underlying the results presented in this paper are not publicly available at this time but may be obtained from the authors upon reasonable request.
References
- 1.Musat O., Cernat C., Labib M., et al. , “Diabetic mancular edema,” Rom. J. Ophthalmol 59, 133–136 (2015). [PMC free article] [PubMed] [Google Scholar]
- 2.Lim L. S., Mitchell P., Seddon J. M., et al. , “Age-related macular degeneration,” Lancet 379(9827), 1728–1738 (2012). 10.1016/S0140-6736(12)60282-7 [DOI] [PubMed] [Google Scholar]
- 3.Ciulla T. A., Amador A. G., Zinman B., “Diabetic retinopathy and diabetic macular edema: pathophysiology, screening, and novel therapies,” Diabetes Care 26(9), 2653–2664 (2003). 10.2337/diacare.26.9.2653 [DOI] [PubMed] [Google Scholar]
- 4.Das A., McGuire P. G., Rangasamy S., “Diabetic Macular Edema: Pathophysiology and Novel Therapeutic Targets,” Ophthalmology 122(7), 1375–1394 (2015). 10.1016/j.ophtha.2015.03.024 [DOI] [PubMed] [Google Scholar]
- 5.Ni G., Zhong J., Gao X., et al. , “Three-dimensional morphological revealing of human placental villi with common obstetric complications via optical coherence tomography,” Bioeng. Transl. Med. 8(1), e10372 (2023). 10.1002/btm2.10372 [DOI] [PMC free article] [PubMed] [Google Scholar]
- 6.Ni G., Wu R., Zheng F., et al. , “Toward Ground-Truth Optical Coherence Tomography via Three-Dimensional Unsupervised Deep Learning Processing and Data,” IEEE Trans. Med. Imag. 43(6), 2395–2407 (2024). 10.1109/TMI.2024.3363416 [DOI] [PubMed] [Google Scholar]
- 7.Lu D., Heisler M., Lee S., et al. , “Deep-learning based multiclass retinal fluid segmentation and detection in optical coherence tomography images using a fully convolutional neural network,” Med. Image Anal. 54, 100–110 (2019). 10.1016/j.media.2019.02.011 [DOI] [PubMed] [Google Scholar]
- 8.Mahapatra D., Bozorgtabar B., Shao L., “Pathological retinal region segmentation from oct images using geometric relation based augmentation,” Proc. IEEE/CVF Conf. Comput. Vis. Pattern Recognit. (CVPR), 9611–9620 (2020). [Google Scholar]
- 9.Li F., Wang Y., Xu T., et al. , “Deep learning-based automated detection for diabetic retinopathy and diabetic macular oedema in retinal fundus photographs,” Eye 36(7), 1433–1441 (2022). 10.1038/s41433-021-01552-8 [DOI] [PMC free article] [PubMed] [Google Scholar]
- 10.Ronneberger O., Fischer P., Brox T., “U-Net: Convolutional Networks for Biomedical Image Segmentation,” in Med. Image Comput. Computer-Assisted Interv. – MICCAI , Navab N., Hornegger J., Wells W. M., Frangi A. F., eds. (Springer International Publishing, Cham, 2015), pp. 234–241. [Google Scholar]
- 11.Zhou Z., Siddiquee M. M. R., Tajbakhsh N., et al. , “UNet++: Redesigning Skip Connections to Exploit Multiscale Features in Image Segmentation,” IEEE Trans. Med. Imaging 39(6), 1856–1867 (2020). 10.1109/TMI.2019.2959609 [DOI] [PMC free article] [PubMed] [Google Scholar]
- 12.Zhang H., Yang J., Zheng C., et al. , “Annotation-efficient learning for OCT segmentation,” Biomed. Opt. Express 14(7), 3294–3307 (2023). 10.1364/BOE.486276 [DOI] [PMC free article] [PubMed] [Google Scholar]
- 13.Tan Y., Shen W. D., Wu M. Y., et al. , “Retinal Layer Segmentation in OCT Images With Boundary Regression and Feature Polarization,” IEEE Trans. Med. Imaging 43(2), 686–700 (2024). 10.1109/TMI.2023.3317072 [DOI] [PubMed] [Google Scholar]
- 14.Roy A. G., Conjeti S., Karri S. P. K., et al. , “ReLayNet: retinal layer and fluid segmentation of macular optical coherence tomography using fully convolutional networks,” Biomed. Opt. Express 8(8), 3627–3642 (2017). 10.1364/BOE.8.003627 [DOI] [PMC free article] [PubMed] [Google Scholar]
- 15.Li M., Shen Y., Wu R., et al. , “High-accuracy 3D segmentation of wet age-related macular degeneration via multi-scale and cross-channel feature extraction and channel attention,” Biomed. Opt. Express 15(2), 1115–1131 (2024). 10.1364/BOE.513619 [DOI] [PMC free article] [PubMed] [Google Scholar]
- 16.Xing G., Chen L., Wang H., et al. , “Multi-Scale Pathological Fluid Segmentation in OCT With a Novel Curvature Loss in Convolutional Neural Network,” IEEE Trans. Med. Imaging 41(6), 1547–1559 (2022). 10.1109/TMI.2022.3142048 [DOI] [PubMed] [Google Scholar]
- 17.Yang Z., Farsiu S., “Directional connectivity-based segmentation of medical images,” Proc. IEEE/CVF Conf. Comput. Vis. Pattern Recognit. (CVPR), 11525–11535 (2023). [DOI] [PMC free article] [PubMed] [Google Scholar]
- 18.Wang M., Zhu W., Shi F., et al. , “MsTGANet: Automatic Drusen Segmentation From Retinal OCT Images,” IEEE Trans. Med. Imaging 41(2), 394–406 (2022). 10.1109/TMI.2021.3112716 [DOI] [PubMed] [Google Scholar]
- 19.Rasti R., Biglari A., Rezapourian M., et al. , “RetiFluidNet: A Self-Adaptive and Multi-Attention Deep Convolutional Network for Retinal OCT Fluid Segmentation,” IEEE Trans. Med. Imaging 42(5), 1413–1423 (2023). 10.1109/TMI.2022.3228285 [DOI] [PubMed] [Google Scholar]
- 20.Wu Y., Ge Z., Zhang D., et al. , “Mutual consistency learning for semi-supervised medical image segmentation,” Med. Image Anal. 81, 102530 (2022). 10.1016/j.media.2022.102530 [DOI] [PubMed] [Google Scholar]
- 21.Xia Y., Yang D., Yu Z., et al. , “Uncertainty-aware multi-view co-training for semi-supervised medical image segmentation and domain adaptation,” Med. Image Anal. 65, 101766 (2020). 10.1016/j.media.2020.101766 [DOI] [PubMed] [Google Scholar]
- 22.Yu L., Wang S., Li X., et al. , “Uncertainty-Aware Self-ensembling Model for Semi-supervised 3D Left Atrium Segmentation,” in Med. Image Comput. Computer-Assisted Interv. – MICCAI , Shen D., Liu T., Peters T. M., Staib L. H., Essert C., Zhou S., Yap P.-T., Khan A., eds. (Springer International Publishing, Cham, 2019), pp. 605–613. [Google Scholar]
- 23.Su J., Luo Z., Lian S., et al. , “Mutual learning with reliable pseudo label for semi-supervised medical image segmentation,” Med. Image Anal. 94, 103111 (2024). 10.1016/j.media.2024.103111 [DOI] [PubMed] [Google Scholar]
- 24.Wang Y., Xiao B., Bi X., et al. , “Mcf: Mutual correction framework for semi-supervised medical image segmentation,” in Proc. IEEE/CVF Conf. Comput. Vis. Pattern Recognit. (CVPR), (2023), pp. 15651–15660. [Google Scholar]
- 25.Li X., Niu S., Gao X., et al. , “Self-training adversarial learning for cross-domain retinal OCT fluid segmentation,” Comput. Biol. Med. 155, 106650 (2023). 10.1016/j.compbiomed.2023.106650 [DOI] [PubMed] [Google Scholar]
- 26.Xiang D., Yan S., Guan Y., et al. , “Semi-Supervised Dual Stream Segmentation Network for Fundus Lesion Segmentation,” IEEE Trans. Med. Imaging 42(3), 713–725 (2023). 10.1109/TMI.2022.3215580 [DOI] [PubMed] [Google Scholar]
- 27.Hatamizadeh A., Tang Y., Nath V., et al. , “UNETR: Transformers for 3D Medical Image Segmentation,” in IEEE/CVF Winter Conference on Applications of Computer Vision (WACV), (2022), 1748–1758. [Google Scholar]
- 28.Tang Y., Yang D., Li W., et al. , “Self-Supervised Pre-Training of Swin Transformers for 3D Medical Image Analysis,” in Proc. IEEE/CVF Conf. Comput. Vis. Pattern Recognit. (CVPR), (2022), 20698–20708. [Google Scholar]
- 29.Milletari F., Navab N., Ahmadi S. A., “V-Net: Fully Convolutional Neural Networks for Volumetric Medical Image Segmentation,” in Int. Conf. 3D Vis. (3DV), (2016), pp. 565–571. [Google Scholar]
- 30.Laine S., Aila T., “Temporal ensembling for semi-supervised learning,” arXiv, (2016). 10.48550/arXiv.1610.02242 [DOI]
- 31.Chen X., Yuan Y., Zeng G., et al. , “Semi-supervised semantic segmentation with cross pseudo supervision,” in Proc. IEEE/CVF Conf. Comput. Vis. Pattern Recognit. (CVPR), (2021), pp. 2613–2622. [Google Scholar]
- 32.Bogunović H., Venhuizen F., Klimscha S., et al. , “RETOUCH: The Retinal OCT Fluid Detection and Segmentation Benchmark and Challenge,” IEEE Trans. Med. Imaging 38(8), 1858–1874 (2019). 10.1109/TMI.2019.2901398 [DOI] [PubMed] [Google Scholar]
- 33.Çiçek Ö., Abdulkadir A., Lienkamp S. S., et al. , “3D U-Net: Learning Dense Volumetric Segmentation from Sparse Annotation,” in Med. Image Comput. Computer-Assisted Interv. – MICCAI , Ourselin S., Joskowicz L., Sabuncu M. R., Unal G., Wells W., eds. (Springer International Publishing, Cham, 2016), pp. 424–432. [Google Scholar]
- 34.He K., Zhang X., Ren S., et al. , “Deep residual learning for image recognition,” in Proc. IEEE/CVF Conf. Comput. Vis. Pattern Recognit. (CVPR), (2016), pp. 770–778. [Google Scholar]
- 35.Wu Y., Xu M., Ge Z., et al. , “Semi-supervised Left Atrium Segmentation with Mutual Consistency Training,” in Med. Image Comput. Computer-Assisted Interv. – MICCAI, (Springer International Publishing, 2021), 297–306. [Google Scholar]
- 36.Luo X., Wang G., Liao W., et al. , “Semi-supervised medical image segmentation via uncertainty rectified pyramid consistency,” Med. Image Anal. 80, 102517 (2022). 10.1016/j.media.2022.102517 [DOI] [PubMed] [Google Scholar]
- 37.Gao S., Zhang Z., Ma J., et al. , “Correlation-Aware Mutual Learning for Semi-supervised Medical Image Segmentation,” in Med. Imag. Comput. Computer-Assisted Intervent. – MICCAI , Greenspan H., Madabhushi A., Mousavi P., Salcudean S., Duncan J., Syeda-Mahmood T., Taylor R., eds. (Springer Nature Switzerland, Cham, 2023), pp. 98–108. [Google Scholar]
- 38.Gerendas B. S., Prager S., Deak G., et al. , “Predictive imaging biomarkers relevant for functional and anatomical outcomes during ranibizumab therapy of diabetic macular oedema,” Br. J. Ophthalmol. 102(2), 195–203 (2018). 10.1136/bjophthalmol-2017-310483 [DOI] [PubMed] [Google Scholar]
- 39.Massin P., Bandello F., Garweg J. G., et al. , “Safety and efficacy of ranibizumab in diabetic macular edema (RESOLVE Study): a 12-month, randomized, controlled, double-masked, multicenter phase II study,” Diabetes Care 33(11), 2399–2405 (2010). 10.2337/dc10-0493 [DOI] [PMC free article] [PubMed] [Google Scholar]
- 40.Murakami T., Nishijima K., Akagi T., et al. , “Optical coherence tomographic reflectivity of photoreceptors beneath cystoid spaces in diabetic macular edema,” Invest. Ophthalmol. Visual Sci. 53(3), 1506–1511 (2012). 10.1167/iovs.11-9231 [DOI] [PubMed] [Google Scholar]
Associated Data
This section collects any data citations, data availability statements, or supplementary materials included in this article.
Data Availability Statement
Data underlying the results presented in this paper are not publicly available at this time but may be obtained from the authors upon reasonable request.


