

Abstract
Background
Ventricular repolarization time (ECG QT and JT intervals) is associated with malignant arrhythmia. Genome‐wide association studies have identified 230 independent loci for QT and JT; however, 50% of their heritability remains unexplained. Previous work supports a causal effect of lower serum calcium concentrations on longer ventricular repolarization time. We hypothesized calcium interactions with QT and JT variant associations could explain a proportion of the missing heritability.
Methods and Results
We performed genome‐wide calcium interaction analyses for QT and JT intervals. Participants were stratified by their calcium level relative to the study distribution (top or bottom 20%). We performed a 2‐stage analysis (genome‐wide discovery [N=62 532] and replication [N=59 861] of lead variants) and a single‐stage genome‐wide meta‐analysis (N=122 393, [European ancestry N=117 581, African ancestry N=4812]). We also calculated 2‐degrees of freedom joint main and interaction and 1‐degree of freedom interaction P values. In 2‐stage and single‐stage analyses, 50 and 98 independent loci, respectively, were associated with either QT or JT intervals (2‐degrees of freedom joint main and interaction P value <5×10⁻⁸). No lead variant had a significant interaction result after correcting for multiple testing and sensitivity analyses provided similar findings. Two loci in the single‐stage meta‐analysis were not reported previously (SPPL2B and RFX6).
Conclusions
We have found limited support for an interaction effect of serum calcium on QT and JT variant associations despite sample sizes with suitable power to detect relevant effects. Therefore, such effects are unlikely to explain a meaningful proportion of the heritability of QT and JT, and factors including rare variation and other environmental interactions need to be considered.
Keywords: calcium, ECG intervals, gene‐lifestyle interaction, genome‐wide association study, ventricular repolarization
Subject Categories: Electrophysiology; Genetic, Association Studies
Nonstandard Abbreviations and Acronyms
- HC
high calcium
- LC
low calcium
- P JOINT
2‐degrees of freedom joint main and interaction P value
- PINT
1‐degree of freedom interaction P value
- UKB
United Kingdom Biobank
Clinical Perspective.
What Is New?
Interaction serum calcium concentrations with variant associations for QT and JT intervals do not account for a meaningful proportion of the missing heritability of these traits in genome‐wide association studies.
What Are the Clinical Implications?
Rare variation and other environmental interactions need to be explored.
Sudden cardiac death accounts for over half of all cardiovascular deaths globally. 1 There are multiple underlying causes, including ischemic heart disease, inherited arrhythmic syndromes, cardiomyopathies, and electrolyte disturbances. 2 Abnormal ventricular repolarization is an important precursor to malignant ventricular arrhythmia, which is captured by the QT interval on the ECG. 2 Because the QT interval includes the QRS complex (representing ventricular depolarization), the JT interval (QRS offset to T‐wave end) has attracted interest, as it includes only the period of repolarization. 3 Both QT and JT intervals are heritable; however, despite the 230 independent loci that have been identified previously, approximately 50% of the single nucleotide variant (SNV)‐based heritability remains unexplained. 4
To improve prevention and treatment strategies for sudden cardiac death, there is a need to advance our knowledge of risk markers and modifiers of disease. Serum electrolytes are established modifiers of ventricular repolarization. 5 In our previous Mendelian randomization study, we found support for a causal relationship between lower serum calcium concentrations and longer ventricular repolarization time. 6 Of interest, a 0.1 mmol/L decrease in genetically predicted serum calcium was associated with a 3 millisecond increase in the QT interval, an effect size similar to a previous observational studies. 5 , 6 Calcium ions have an important role in regulating cardiac electrophysiology through their role in excitation‐contraction coupling and counterbalance with sodium ions during phase II of the cardiac action potential. 7 Severe hypocalcemia (<1.9 mmol/L) is well established to cause QT prolongation and ventricular arrhythmia. 8 An observational study has also reported an association of lower serum calcium levels with sudden cardiac death, even within the normal range of values. 9
Gene–environment interactions are an important component of the underlying genetic architecture of complex traits. Such interactions may explain a proportion of the missing heritability not identified from main effect analyses in classic genome‐wide association studies (GWASs). 10 For ventricular repolarization, an interaction effect of hypokalemia on the QT interval (14.6 milliseconds versus 2.7 milliseconds) has been reported for the common missense variant S1103Y at SCN5A in individuals of African ancestry. 11 Pharmacogenetic drug‐SNV interaction analyses for QT and JT have also identified novel loci. 12 , 13 However, it is unknown whether serum calcium interacts with genetic association for QT and JT intervals.
We hypothesized that low or high serum calcium concentrations may influence genotype associations with QT and JT intervals and may explain a proportion of the missing heritability for these measures. Accounting for these effects in large study samples may identify novel biomolecular insights relevant to ventricular repolarization. 14 We have therefore performed genome‐wide calcium (joint) interaction meta‐analyses for QT and JT intervals in over 122 000 individuals.
METHODS
Data Availability
Summary statistics from the single‐stage SNV‐by‐calcium interaction analysis for QT and JT intervals will be made available on the National Human Genome Research Institute‐European Bioinformatics Institute Catalog of human GWASs website, https://www.ebi.ac.uk/gwas/.
Code Availability
Codes are available from the original software used for each analysis.
Study Cohorts
A total of 18 studies (and their substudies) contributed to calcium‐stratified GWAS interaction meta‐analyses for QT and JT, comprising a total maximum sample size of 122 393 (117 581 [96.1%] European, 4812 [3.9%] African) (Table S1, Data S1 and S2). These included members of the CHARGE (Cohorts for Heart and Aging Research in Genomic Epidemiology) consortium. 15 All participating institutions had approval from their relevant local medical ethics committee, and written informed consent was obtained at a study level from all individuals. Cohorts included in association analyses were predominantly population based. Before genotype imputation, study‐specific genotype quality control filters were applied, including call rate, Hardy–Weinberg equilibrium P value, and minor allele frequency (Table S2). The majority of studies used the 1000 genomes phase 3 reference panel 16 for imputation, with a smaller proportion using the Haplotype Reference Consortium (r1.1 2016) panel 17 or TOPMed Freeze 5 18 (Table S2).
Phenotyping of Participants
ECG acquisition and annotation was performed at a study level, including calculation of QT and JT intervals in milliseconds (ms) (Table S3). Individuals were included in the study if serum calcium concentration (mmol/L) was also available. Across all participating studies, serum calcium concentrations were predominantly within normal limits, with a small number of individuals with abnormal values (average minimum 1.86 mmol/L, average maximum 2.94 mmol/L) (Table S3). For 10 studies, samples for calcium measurement were taken on the same day as the ECG recording (total N=84 833 [Table S3]). For the remaining 8 studies (N=37 760), measurements were typically taken within a day or week. As serum calcium concentrations are typically stable over time, 19 these studies were included in the meta‐analysis as small degrees of variation are unlikely to significantly impact allocation of individuals to high calcium (HC) or low calcium (LC) strata. We have performed sensitivity analyses (described subsequently) to evaluate the effects of this.
Individuals were excluded at a study level if they had a QRS duration >120 milliseconds (as a surrogate marker for cardiovascular disease), right or left bundle‐branch block, atrial fibrillation or flutter on ECG, prior diagnoses of myocardial infarction or heart failure, were pregnant at the time of ECG acquisition, or if a pacemaker or implantable cardiac defibrillator had been inserted. Additionally, if the data were available, individuals using digitalis medication, class I or III antiarrhythmics, or established QT prolongation medication were excluded (Table S4). In total, there were 3 studies where medication data were not available. This represents a total of 18 203 individuals (14.5% of the meta‐analysis sample size); however, the proportion of these individuals on QT‐prolonging medication will be small (eg, approximately 1.8% of UK Biobank [UKB] individuals with ECG data were on these medication after applying all other exclusions).
Statistical Analysis
For each study before performing the GWAS, an imputation quality cutoff Rsq>0.5 (or similar in IMPUTE) and minor allele frequency filter >1% was applied. Population substructure was accounted for using genetic principal components or linkage disequilibrium calculated from hard‐call genotyped SNVs. 20 Individuals of European and African ancestry were analyzed separately. When applicable, a kinship matrix (or hard‐call genotyped SNVs in BOLT‐LMM) was used to account for relatedness between individuals. Mandatory covariates included in the GWAS model were age, sex, height, and body mass index as performed in standard QT/JT GWAS. 4 Correction of QT and JT intervals for heart rate was applied by also including heart rate in the linear regression model, as done in previous studies. 4 Additional cohort‐specific covariates were included when appropriate, such as cohort recruitment site or genotyping array.
To perform the GWAS, each cohort first divided individuals into different strata to represent exposure to HC or LC according to their serum calcium concentration relative to the study distribution:
HC:
Exposed group (HC‐exposed): Individuals with a serum calcium concentration in the top 20% of the study distribution.
Unexposed group (HC‐unexposed): Individuals not in HC‐exposed group (ie, serum calcium in the bottom 80% of the study distribution).
LC:
Exposed group (LC‐exposed): Individuals with a serum calcium concentration in the bottom 20% of the study distribution.
Unexposed group (LC‐unexposed): Individuals not in LC‐exposed group (ie, serum calcium in the top 80% of the study distribution).
Subsequently, for each ECG trait (QT and JT) and stratum (HC‐exposed, HC‐unexposed, LC‐exposed, and LC‐unexposed) GWASs were performed using an additive genetic effect model (Equation 1):
| (1) |
Where is the phenotype (QT or JT), is the genotype at SNV , is the fixed effect size of SNV , is a matrix of covariates, is a random effect capturing unequal relatedness, and is the random effect of residual errors. 21
The GWAS software used was chosen at cohort‐level: either ProbABEL (v.0.5.0), 22 MMAP (v.04.2018), 23 SAIGE, 24 SNPTEST (v2.5.4), 25 BOLT‐LMM, 20 RVTEST (v.10.2017), 26 or Regscan. 27 In addition, to permit calculation of main effect beta estimates, a GWAS was also performed for each ECG trait including all individuals irrespective of serum calcium concentration.
Quality control of GWAS summary statistics submitted by each cohort was performed centrally using standardized steps with the EasyQC R‐package (version 9.2). 28 In brief, allele frequencies (AF) of variants were compared with the reference panel used by the original study and outliers (AF difference>0.2) were removed. To ensure only high‐quality SNVs were selected, variants with a product of minor allele count and imputation quality (minor allele count*Rsq) <20 were excluded. Quantile‐quantile plots, P value, and Z‐statistic plots and lambdas were manually inspected for each study to identify analytical errors and uncorrected population stratification.
Two‐Stage SNV‐by‐Calcium Interaction GWAS Meta‐Analyses for QT and JT
The primary analysis was a 2‐stage analysis (Figure 1). Participating studies were split into discovery and replication cohorts (Table). Manhattan and quantile‐quantile plots for each stage were generated using the R package QQman (v.0.1.8).
Figure 1. Overview of the primary analysis performed in this study.
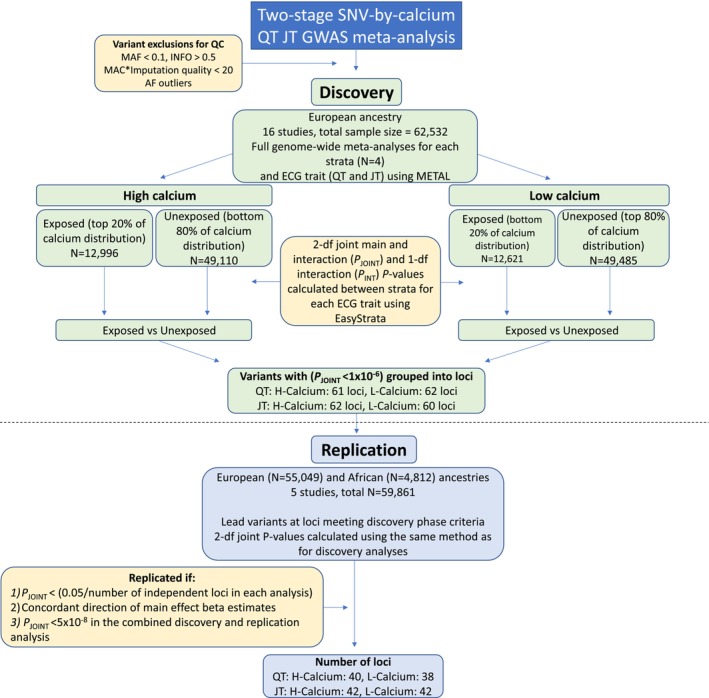
AF indicates allele frequency; df, degrees of freedom; GWAS, genome‐wide association study; MAC, minor allele count; MAF, minor allele frequency; N, number; P INT, interaction effect P value; P JOINT, joint (main and interaction effect) P value; and SNV, single nucleotide variant.
Table .
Cohorts Included in the GWAS Meta‐Analyses
| Discovery (EA only) | Replication (EA) | ||
|---|---|---|---|
| Study | Sample size | Study | Sample size |
| ARIC | 7789 | LIFELINES‐UGLI | 9426 |
| BRIGHT | 1201 | UKB | 45 623 |
| CHRIS | 4410 | Total | 55 049 |
| CHS | 1408 | ||
| INGI‐CAR | 355 | ||
| INGI‐FVG | 781 | Replication (AA) | |
| INTER99 | 5928 | Study | Sample size |
| KORA‐F3 | 2639 | ARIC | 2399 |
| KORA‐S4 | 2354 | MESA | 1182 |
| LIFELINES‐CS | 12 092 | UKB | 1231 |
| MESA | 2006 | Total | 4812 |
| MICROS | 515 | ||
| NEO | 5173 | ||
| OGP | 435 | ||
| ORCADES | 1710 | ||
| RS‐1 | 1544 | ||
| RS‐2 | 1372 | ||
| RS‐3 | 2559 | ||
| SHIP | 2885 | ||
| SHIP‐TREND‐1 | 833 | ||
| SHIP‐TREND‐2 | 2429 | ||
| VIKING | 1868 | ||
| Total | 62 532 | ||
AA indicates African ancestry; ARIC, Atherosclerosis Risk in Communities study; BRIGHT, British Genetics of Hypertension study; CHRIS, The Cooperative Health Research in South Tyrol study; CHS, Cardiovascular Health Study; EA, European ancestry; GWAS, genome‐wide association study; INGI‐CAR, Italian Network of Genetic Isolates‐Carlantino; INGI‐FVG, Italian Network of Genetic Isolates‐Friuli Venezia Giulia; INTER99, A Randomised Non‐pharmacological Intervention Study for Prevention of Ischaemic Heart Disease; KORA, Cooperative Health Research in the Region Augsburg; LIFELINES‐CS, Lifelines Cohort Study Cyto SNP subset; LIFELINES‐UGLI, Lifelines Cohort Study University Genetics Lifelines Initiative subset; MESA, Multi‐Ethnic Study of Atherosclerosis; MICROS, Microisolates in South Tyrol; NEO, Netherlands Epidemiology of Obesity; OGP, Ogliastra Genetic Park; ORCADES, Orkney Complex Disease Study; RS, Rotterdam study; SHIP, Study of Health in Pomerania; UKB, UK Biobank; and VIKING, Viking health study.
The discovery phase included 16 studies and their substudies, with individuals of European ancestry only (total N=62 532). For each group (HC‐exposed, HC‐unexposed, LC‐exposed, LC‐unexposed) and for each ECG trait (QT and JT), a full GWAS meta‐analysis was performed using an inverse variance‐weighted, fixed effects model with METAL (version released March 25, 2011). 29 Variants were excluded from the meta‐analysis if present in ≤2 studies or had a meta‐analysis sample size <2000 in the exposed group. To estimate the main effects of SNV associations with QT and JT, a meta‐analysis was also performed including all individuals irrespective of their serum calcium concentration. Subsequently, SNV‐strata specific joint P values (2‐degrees of freedom [df] main and interaction [P JOINT, Equation 2]) and interaction P values (P INT, Equation 3) between each exposed and unexposed stratum (HC‐exposed versus HC‐unexposed, LC‐exposed versus LC‐unexposed) were calculated using the EasyStrata R package (v8.6). 30
| (2) |
| (3) |
Where is the effect size estimates of stratum I, SE is the corresponding SE of stratum I, and is the sample size of the stratum. 30
All variants from the discovery analysis with a P JOINT<1×10⁻⁶ were subsequently grouped into loci using the following method. For each lead variant (smallest P JOINT) in a 1 mb region, linkage disequilibrium correlations were calculated using the 1000 genomes reference panel in PLINK (v1.9) including individuals of European and African ancestry. 16 , 31 Locus boundaries were defined as either ±500 kb from the lead SNV or a region containing variants with an r2>0.1 with the lead SNV, whichever was greater. Overlapping loci were merged to create a list of lead variants representing each locus. These lead variants were subsequently taken forward for replication.
Replication of each lead variant was performed in a meta‐analysis of 2 cohorts of European ancestry (N=55 049) and a further 3 cohorts of African ancestry (N=4812), a total of 5 cohorts with N=59 861 across both ancestries (Table; Figure 1). The lead variants were declared replicated if meeting the following criteria:
A 2‐df main and interaction joint test P value less than a Bonferroni‐corrected threshold for the number of lead variants tested for replication in each analysis (P JOINT<[0.05/number of loci]).
Concordant direction of beta effect size estimates between discovery versus replication.
P JOINT genome‐wide significant (<5×10⁻⁸) in a combined meta‐analysis of discovery and replication cohorts. A locus was declared novel if no SNV from previous published QT or JT main effect GWASs mapped within its boundaries. 4 Table S5 contains a list of all previously reported loci for QT (N=195) and JT (N=172).
To identify support for an interaction effect of calcium on the association of genotypes with QT and JT, 1‐df interaction P values (P INT) were reviewed for each replicated lead variant and declared significant if meeting a Bonferroni‐corrected threshold (<0.05/number of unique independent loci). 1‐df interaction P values <0.05 but greater than the Bonferroni‐corrected threshold were considered to identify suggestive support for an interaction effect.
To determine whether between‐ancestry (European versus African) heterogeneity may influence our results (which could be by affecting replication of discovery lead variants or identification of support for interaction effects), between‐ancestry main effect heterogeneity P values were calculated by performing a meta‐analysis of the European ancestry meta‐analysis versus the African ancestry meta‐analysis within METAL. 29 A between‐ancestry heterogeneity P value <0.01 was used to declare evidence of heterogeneity for each lead variant brought forward to replication. As some heterogeneity was observed at a minority of loci, replication was repeated in the 2 European ancestry cohorts only (N=55 049).
Single‐Stage Full Cohort Discovery SNV‐by‐Calcium Interaction GWAS Meta‐Analyses for QT and JT Intervals
To maximize power for the discovery of interaction effects with calcium, a single‐stage interaction meta‐analysis was also performed using all cohorts (N=122 393, Figure 2). For this analysis, variants were excluded if their sample size was <60% of the total sample size (N<73 436) to ensure findings are not driven by a minority of studies. Variants were declared significant if the joint main and interaction effect was genome‐wide significant (P JOINT<5×10⁻⁸) and without evidence for between‐study heterogeneity (heterogeneity P value >0.01). The 1‐df interaction P values were declared significant if meeting a Bonferroni‐corrected threshold (<0.05/number of loci in each analysis).
Figure 2. Overview of the single‐stage all cohorts interaction analysis and subsequent sensitivity analyses.
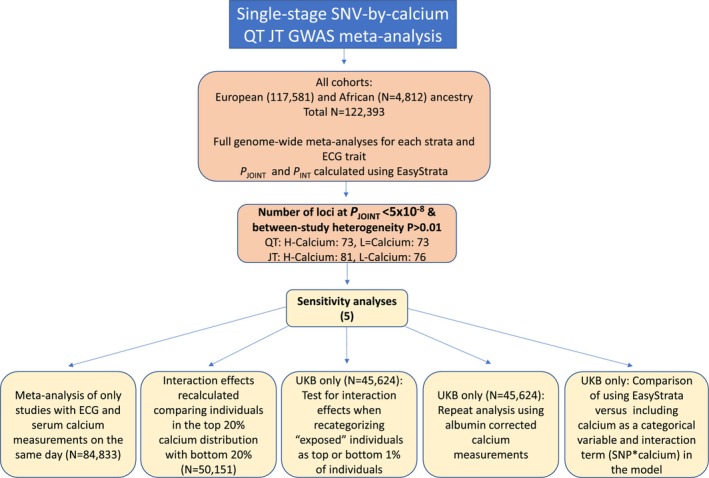
GWAS indicates genome‐wide association study; N, number; P INT, interaction effect P value; P JOINT, joint (main and interaction effect) P value; SNV, single nucleotide variant; and UKB, UK Biobank study.
Sensitivity Analyses
Five sensitivity analyses were performed to test whether our study design influenced our findings (Figure 2):
Serum sampling for calcium measurements on a different day to ECG acquisition could introduce noise and prevent the detection of significant interactions. Therefore, the single‐stage all cohorts SNV‐by‐calcium interaction GWAS meta‐analyses were repeated including only studies where these data were collected on the same day (10 studies, N=84 833) (Table S3).
Interaction effects may be easier to detect if directly comparing extremes of the serum calcium concentration distribution. To test this, we repeated the SNV‐by‐calcium interaction meta‐analysis for QT and JT using EasyStrata, by calculating the joint main and interaction effect estimates between the top 20% (HC‐exposed) and bottom 20% (LC‐exposed) GWAS meta‐analyses (N=50 151).
As the criteria used to define each stratum may influence the detection of interaction effects, analyses were repeated in UKB only (N=45 624) having recategorized individuals as “exposed” if in the top 1% of the HC group or bottom 1% of the LC group. Joint (main and interaction) and interaction effects between the 1% exposed and 99% unexposed for each HC and LC group were recalculated using EasyStrata and compared with the UKB analysis using the original definition (Exposed group=top or bottom 20%).
As differences in serum albumin concentration may have a small impact on the categorization of individuals to different strata by modifying calcium binding, 6 analyses in UKB only (N=45 624) were repeated using serum albumin‐corrected calcium concentrations as the exposure. LC or HC groups were defined as the bottom or top 20% of individuals in the serum albumin‐corrected calcium distribution. Significant loci were compared with the original UKB analysis using serum total calcium.
We were interested if including calcium as a categorical variable in the model along with the interaction term SNV*calcium, would yield different findings compared with our approach using EasyStrata. To address this question, we performed this analysis in UKB (N=45 509) (Data S3).
For sensitivity analyses 1 through 4, significant findings were reported for variants where the P JOINT was genome‐wide significant (<5×10⁻⁸). Lead variant interaction effect P values were reported significant if below a Bonferroni‐corrected threshold (<0.05/number of lead variants for each trait) to account for multiple testing.
Follow‐Up of Novel Loci
For lead variants at each “novel” locus previously not reported for QT or JT, variant annotation was performed using Variant Effect Predictor, RegulomeDB (v2.0.3) and Combined Annotation Dependant Depletion (v1.6) platforms. 32 , 33 , 34 To identify potential effects on tissue‐specific gene expression, a look up was performed using Genotype‐Tissue Expression data (version 8) for overlap of lead variants and their proxies (r2>0.8) with lead expression quantitative trait loci variants. 35 , 36 Colocalization analyses were performed using the R package COLOC(version 5.1.0.1). 37 These colocalization analyses use Bayesian statistical methods to calculate a posterior probability for a variant being causal in both analyses (>75%). GWAS catalog and Phenoscanner were used to investigate pleiotropy and cross‐trait association of our novel loci, by identifying any previously reported GWAS associations (P <5×10⁻⁸) of any other traits or diseases for variants in strong linkage disequilibrium (r 2>0.8) with the lead variant. 38 , 39 The Open Targets Gene to Locus pipeline was used as an additional source to identify potential candidate genes at loci. 40 , 41 This pipeline uses a machine‐learning model to weight evidence sources including distance from variant to gene transcription start site, colocalization and chromatin interaction data, and predicted variant pathogenicity.
Post Hoc Power Calculations
The Quanto+ program 42 was used to calculate the power to detect a calcium interaction effect in a similar total sample size (120 000) for an SNV with a minor allele frequency of 10% and a genome‐wide significance level (<5×10⁻⁸).
RESULTS
Two‐Stage SNV‐by‐Calcium QT and JT Interaction GWAS Analyses
In a genome‐wide discovery meta‐analysis of 16 studies (22 substudies with 62 532 individuals of European ancestry), lead variants at 61, 62, 62, and 60 loci for QT‐HC, QT‐LC, JT‐HC, and JT‐LC, respectively, met the predetermined P JOINT threshold (<1×10⁻⁶) for testing in replication (Table, Figure 1, Data S1). The replication meta‐analysis (total N=59 861) included 2 European ancestry (N=55 049) and 3 African ancestry (N=4812) cohorts, for a total replication sample size of 59 861 participants (Table). In total, 40, 38, 42, and 42 independent lead variants for QT‐HC, QT‐LC, JT‐HC, and JT‐LC, respectively, met all 3 criteria to declare significance after the replication stage ([1] P JOINT<0.05/number of lead variants tested in each analysis, [2] concordant direction of beta effect size estimates and [3] P JOINT<5×10⁻⁸ when combining discovery and replication cohorts) (Figure 1, Table S6). These correspond to 53 unique and independent loci across all 4 analyses. All 53 loci have been previously reported as associated with QT or JT intervals in main‐effects standard GWAS analyses. 14
None of the lead variant P INT reached a Bonferroni‐corrected threshold for significance (P INT<0.05/number of loci), indicating that the association at each locus was primarily driven by the main variant effect after accounting for serum calcium concentration. Plots comparing effect size estimates for exposed versus unexposed strata are shown in Figure 3. A linear trend and high correlation in effect size estimates (Spearman correlations 0.97–0.98) were observed when comparing strata. Specifically, SNVs with large effect sizes in the exposed group also had large effect sizes in the unexposed group, that is, effect sizes for variant associations in each stratum were similar. Five variants had suggestive support for an interaction effect (P INT<0.05 but >Bonferroni corrected P INT). These were lead variants at loci for QT‐LC ([P INT=0.023, for NKX2‐5], [P INT=0.047, for RNF150]), JT‐HC ([P INT=0.025, for KCNQ4], [P INT=0.034, for CASR]), and JT‐LC (P INT=0.026, for KLF12) (Table S6).
Figure 3. Comparison of main effect beta estimates between exposed and unexposed groups in low or high calcium serum concentrations for QT and JT.
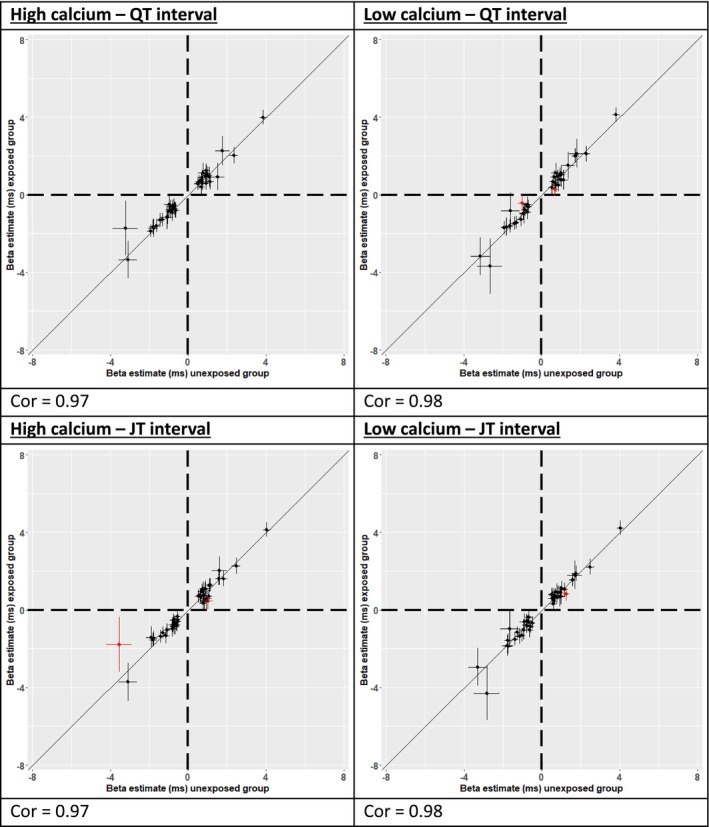
Correlation plots comparing replicated lead variant main effect estimates between “unexposed” (x‐axis) and “exposed” (y‐axis) groups using values from the combined discovery and replication meta‐analysis. Main effect estimates are plotted in milliseconds along with 95% CIs. Cor indicates Pearson correlation coefficient. Points in red indicate those with a 1‐degree of freedom interaction P value <0.05.
To determine whether between‐ancestry (European versus African) heterogeneity was present in the replication analysis and potentially affected our findings, we performed a lookup of main effect heterogeneity P values for all lead variants brought forward from discovery to replication. The between‐ancestry heterogeneity P value for a QT or JT lead variant was <0.01 for 5 loci (NOS1AP, KCNH2, LAPTM4B, SLC4A3, and RNF207) (Table S6). NOS1AP and KCNH2 consistently give the strongest association signals for QT and JT (by P value) and with large effect sizes. Their effects are easier to detect in smaller studies, but the larger effect size estimates may be more susceptible to slight differences between studies. However, the heterogeneity could also be due to true differences in effect sizes.
Because there was some evidence of between‐ancestry heterogeneity at some loci, a European ancestry replication analysis was performed for comparison. There was no substantial difference in the results for 38, 37, 41, and 43 independent loci identified for QT‐HC, QT‐LC JT‐HC, and JT‐LC, respectively (Table S7). These corresponded to 52 unique and independent loci across all 4 analyses and all were reported in the primary analysis. None of the lead variant P INT reached a Bonferroni‐corrected threshold for significance (P INT<0.05/number of loci).
Single‐Stage SNV‐by‐Calcium QT and JT Interaction GWAS Meta‐Analyses for All Cohorts
To maximize power for discovery of interaction effects with calcium, we performed single‐stage SNV‐by‐calcium QT and JT interaction GWAS meta‐analyses including all cohorts. Variants not present in >60% of the full meta‐analysis sample (N=122 393) and variants with between‐study heterogeneity P values <0.01 were excluded after meta‐analysis for quality control filtering. Variants were declared significant if the joint main and interaction effect P value was genome‐wide significant (P JOINT<5×10⁻⁸). P JOINT quantile‐quantile and Manhattan plots are in Figures S1 through S5.
In total, 72, 73, 81, and 76 genome‐wide significant independent loci were identified for QT HC, QT‐LC, JT‐HC, and JT‐LC, respectively (Table S8). These loci corresponded to 98 unique and independent loci across all analyses. Two of the loci have not been reported previously for QT or JT (SPPL2B and RFX6). The lead variant P INT were >0.05 for SSPL2B and RFX6, indicating that the associations were driven by the main effect. Across all 98 unique loci, P INT were not significant after correction for multiple testing.
We also scanned the entire data set for variants for suggestive support (P INT<1×10⁻⁶). P INT values were between 2.7×10⁻⁷ and 7.9×10⁻⁷ for lead variants at 6 unique and independent loci: 2 each for QT‐LC, JT‐HC, and JT‐LC (Figure 4). One lead variant maps within the boundaries of a previously reported locus (4:84853269:A:G, candidate genes SEC31A/COPS4). 4 The other 5 loci have not been reported for either QT or JT associations (Table S9).
Figure 4. Manhattan plot for each single‐stage SNV‐by‐calcium interaction analysis 1‐df joint P values.
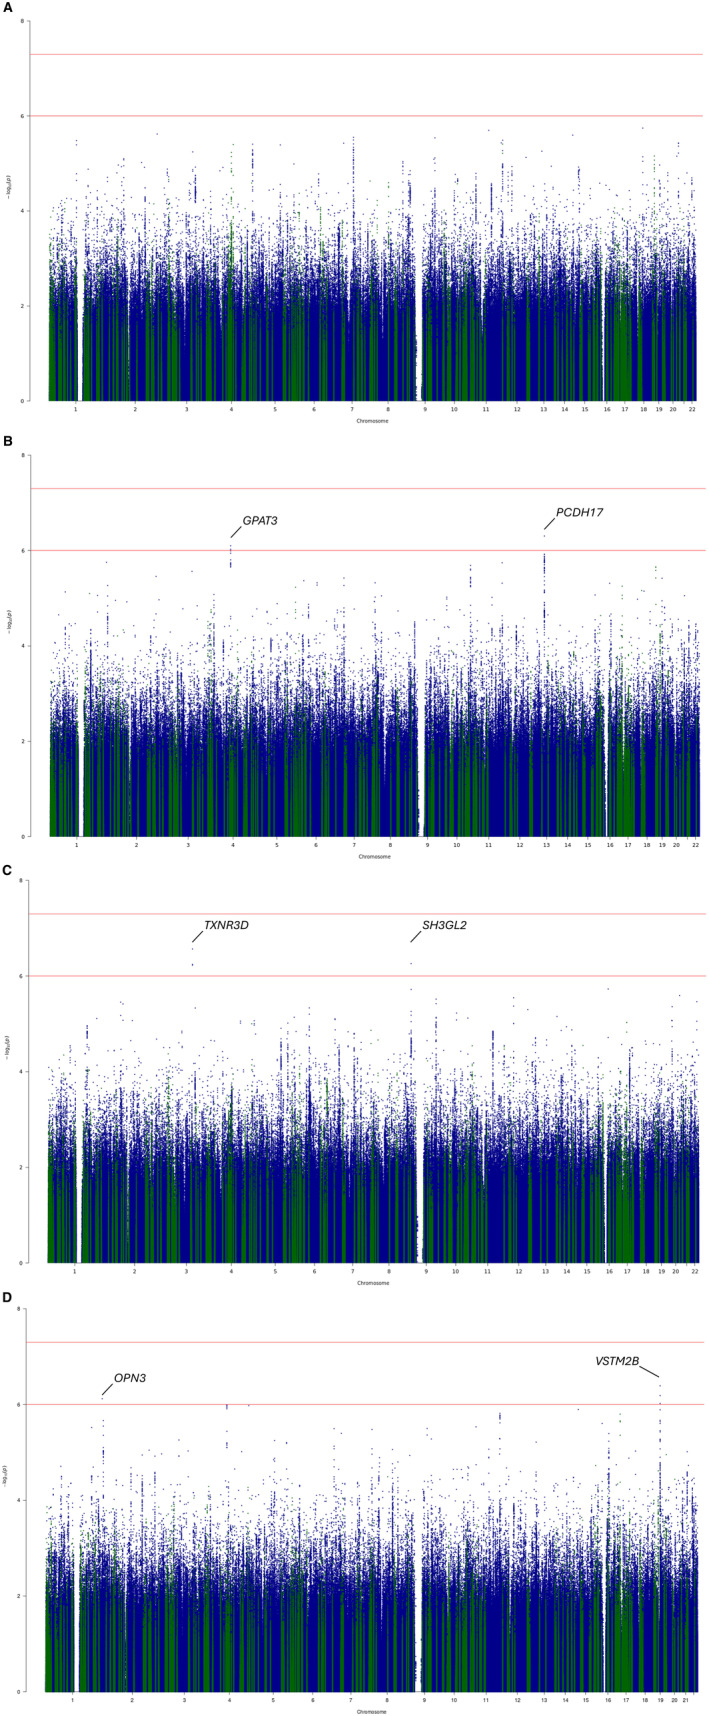
Joint 1‐degree of freedom P values from the single‐stage all cohorts genome‐wide high calcium‐SNV interaction meta‐analysis for the QT interval. (A) QT high calcium, (B) QT low calcium, (C) JT high calcium, (D) JT low calcium. Study‐level linear regression summary statistics for exposed (top or bottom 20% of serum calcium distribution) and unexposed (top or bottom 80% of serum calcium distribution) were meta‐analyzed separately before calculation of joint (main and interaction) effect P values. Variants within the boundaries of previously reported loci for QT and JT are highlighted in green. y axis: log P values, x axis: chromosome and base pair position (hg19). df indicates degrees of freedom; and SNV, single nucleotide variant.
The calcium‐sensing receptor (CASR) locus explains the largest proportion of the variance of serum calcium concentration (0.5%) 43 and is a significant locus in main effects GWASs for QT and JT. 4 A lookup of variants at this locus indicated the minimum P INT were 9.6×10⁻⁴, 1.4×10⁻³, 2.4×10⁻³, and 6.3×10⁻³ for QT‐HC, QT‐LC, JT‐HC, and JT‐LC, respectively. The values do not meet our threshold for suggestive support (P INT<1×10⁻⁶).
Power Calculations
In designing the study, we expected to have adequate power to detect interaction effects, because studies with similar sample sizes had significant findings. 44 To confirm that we had sufficient statistical power, we performed a post hoc analysis using the Quanto+ program, 42 to compute power values at various minor allele frequencies for our approximate sample size (120 000 participants).
At our sample size, and with correction for multiple testing (genome‐wide significance, P<5×10⁻⁸), we had at least 80% power to detect true gene by environment interaction effects of 2.75 milliseconds for SNVs with minor allele frequency values of 10%. For comparison, main effects of 3.76 milliseconds, 3.85 milliseconds, 4.75 milliseconds, and 7.06 milliseconds have been reported for variants at NOS1AP, SCN5A, KCNH2, and KCNE1, respectively. The analysis indicates that our study was unlikely to have been underpowered for clinically relevant calcium interaction effects on SNV associations with QT and JT. The analysis instead supports an interpretation of lack of significant interactions.
Sensitivity Analyses
Four sensitivity analyses were performed to test whether our study design influenced our findings.
To test whether inclusion of studies with serum calcium measurements and ECG acquisition on different days introduced noise that prevented detection of a true interaction effect, we repeated the analyses after excluding such studies. In total, 84 833 individuals of European ancestry from 10 different studies (69.6% of the original sample size) were included. Compared with the single‐stage discovery meta‐analysis, no additional loci were identified and no lead variant had a significant P INT value after applying a Bonferroni‐correction for multiple testing (Table S10).
Using all cohorts, joint main and interaction effects P values were also calculated directly comparing individuals in the top and bottom 20% of the serum calcium distribution (N=50 151). In total, 24 loci for QT and 27 for JT, were genome‐wide significant with a between‐study heterogeneity P value >0.01 (Table S11). None of the lead variants had P INT values and beta estimates for these 2 strata were highly correlated (Figure S6).
To test whether our definition of “high” and “low” calcium affected detection of interaction effects, we repeated the interaction analysis in UKB‐only participants (N=45 624) after reclassifying individuals as “exposed” if calcium levels were in the top 1% (for the HC group) or the bottom 1% (for the LC group). For the 30, 33, 34, and 37 genome‐wide significant loci (P JOINT) for QT‐HC, QT‐LC, JT‐HC, and JT‐LC, respectively, no lead variant had a significant P INT (Table S12).
We also assessed whether stratifying individuals into high or low groups by serum calcium levels corrected for albumin concentrations yielded different results in UKB (N=45 624). Compared with the UKB analyses where serum calcium was not corrected for albumin concentration, there were no significant differences in P JOINT or P INT (Table S13).
Comparing our methodological approach using EasyStrata versus analysis with inclusion of calcium as a categorical variable and the interaction term SNV*calcium in the model, we observed high correlations for P JOINT (≥0.91), P INT (≥0.89), and interaction betas (≥0.96) across all interaction analyses indicating it is unlikely that our conclusions would significantly alter by using a different approach (Data S3, Figure S7).
Bioinformatic Investigation of “Novel” Loci From the Single‐Stage SNV‐by‐Calcium All Cohorts Interaction Analysis
For the 2 “novel” loci found in the single‐stage interaction analysis, both lead variants are noncoding. The nearest genes are RFX6 for rs12201457 on chromosome 6 and SPPL2B for rs3746287 on chromosome 19. rs3746287, in strong linkage disequilibrium (r2=0.86) with a lead expression quantitative trait locus variant for SPPL2B in left ventricular tissue. However, there was no support for colocalization (posterior probability 4=4.4×10⁻⁴). There were no significant findings when testing the lead variants and their proxies (r2>0.8) for long‐range promotor interactions. The variant rs12201457 at RFX6 has previously been reported to be associated with height. 45 A search on PhenoScanner revealed it is located within a cluster of elements with distal enhancer‐like signature and associated with methylation of 3 CpG sites (cg20376953, 46 cg2037695, 47 cg06608376). It is also associated with expression of FAM26F, alias CALHM6 (calcium homeostasis modulator) from expression quantitative trait loci blood derived expression data in 26 353 individuals. 48
DISCUSSION
In these large SNV‐by‐calcium interaction meta‐analyses for QT and JT intervals with >120 000 individuals, there was limited support for SNV‐by‐calcium interaction effects. In the single‐stage analysis, we identified 2 previously unreported loci for QT (RFX6 and SPPL2B), but both findings were primarily driven by the SNV‐main effects only.
Gene–environment interactions contribute to the genetic architecture of complex traits and disease. 10 By studying these interactions in a gene‐by‐environment GWAS analysis framework, novel loci have been identified for lipid and blood pressure traits using sample sizes similar to the size of our study. 44 , 49
Of the 2 previously unreported loci identified in this study at genome‐wide significance, the candidate genes are FAM26F (alias CALHM6) and SPPL2B. FAM26F is the pore‐forming component of a voltage‐gated ion channel with calcium homeostasis activity. 50 It is mainly expressed in immune system cells including cardiac macrophages; however, it is also expressed at low levels in cardiac endothelial and muscle cells.
In this study, for all lead variants for QT and JT (including the 2 previously unreported loci), SNV‐by‐calcium P INT did not reach a Bonferroni‐corrected threshold for significance (0.05/number of loci), supporting an interpretation that the association at each locus was primarily driven by the main variant effect even after stratification by serum calcium concentration. Scanning the entire genome for interaction P values of suggestive significance (P INT<1×10⁻⁶) led to consideration of 6 loci, although replication is necessary in a separate large cohort to determine whether the results represent true interaction effects.
We have previously shown using large‐scale population‐level data that lower serum calcium concentrations are associated with an increase in ventricular repolarization time and provided support for a causal relationship. 5 , 6 Therefore, we hypothesized the existence of SNV‐by‐calcium interactions with QT and JT intervals that may provide additional insights into the biomolecular mechanisms regulating the effects of calcium on these ECG measures. Previous QT and JT main effect GWAS meta‐analyses have reported associations at loci for L‐type calcium channel subunits (CACNB2) and calcium regulation (ATP2A2, PLN). 4 , 51 Low extracellular calcium concentrations can prolong the cardiomyocyte action potential duration through inactivation of the L‐type calcium current. 52 Genes involved in calcium current modulation are rare causes of congenital long QT syndromes including CACNA1C (Timothy syndrome) and CALM1‐3 (types 14–16). 53 , 54 However, we did not identify an interaction effect at these loci, nor at the CASR locus. CASR explains 0.5% of the variance of serum calcium and is a genome‐wide significant locus for QT and JT intervals in main effects GWAS. 4 , 43 Sensitivity analyses also suggest that the thresholds chosen to define HC and LC levels in the populations studied did not significantly influence our results.
Our findings therefore suggest that the associations of common and low frequency genetic variation for QT and JT intervals are not substantially influenced by circulating extracellular calcium concentrations in the general population. This work also suggests that an interaction effect of serum calcium does not explain a meaningful proportion of the missing SNV‐based heritabilities for QT and JT. Effects of small changes in extracellular calcium on genetic associations with ventricular repolarization duration may be mitigated by extensive intracellular regulation that maintain calcium homeostasis and therefore not observed as an interaction effect. 55 It is also possible that more subtle interactions such as anatomical (spatial) characteristics are not captured by an epidemiological study design and may account for the absence of evidence for interaction in this study, despite adequate power. Genetic predisposition to QT and JT interval prolongation and the effects of serum calcium are likely to be additive (as supported by our previous Mendelian randomization study) 5 and therefore further work is necessary to explore potential to increase susceptibility for ventricular arrhythmia.
Limitations
The power to detect associations due to interaction effects is reduced, compared with main effect GWAS analyses. Therefore, larger sample sizes have potential to identify new findings. However, the size of our study (>120 000 with approximately 24 000 individuals classified as having either low or high serum calcium levels) is comparable to sizes of other gene‐by‐environment interaction GWAS meta‐analyses that had significant findings. Moreover, power calculations suggested we had at least 80% power to detect clinically meaningful effect sizes of 2.75 milliseconds. 44 , 56 This meta‐analysis contains primarily cohorts of European ancestry, and we did not have sufficient sample size for individuals of African ancestry to permit a discovery and replication analysis in this ancestry alone. Further investigation is necessary to determine whether effects may be present in individuals of non‐European ancestry, although such data (with serum calcium and ECGs) are currently not yet available. Our study tested for an interaction effect on variants with a minor allele frequency >0.01. Rare coding variation may be more susceptible to changes in extracellular calcium concentration; however, large sample sizes for such analyses were not available for this study.
CONCLUSIONS
We have found limited support for SNV‐by‐calcium interaction effects on common and low‐frequency genotype associations for QT and JT intervals despite adequate power. Our study indicates interaction effects do not explain a meaningful proportion of the unexplained heritability of these traits, and therefore other factors including rare variation and other environmental interactions need to be considered.
Sources of Funding
W.J.Y. was supported by a Medical Research Council (MRC) grant MR/R017468/1. He also recognizes the National Institute for Health and Care Research Integrated Academic Training program, which supports his Academic Clinical Lectureship post. N.G. acknowledges funding from Novo Nordisk Foundation (Grant number NNF18CC0034900). D.O.M.‐K. is supported by Dutch Science Organization (ZonMW‐VENI Grant 916.14.023). J.F.W. and P.N. acknowledge support from the Medical Research Council Human Genetics Unit program grant, “Quantitative traits in health and disease” (U.MC_UU_00007/10). X.S. was in receipt of a Swedish Research Council Starting Grant (No. 2017‐02543) and a grant from National Natural Science Foundation of China (No. 12171495). N.S. was funded by National Insititutes of Health grants R01HL116747, R01HL141989, American Heart Association grant 19SFRN34910206 and the John and Cookie Laughlin Family. P.D.L. acknowledges support from the University College London Hospital Biomedicine National Institute for Health and Care Research. P.B.M., H.R.W., and A.T. acknowledge the support of the National Institute for Health and Care Research (Barts Biomedical Research Centre, NIHR203330). J.R. acknowledges funding from the European Union's Horizon 2020 Research and Innovation Programme under the Marie Sklodowska‐Curie grant agreement number 786833, from the European Union “NextGenerationEU/PRTR”, and from Grant PID2021‐128972OA‐I00 funded by MCIN/AEI/10.13039/501100011033. The authors also wish to acknowledge the National Institutes of Health CHARGE infrastructure grant (HL105756). All study level acknowledgements can be found in Data S2.
Disclosures
None.
Supporting information
Data S1
Acknowledgments
This research has been conducted using the UK Biobank Resource under Application Number 8256. This research used data assets made available by National Safe Haven as part of the Data and Connectivity National Core Study, led by Health Data Research UK in partnership with the Office for National Statistics and funded by UK Research and Innovation (grant ref MC_PC_20029). Copyright © (2022), NHS Digital. Reused with the permission of the NHS Digital [and UK Biobank]. All rights reserved. This research used Queen Mary's Apocrita HPC facility, supported by QMUL Research‐IT. http://doi.org/10.5281/zenodo.438045.
This article was sent to Marijana Vujkovic, PhD, Assistant Editor, for review by expert referees, editorial decision, and final disposition.
Supplemental Material is available at https://www.ahajournals.org/doi/suppl/10.1161/JAHA.123.034760
For Sources of Funding and Disclosures, see page 14.
References
- 1. Wong CX, Brown A, Lau DH, Chugh SS, Albert CM, Kalman JM, Sanders P. Epidemiology of sudden cardiac death: global and regional perspectives. Heart Lung Circ. 2019;28:6–14. doi: 10.1016/j.hlc.2018.08.026 [DOI] [PubMed] [Google Scholar]
- 2. Srinivasan NT, Schilling RJ. Sudden cardiac death and arrhythmias. Arrhythmia Electrophysiol Rev. 2018;7:111–117. doi: 10.15420/aer.2018:15:2 [DOI] [PMC free article] [PubMed] [Google Scholar]
- 3. Zulqarnain MA, Qureshi WT, O'Neal WT, Shah AJ, Soliman EZ. Risk of mortality associated with QT and JT intervals at different levels of QRS duration (from the third National Health and nutrition examination survey). Am J Cardiol. 2015;116:74–78. doi: 10.1016/j.amjcard.2015.03.038 [DOI] [PMC free article] [PubMed] [Google Scholar]
- 4. Young WJ, Lahrouchi N, Isaacs A, Duong T, Foco L, Ahmed F, Brody JA, Salman R, Noordam R, Benjamins JW, et al. Genetic analyses of the electrocardiographic QT interval and its components identify additional loci and pathways. Nat Commun. 2022;13:5144. doi: 10.1038/s41467-022-32821-z [DOI] [PMC free article] [PubMed] [Google Scholar]
- 5. Noordam R, Young WJ, Salman R, Kanters JK, van den Berg ME, van Heemst D, Lin HJ, Barreto SM, Biggs ML, Biino G, et al. Effects of calcium, magnesium, and potassium concentrations on ventricular repolarization in unselected individuals. J Am Coll Cardiol. 2019;73:3118–3131. doi: 10.1016/j.jacc.2019.03.519 [DOI] [PubMed] [Google Scholar]
- 6. Young WJ, Warren HR, Mook‐Kanamori DO, Ramírez J, van Duijvenboden S, Orini M, Tinker A, van Heemst D, Lambiase PD, Jukema JW, et al. Genetically determined serum calcium levels and markers of ventricular repolarization: a mendelian randomization study in the UK biobank. Circ Genom Precis Med. 2021;14:e003231. doi: 10.1161/circgen.120.003231 [DOI] [PMC free article] [PubMed] [Google Scholar]
- 7. Nerbonne JM, Kass RS. Molecular physiology of cardiac repolarization. Physiol Rev. 2005;85:1205–1253. doi: 10.1152/physrev.00002.2005 [DOI] [PubMed] [Google Scholar]
- 8. Eisner D. Calcium in the heart: from physiology to disease. Exp Physiol. 2014;99:1273–1282. doi: 10.1113/expphysiol.2013.077305 [DOI] [PubMed] [Google Scholar]
- 9. Yarmohammadi H, Uy‐Evanado A, Reinier K, Rusinaru C, Chugh H, Jui J, Chugh SS. Serum calcium and risk of sudden cardiac arrest in the general population. Mayo Clin Proc. 2017;92:1479–1485. doi: 10.1016/j.mayocp.2017.05.028 [DOI] [PMC free article] [PubMed] [Google Scholar]
- 10. Yi N. Statistical analysis of genetic interactions. Genet Res (Camb). 2010;92:443–459. doi: 10.1017/S0016672310000595 [DOI] [PMC free article] [PubMed] [Google Scholar]
- 11. Akylbekova EL, Payne JP, Newton‐Cheh C, May WL, Fox ER, Wilson JG, Sarpong DF, Taylor HA, Maher JF. Gene‐environment interaction between SCN5A‐1103Y and hypokalemia influences QT interval prolongation in African Americans: the Jackson Heart Study. Am Heart J. 2014;167:116–122.e111. doi: 10.1016/j.ahj.2013.10.009 [DOI] [PMC free article] [PubMed] [Google Scholar]
- 12. Floyd JS, Sitlani CM, Avery CL, Noordam R, Li X, Smith AV, Gogarten SM, Li J, Broer L, Evans DS, et al. Large‐scale pharmacogenomic study of sulfonylureas and the QT, JT and QRS intervals: CHARGE pharmacogenomics working group. Pharmacogenomics J. 2018;18:127–135. doi: 10.1038/tpj.2016.90 [DOI] [PMC free article] [PubMed] [Google Scholar]
- 13. Noordam R, Sitlani CM, Avery CL, Stewart JD, Gogarten SM, Wiggins KL, Trompet S, Warren HR, Sun F, Evans DS, et al. A genome‐wide interaction analysis of tricyclic/tetracyclic antidepressants and RR and QT intervals: a pharmacogenomics study from the cohorts for heart and aging research in genomic epidemiology (CHARGE) consortium. J Med Genet. 2017;54:313–323. doi: 10.1136/jmedgenet-2016-104112 [DOI] [PMC free article] [PubMed] [Google Scholar]
- 14. Rao DC, Sung YJ, Winkler TW, Schwander K, Borecki I, Cupples LA, Gauderman WJ, Rice K, Munroe PB, Psaty BM. Multiancestry study of gene‐lifestyle interactions for cardiovascular traits in 610 475 individuals from 124 cohorts: design and rationale. Circ Cardiovasc Genet. 2017;10:10. doi: 10.1161/circgenetics.116.001649 [DOI] [PMC free article] [PubMed] [Google Scholar]
- 15. Psaty BM, O'Donnell CJ, Gudnason V, Lunetta KL, Folsom AR, Rotter JI, Uitterlinden AG, Harris TB, Witteman JC, Boerwinkle E, et al. Cohorts for heart and aging research in genomic epidemiology (CHARGE) consortium: design of prospective meta‐analyses of genome‐wide association studies from 5 cohorts. Circ Cardiovasc Genet. 2009;2:73–80. doi: 10.1161/CIRCGENETICS.108.829747 [DOI] [PMC free article] [PubMed] [Google Scholar]
- 16. Auton A, Brooks LD, Durbin RM, Garrison EP, Kang HM, Korbel JO, Marchini JL, McCarthy S, McVean GA, Abecasis GR, et al. A global reference for human genetic variation. Nature. 2015;526:68–74. doi: 10.1038/nature15393 [DOI] [PMC free article] [PubMed] [Google Scholar]
- 17. McCarthy S, Das S, Kretzschmar W, Delaneau O, Wood AR, Teumer A, Kang HM, Fuchsberger C, Danecek P, Sharp K, et al. A reference panel of 64,976 haplotypes for genotype imputation. Nat Genet. 2016;48:1279–1283. doi: 10.1038/ng.3643 [DOI] [PMC free article] [PubMed] [Google Scholar]
- 18. Taliun D, Harris DN, Kessler MD, Carlson J, Szpiech ZA, Torres R, Taliun SAG, Corvelo A, Gogarten SM, Kang HM, et al. Sequencing of 53,831 diverse genomes from the NHLBI TOPMed program. Nature. 2021;590:290–299. doi: 10.1038/s41586-021-03205-y [DOI] [PMC free article] [PubMed] [Google Scholar]
- 19. Payne RB, Carver ME, Morgan DB. Interpretation of serum total calcium: effects of adjustment for albumin concentration on frequency of abnormal values and on detection of change in the individual. J Clin Pathol. 1979;32:56–60. doi: 10.1136/jcp.32.1.56 [DOI] [PMC free article] [PubMed] [Google Scholar]
- 20. Loh PR, Tucker G, Bulik‐Sullivan BK, Vilhjálmsson BJ, Finucane HK, Salem RM, Chasman DI, Ridker PM, Neale BM, Berger B, et al. Efficient Bayesian mixed‐model analysis increases association power in large cohorts. Nat Genet. 2015;47:284–290. doi: 10.1038/ng.3190 [DOI] [PMC free article] [PubMed] [Google Scholar]
- 21. Uffelmann E, Huang QQ, Munung NS, de Vries J, Okada Y, Martin AR, Martin HC, Lappalainen T, Posthuma D. Genome‐wide association studies. Nat Rev Methods Primers. 2021;1:59. doi: 10.1038/s43586-021-00056-9 [DOI] [Google Scholar]
- 22. Aulchenko YS, Struchalin MV, van Duijn CM. ProbABEL package for genome‐wide association analysis of imputed data. BMC Bioinformatics. 2010;11:134. doi: 10.1186/1471-2105-11-134 [DOI] [PMC free article] [PubMed] [Google Scholar]
- 23. O'Connell J. MMAP user guide. 2013. Accessed February 15, 2023. http://edn.Som.Umaryland.Edu/mmap/index.Php.
- 24. Zhou W, Nielsen JB, Fritsche LG, Dey R, Gabrielsen ME, Wolford BN, LeFaive J, VandeHaar P, Gagliano SA, Gifford A, et al. Efficiently controlling for case‐control imbalance and sample relatedness in large‐scale genetic association studies. Nat Genet. 2018;50:1335–1341. doi: 10.1038/s41588-018-0184-y [DOI] [PMC free article] [PubMed] [Google Scholar]
- 25. Marchini J, Howie B, Myers S, McVean G, Donnelly P. A new multipoint method for genome‐wide association studies by imputation of genotypes. Nat Genet. 2007;39:906–913. doi: 10.1038/ng2088 [DOI] [PubMed] [Google Scholar]
- 26. Zhan X, Hu Y, Li B, Abecasis GR, Liu DJ. RVTESTS: an efficient and comprehensive tool for rare variant association analysis using sequence data. Bioinformatics. 2016;32:1423–1426. doi: 10.1093/bioinformatics/btw079 [DOI] [PMC free article] [PubMed] [Google Scholar]
- 27. Haller T, Kals M, Esko T, Mägi R, Fischer K. RegScan: a GWAS tool for quick estimation of allele effects on continuous traits and their combinations. Brief Bioinform. 2015;16:39–44. doi: 10.1093/bib/bbt066 [DOI] [PMC free article] [PubMed] [Google Scholar]
- 28. Winkler TW, Day FR, Croteau‐Chonka DC, Wood AR, Locke AE, Mägi R, Ferreira T, Fall T, Graff M, Justice AE, et al. Quality control and conduct of genome‐wide association meta‐analyses. Nat Protoc. 2014;9:1192–1212. doi: 10.1038/nprot.2014.071 [DOI] [PMC free article] [PubMed] [Google Scholar]
- 29. Willer CJ, Li Y, Abecasis GR. METAL: fast and efficient meta‐analysis of genomewide association scans. Bioinformatics. 2010;26:2190–2191. doi: 10.1093/bioinformatics/btq340 [DOI] [PMC free article] [PubMed] [Google Scholar]
- 30. Winkler TW, Kutalik Z, Gorski M, Lottaz C, Kronenberg F, Heid IM. EasyStrata: evaluation and visualization of stratified genome‐wide association meta‐analysis data. Bioinformatics. 2015;31:259–261. doi: 10.1093/bioinformatics/btu621 [DOI] [PMC free article] [PubMed] [Google Scholar]
- 31. Purcell S, Neale B, Todd‐Brown K, Thomas L, Ferreira MA, Bender D, Maller J, Sklar P, de Bakker PI, Daly MJ, et al. PLINK: a tool set for whole‐genome association and population‐based linkage analyses. Am J Hum Genet. 2007;81:559–575. doi: 10.1086/519795 [DOI] [PMC free article] [PubMed] [Google Scholar]
- 32. Boyle AP, Hong EL, Hariharan M, Cheng Y, Schaub MA, Kasowski M, Karczewski KJ, Park J, Hitz BC, Weng S, et al. Annotation of functional variation in personal genomes using RegulomeDB. Genome Res. 2012;22:1790–1797. doi: 10.1101/gr.137323.112 [DOI] [PMC free article] [PubMed] [Google Scholar]
- 33. Kircher M, Witten DM, Jain P, O'Roak BJ, Cooper GM, Shendure J. A general framework for estimating the relative pathogenicity of human genetic variants. Nat Genet. 2014;46:310–315. doi: 10.1038/ng.2892 [DOI] [PMC free article] [PubMed] [Google Scholar]
- 34. McLaren W, Gil L, Hunt SE, Riat HS, Ritchie GR, Thormann A, Flicek P, Cunningham F. The Ensembl variant effect predictor. Genome Biol. 2016;17:122. doi: 10.1186/s13059-016-0974-4 [DOI] [PMC free article] [PubMed] [Google Scholar]
- 35. Consortium G. Human genomics . The genotype‐tissue expression (GTEx) pilot analysis: multitissue gene regulation in humans. Science. 2015;348:648–660. doi: 10.1126/science.1262110 [DOI] [PMC free article] [PubMed] [Google Scholar]
- 36. Consortium G . The GTEx consortium atlas of genetic regulatory effects across human tissues. Science. 2020;369:1318–1330. doi: 10.1126/science.aaz1776 [DOI] [PMC free article] [PubMed] [Google Scholar]
- 37. Giambartolomei C, Vukcevic D, Schadt EE, Franke L, Hingorani AD, Wallace C, Plagnol V. Bayesian test for colocalisation between pairs of genetic association studies using summary statistics. PLoS Genet. 2014;10:e1004383. doi: 10.1371/journal.pgen.1004383 [DOI] [PMC free article] [PubMed] [Google Scholar]
- 38. Buniello A, MacArthur JAL, Cerezo M, Harris LW, Hayhurst J, Malangone C, McMahon A, Morales J, Mountjoy E, Sollis E, et al. The NHGRI‐EBI GWAS catalog of published genome‐wide association studies, targeted arrays and summary statistics 2019. Nucleic Acids Res. 2019;47:D1005–D1012. doi: 10.1093/nar/gky1120 [DOI] [PMC free article] [PubMed] [Google Scholar]
- 39. Kamat MA, Blackshaw JA, Young R, Surendran P, Burgess S, Danesh J, Butterworth AS, Staley JR. PhenoScanner V2: an expanded tool for searching human genotype‐phenotype associations. Bioinformatics. 2019;35:4851–4853. doi: 10.1093/bioinformatics/btz469 [DOI] [PMC free article] [PubMed] [Google Scholar]
- 40. Ghoussaini M, Mountjoy E, Carmona M, Peat G, Schmidt EM, Hercules A, Fumis L, Miranda A, Carvalho‐Silva D, Buniello A, et al. Open targets genetics: systematic identification of trait‐associated genes using large‐scale genetics and functional genomics. Nucleic Acids Res. 2021;49:D1311–D1320. doi: 10.1093/nar/gkaa840 [DOI] [PMC free article] [PubMed] [Google Scholar]
- 41. Mountjoy E, Schmidt EM, Carmona M, Schwartzentruber J, Peat G, Miranda A, Fumis L, Hayhurst J, Buniello A, Karim MA, et al. An open approach to systematically prioritize causal variants and genes at all published human GWAS trait‐associated loci. Nat Genet. 2021;53:1527–1533. doi: 10.1038/s41588-021-00945-5 [DOI] [PMC free article] [PubMed] [Google Scholar]
- 42. Gauderman WJ. Sample size requirements for matched case‐control studies of gene‐environment interaction. Stat Med. 2002;21:35–50. doi: 10.1002/sim.973 [DOI] [PubMed] [Google Scholar]
- 43. Larsson SC, Drca N, Michaëlsson K. Serum magnesium and calcium levels and risk of atrial fibrillation. Circ Genom Precis Med. 2019;12:e002349. doi: 10.1161/CIRCGEN.118.002349 [DOI] [PubMed] [Google Scholar]
- 44. Noordam R, Bos MM, Wang H, Winkler TW, Bentley AR, Kilpeläinen TO, de Vries PS, Sung YJ, Schwander K, Cade BE, et al. Multi‐ancestry sleep‐by‐SNP interaction analysis in 126,926 individuals reveals lipid loci stratified by sleep duration. Nat Commun. 2019;10:5121. doi: 10.1038/s41467-019-12958-0 [DOI] [PMC free article] [PubMed] [Google Scholar]
- 45. Yengo L, Vedantam S, Marouli E, Sidorenko J, Bartell E, Sakaue S, Graff M, Eliasen AU, Jiang Y, Raghavan S, et al. A saturated map of common genetic variants associated with human height. Nature. 2022;610:704–712. doi: 10.1038/s41586-022-05275-y [DOI] [PMC free article] [PubMed] [Google Scholar]
- 46. Bonder MJ, Luijk R, Zhernakova DV, Moed M, Deelen P, Vermaat M, van Iterson M, van Dijk F, van Galen M, Bot J, et al. Disease variants alter transcription factor levels and methylation of their binding sites. Nat Genet. 2017;49:131–138. doi: 10.1038/ng.3721 [DOI] [PubMed] [Google Scholar]
- 47. Gaunt TR, Shihab HA, Hemani G, Min JL, Woodward G, Lyttleton O, Zheng J, Duggirala A, McArdle WL, Ho K, et al. Systematic identification of genetic influences on methylation across the human life course. Genome Biol. 2016;17:61. doi: 10.1186/s13059-016-0926-z [DOI] [PMC free article] [PubMed] [Google Scholar]
- 48. Võsa U, Claringbould A, Westra HJ, Bonder MJ, Deelen P, Zeng B, Kirsten H, Saha A, Kreuzhuber R, Yazar S, et al. Large‐scale cis‐ and trans‐eQTL analyses identify thousands of genetic loci and polygenic scores that regulate blood gene expression. Nat Genet. 2021;53:1300–1310. doi: 10.1038/s41588-021-00913-z [DOI] [PMC free article] [PubMed] [Google Scholar]
- 49. Sung YJ, Winkler TW, de Las FL, Bentley AR, Brown MR, Kraja AT, Schwander K, Ntalla I, Guo X, Franceschini N, et al. A large‐scale multi‐ancestry genome‐wide study accounting for smoking behavior identifies multiple significant loci for blood pressure. Am J Hum Genet. 2018;102:375–400. doi: 10.1016/j.ajhg.2018.01.015 [DOI] [PMC free article] [PubMed] [Google Scholar]
- 50. Malik U, Zafar S, Younas N, Zerr I, Javed A. Unveiling the physical and functional niches of FAM26F by analyzing its subcellular localization and novel interacting partners. ACS Omega. 2020;5:22008–22020. doi: 10.1021/acsomega.0c01249 [DOI] [PMC free article] [PubMed] [Google Scholar]
- 51. Arking DE, Pulit SL, Crotti L, van der Harst P, Munroe PB, Koopmann TT, Sotoodehnia N, Rossin EJ, Morley M, Wang X, et al. Genetic association study of QT interval highlights role for calcium signaling pathways in myocardial repolarization. Nat Genet. 2014;46:826–836. doi: 10.1038/ng.3014 [DOI] [PMC free article] [PubMed] [Google Scholar]
- 52. Grandi E, Pasqualini FS, Pes C, Corsi C, Zaza A, Severi S. Theoretical investigation of action potential duration dependence on extracellular Ca2+ in human cardiomyocytes. J Mol Cell Cardiol. 2009;46:332–342. doi: 10.1016/j.yjmcc.2008.12.002 [DOI] [PubMed] [Google Scholar]
- 53. Mellor GJ, Panwar P, Lee AK, Steinberg C, Hathaway JA, Bartels K, Christian S, Balaji S, Roberts JD, Simpson CS, et al. Type 8 long QT syndrome: pathogenic variants in CACNA1C‐encoded Cav1.2 cluster in STAC protein binding site. Europace. 2019;21:1725–1732. doi: 10.1093/europace/euz215 [DOI] [PubMed] [Google Scholar]
- 54. Chazin WJ, Johnson CN. Calmodulin mutations associated with heart arrhythmia: a status report. Int J Mol Sci. 2020;21:21. doi: 10.3390/ijms21041418 [DOI] [PMC free article] [PubMed] [Google Scholar]
- 55. Hamilton S, Terentyev D. Altered intracellular calcium homeostasis and arrhythmogenesis in the aged heart. Int J Mol Sci. 2019;20:20. doi: 10.3390/ijms20102386 [DOI] [PMC free article] [PubMed] [Google Scholar]
- 56. Sun D, Richard M, Musani SK, Sung YJ, Winkler TW, Schwander K, Chai JF, Guo X, Kilpeläinen TO, Vojinovic D, et al. Multi‐ancestry genome‐wide association study accounting for gene‐psychosocial factor interactions identifies novel loci for blood pressure traits. HGG Adv. 2021;2:2. doi: 10.1016/j.xhgg.2020.100013 [DOI] [PMC free article] [PubMed] [Google Scholar]
- 57. Wang X, Pham DT, Westerman KE, Pan C, Manning AK, Chen H. Genomic summary statistics and meta‐analysis for set‐based gene‐environment interaction tests in large‐scale sequencing studies. medRxiv 2022:2022.2005.2008.22274819. doi: 10.1101/2022.05.08.22274819. [DOI]
Associated Data
This section collects any data citations, data availability statements, or supplementary materials included in this article.
Supplementary Materials
Data S1
Data Availability Statement
Summary statistics from the single‐stage SNV‐by‐calcium interaction analysis for QT and JT intervals will be made available on the National Human Genome Research Institute‐European Bioinformatics Institute Catalog of human GWASs website, https://www.ebi.ac.uk/gwas/.