Abstract
Background
Alternative mRNA splicing of αi2, a heterotrimeric G protein α subunit, has been shown to produce an additional protein, termed sαi2. In the sαi2 splice variant, 35 novel amino acids replace the normal C-terminal 24 amino acids of αi2. Whereas αi2 is found predominantly at cellular plasma membranes, sαi2 has been localized to intracellular Golgi membranes, and the unique 35 amino acids of sαi2 have been suggested to constitute a specific targeting signal.
Results
This paper proposes and examines an alternative hypothesis: disruption of the normal C-terminus of αi2 produces an unstable protein that fails to localize to plasma membranes. sαi2 is poorly expressed upon transfection of cultured cells; however, radiolabeling indicated that αi2 and sαi2 undergo myristoylation, a co-translational modification, equally well suggesting that protein stability rather than translation is affected. Indeed, pulse-chase analysis indicates that sαi2 is more rapidly degraded compared to αi2. Co-expression of βγ rescues PM localization and increases expression of sαi2. In addition, αi2A327S, a mutant previously shown to be unstable and defective in guanine-nucleotide binding, and αi2(1–331), in which the C-terminal 24 amino acids of αi2 are deleted, show a similar pattern of subcellular localization as sαi2 (i.e., intracellular membranes rather than plasma membranes). Finally, sαi2 displays a propensity to localize to potential aggresome-like structures.
Conclusions
Thus, instead of the novel C-terminus of sαi2 functioning as a specific Golgi targeting signal, the results presented here indicate that the disruption of the normal C-terminus of αi2 causes mislocalization and rapid degradation of sαi2.
Background
Heterotrimeric G proteins couple agonist-activated heptahelical receptors to a variety of effector responses. For the most part, this signaling activity takes place at the plasma membranes of cells. However, G proteins have been detected at a variety of subcellular locations and have been implicated in numerous membrane trafficking activities [1,2]. This suggests that distinct, though not yet determined, mechanisms exist to target G protein subunits to subcellular locations other than plasma membranes (PM). Furthermore, post-transcriptional or post-translational modifications may play a role in directing a G protein subunit to a specific intracellular location.
Unique subcellular localization has been observed for a novel alternative spliced form of the G protein α subunit (Gα), αi2[3]. This αi2 splice variant, termed sαi2, contains a novel 35 amino acid sequence that replaces the C-terminal 24 amino acids of αi2[3]. sαi2 has been observed to localize to Golgi membranes and other intracellular membranes [3,4]; in contrast, wild type αi2 is typically found at PM. Based on this unique localization of sαi2, a prominent role in membrane trafficking has been proposed for this subunit [3]. However, no report to date has supported a functional role for sαi2 in vesicular transport, although a variety of functional assays have implicated other Gα, including αs and αi3, in vesicle trafficking pathways [1,2].
In spite of its unknown functional significance, sαi2 provides a potential model for studying mechanisms of subcellular localization of Gα. Clearly, some aspect of the novel splicing is responsible for the difference in subcellular targeting of sαi2 (i.e., Golgi and intracellular membranes) compared to wild type αi2 (i.e., PM). To address the mechanism of subcellular localization of sαi2, two hypotheses were tested herein. First, the possibility was tested that the novel 35 amino acid sequence found at the C-terminus of sαi2 functions as a specific Golgi or intracellular membrane targeting motif. A second possibility was suggested by considering the location of the splice site. Several studies have shown that deletions or amino acid substitutions in the extreme C-terminal region of Gα creates a protein defective in guanine-nucleotide binding [5-10]. Rapid release of guanine-nucleotides can result in an unstable Gα [9,10]. This leads to the prediction that sαi2 is also unstable due to a disruption in the structure of its C-terminus caused by the novel splice sequence. Thus, the second possibility is that failure of sαi2 to localize at the PM but instead localize at intracellular membranes is the result of a general defect in protein stability. Results presented herein are consistent with this second hypothesis.
Results
αi2 and sαi2 differ only at their extreme C-termini. Alternative splicing results in a novel 35 amino acids in sαi2 that replace the C-terminal 24 amino acids of αi2 (Figure 1). In the studies presented here, both αi2 and sαi2 contain an internal EE epitope, as used previously for αi2[11,12]. The use of the EE epitope allows the direct comparison of subcellular localization and expression of αi2 and sαi2, and facilitates immunoprecipitation of the two expressed proteins. This is essential since suitable antibodies to detect and immuno-isolate sαi2 are not readily available. Attempts to use a previously described polyclonal antibody directed against the C-terminus of sαi2[3,4] were unsatisfactory in our hands. In particular, attempts to detect endogenous sαi2 by immunofluorescence failed due to faint detection that showed drastically different patterns of staining depending upon fixation technique.
Figure 1.

C-termini of G protein α subunits An alignment of C-terminal amino acids of selected Gα is shown. The arrow indicates the site at which a novel 35 amino acids in sαi2 replaces the C-terminal 24 amino acids of αi2. Amino acid numbering is indicated in parentheses. Secondary structure is indicated at the bottom [19].
The subcellular localization of expressed αi2 and sαi2 was compared in COS and BHK cells (Figure 2). In both cell types, αi2 was detected at cellular plasma membranes as highlighted by bright staining at the cell periphery (Figure 2A and 2C). In contrast, sαi2 was not detected at plasma membranes, but instead typically displayed an intracellular and perinuclear staining pattern (Figure 2B and 2D), consistent with localization to intracellular membranes as previously described [3,4]. The subcellular localization of sαi2 showed overlap in immunofluorescent staining with the Golgi protein, β-COP (Figure 3A and 3B) and the endoplasmic reticulum protein PDI (Figure 3C and 3D); localization of sαi2 exclusively to Golgi was not observed, even at the lowest levels of detection. Subcellular fractionation confirmed that sαi2 was localized, at least partly, to membranes (Figure 2E). After lysis of cells in hypotonic buffer followed by high-speed centrifugation, αi2 was found predominantly in the particulate fraction from COS (Figure 2E, lanes 3 and 4) or BHK cells (Figure 2E, lanes 9 and 10). A majority of sαi2 was also detected in the particulate fraction from both COS (Figure 2E, lanes 5 and 6) and BHK cells (Figure 2E, lanes 11 and 12), although some was also found in the soluble fraction. As a comparison, a non-palmitoylated mutant of αq, in which cysteines 9 and 10 have been substituted with serines, is found predominantly in the soluble fraction (Figure 2E, lanes 7 and 8), as described previously [13]. Surprisingly, in comparison to αi2, sαi2 was always detected in fewer cells, by immunofluorescence analysis, and showed lower levels of protein expression, by western blot analysis of subcellular fractions (Figure 2E) or whole cell lysates (not shown). These expression differences suggested that sαi2 was either less efficiently expressed or more rapidly degraded compared to αi2, as described below.
Figure 2.
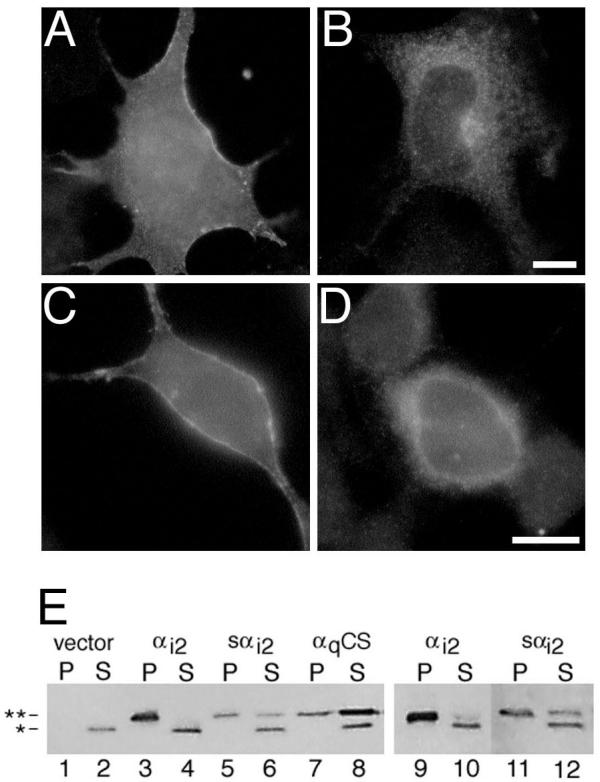
Localization of αi2 and sαi2 Expression vectors encoding αi2 (A and C) or sαi2 (B and D) were transiently transfected into COS-7 (A and B) or BHK (C and D) cells. Subcellular localization of the proteins was visualized by immunofluorescence microscopy using the EE monoclonal antibody followed by a Texas Red conjugated anti-mouse antibody, as described in "Materials and Methods". Bar, 10 μm. E, pcDNA3 (lanes 1, 2), EE-αi2-pcDNA3 (lanes 3, 4, 9, 10), EE-sαi2-pcDNA3 (lanes 5, 6, 11, 12) or EE-αqC9,10S-pcDNAI were transiently transfected into COS-7 (lanes 1–8) or BHK (lanes 9–12) cells. Cell lysates were separated into particulate (P) and soluble (S) fractions, as described in "Materials and Methods". EE-tagged Gα subunits were detected at 41–45 kDa (double asterisk) by immunoblotting with the EE monoclonal antibody. A slightly smaller protein is consistently detected (denoted by single asterisk) by the EE antibody, and this background band fractionates exclusively to the soluble fraction.
Figure 3.
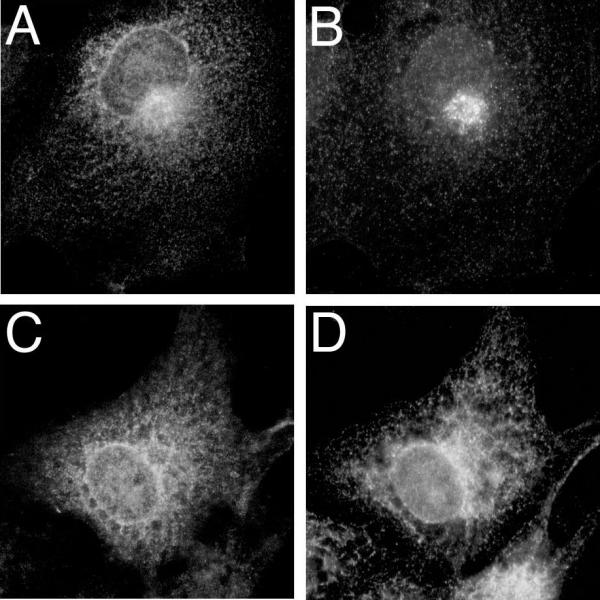
Localization of sαi2 to Golgi and ER membranes sαi2 was expressed in COS-7 cells. 48 h after transfection, cells on coverslips were fixed and processed for immunofluorescence. Co-localization of sαi2 (A) and the Golgi protein, β-COP (B), was visualized after incubation of cells with the EE antibody and a rabbit polyclonal anti-β-COP antibody followed by Alexa 594 anti-mouse and Alexa 488 anti-rabbit antibodies. Co-localization of sαi2 (C) and the endoplasmic reticulum protein, protein disulfide isomerase (PDI) (D), was visualized after incubation of cells with the EE antibody and a rabbit polyclonal anti-PDI antibody followed by Alexa 594 anti-mouse and Alexa 488 anti-rabbit antibodies.
The C-terminal 35 amino acids of sαi2, which replace the C-terminal 24 amino acids of αi2 (Figure 1), have been proposed to function as a Golgi targeting signal [3,4]. To test the potential importance of this C-terminal region in localization of sαi2 to intracellular membranes and prevention of sαi2 from localizing to PM, a deletion mutant of αi2 was constructed consisting of amino acids 1–331. In sαi2, the C-terminal splice occurs just after amino acid 331 (Figure 1), and thus the novel 35 amino acid splice sequence is removed in αi2(1–331). Immunofluorescence microscopy indicates that αi2(1–331) (Figure 4B) displays a subcellular localization pattern very similar to sαi2 (Figure 4A). This result is consistent with the alternative hypothesis that a disruption of αi2 at the C-terminus creates a protein unable to localize at the PM.
Figure 4.
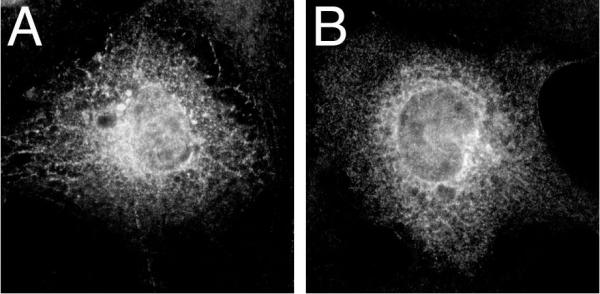
Localization of sαi2 and αi2(1–331) Expression vectors encoding sαi2 (A) or αi2(1–331) (B) were transiently transfected into COS-7 cells. 48 h after transfection, subcellular localization of the proteins was visualized by immunofluorescence microscopy using the EE monoclonal antibody followed by Alexa 594 anti-mouse antibody, as described in "Materials and Methods".
If the unique C-terminal 35 amino acid sequence of sαi2 functions as a Golgi targeting signal, it is important to test whether it is sufficient to target a heterologous protein to intracellular membranes. When the 35 amino acid sequence was fused to the C-terminus of GFP (GFP-sαi235aa), this unique sαi2 sequence failed to direct GFP to intracellular membranes (Figure 5B); GFP-sαi235aa was diffusely distributed throughout the cytoplasm and nucleus, similar to what is observed for GFP alone (Figure 5A). On the other hand, when the first ten amino acids of αi2 are fused to GFP to create αi2(1-10)-GFP, fluorescence is detected strongly at the PM (Figure 5C), indicating the N-terminus of αi2, which contains the sites for myristoylation and palmitoylation [14], can be sufficient for directing PM localization of a normally cytosolic protein. In agreement with these results, the sαi2 C-terminal sequence failed to redirect the localization of a secreted or a nuclear protein [4]. Thus, not only is the unique sαi2 sequence unable to override other localization signals, it is unable to target a cytoplasmic protein to intracellular membranes. These results are consistent with a lack of a specific role for the sαi2 sequence in Golgi membrane targeting.
Figure 5.
C-terminal 35 amino acids of sαi2 do not affect GFP localization Expression vectors encoding GFP (A), GFP-sαi235aa (B), or αi2(1-10)-GFP (C) were transfected into HEK293 cells. 48 h after transfection, cells were fixed on coverslips, and subcellular localization was determined by fluorescence microscopy visualization of GFP.
The above experimental results failed to support the hypothesis that the unique 35 amino acid sequence from sαi2 serves as a specific Golgi or intracellular membrane targeting motif. Thus, the following experiments concentrated on addressing the alternative hypothesis: sαi2 is unstable and rapidly degraded due to disruptions in the C-terminus, and such instability results in a failure of sαi2 to reach its proper place at the PM.
The ability of αi2 and sαi2 to undergo N-terminal lipid modifications was compared. Myristoylation occurs co-translationally at the extreme N-terminal glycine, while palmitoylation occurs post-translationally at a cysteine immediately after the myristoylated glycine [15]. The subcellular site where palmitoylation occurs has not been well defined, although in one model palmitoylation occurs at the PM [16]. Cells expressing αi2 or sαi2 were metabolically labeled with 3H-palmitate or 3H-myristate. αi2 and sαi2 were immunoprecipitated from cell extracts, and incorporation of radio-label was analyzed by SDS-PAGE followed by fluorography (Figure 6A). No palmitoylation of sαi2 was detected (Figure 6A, lane 3), although αi2 was strongly palmitoylated (Figure 6A, lane 2). In contrast, both αi2 and sαi2 incorporated similar levels or myristate (Figure 6A, lanes 5 and 6). The similar level of myristoylation was particularly surprising since total sαi2 protein was much lower than αi2 as determined by immunoblotting of the immunoprecipitates (Figure 6B, compare lanes 5 and 6). Myristoylation is a co-translational modification, and levels of radio-labeling should thus reflect synthesis of new protein. Accordingly, the myristoylation results (Figure 6A and 6B, lanes 5 and 6) strongly suggested that αi2 and sαi2 are translated equally well, as evidenced by similar levels of radiolabeled myristate incorporation during the labeling period, but sαi2 is more rapidly degraded, as seen by reduced steady-state levels of immunoprecipitated protein. The lack of palmitoylation of sαi2 is consistent with at least two, not necessarily mutually exclusive, possibilities. sαi2 may fail to undergo palmitoylation because it is not stable long enough for post-translational palmitoylation to occur or because it fails to reach a PM site of palmitoylation. Alternatively, the novel C-terminal sequence of sαi2 may somehow prevent direct recognition by a palmitoyl transferase.
Figure 6.
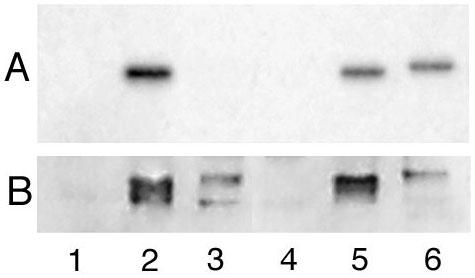
Myristoylation and palmitoylation of αi2 and sαi2 COS-7 cells were transfected with pcDNA3 (lanes 1 and 4), or pcDNA3 containing αi2 (lanes 2 and 5) or sαi2 (lanes 3 and 6). 48 h after transfection, cells were incubated with 1.0 mCi/ml 3H-palmitate (lanes 1–3) or 0.5 mCi/ml 3H-myristate (lanes 4–6) for 2 h. Following immunoprecitation with the EE antibody, duplicate samples were resolved by SDS-PAGE. Radiolabeled proteins were visualized by fluorography (panel A), and immunoblotting with the EE antibody provides a comparison of protein levels of αi2 and sαi2 (panel B).
Cells expressing high levels of sαi2, and to a much lesser extent αi2, often displayed very bright intracellular accumulations of sαi2 as visualized by immunofluorescence. These large spots were reminiscent of recently described aggresomes, accumulations of misfolded protein that are being targeted for proteasome-dependent degradation [17,18]. This observation suggested the possibility that intracellular localization of sαi2 may reflect targeting to a proteasome-dependent degradative pathway. To test this idea further, cells expressing αi2 or sαi2 were treated with the proteasome inhibitor acetyl-leucyl-leucyl-norleucinal (ALLN) and changes in localization of the α subunit were analyzed by immunofluorescence (Figure 7). After 1h treatment with ALLN, αi2 localization is relatively unaffected (Figure 7C), but sαi2 begins to show a slight increase in distinct intracellular accumulations (Figure 7D). At 4 h ALLN treatment, many cells expressing αi2 display a decrease in PM localization and an increase in intracellular staining (Figure 7E). αi2 is typically seen in large bright spots and in a perinuclear/intracellular membrane staining pattern after incubation of cells for 4 h with ALLN. In fact, the localization pattern of αi2 after 4 h incubation with ALLN (Figure 7E) is similar to the observed localization of sαi2 in the absence or presence of ALLN treatment (Figure 7B, 7D, and 7F). At 8 h treatment with ALLN, both αi2 (Figure 7G) and sαi2 (Figure 7H) are detected almost exclusively as a large bright spot in each expressing cell. Similar results were obtained using another proteasome inhibitor, MG-132. Interestingly, ALLN treatment was relatively ineffective at promoting accumulation of overexpressed αs in aggresome-like structures (not shown). Thus, the results of Figure 7 are consistent with the proposal that the intracellular localization of sαi2 is due to its targeting to a degradative pathway, a pathway shared by αi2.
Figure 7.
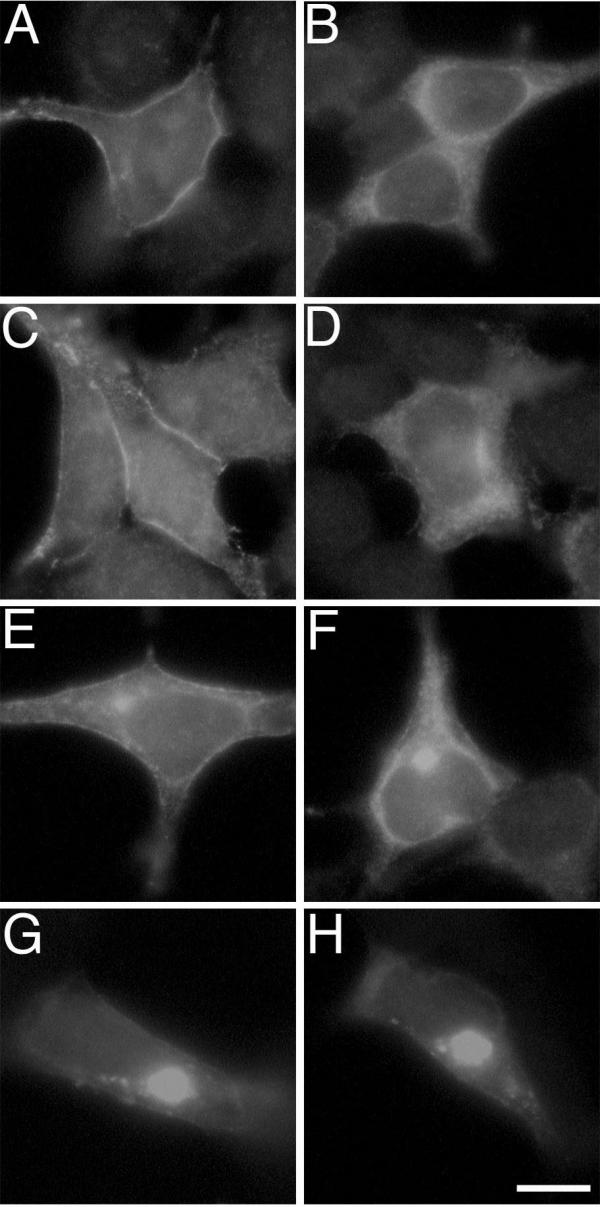
Effect of ALLN on αi2 and sαi2 localization αi2 (A, C, E, and G) or sαi2 (B, D, F, and H) was expressed in BHK cells. 48 h after transfections cells were incubated in the absence (A and B) or presence of 20 μg/ml ALLN for 1 h (C and D), 4 h (E and F), or 8 h (G and H). Cells were fixed and processed for immunofluorescence using the EE antibody followed by an Alexa 488 conjugate anti-mouse antibody. Bar, 10 μm.
The subcellular localization of sαi2 was compared to αi2A327S. This alanine to serine mutation in the C-terminal region of αi1 (A326S) and αs (A366S) has been shown to greatly accelerate GDP release, to accelerate irreversible inactivation in vitro, and to cause rapid turnover of the α subunit in cultured cells [9,10]. Thus, if the observed intracellular localization of sαi2 is caused by instability of the protein due to disruptions at its C-terminus, then it follows that αi2A327S should show a similar pattern of localization. Indeed, immunofluorescence microscopy revealed a pronounced intracellular distribution for αi2A327S (Figure 8E). In addition to intracellular membrane localization similar to sαi2 (Figure 8C), αi2A327S was detected weakly but consistently at the PM. It seems likely that the C-terminal disruption of sαi2 (replacing the 24 C-terminal amino acids) is a more severe disruption than the A327S substitution. Thus, the similarity in localization of sαi2 and αi2A327S bolsters the idea that mislocalization of sαi2 is caused by its inherent instability.
Figure 8.
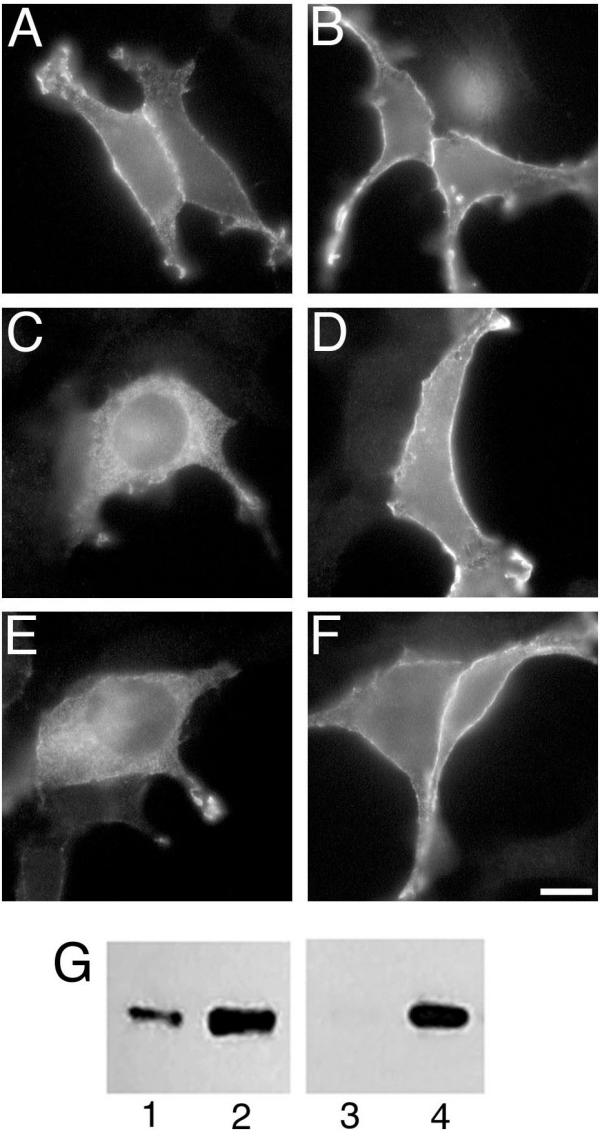
Localization of αi2, sαi2, and αi2A327S and the effect of βγ Expression vectors encoding αi2 (A and B), sαi2 (C and D), or αi2A327 (E and F) were transfected alone (A, C, and E) or together with expression vectors for β1 and γ2 (B, D, and F) into BHK cells. Proteins were visualized by immunofluorescence microscopy using the EE monoclonal antibody followed by an Alexa 488 conjugate anti-mouse antibody. Bar, 10 μm. G, EE-αi2-pcDNA3 (lanes 1 and 2) or EE-sαi2-pcDNA3 (lanes 3 and 4) were transfected into COS-7 cells alone (lanes 1 and 3) or with co-transfection of vectors encoding β1 and γ2 (lanes 2 and 4). Immunoblotting with the EE antibody detected αi2 or sαi2. Note that sαi2 expressed alone (lane 3) is very weakly detected and barely visible in this total cell lysate.
G protein βγ subunits can stabilize wild type and alanine to serine mutant α subunits in vitro[10]. Thus, the effect of βγ co-expression on subcellular localization of αi2A327S and sαi2 was tested. αi2 localizes to the PM efficiently when expressed alone (Figure 8A) or when co-expressed with βγ (Figure 8B). sαi2 shows a dramatic change in localization when co-expressed with βγ (Figure 8D), displaying strong PM staining. Not only is sαi2 targeted efficiently to the PM when co-expressed with βγ, but βγ co-expression increases overall levels of transiently expressed sαi2 and αi2, as determined by immunoblotting (Figure 8G), and increases the number of cells expressing sαi2, as observed by immunofluorescence microscopy (not shown). Similarly, co-expression of βγ efficiently promotes PM localization of αi2A327S (Figure 8F).
The analysis of the effect of βγ was extended by examining the localization of αi2 or sαi2 after co-transfection with βγ and after treatment with ALLN. In contrast to Figure 7, a marked difference was observed between αi2 and sαi2 after ALLN treatment. When βγ is co-expressed with αi2, PM localization of αi2 is observed, as shown in Figure 8B, and incubation with ALLN for 8 h shows little effect on PM localization of αi2 (Figure 9A). When βγ is co-expressed with sαi2, PM localization of sαi2 is observed, as shown in Figure 8D, but incubation with ALLN for 8 h causes an increase in bright intracellular accumulations of sαi2 (Figure 9B). Taken together, results with βγ co-expression are consistent with the ability of βγ to promote PM targeting of Gα, and further suggest that sαi2 is less effectively stabilized than αi2 by βγ, as evidenced by ALLN-induced accumulation in intracellular aggregates (Figure 9B).
Figure 9.
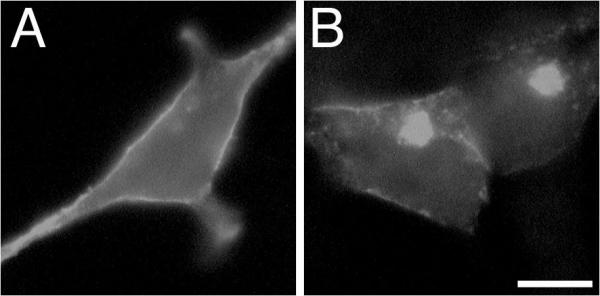
Effect of ALLN on αi2 and sαi2 localization when co-expressed with βγ Expression vectors encoding αi2 (A) or sαi2 (B) were transfected together with expression vectors for β1 and γ2 into BHK cells. 48 h after transfections cells were incubated in the presence of 20 μg/ml ALLN for 8 h. Cells were fixed and processed for immunofluorescence using the EE antibody followed by an Alexa 594 conjugate anti-mouse antibody. Bar, 10 μm.
Lastly, 35S-methionine pulse-chase labeling studies directly confirmed that sαi2 was more rapidly degraded than αi2 (Figure 10). After transient expression of the α subunits, cellular proteins were radiolabeled with a brief pulse of 35S-methionine followed by a chase. Immunoprecipitation of the α subunit after increasing times of chase, followed by SDS-PAGE and fluorography revealed that radiolabeled sαi2 was rapidly lost. αi2 consistently displayed a 3–4 fold longer half-life compared to sαi2, while αi2A327S was intermediate. In the experiment presented in Figure 10, the t1/2 was determined to be approximately 90, 180, and 360 min for sαi2, αi2A327S, and αi2, respectively. Although this trend was consistent, the exact t1/2 showed some variability from experiment to experiment, probably due to varying levels of transient overexpression. It is likely that the difference in turnover of sαi2 and αi2 is even more profound when the proteins are expressed at lower levels. Consistent with this idea, sαi2 was refractory to stable expression even though cells stably expressing αi2 were easily selected (not shown). The inability to isolate cells stably expressing sαi2 can be attributed to its rapid degradation. Regardless, 35S-methionine pulse-chase labeling studies (Figure 10) demonstrate that sαi2 is indeed more rapidly degraded than αi2.
Figure 10.
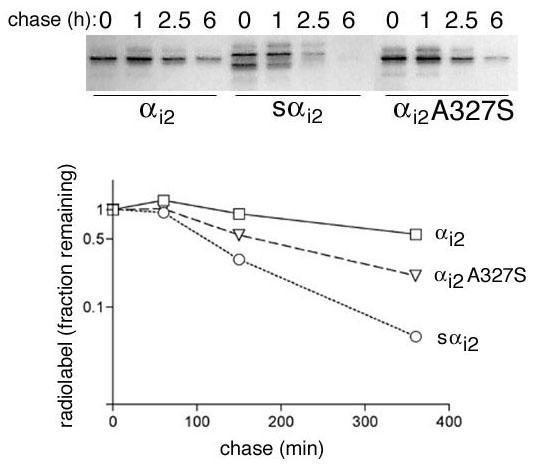
Pulse-chase analysis of αi2, sαi2, and αi2A327S Expression vectors encoding αi2, sαi2, or αi2A327 were transfected into COS-7 cells. 48 h after transfection, cells were incubated for 10 min in media containing 0.1 mCi/ml 35S Express protein labeling mix. Cells were washed, and incubated in regular media for the indicated times (chase). Cells were harvested, lysates were prepared, and immunoprecipitations were performed using the EE antibody. Samples were resolved by SDS-PAGE, and radiolabeled proteins were visualized by fluorography (upper panel). Note that two bands are present in the sαi2 lanes; the upper band represents full-length sαi2 and quantitation of this band was used to determine a half-life. The lower band likely represents a degradation product of sαi2 that is itself degraded even faster. Quantitation of the bands from the fluorograph was performed by densitometry and plotted as degradation curves (lower panel) for αi2 (□), sαi2 (O), and αi2A327 (∇). These experiments were repeated and the average ± S.E. half-life was determined as 237 ± 110, 150 ± 42, and 67 ± 21 min for αi2 (n = 3), αi2A327 (n = 2), and sαi2 (n = 3), respectively.
Discussion
In addition to their well characterized role at the PM in coupling activated GPCRs to effector proteins, heterotrimeric G proteins have been implicated in a variety of other cellular functions, including membrane trafficking pathways. A splice variant of αi2, termed sαi2, has been proposed as a candidate to regulate vesicle transport due to its localization at intracellular membranes. The studies described in this report were undertaken to define mechanisms that underlie subcellular localization of sαi2. The novel 35 amino acids found in sαi2 appear not to function as a specific Golgi or endoplasmic reticulum targeting sequence. Instead, the results in this study support the proposal that sαi2 fails to target to the PM because it is an unstable protein. The following results support this hypothesis: 1) sαi2 and αi2 are equally labeled by a pulse of 3H-myristate, although much less sαi2 protein is detected; 2) sαi2 displays a propensity to localize to potential aggresome-like structures, and this localization is greatly enhanced by proteasome inhibitor treatment; 3) the αi2A327S mutant, previously shown to be unstable and defective in guanine-nucleotide binding, shows a similar pattern of subcellular localization (i.e., intracellular membranes rather than PM); 4) βγ over-expression increases expression of sαi2 and promotes PM localization of sαi2 and αi2A327S, but βγ co-expression does not prevent sαi2 localization to potential aggresome-like structures when cells are treated with proteasome inhibitors; and 5) pulse-chase analysis indicates that sαi2 is rapidly degraded.
A number of reports have demonstrated that disruptions in the C-termini of Gα cause reduced affinity for guanine-nucleotides and protein instability. The C-terminal 30 amino acids of Gα consist of the β6-α5 loop, followed by the α5 helix and finally several amino acids of flexible structure (Figure 1) [19-21]. The β6-α5 loop stabilizes the guanine ring of bound GDP or GTP, and mutations in this region affect guanine-nucleotide binding. The A326S mutation of αi1 and A366S mutation of αs (cognate to the αi2A327S used in this study) were shown to cause greatly decreased affinity for GDP [9,10]. Defective binding of GDP leads to more Gα in the empty state (no bound guanine-nucleotide), and this form of Gα is rapidly denatured in vitro, as shown for αsA366S and αi1A326S [9,10]. Moreover, αsA366S was demonstrated to undergo rapid degradation (t1/2 < 1 h) in stably transfected cells [9]. The same mutation in αt has also been shown to greatly decrease guanine-nucleotide binding [5,22]. Additional amino acids in the critical β6-α5 loop are important for maintaining Gα integrity [7].
Although the α5 helix (Figure 1) does not directly contact the bound guanine-nucleotide [19-21], it is clearly important for Gα structure and to maintain the proper orientation of the β6-α5 loop. A recent study identified a number of α5 helix residues in αt that when changed to alanines increased rates of guanine-nucleotide exchange (i.e., decreased affinity for guanine-nucleotides) [5]. Individual mutation of amino acids in αt, cognate to T330, N332, V333, F337 in αi2 (Figure 1), increased nucleotide exchange rates [5]. Two of these critical amino acids, N332 and V333 in αi2, are in fact the first two amino acids that are replaced by the novel splicing in sαi2 (Figure 1). Thus, one might speculate that the novel 35 amino acid sequence in sαi2 would impair guanine-nucleotide binding and result in a unstable protein. Unfortunately, initial attempts to directly show a defect in guanine-nucleotide binding by sαi2, using a GTPγ S-dependent trypsin protection assay [23], were unsuccessful due, at least in part, to the inability to solubilize expressed sαi2 from membranes using a mild detergent (e.g., lubrol/polyoxyethylene 10-lauryl ether).
The data in this report are consistent with a scenario in which intracellular Golgi/ER localization of sαi2 reflects its rapid degradation rather than specific targeting to a subcellular organelle. Particularly compelling is the similarity in subcellular localization of αi2A327S and sαi2 (Figure 8). In addition, the use of proteasome inhibitors (Figures 7 and 9) suggest that sαi2 is degraded by a proteasome pathway. The observed intracellular membrane (ER) localization and proteasome inhibitor-induced juxtanuclear aggregate accumulation (aggresome) is consistent with that reported for other proteins being degraded by such a pathway [18,24]. When treated with proteasome inhibitors, overexpressed wild type αi2 also accumulates in aggresome-like structures (Figure 7), suggesting that Gα may normally be degraded by a proteasome-dependent pathway. However, over-expression of βγ prevents ALLN-induced juxtanuclear accumulations of αi2 but not sαi2 (Figure 9). Although little is known regarding degradative pathways for G proteins, sαi2 and other mutants (e.g., αi2A327S) may be valuable tools for defining such pathways.
The data presented here argue against a sequence specific Golgi membrane targeting function for the novel 35 amino acid sequence found in sαi2. The novel sequence of sαi2 is not sufficient to direct other proteins to Golgi/ER membranes. These 35 amino acids did not change the cytoplasmic localization of GFP (Figure 5). Similarly, a recent report showed that the sαi2 35 amino acids were unable to retain a secreted protein in intracellular membranes and did not affect localization of a nuclear protein [4]. However, in addition to causing rapid degradation, one cannot rule out that the 35 amino acid sequence of sαi2 functions somehow as part of a Golgi targeting motif in the context of other regions of αi2, as suggested [4]. Other researchers have described a specific Golgi membrane localization of sαi2[4]; in contrast, the results presented in this report always show a much more disperse subcellular localization of sαi2 to intracellular membranes consistent with staining of both Golgi and ER. The reason for this difference in localization is unclear. Interestingly, in the other study, the authors found that deletion of a proline-rich sequence corresponding to sαi2 amino acids 348–359 (Figure 1) changed localization of sαi2 from Golgi membranes to a more diffuse localization throughout intracellular membranes [4]. However, mutation of proline residues to alanines failed to affect sαi2 localization [4]. Thus, little evidence exists to support a specific membrane targeting role for the novel sαi2 sequence.
βγ was able to promote plasma membrane localization of sαi2 (Figure 8). βγ prevents irreversible inactivation of αi1, when measured in vitro at 37°C, and slows the inactivation of αi1A326S [10]. Thus, βγ may stabilize sαi2 and αi2A327S allowing βγ-dependent [25-29] PM localization. These results are also consistent with the possibility that the primary defect in sαi2 is a reduced ability to interact with βγ; Gα containing mutations in known sites of contact with βγ fail to localize to PM, but over-expression of βγ can rescue their PM localization [28,29]. However, the crystal structures [30,31] show that the C-terminal β6-α5 loop/α5 helix region does not directly contact βγ. Thus, it is more likely that indeed sαi2 is deficient in binding to βγ, but this effect is a consequence of its instability. sαi2 may exist in a state that does not interact well with βγ simply because it is in the process of being irreversibly inactivated [9,10]. Similarly, αi2A327S appears not to be defective in its intrinsic ability to interact βγ [10], and co-expression of βγ shifts αi2A327S, like sαi2, from intracellular to plasma membranes (Figure 8).
What is the cellular function of sαi2? The ability of βγ to promote PM localization of sαi2 raises the possibility that endogenous sαi2 is in fact localized to PM where it can interact with GPCRs and effectors. Future studies will test the potential of sαi2, when co-expressed with βγ, to productively interact with receptors and effectors. However, this possibility is viewed as unlikely for several reasons. First, others have shown that in COS-7 cells endogenous sαi2 is not detected at PM but only found intracellularly [3,4], although one cannot rule out that a small but functionally significant fraction of sαi2 reaches the PM. Second, the extreme C-termini of Gα are critical sites for interaction with GPCRs [32], and the novel C-terminal sequence found in sαi2 would be predicted to disrupt productive interactions with GPCRs. Third, even though βγ can promote PM localization of sαi2 in the overexpression system described here, sαi2 remains less stable than αi2 (Figure 9), suggesting that such instability may also impair productive interactions with GPCRs.
On the other hand, unknown protein(s) may function to stabilize sαi2 and help direct it to Golgi membranes. A specific combination of β and γ subtypes may play such a role; however, one thorough study showed a lack of βγ on Golgi membranes of exocrine pancreatic cells even though a variety of Gα were readily detected in the Golgi [33]. Other proteins that may specifically promote the intracellular targeting of Gα have not been identified.
It is possible that sαi2 functions as a short-lived protein regulating some aspect of membrane transport pathways; however, no experiments to directly support or refute this hypothesis have been reported. Instead, it is tempting to speculate that alternative splicing may be a mechanism to regulate cellular levels of αi2. In this model, certain conditions may favor the formation of sαi2 compared to αi2, and the resulting rapid degradation of sαi2 would decrease the cellular content of αi2. A precedent for such alternative splicing-dependent regulation of expression has been described for H-ras [34]. Alternative splicing occurs in H-ras, and the alternative spliced form is predicted to encode an unstable transcript and a protein product that lacks the ability to oncogenically transform cells. A mutation was identified that abolishes the alternatively spliced form, and this mutation leads to an increase in H-ras expression and transforming ability. Thus, it was demonstrated that alternative splicing is a mechanism that cells use to control expression of H-ras [34]. Alternative splicing may similarly play an important role in regulating expression of αi2. Testing of this idea will require a comparison of sαi2 and αi2 transcript levels, and an analysis of whether relative expression is affected in response to physiological changes, such as extracellular stimuli or cell differentiation.
Conclusions
In summary, the results presented here demonstrate that sαi2, a novel splice variant of αi2, is rapidly degraded when expressed in cells. Such instability is consistent with known structure-function data regarding the importance of the C-terminus of Gα subunits. The observed intracellular localization of sαi2 is due, at least in part, to its instability. Moreover, the data presented in this study argue against the novel C-terminus of sαi2 functioning as a specific Golgi targeting motif.
In addition, similarly to sαi2, an αi2 mutant, αi2A327S, previously demonstrated to be unstable in vitro, displays a defect in plasma membrane localization when expressed in cells. These results suggest that both sαi2 and αi2A327S may prove valuable in future studies of mechanisms of degradation of Gα.
Materials and methods
Materials
Cell culture reagents were obtained from Mediatech. [9,10-3H]palmitic acid, [9,10-3H]myristic acid, and 35S Express labeling mix were from NEN. Acetyl-leucyl-leucyl-norleucinal (ALLN) and MG-132 were from Calbiochem. The EE monoclonal antibody was a gift from H. Bourne. Other reagents were obtained from Fisher and Sigma.
Expression plasmids
EE-αi2-pcDNAI was obtained from H. Bourne (UCSF). In this plasmid, mouse αi2 cDNA contains the EE epitope sequence EEYMPTE at codons 166 to 172 [11]. Mouse sαi2 cDNA was provided by E. Borrelli (Strasbourg) in the plasmid pSVsGi2. sαi2 was excised from pSVsGi2 using EcoRI and SmaI and subcloned into the EcoRI and EcoRV sites of pcDNAI to produce sαi2-pcDNAI. EE-tagged sαi2 was constructed by subcloning a EcoRI-BglII fragment from EE-αi2-pcDNAI into sαi2-pcDNAI. EE-tagged αi2A327S-pcDNAI was obtained from J. Morales (UCSF). EE-tagged αi2(1–331)-pcDNA3 was constructed by by PCR amplification of the coding region for the amino acids 1 to 331 of αi2 using the T7 primer as the 5' primer and 5'-ccggctcgagtcacttggtgtcggtggcgcatg-3' as the 3' primer and using EE-αi2-pcDNA3 as the template. The PCR amplified product was digested with HindIII and XhoI and subcloned into the correspondingly digested EE-αi2-pcDNA3. GFP-sαi235aa was constructed by PCR amplification of the coding region for the C-terminal 35 amino acids of sαi2 using the 5' primer 5'-cgcagatctagaaaactttttaga-3' and the 3' primer 5'-cgcaagcttactcaaggcacggaatc-3'. The PCR fragment was digested with BglII and HindIII and subcloned into the correspondingly digested pEGFP-C1 (Clontech). αi2(1-10)-GFP was constructed by annealing the complementary oligonucleotides 5'-ctagcaccatgggctgcaccgtgtcggccgaggacaag-3' and 5'-ccggcttgtcctcggacacggtgcagcccatggtg-3' (corresponding to amino acids 1–10 of αi2) and ligating into AgeI-NheI digested pEGFP-N1. Human β1-pCMV5 and bovine γ2-pcDNAI have been described [35].
Cell culture and transfection
BHK, HEK293, and COS-7 cells were cultured in DMEM containing 10% fetal bovine serum. Transfections were performed in 6-well plates or 6 cm culture dishes using Lipofectamine (GibcoBRL) or FuGene6 (Roche) according to the manufacturer's protocol.
Immunofluorescence localization
Cells were transfected in 6-well plates with 1 μg of the indicated expression plasmid. In experiments where β1 and γ2 expression plasmids were co-transfected with αi2 or sαi2, the amounts of α, β, and γ plasmids used were 0.7, 0.2, and 0.1 μg, respectively. 24 h after transfection, cells were replated onto glass coverslips and grown for an additional 24 h before fixing in methanol at -20°C for 20 min. Cells were washed with PBS and then incubated in blocking buffer consisting of TBS (50 mM Tris, pH 7.5, 150 mM NaCl) with 1% Triton X-100 and 2.5% nonfat milk. Coverslips were then incubated in blocking buffer containing 20 μg/ml EE monoclonal antibody for 1 h. For dual localization experiments, a 1:1000 dilution of a rabbit polyclonal anti-β-coatomer protein (β-COP) antibody (Affinity BioReagents) or a 1:200 dilution of a rabbit polyclonal anti-protein disulfide isomerase (PDI) antibody (StressGen Biotechnologies) was included with the EE mouse monoclonal. Following washes with blocking buffer, cells were incubated in a 1:100 dilution of the indicated secondary antibody, either Alexa Fluor 488 or 594 goat anti-mouse (Molecular Probes) or Texas Red donkey anti-mouse (Jackson Immunoresearch) or Alexa Fluor 488 goat anti-rabbit (Molecular Probes), for 30 min. The coverslips were washed and mounted on glass slides with Prolong Antifade reagent (Molecular Probes, Eugene, OR), and microscopy was performed with an Olympus BX60 microscope equipped with a Sony DKC-5000 digital camera. A minimum of 50 cells were examined for each transfection. Transfections were repeated and representative pictures were taken of cells displaying a typical expression pattern for each transfection. Only cells displaying low to intermediate levels of expression were utilized. Images were processed with Adobe Photoshop.
Subcellular Fractionation
Soluble and particulate fractions were isolated as previously described [29]. BHK or COS-7 cells were transfected in 6 cm plates with 3 μg of the indicated expression plasmid. 24 h after transfection, the cells were transferred to 10-cm plates and grown for another 24 h. Cells were washed with phosphate-buffered saline and then lysed in 0.5 ml hypotonic lysis buffer by 10 passages through a 27-gauge needle. Cells were centrifuged at 200 × g for 5 min to pellet nuclei and intact cells, and the supernatant was then centrifuged at 150,000 × g for 20 min to obtain soluble and particulate fractions. Fractions were resolved by 12% SDS-PAGE, transferred onto PVDF-Plus (Micron Separations, Inc) and probed with EE monoclonal antibody. Bands were visualized by chemiluminescence.
Metabolic labeling and immunoprecipitation
COS-7 cells were transfected in 6 cm plates with 3 μg of the indicated expression plasmid. 24 h after transfection, cells were replated into 6 cm plates. For fatty acid labeling experiments [36], one transfection was replated into two 6 cm plates. For 35S labeling experiments, cells from two or three identical transfections were combined before replating in multiple 6 cm plates. Incubation with radioisotope was then performed 48 h after transfection.
For fatty acid labeling, cells in a 6 cm dish were incubated with 1 ml of DMEM containing 10% dialyzed fetal bovine serum, 5 mM sodium pyruvate, and [9,10-3H]palmitic acid (1 mCi/ml) or [9,10-3H]myristate (0.5 mCi/ml) for 2 h. For 35S pulse-chase labeling, cells in a 6 cm dish were washed with DMEM (without methionine), and then incubated in DMEM (without methionine) containing 10% dialyzed fetal bovine serum at 37°C for 1 h. Next, cells were incubated in DMEM (without methionine) containing 10% dialyzed fetal bovine serum and 0.1 mCi/ml 35S Express mix for 10 min. After the 10 min pulse labeling, cells were either immediately lysed (see below) or washed with normal growth media and then "chased" by incubation in normal growth media for the indicated times.
Fatty acid labeled and 35S methionine/cysteine labeled samples were then identically processed by immunoprecipitation. Cells were washed once with ice-cold PBS and lysed in 1 ml of Extraction buffer (50 mM HEPES, pH 8, 50 mM NaCl, 10 μM β-mercaptoethanol, 1% Triton X-100, 1% sodium cholate, 1 mM PMSF, 2 μg/ml leupeptin, and 2 μg/ml aprotinin). Cell extracts were tumbled for 1 h at 4°C, and nuclei and insoluble material were removed by microcentrifugation at 16,000 × g for 3 min. Samples were adjusted to 0.5% SDS. 10 μg of EE antibody was added, and the samples were tumbled for 2 h at 4°C. Next, 20 μl of Protein A/G PLUS agarose (Santa Cruz Biotechnology, Santa Cruz, CA) was added, and the sample was tumbled overnight at 4°C. The sample was centrifuged for 30 s at 200 × g to pellet the beads. The supernatant was discarded, and the beads were washed 3 times with 1 ml Extraction buffer. SDS-PAGE sample buffer containing 10 mM DTT was added to the washed beads, and the samples were heated at 65°C for 1 min (3H fatty acid labeled samples) or boiled for 5 min (35S methionine/cysteine labeled samples). An aliquot was analyzed by 10% SDS-PAGE. Gels were incubated for 20 min in an aqueous solution of 50% methanol/10% acetic acid, followed by 10% ethanol/10% acetic acid for 20 min, and, finally, Amplify (Amersham) for 20 min. Gels were dried and subjected to fluorography at -80°C using Hyperfilm MP (Amersham). For 35S pulse-chase experiments, intensity of each labeled band was quantitated by densitometry. Results were analyzed with GraphPad Prizm software to determine a half-life.
Acknowledgments
Acknowledgements
The author thanks Debra Garlin for technical assistance, Dr. Emiliana Borrelli for providing sαi2 cDNA, Dr. Janine Morales for αi2A327S cDNA, Dr. Henry Bourne for suggesting similarities with alternatively spliced H-ras, and Drs. Daniel Evanko and Jeff Benovic for critical reading of the manuscript.
Supported by National Institutes of Health Grant GM56444 and the Pew Scholars Program in the Biomedical Sciences.
References
- Stow JL. Regulation of vesicular transport by GTP-binding proteins. Current Opinion in Nephrology & Hypertension. 1995;4:421–5. doi: 10.1097/00041552-199509000-00009. [DOI] [PubMed] [Google Scholar]
- Helms JB. Role of heterotrimeric GTP binding proteins in vesicular protein transport: indications for both classical and alternative G protein cycles. FEBS Letters. 1995;369:84–8. doi: 10.1016/0014-5793(95)00620-O. [DOI] [PubMed] [Google Scholar]
- Montmayeur J-P, Borrelli E. Targeting of Gαi2 to the Golgi by alternative spliced carboxyl-terminal region. Science. 1994;263:95–98. doi: 10.1126/science.8272874. [DOI] [PubMed] [Google Scholar]
- Picetti R, Borrelli E. A region containing a proline-rich motif targets sG(i2) to the golgi apparatus. Experimental Cell Research. 2000;255:258–69. doi: 10.1006/excr.1999.4783. [DOI] [PubMed] [Google Scholar]
- Marin EP, Krishna AG, Sakmar TP. Rapid activation of transducin by mutations distant from the nucleotide-binding site: evidence for a mechanistic model of receptor-catalyzed nucleotide exchange by G proteins. J Biol Chem. 2001;276:27400–5. doi: 10.1074/jbc.C100198200. [DOI] [PubMed] [Google Scholar]
- Osawa S, Weiss ER. The effect of carboxyl-terminal mutagenesis of Gt alpha on rhodopsin and guanine nucleotide binding. J Biol Chem. 1995;270:31052–8. doi: 10.1074/jbc.270.52.31052. [DOI] [PubMed] [Google Scholar]
- Thomas TC, Schmidt CJ, Neer EJ. G-protein αO subunit: Mutation of conserved cysteines identifies a subunit contact surface and alters GDP affinity. Proc Natl Acad Sci USA. 1993;90:10295–10299. doi: 10.1073/pnas.90.21.10295. [DOI] [PMC free article] [PubMed] [Google Scholar]
- Denker BM, Schmidt CJ, Neer EJ. Promotion of the GTP-liganded state of the Goα protein by deletion of the C terminus. J Biol Chem. 1992;267:9998–10002. [PubMed] [Google Scholar]
- Iiri T, Herzmark P, Nakamoto JM, van Dop C, Bourne HR. Rapid GDP release from Gs alpha in patients with gain and loss of endocrine function. Nature. 1994;371:164–168. doi: 10.1038/371164a0. [DOI] [PubMed] [Google Scholar]
- Posner BA, Mixon MB, Wall MA, Sprang SR, Gilman AG. The A326S mutant of Gialpha1 as an approximation of the receptor-bound state. J Biol Chem. 1998;273:21752–8. doi: 10.1074/jbc.273.34.21752. [DOI] [PubMed] [Google Scholar]
- Pace AM, Faure M, Bourne HR. Gi2-mediated activation of the MAP kinase cascade. Mol Biol Cell. 1995;6:1685–1695. doi: 10.1091/mbc.6.12.1685. [DOI] [PMC free article] [PubMed] [Google Scholar]
- Medina R, Grishina G, Meloni EG, Muth TR, Berlot CH. Localization of the effector-specifying regions of Gi2alpha and Gqalpha. J Biol Chem. 1996;271:24720–7. doi: 10.1074/jbc.271.40.24720. [DOI] [PubMed] [Google Scholar]
- Wedegaertner PB, Chu DH, Wilson PT, Levis MJ, Bourne HR. Palmitoylation is required for signaling functions and membrane attachment of Gq alpha and Gs alpha. J Biol Chem. 1993;268:25001–8. [PubMed] [Google Scholar]
- Wedegaertner PB. Lipid modifications and membrane targeting of G alpha. Biological Signals & Receptors. 1998;7:125–35. doi: 10.1159/000014538. [DOI] [PubMed] [Google Scholar]
- Resh MD. Fatty acylation of proteins: new insights into membrane targeting of myristoylated and palmitoylated proteins. Biochim Biophys Acta. 1999;1451:1–16. doi: 10.1016/S0167-4889(99)00075-0. [DOI] [PubMed] [Google Scholar]
- Dunphy JT, Linder ME. Signalling functions of protein palmitoylation. Biochim Biophys Acta. 1998;1436:245–61. doi: 10.1016/S0005-2760(98)00130-1. [DOI] [PubMed] [Google Scholar]
- Kopito RR. Aggresomes, inclusion bodies and protein aggregation. Trends in Cell Biology. 2000;10:524–30. doi: 10.1016/S0962-8924(00)01852-3. [DOI] [PubMed] [Google Scholar]
- Johnston JA, Ward CL, Kopito RR. Aggresomes: a cellular response to misfolded proteins. J Cell Biol. 1998;143:1883–98. doi: 10.1083/jcb.143.7.1883. [DOI] [PMC free article] [PubMed] [Google Scholar]
- Sunahara RK, Tesmer JJ, Gilman AG, Sprang SR. Crystal structure of the adenylyl cyclase activator Gsalpha [see comments]. Science. 1997;278:1943–7. doi: 10.1126/science.278.5345.1943. [DOI] [PubMed] [Google Scholar]
- Noel JP, Hamm HE, Sigler PB. The 2.2 Å crystal structure of transducin α-GTPγs. Nature. 1993;366:654–663. doi: 10.1038/366654a0. [DOI] [PubMed] [Google Scholar]
- Coleman DE, Berghuis AM, Lee E, Linder ME, Gilman AG, Sprang SR. Structures of active conformations of Giα1 and the mechanism of GTP hydrolysis. Science. 1994;265:1405–1412. doi: 10.1126/science.8073283. [DOI] [PubMed] [Google Scholar]
- Garcia PD, Onrust R, Bell SM, Sakmar TP, Bourne HR. Transducin-α C-terminal mutations prevent activation by rhodopsin: a new assay using recombinant proteins expressed in cultured cells. EMBO J. 1995;14:4460–4469. doi: 10.1002/j.1460-2075.1995.tb00125.x. [DOI] [PMC free article] [PubMed] [Google Scholar]
- Grishina G, Berlot CH. Identification of common and distinct residues involved in the interaction of alphai2 and alphas with adenylyl cyclase. J Biol Chem. 1997;272:20619–26. doi: 10.1074/jbc.272.33.20619. [DOI] [PubMed] [Google Scholar]
- Garcia-Mata R, Bebok Z, Sorscher EJ, Sztul ES. Characterization and dynamics of aggresome formation by a cytosolic GFP-chimera. J Cell Biol. 1999;146:1239–54. doi: 10.1083/jcb.146.6.1239. [DOI] [PMC free article] [PubMed] [Google Scholar]
- Wang Y, Windh RT, Chen CA, Manning DR. N-Myristoylation and betagamma play roles beyond anchorage in the palmitoylation of the G protein alpha(o) subunit. J Biol Chem. 1999;274:37435–42. doi: 10.1074/jbc.274.52.37435. [DOI] [PubMed] [Google Scholar]
- Fishburn CS, Herzmark P, Morales J, Bourne HR. Gbetagamma and palmitate target newly synthesized Galphaz to the plasma membrane. J Biol Chem. 1999;274:18793–800. doi: 10.1074/jbc.274.26.18793. [DOI] [PubMed] [Google Scholar]
- Fishburn CS, Pollitt SK, Bourne HR. Localization of a peripheral membrane protein: G beta gamma targets G alpha(z). Proc Natl Acad Sci USA. 2000;97:1085–1090. doi: 10.1073/pnas.97.3.1085. [DOI] [PMC free article] [PubMed] [Google Scholar]
- Evanko DS, Thiyagarajan MM, Wedegaertner PB. Interaction with Gbetagamma is required for membrane targeting and palmitoylation of Galpha(s) and Galpha(q). J Biol Chem. 2000;275:1327–36. doi: 10.1074/jbc.275.2.1327. [DOI] [PubMed] [Google Scholar]
- Evanko DS, Thiyagarajan MM, Siderovski DP, Wedegaertner PB. Gbeta gamma isoforms selectively rescue plasma membrane localization and palmitoylation of mutant Galphas and Galphaq. J Biol Chem. 2001;276:23945–53. doi: 10.1074/jbc.M101154200. [DOI] [PubMed] [Google Scholar]
- Lambright DG, Sondek J, Bohm A, Skiba NP, Hamm HE, Sigler PB. The 2.0 Å crystal structure of a heterotrimeric G protein. Nature. 1996;379:311–319. doi: 10.1038/379311a0. [DOI] [PubMed] [Google Scholar]
- Wall MA, Coleman DE, Lee E, Iniguez-Lluhi JA, Posner BA, Gilman AG, Sprang SR. The structure of the G protein heterotrimer Gi α1β1γ2. Cell. 1995;83:1047–58. doi: 10.1016/0092-8674(95)90220-1. [DOI] [PubMed] [Google Scholar]
- Hamm HE. The many faces of G protein signaling. J Biol Chem. 1998;273:669–72. doi: 10.1074/jbc.273.2.669. [DOI] [PubMed] [Google Scholar]
- Denker S, McCaffery JM, Palade GE, Insel PA, Farquhar MG. Differential distribution of α subunits and βγ subunits of heterotrimeric G proteins on Golgi membranes on the exocrine pancreas. J Cell Biol. 1996;133:1027–1040. doi: 10.1083/jcb.133.5.1027. [DOI] [PMC free article] [PubMed] [Google Scholar]
- Cohen JB, Broz SD, Levinson AD. Expression of the H-ras proto-oncogene is controlled by alternative splicing. Cell. 1989;58:461–472. doi: 10.1016/0092-8674(89)90427-3. [DOI] [PubMed] [Google Scholar]
- Faure M, Voyno-Yasenetskaya T, Bourne HR. cAMP and βγ subunits of heterotrimeric G proteins stimulate the mitogen-activated protein kinase pathway in COS-7 cells. J Biol Chem. 1994;269:7851–7854. [PubMed] [Google Scholar]
- Wedegaertner PB. Fatty acid acylation of Gα. In: Manning DR, editor. G Proteins: Techniques of Analysis. CRC Press, Boca Raton; 1999. pp. 153–171. [Google Scholar]


