

Abstract
Age-related macular degeneration (AMD), the leading cause of central vision loss in the elderly, involves death of the retinal pigment epithelium (RPE) and light-sensing photoreceptors. This multifactorial disease includes contributions from both genetic and environmental risk factors. The current study examined the effect of the Y402H polymorphism of Complement Factor H (CFH, rs1061170) and cigarette smoke, predominant genetic and environmental risk factors associated with AMD. We used targeted and discovery-based approaches to identify genotype-dependent responses to chronic oxidative stress induced by cigarette smoke extract (CSE) in RPE differentiated from induced pluripotent stem cells (iPSC) derived from human donors harboring either the low risk (LR) or high risk (HR) CFH genotype. Chronic CSE altered the metabolic profile in both LR and HR iPSC-RPE and caused a dose-dependent reduction in mitochondrial function despite an increase in mitochondrial content. Notably, cells with the HR CFH SNP showed a greater reduction in maximal respiration and ATP production. Significant genotype-dependent changes in the proteome were observed for HR RPE at baseline (cytoskeleton, MAPK signaling) and after CSE exposure, where a less robust upregulation of the antioxidants and significant downregulation in proteins involved in nucleic acid metabolism and membrane trafficking were noted compared to LR cells. In LR cells, uniquely upregulated proteins were involved in lipid metabolism and chemical detoxification. These genotype-dependent differences at baseline and in response to chronic CSE exposure suggest a broader role for CFH in modulating the response to oxidative stress in RPE and provides insight into the interaction between environmental and genetic factors in AMD pathogenesis.
Keywords: Proteomics, metabolomics, cigarette smoke extract, bioinformatics, iPSC-RPE
Graphical Abstract

Introduction:
Age-related macular degeneration (AMD), the leading cause of vision loss in the elderly, affects ~30% of individuals over 75 years old [1]. With projected estimates of 288 million cases worldwide [2], AMD is expected to create a substantial economic burden on individuals, families, and global healthcare systems, in addition to severely impacting patients’ mental health and quality of life. AMD is a multifactorial disease with contributions from both genetic and environmental risk factors. This study investigated the Y402H single nucleotide polymorphism (SNP) of Complement Factor H (CFH) and cigarette smoke, each identified as known predominant genetic and environmental risk factors for AMD [3, 4].
The presence of one or two alleles containing the Y402H CFH SNP increases an individual’s risk for developing AMD 3- to 6- fold, respectively [5]. Found in ~50% of AMD patients [6], the SNP in CFH (rs1071170) results in a single amino acid substitution of histidine for tyrosine at position 402 in the protein [7]. CFH is part of the alternative complement pathway, which kills invading pathogens and promotes clearance of dead cells and debris [8]. As a negative regulator of this pathway, CFH controls inappropriate activation and prevents subsequent chronic inflammation. The reduced ability to inhibit complement activation reported for the CFH 402H mutant protein could contribute to the chronic inflammation and elevated oxidative stress associated with AMD pathology [9].
Smoking tobacco is the most consistent, modifiable risk factor associated with AMD. Data from multiple epidemiological studies have shown the risk for late AMD increases 3- to 4-fold in past and current smokers, respectively [10]. For individuals exposed to secondhand smoke, the risk for AMD is increased 2-fold [11]. Smoking also promotes disease onset, which for smokers is ~4-5 years earlier than non-smokers [3, 12]. When factoring in the combined effect of smoking with the CFH risk factor, smokers that were homozygous for the CFH high risk alleles had an odds ratio of 34-fold for late stage AMD compared with non-smokers without the risk alleles [13]. Thus, the combined effect for progression to advanced AMD is more than the sum of the independent effects of smoking and CFH high risk genotype.
The complex toxic milieu of cigarette smoke promotes AMD pathology by damaging retinal cells via upregulation of processes involved in angiogenesis and vascular inflammation, as well as homeostatic disruption of retinoids, molecules that play a key role in vision [3]. In mice exposed to chronic cigarette smoke, histopathological changes occur in and around the retinal pigment epithelium (RPE), such as thickening of the underlying Bruch’s membrane, basal deposits, and signs of RPE damage including loss of basolateral infoldings and formation of vacuoles [3]. In cultured RPE, exposure to cigarette smoke extract (CSE) results in reorganization of the cytoskeleton, oxidative damage, and loss of mitochondrial integrity and function [14–17].
The RPE have been suggested as the primary site of defect in AMD based on their critical role in maintaining retinal health and the cellular changes associated with AMD. Located between the outer retinal blood supply of the choroid and the photoreceptors, the RPE perform multiple tasks that are essential for maintaining the health of the retina, including transport of nutrients and oxygen from the blood to the outer retina, secretion of factors required for the structural and functional integrity of the choroid and photoreceptors, and daily phagocytosis of the shed photoreceptor outer segments [18]. In AMD patients, diminished vision results from the functional decline and death of the RPE and subsequent loss of the light-sensing photoreceptors.
Cultured primary RPE cells from human donor eyes, used to investigate disease mechanism, have identified altered metabolism involving decreased mitochondrial function as an early defect in the RPE harvested from AMD patients [19, 20]. RPE differentiated from induced pluripotent stem cells (iPSC-RPE) have also been used to investigate AMD disease mechanism [21–23], as well as the effect of the CFH SNP associated with AMD [21, 24, 25]. Our previous report of decreased mitochondrial function in iPSC-RPE harboring the high-risk (HR) CFH genotype provided the first indication of a link between CFH and regulation of mitochondria. This idea was also supported by an earlier study showing greater RPE mtDNA damage in human donors harboring the CFH HR genotype [26].
The current study extends our initial findings by investigating how the CFH genetic risk, in concert with the environmental risk of smoking, affects the RPE. CSE was selected for our study based on its potent effect on mitochondria and the induction of complement activation. These two effects provide an opportunity to probe the mechanistic link between CFH and mitochondria. The presence of the mutant CFH protein could amplify differences between genotypes when complement is activated by CSE. Our rationale for long-term exposure was to more closely model the in vivo effect of chronic smoking. By providing sufficient time for the cell to adapt to this environmental stressor, we were able to observe how adjustments were made in the proteome and importantly, how the genotype influenced the response. Thus, this study is the first to provide a comprehensive overview of the mitochondrial, metabolic, and proteomic profile in iPSC-RPE after chronic CSE treatment. We utilized RPE differentiated from iPSCs derived from human donors that were homozygous for either the low risk (LR) or high risk (HR) CFH alleles. Cells were exposed to chronic (2 weeks) CSE treatment to mimic the effects of heavy cigarette smoking. Using a combination of targeted and discovery-based approaches, we provide an in-depth analysis of how this chronic exposure to CSE affects RPE metabolism as well as other pathways and identified genotype-dependent responses to oxidative stress induced by CSE. These analyses extend our understanding of the biological basis for the synergistic effects of these predominant genetic and environmental risk factors.
Materials and Methods
iPSC-RPE Cell Culture and Chronic CSE Treatment
The derivation of iPSC from epithelial cells harvested from the conjunctiva of human donor eyes and their differentiation into RPE was performed as previously described [27]. Cell culture conditions followed established protocols [21, 27]. iPSC-RPE monolayers from passages 3 or 4 were cultured for two weeks to allow sufficient time for cells to form tight junctions before starting CSE treatment (NC1560725, Murty Pharmaceuticals). CSE at various concentrations (0, 50, 100, and 150 μg/mL) was administered during media changes three times per week for two weeks. Samples were collected 48 hours after the last treatment.
Cell Death Assay
iPSC-RPE cells plated and treated with CSE in 96-well plates were used to estimate cell death. At 48 hours after the last treatment, cells were stained with Hoechst 33342 (Invitrogen) and NucGreen Dead 488 (Invitrogen) for 10 minutes and imaged using a Cytation 1 plate reader. The total number of cells and dead cells were counted by identifying cells stained blue (total) and green (dead). To account for all cells lost during chronic CSE treatment, we measured cell death in two ways: (1) Recent cell loss after the final treatment was measured from counts of green-stained cells in non-treated wells subtracted from treated wells. (2) Cell loss over the two weeks of treatment was estimated by subtracting the number of blue-stained cells in treated from non-treated wells. The percent of cell death due to CSE was calculated from the sum of the dead cells per total cells in non-treated wells.
Measurement of Cell Pigmentation
After treatment, cells were dissociated using Accumax and pelleted by centrifugation at 2000 rpm for 5 minutes. Photographs of the cell pellets were captured using a standard camera. The mean gray value of each image was measured using ImageJ, where lower gray values correspond to darker shades. Inverted gray values generated by ImageJ were used to represent the degree of pigmentation and for quantification.
Measurements of Mitochondrial ROS and Membrane Potential
To measure mitochondrial ROS, cells treated with or without CSE in 96-well plates were incubated with 200nM MitoSox (M36008, Invitrogen), 50nM Mitotracker green (M7514, Invitrogen), and 1uM Hoechst 33342 (62249, Invitrogen) in media without FBS for 30 min at 37°C, 48 hours after the last treatment. For the mitochondrial membrane potential assay, cells were incubated with 80nM TMRM (I34361, Invitrogen), 50nM Mitotracker, and 1uM Hoechst 33342 for 30 min. The fluorescence intensity from MitoSOX (396/610nm), mitotracker (490/516nm), and TMRM (548/574nm), were measured using a Cytation 1 plate reader (Biotek, VT, USA). Cells identified by Hoechst 33342 were counted using Cytation 1.
Assessment of Mitochondrial function Using the Cell Mito Stress Test (CMST)
Mitochondrial bioenergetics was assessed by measuring oxygen consumption rate (OCR) using a Seahorse XFe96 Analyzer (Agilent Technologies, CA, USA) and the CMST. Cells were seeded in XF96 plates at 40,000 cells per well and treated with CSE for 2 weeks. Assays were performed according to manufacturer’s directions. Oxygen consumption rate (OCR) was measured under basal conditions, followed by sequential additions of mitochondrial stressors- oligomycin (to determine mitochondrial-linked ATP), FCCP (to uncouple mitochondria and measure maximal respiration), and finally, antimycin and rotenone (to completely shut down OxPhos and determine cellular non-mitochondrial respiration). The final concentrations of the inhibitors used in the CMST were 2.5 mM Oligomycin, 2.5 mM FCCP, 5 mM Antimycin A and 5 mM Rotenone (Agilent Technologies, CA, USA). Cells stained with Hoechst 33342 were counted and used for normalizing OCR to cell number. The Bioenergetic Health Index (BHI) was calculated from the data produced with the CMST assay using the formula: BHI = (Spare Respiratory Capacity × ATP-linked production)/(Non-Mito Oxygen Consumption × Proton Leak)[28].
Protein Isolation and Western Immunoblotting
Cells were lysed using RIPA Buffer supplemented with protease inhibitors (MilliporeSigma, USA) and phosphatase inhibitors (Millipore Sigma, USA). Protein quantification was performed using a Bicinchoninic acid protein assay (Bio-Rad, CA, USA). Proteins (10~15 μg) were resolved on 4-15% gradient polyacrylamide gels (Bio-Rad, CA, USA) and subsequently transferred to a nitrocellulose membrane using the Bio-Rad Trans-Blot Turbo System (Bio-Rad, CA, USA). Membranes were blocked with 5% skim milk in TBST for 1 h at room temperature before the incubation overnight with primary antibodies (Supplementary Table 1). To detect proteins, horseradish peroxidase-conjugated secondary antibodies were used, and signals were developed with Pierce ECL Western Blotting Substrate (Thermo Scientific, MA, USA). Densitometry analysis was performed using Image Lab software (Bio-Rad, CA, USA). Band intensity was normalized to ponceau S-stained membranes.
Sample Preparation and Liquid Chromatography-Mass Spectrometry (LC-MS) Analysis
iPSC-RPE cell pellets was resuspended in an ice-cold Surfactant Cocktail (SC) buffer (50 mM Tris-formic acid, 150 mM NaCl, 2% SDS, 0.5% sodium deoxycholate, 2% IGEPAL CA630, pH 8.4) supplemented with complete protease inhibitor cocktail tablets (Roche Applied Science, Indianapolis, IN, USA), and solubilized in a water bath sonicator for 10 min. Protein concentration was determined by bicinchoninic acid assay.
For protein digestion, 60 μg protein was aliquoted from each sample, and a surfactant cocktail-aided precipitation/on-pellet digestion (SEPOD) protocol was employed as previously described [29, 30]. In brief, protein was reduced by 10 mM dithiothreitol (DTT) and alkylated by 25 mM iodoacetamide. Protein precipitation was performed by the addition of ice-cold acetone, then pelleted by centrifugation and washed with methanol. Protein was incubated with trypsin (Sigma-Aldrich, St. Louis, MO, USA) at a final enzyme-to-substrate ratio of 1:20 (w/w) at 37 °C for 6 h. Tryptic digestion was terminated by the addition of Tris formic acid, and samples were centrifuged. The supernatant was carefully transferred to LC vials for analysis. Detailed information of the sample running scheduling can be found in our previous publications [31]. The detailed protocol for analysis by mass spectrometry, including LC-MS settings and information, can be found in our previous publications [30, 31].
For LC-MS data processing, an in-house developed Ultra-High-Resolution (UHR)-IonStar data processing pipeline was adopted for proteomic quantification. Protein and peptide FDR were controlled at ≤1%, and a minimum of 2 unique peptides per protein was set. Detailed information about the UHR-lonStar data processing pipeline can be found in our previous publications [31].
Metabolite Extraction and Analysis by Targeted Metabolomics
Media samples and media-only (with or without CSE) controls were centrifuged to remove debris, and 10 μL of the supernatant was mixed with 40 μL of cold methanol to extract the metabolites. Supernatants containing aqueous metabolites were spiked with the internal standard (D4-nicotinamide, Cambridge Isotope Laboratory, Tewksbury, MA), dried and analyzed with liquid chromatography–mass spectrometry (LC-MS) as reported [32, 33]. An ACQUITY UPLC A BEH Amide analytic column (2.1 X 50 mm, 1.7 μm, Waters) in a Shimadzu LC Nexera X2 UHPLC was used for chromatographic separation and metabolites were detected with a QTRAP 5500 LC-MS (AB Sciex). The extracted multiple reaction monitoring (MRM) peaks were integrated using MultiQuant 3.0.2 software (AB Sciex). Supplementary Table 2 lists the detailed parameters for the measured metabolites. Metabolites that showed a significant correlation with CSE content in the CSE media-only samples (4-Hydroxyproline, Ornithine, Thiamine, Allantoin, and Quinic acid) were excluded in our analysis (Supplementary Table 3).
Statistical and Bioinformatic Analysis
For analysis of data from Western blots and mitochondrial function, one-sample t-tests were performed on the fold-change values of treated versus non-treated controls for each cell line. For the proteomic and metabolomic datasets, repeated measures two-way ANOVA was performed on log2 transformed values (protein or metabolites) using ezANOVA in R to analyze the main effects of CSE treatment, CFH genotype, and their interaction. To evaluate the extent of response at each CSE concentration, fold-change values (treated vs non-treated within each cell line) were calculated for each genotype group and a follow-up analysis of one-sample t-test was performed on fold-change values to determine the significance. Gene set enrichment analysis (GSEA) software was used to determine enriched pathways in CSE treated cells for each genotype using the well-defined hallmark gene sets. Metascape was used for pathway analysis of altered proteins identified from two-way ANOVA or one-sample t-test analysis. For the heatmaps, Z-score normalization was applied to the log2-transformed expression values, and these normalized scores were used for heatmap visualization using R.
Results:
Characterizing cellular changes following chronic CSE treatments.
The iPSC-RPE cell lines used in this study were developed from conjunctival epithelial cells harvested from human donor eyebank tissue, as previously described [27]. Donors were evaluated for the presence and severity of AMD using the Minnesota Grading System [34] and genotyped for the CFH SNP associated with high risk for AMD (rs1061170, Y402H). Table 1 provides donor clinical information, demographics, and genotype. There was no significant difference in average age of donors in the low risk (71±11 years) versus high risk (75±9 years) groups (p=0.54).
Table 1.
Description of iPSC-RPE lines and donor demographics
| iPSC-RPE Line ID | Line # | Age a/ Sex b | MGS Stage c | CFH Genotype d |
|---|---|---|---|---|
| MGS1-1115 | 1 | 55/M | MGS1 | TT |
| MGS1-1351 | 2 | 67/M | MGS1 | TT |
| MGS2-0179 | 3 | 71/F | MGS2 | TT |
| MGS2-0833 | 4 | 83/F | MGS2 | TT |
| MGS2-2275 | 5 | 68/M | MGS2 | TT |
| MGS3-0011 | 6 | 83/F | MGS3 | TT |
| MGS1-1974 | 7 | 62/F | MGS1 | CC |
| MGS2-0598 | 8 | 62/F | MGS2 | CC |
| MGS3-1059 | 9 | 83/M | MGS3 | CC |
| MGS3-0276 | 10 | 75/F | MGS3 | CC |
| MGS3-0503 | 11 | 83/F | MGS3 | CC |
| MGS3-0698 | 12 | 72/F | MGS3 | CC |
| MGS3-1901 | 13 | 83/F | MGS3 | CC |
| MGS3-0979 | 14 | 82/M | MGS3 | CC |
TT: Age (71 ± 11), 3F/3M; CC: Age (75 ± 9), 6F/2M
Age (Mean ± SD); Sex (F: Female; M: Male)
Age of donor, in years, from whose conjunctiva cells were used to generate iPSC-RPE.
Gender of donor, F = female, M = male.
Minnesota Grading System (MGS) was used to evaluate the stage of AMD in eye bank eyes [33]. MGS1 (no AMD); MGS2 (early AMD); MGS3 (intermediate AMD).
Complement Factor H (CFH) genotype for rs106117: low risk = TT, high risk = CC.
To generate chronic oxidative stress, cells were treated with CSE at different concentrations (0, 50, 100, 150 μg/mL) for two consecutive weeks. Cell viability was evaluated post-treatment using a NucGreen cell death assay. For both LR and HR cells, CSE treatment induced a dose-dependent minor increase in cell death up to ~10% at the highest dose (Figure 1A, B). RPE hypopigmentation was also observed after 2 weeks of CSE treatment in both genotypes, with even the lowest concentration (50 μg/mL) inducing an observable loss in pigmentation (Figure 1C). Quantification of the pigment present in pelleted RPE before and after 100 μg/ml CSE treatment confirmed that CSE caused a significant decrease in RPE cell pigmentation (Fig. 1D, p<0.05).
Figure 1. Characterizing cellular changes following chronic CSE treatments.

(A) Cell death was determined from fluorescent images of iPSC-RPE cells stained with Hoechst 33342 (blue) and NucGreen Dead (green) post-CSE treatment. Scale bar=200 μm. (B) Linear regression analysis illustrates the relationship between cell death and CSE treatment in both LR and HR cells. Data are mean ± SD, n=4/genotype. (C) Bright field images of LR and HR cells shows the degree of pigmentation without and with CSE treatment. Scale bar=100 μm. (D) Quantification of cell pigments was performed on cell pellets treated with 100 ug/mL CSE and non-treated controls using ImageJ. The inverted greyscale values, which reflect the pigmentation, were determined from the images of cell pellets. Paired t-test was performed on seven lines including both LR and HR. * p < 0.05. (E) The abundance of melanosome-related proteins (MITF, PMEL, TYRP2, TYRP1, TYRO, GPR143) and RPE markers (RPE65, RGR, RDH5, BEST1) in cells without or with CSE treatment is provided from log2 transformed intensities. Significance was determined by repeated measures two-way ANOVA analysis. C (CSE), G (genotype), C&G (the interaction of genotype and CSE)., ns= not significant, * p<0.05, ** p< 0.01, *** p< 0.001, **** p < 0.0001. Data from individual cell lines are shown.
These results were corroborated by our proteomic analysis that showed a significant dose-dependent reduction in proteins related to pigmentation or melanosomes, such as MITF, PMEL, TYRO, GPR143, TYRP1, and TYRP2, in both LR and HR cells (Figure 1E). Despite decreased pigmentation, RPE signature proteins, including RPE65, RGR, RDH5, and BEST1, were upregulated with CSE in both LR and HR cells (Figure 1E), indicating that chronic CSE treatment did not cause RPE de-differentiation.
Additionally, the complement pathway appears to be activated by CSE treatment, as evidenced by the significant downregulation of negative regulators CFH, CFI, and CD59, and the upregulation of PHB1, which is known to enhance complement activation [35] (Supplementary Fig 1). These findings confirm results from prior studies showing that CSE treatment induces complement activation.
CSE leads to increased mitochondrial content but decreased mitochondrial function.
Previous reports showed a single dose of CSE increases mitochondrial reactive oxygen species (ROS) and has a significant negative effect on mitochondrial membrane potential in ARPE-19 cells [16]. Gauging the effect of long-term exposure of our iPSC-RPE to CSE, we measured mitochondrial ROS content using the dye MitoSox and found a dose-dependent increase post-CSE treatment (Fig. 2A). Western blot analysis also demonstrated dose-dependent upregulation of mitochondrial superoxide dismutase (SOD2), a known indicator of mitochondrial ROS, confirming the increased mitochondrial ROS levels elicited a change in mitochondrial proteins (Figure 2B,C). Mitochondrial membrane potential and mitochondrial content were measured simultaneously using the dyes TMRM and MitoTracker (Figure 2D,E). While both signals increased with CSE dose, the ratio of membrane potential to mitochondrial content (TMRM/MitoTracker) decreased. These results suggest that even though CSE induced an increase in mitochondrial content, the overall decrease in mitochondrial membrane potential is indicative of membrane damage.
Figure 2. Impact of CSE on Mitochondrial Oxidative Stress and Membrane Potential.
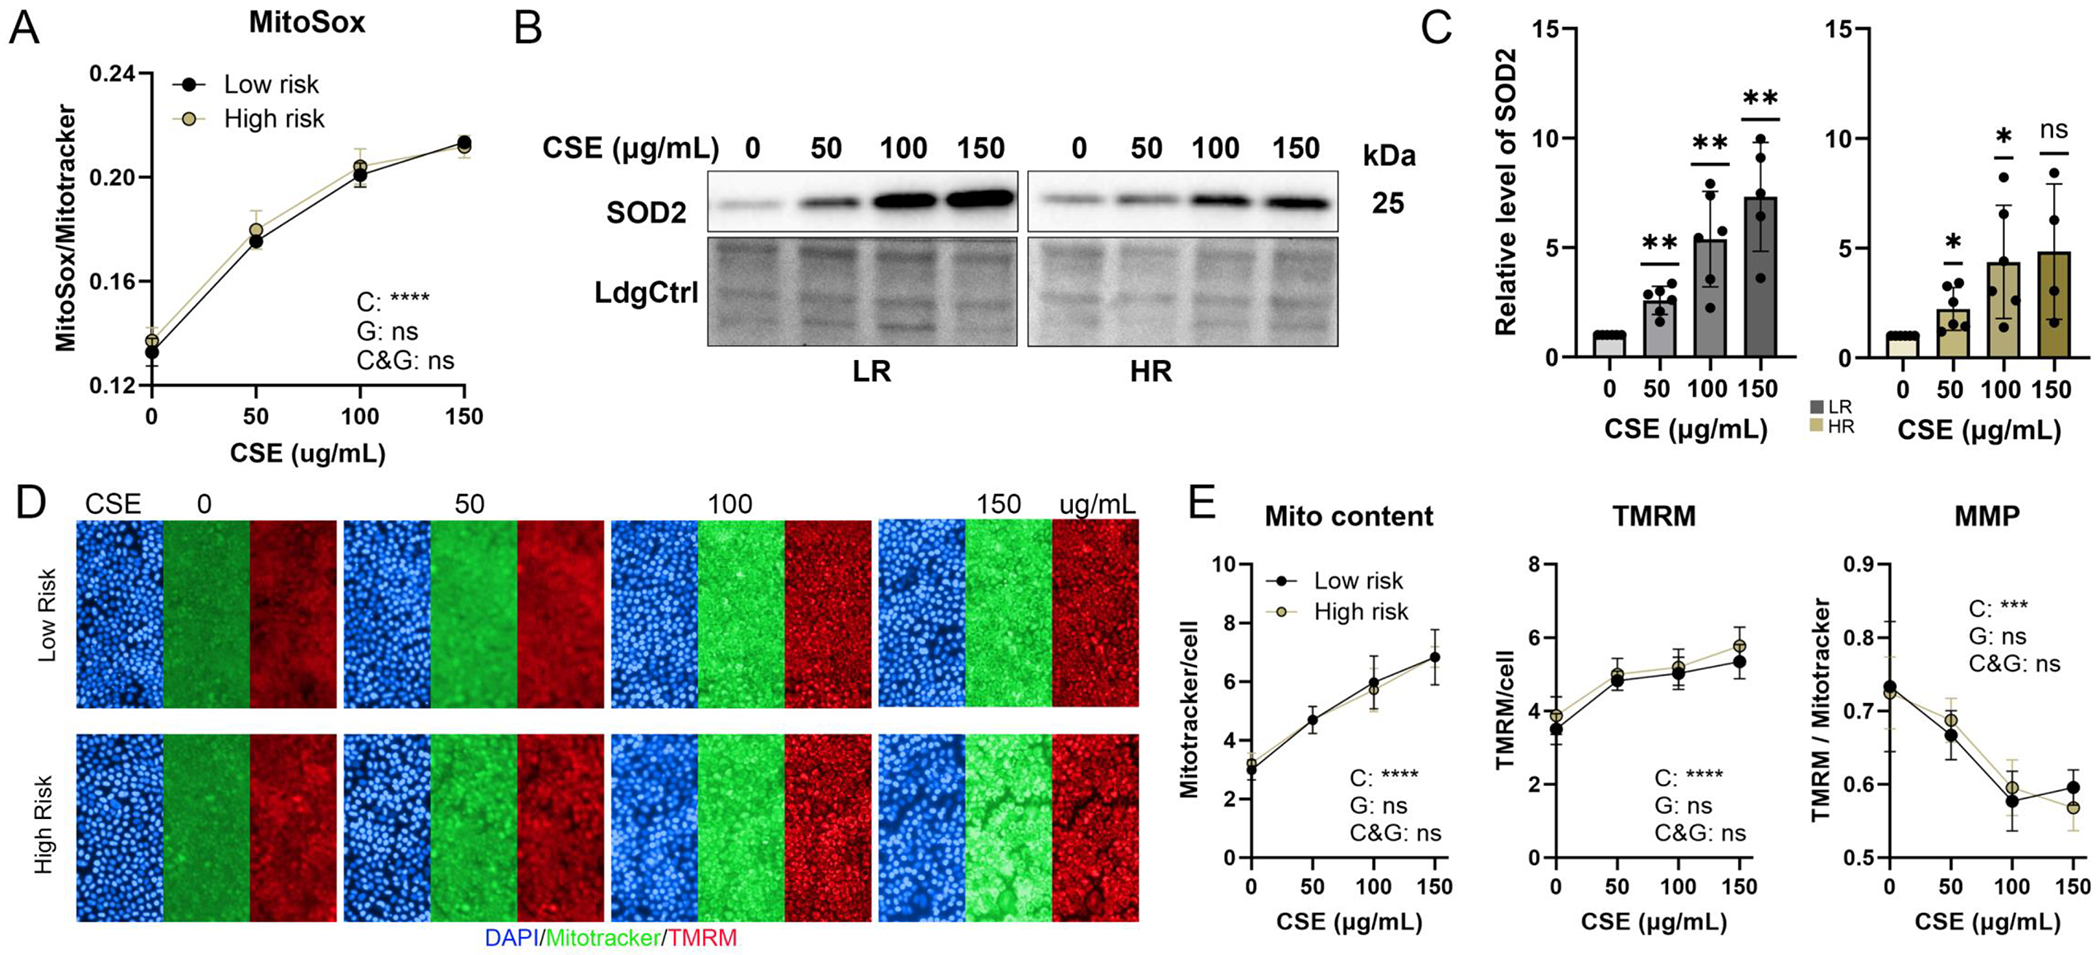
(A) Images of cells co-stained with MitoSox and MitoTracker were used to evaluate levels of mitochondrial reactive oxygen species (ROS). Graph shows mitochondrial ROS calculated from MitoSox intensity normalizing to MitoTracker intensity. n=3~4/phenotype, Significance was determined by repeated measures two-way ANOVA analysis. C (CSE), G (genotype), C&G (the interaction of genotype and CSE)., ns= not significant, **** P <0.0001. (B,C) Superoxide dismutase 2 (SOD2) content was determined from densitometry analyses of SOD2 antibody reaction on Western blots in iPSC-RPE cells treated with CSE. n=4~6, ns= not significant, * P <0.05, ** p < 0.01. (D) Fluorescent images show cells stained with MitoTracker (green), TMRM (red), and Hoechst 33342 (blue) following treatment with CSE. (E) Mitochondrial content and membrane potential were quantified by normalizing MitoTracker and TMRM intensity against the total cell count. Overall Mitochondrial Membrane Potential (MMP) was calculated from the TMRM intensity normalized to the MitoTracker signal. Data = mean ± SD, n=3~4/phenotype, ns= not significant, *** p <0.001, **** p < 0.0001.
To confirm the increase in mitochondrial content observed from the Mitotracker image intensities, we performed Western blot analysis to measure the content of mitochondrial membrane proteins (COX IV, VDAC, TOMM20) and fission/fusion proteins (OPA1, DRP1) (Fig 3A,B). For all proteins, we observed a dose-dependent increase in both LR and HR cells (Figure 3C), which is consistent with chronic CSE causing mitochondrial content to increase. Our proteomics analysis also confirmed that nearly all proteins involved in oxidative phosphorylation (OxPhos), TCA cycle, and mitochondrial structure (TOM and TIM) were significantly increased in a dose-dependent manner (Supplementary Figure 2).
Figure 3. Assessment of Mitochondrial Content.
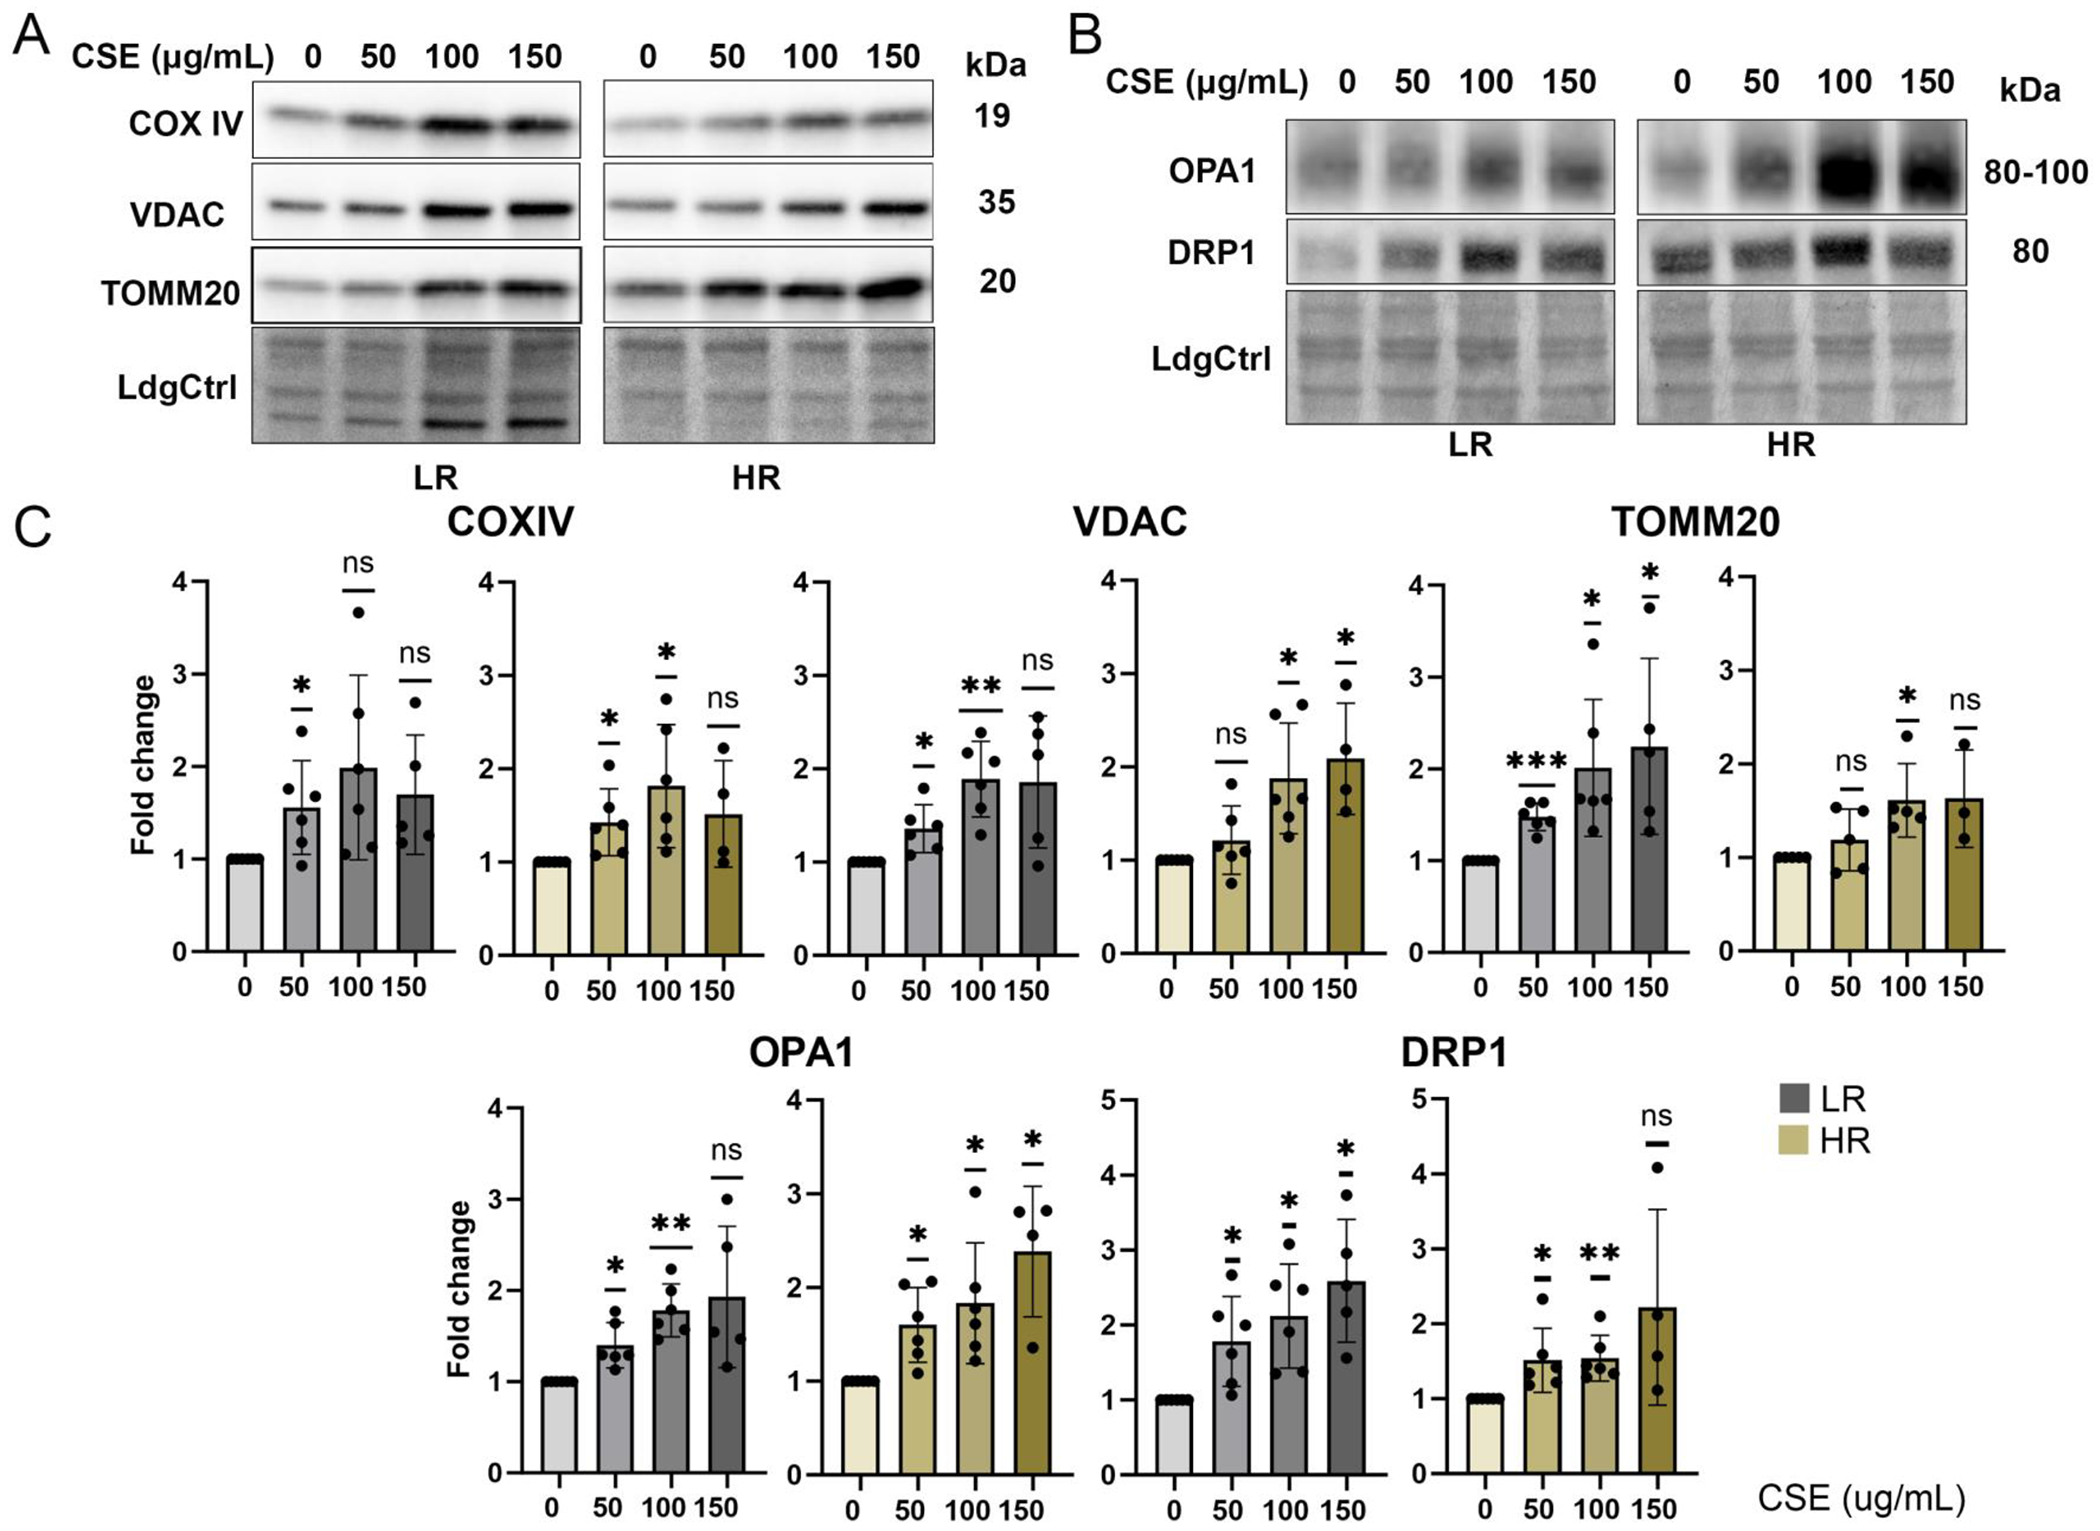
(A, B) Immune reactions on Western blots were used to estimate the content of mitochondrial proteins (COX IV, VDAC, TOMM20, OPA1, DRP1) with CSE treatment. Ponceau S-stained blots serving as the loading control (LdgCtrl). (C) Quantitative analysis of Western blots and statistical significance are presented as change in content relative to no treatment for each cell line. Data = mean ± SD, n=4~6/genotype. ns = not significant, * p < 0.05, ** p < 0.01, *** p < 0.001.
Having established that chronic CSE treatment results in increased mitochondrial content along with increased mitochondrial ROS and membrane damage, we measured mitochondrial function in LR and HR cells after chronic CSE treatment using a Cell Mito Stress Test (CMST). Parameters of mitochondrial function were calculated from traces of the oxygen consumption rate following sequential injection of mitochondrial stressors (Fig. 4A). Results showed no significant change in basal respiration after CSE treatment for either genotype, suggesting that the mitochondria were still able to maintain basic oxygen consumption (Fig. 4B). However, proton leak, which reflects mitochondrial membrane damage, exhibited a dose-dependent increase in both groups, indicating mitochondria damage. This finding aligns with our prior observation of decreased mitochondrial membrane potential after CSE treatment (Fig 4B). Indeed, coupling efficiency, measuring how effectively mitochondrial convert the energy from oxygen consumption into ATP, as well as ATP production were dramatically reduced after 2 weeks of CSE in HR cells, indicating greater sensitivity to CSE-induced chronic oxidative stress compared to LR cells. Additionally, HR cells, but not LR cells, showed a significant reduction in maximal respiration, indicating their reserve capacity to handle increased energy demands was impaired (Fig 4B). The Bioenergetic Health Index, a comprehensive measure of the response of the cell to stress and an indicator of overall mitochondrial health [28], was reduced in a dose-dependent manner in both groups (Fig 4C). However, HR cells demonstrated a more substantial decrease compared with LR cells, consistent with a greater sensitivity to chronic oxidative stress. This parameter is calculated from the CMST results and reflects the overall health of the mitochondria as derived by distilling multiple functional measurements into a single value. The reduction in efficiency for generating ATP and in overall mitochondrial health emphasizes the significant negative impact of CSE on RPE mitochondrial function.
Figure 4. Response of Mitochondrial Function to Treatment.

(A) During CMST, oligomycin, FCCP, rotenone and antimycin A were added sequentially to cell plates and the traces of oxygen consumption rate are shown for LR and HR cells post-chronic CSE exposure. (B) Graphs show fold change in basal respiration (BR), maximal respiration (MR), ATP production (AP), proton leak (PL), and coupling efficiency (CE) post-CSE treatment relative to no treatment for both genotypes. (C) The Bioenergetic Health Index (BHI) was calculated from the CMST results. Data = mean ± SD, n=6~8/genotype, ns=not significant, * p <0.05, ** p < 0.01, *** p< 0.001, **** p< 0.0001.
Altered Metabolite Secretion or Consumption after Chronic CSE.
Since mitochondrial function is compromised in CSE-treated cells, we conducted targeted metabolomics analysis on conditioned media collected after the final CSE treatment at different concentrations more clearly define how CSE affects RPE metabolism. Metabolite abundance lower than the media-only control was considered consumed, and conversely, secreted metabolites were those higher than the media-only controls (Figure 5A, Supplementary Table 4). Repeated measures two-way ANOVA identified metabolites affected by CSE, genotype, and their interaction. Of the 59 metabolites analyzed, 32 were significantly (p<0.05) altered by CSE treatment (Fig 5B). Both secreted and consumed metabolites were affected, as illustrated in the heatmap, which shows the overall increase or decrease with CSE treatment (Supplementary Figure 3).
Figure 5. Altered secretion or consumption of metabolites.

(A) Graphic depicts the definition of secreted or consumed metabolites in conditioned media. (B) Repeated measures two-way ANOVA was performed on the targeted metabolomics data to identify metabolites altered by CSE, CFH genotype, or the interaction of the two factors. Venn diagram shows the number of altered media metabolites for each factor. (C) Bar graphs show the relative level of representative metabolites significantly altered with CSE treatment in the conditioned media from LR (left) and HR (right) cells. Metabolites altered by the interaction of genotype and CSE are labeled with red boxes. Metabolites highlighted in yellow are secreted, while those not highlighted are consumed. Data = mean ± SEM, n=4/genotype. *p < 0.05, ** p< 0.01, *** p < 0.001.
Secreted metabolites, like oxidized glutathione and lactate, had a dose-dependent increase in response to CSE, while Myo-Inositol, Glutamine, and Aconitate decreased. Consumed metabolites, such as Valine and Leucine, accumulated in conditioned media with CSE treatment, indicating decreased consumption post-CSE. Conversely, serine consumption increased in CSE-treated cells (Supplementary Figure 3). The bar graphs in Figure 5C shows the response to CSE, which is derived by comparing the level of metabolites in the culture media of CSE treated cells relative to their own untreated controls. If the metabolite is negative, that indicates the CSE treatment resulted in lower metabolite content. This could be due to either increased cell consumption or reduced secretion. Conversely, positive values indicate either greater secretion or lower consumption in the CSE-treated cells.
The metabolomic dataset illustrated alterations in metabolites involved in the TCA cycle (aconitate, succinate), NAD metabolism (tryptophan, nicotinamide, N1-methylnicotinamide), and lipid metabolism (acetyl-carnitine) indicative of mitochondrial dysfunction in CSE-treated cells (Fig. 5C). Additionally, there were changes in metabolites related to nucleotide metabolism (cytidine, inosine, hypoxanthine), epigenetic regulation (betaine, 1-methyladenosine), and oxidative stress (carnosine, oxidized glutathione) (Figure 5C). These results collectively suggest significant alterations in RPE metabolism due to CSE exposure, highlighting mitochondrial dysfunction and metabolic stress in treated cells. Four metabolites—Tyrosine, Hypoxanthine, Leucine, and Inosine—were affected by the interaction of CSE and genotype, showing greater accumulation of Tyrosine and Leucine and greater release of Hypoxanthine and Inosine in HR cells (Fig. 5C, red labels). Only N-alpha-Acetyl-L-lysine was affected by CFH genotype alone, with slightly higher levels in HR cells (Supplementary Table 4).
Alterations in the RPE Proteome Profile.
Results from the targeted analysis of RPE after chronic CSE exposure focused mainly on the mitochondria and metabolism. To expand our analysis to other pathways, we performed proteomic analysis to obtain a global overview of protein changes due to either genotype or CSE treatment. The proteomics dataset was analyzed using a repeated measures two-way ANOVA to identify proteins significantly altered by CFH genotype, CSE treatment or by the interaction between CSE and genotype, which reflects the genotype-dependent response to chronic stress. Among 6,390 proteins identified and quantified by a highly sensitive quantitative proteomics pipeline, the greatest effect was observed due to CSE treatment, resulting in significant changes in 4,119 proteins (Fig 6A). There were 176 proteins that differed between genotypes, and 935 were affected by the CSE-genotype interaction (Figure 6A, Supplementary Table 5). A heatmap of the normalized log2-transformed intensities of proteins affected by CSE provides a visual overview of the proteins that were either downregulated (top half) or upregulated (bottom half) with CSE treatment (Figure 6B).
Figure 6. Proteome profile alterations.

(A) Repeated measures two-way ANOVA was performed on the proteomic data of LR and HR cells treated with CSE to identify proteins altered by CSE, CFH genotype, or the interaction of the two factors. Venn diagram shows the number of altered proteins affected by different factors. (B) Heatmap illustrates normalized abundance of proteins altered by CSE. (C) GSEA analysis, conducted on proteomic datasets, identified the top 10 positively and negatively correlated pathways with CSE concentrations in LR (upper) and HR (bottom) cells, respectively. Pathways unique to each genotype are highlighted in red boxes.
Gene set enrichment analysis (GSEA) was performed to identify pathways that exhibited either a positive or negative correlation with CSE concentration. These analyses revealed that chronic CSE exposure substantially upregulated pathways related to mitochondrial function and lipid metabolism, such as oxidative phosphorylation, adipogenesis, fatty acid metabolism, and cholesterol homeostasis. These results are consistent with our data showing CSE treatment increases mitochondrial content and alters metabolism (Fig 3, 5). Conversely, proteins involved in epithelial-mesenchymal transition (EMT), apical junctions, and Wnt/β-catenin signaling were significantly decreased (Figure 6C). There was significant overlap in response to CSE in both LR and HR cells, with only 6 pathways uniquely altered in the 4 lists of top 10 upregulated or downregulated pathways affected by CSE (Figure 6C). These results are consistent with the large number of affected proteins (4,119 out of 6,390) due to CSE exposure.
Genotype-dependent Response to Stress.
Under both CSE-treated and non-treated conditions, protein levels differed between HR and LR cells. Of the 176 proteins affected by CFH genotype, 49 proteins were altered by genotype but not by CSE treatment (Fig 6A). Pathway analysis of the 176 altered proteins show they are involved in mitochondria gene expression and organization, fatty acid and lipid metabolism, phosphatidylinositol 4,5-bisphosphate signaling, response to chemical stress, and tight junctions (Figure 7A, C). The 49 proteins altered by genotype but not by CSE treatment are primarily involved in cytoskeleton organization and maintenance, as well as the MAPK signaling pathway (Supplementary Fig 4). The top pathway involves signaling by phosphatidylinositol 4,5-bisphosphate, a lipid messenger localized to the plasma membrane that regulates the interaction of membranes and the cytoskeleton, including the process of phagocytosis [36]. One subcategory of the cytokinesis pathway involves the Ezrin-Radixin-Moesin (ERM) proteins, which are critical for RPE cell polarity and signal transduction [37, 38]. We observed significantly lower levels of Moesin, Ezrin, and Radixin in HR cells compared to LR cells. Conversely, proteins involved in MAPK cascade regulation, such as GRB2, RRAS, AKAP12, and LAMTOR2, were significantly increased in HR cells (Supplementary Fig 4A). These data suggests that cells harboring the HR CFH Y420H variant have basal changes in the cytoskeleton network and MAPK signaling compared to LR cells.
Figure 7. Genotype-dependent Differences in Altered Proteins.

(A) Heatmap shows proteins differentially expressed in HR cells compared to LR cells under both CSE-treated and non-treated conditions. (B) Heatmap displays proteins altered by the interaction of CSE and CFH genotype. Pathway analysis of proteins altered by genotype (C) and proteins that were significantly altered by CSE treatment in either HR (D) or LR (E) cells.
Proteomic analysis identified 935 proteins altered by the interaction of genotype and CSE (Figure 7B). Of note, these proteins likely reflect genotype-dependent differences in the response to stress. To increase our understanding of the specific differences due to genotype, we selected only proteins with a significant response to CSE in HR but not LR cells (Supplementary Table 5). There were 109 out of 110 uniquely altered proteins that were significantly downregulated in HR cells. Most of these proteins were related to nucleic acid metabolism and membrane trafficking in response to CSE in HR cells (Figure 7D). The reduction in DNA and mRNA metabolism would be detrimental because they are processes required for replacing damaged proteins or altering protein content to adjust to the stress.
Similarly, we filtered proteins with significant responses to CSE in LR but not in HR cells. Among the 97 uniquely altered proteins, 84 proteins showed significant upregulation in LR cells post-CSE treatment, but not in HR cells (Supplementary Table 5). Pathway analysis revealed these proteins are involved in lipid metabolism, chemical carcinogenesis, detoxification, and nucleotide metabolic processes (Figure 7E). One of the subcategories of these differentially upregulated proteins included those with antioxidant activity. Proteins that exhibited the greatest difference were the antioxidants Peroxiredoxin-5 (PRDX5), Nucleoredoxin (NXN), Thioredoxin reductase 1 (TRXR1), TRXR2, and multiple members of Glutathione S-transferase (GST) family of detoxifying enzymes, including GST Mu 2 (GSTM2), Mu3 (GSTM3), omega-1 (GSTO1), theta-1 (GSTT1), and zeta-1 (GSTZ1, aka Maleylacetoacetate isomerase, MAAI). These proteins were significantly upregulated in LR cells after CSE treatment but not in HR cells (Figure 8A). We also observed limited increases of Catalase and Glutathione S-transferase kappa 1 (GSTK1) in HR cells compared to LR cells in response to CSE (Figure 8A). Additionally, Lysine-specific demethylase 3B (KDM3B), Glutathione peroxidase 4 (GPX4), and Glutathione S-transferase A1 (GSTA1) were significantly decreased in HR cells with CSE but not in LR cells. Unlike LR cells, HR cells had either no increase or significant decrease of sulfotransferases (SULT1A1, SULT1A2, SULT1A3, SULT1C2), a group of detoxification proteins, with CSE treatment (Figure 8A). Western blot analysis confirmed our proteomic results for catalase, which showed elevated content post-CSE treatment but with a more modest increase for HR cells. Additionally, GPX1 decreased in HR cells post-CSE treatment but not in LR cells (Figure 8B, C), which was similar to the observed change in GPX4 (Fig. 8A). These data suggest that HR cells have a reduced ability to counteract chronic oxidative stress, which may explain the greater reduction in mitochondrial function in HR RPE following CSE treatment.
Figure 8. Genotype-dependent Response to Stress.

(A) Bar plots show the fold change of antioxidants and detoxification proteins in both LR and HR cells post-CSE treatment. n=4 / genotype. (B, C) Western blots and densitometry of antibody reaction provides estimate of GPX1 and catalase content in HR and LR cells. n=4~6 / genotype. (D) Bar plots illustrate the fold change of F120A, F120B and F120C in both LR and HR cells post-CSE treatment. Data in A and D are derived from the global proteomics quantification. Data = mean ± SD, ns=not significant, * p <0.05, ** p < 0.01, *** p< 0.001.
The peroxisome proliferator-activated receptor gamma (PPARG) signaling pathway has been reported to regulate the antioxidant response [39, 40]. The proteomics data also showed a differential response of proteins involved in this pathway in HR cells. Although PGC1a was not detected in the proteomics data most likely due to its low abundance, F120A (Constitutive coactivator of PPAR-gamma-like protein 1) and F120B (Constitutive coactivator of PPAR-gamma) were decreased in HR cells but not LR cells. In contrast, F120C (Constitutive coactivator of PPAR-gamma-like protein 2) was significantly upregulated in LR cells but not HR cells (Figure 8D). Taken together, findings from our protein analysis revealed genotype-specific differences in the proteome at baseline (Fig. 7) and in response to chronic stress, especially with proteins involved in the stress response (Fig. 8). These novel results suggest CFH may have intracellular functions that extend beyond its canonical role in regulating the immune response.
Discussion
The purpose of this study was to investigate the effects of the prominent genetic and environmental risk factors for AMD, the Y402H polymorphism in CFH and cigarette smoke. Using targeted and discovery-based approaches in cultured iPSC-RPE derived from human donors, we show chronic (two weeks) CSE exposure caused a dose-dependent increase in mitochondrial ROS and damage that correlated with the decrease in mitochondrial function. Long-term CSE treatment also significantly altered the metabolic and proteomic profiles, providing novel insights into how smoking could contribute to AMD pathology. Genotype-dependent differences at baseline as well as in response to CSE were observed, including diminished antioxidant defense in HR cells that may contribute to the observed a greater reduction in mitochondrial function. These results also suggest that HR cells have an inadequate adaptive mechanism, leading to deleterious outcomes.
Multiple studies have used patient-derived iPSC-RPE as a “disease in a dish” in vitro platform for testing drugs and studying disease mechanism. Since iPSC-RPE replicate the patients genetic background, they are especially valuable in testing the efficacy of treatments, thereby providing an opportunity to move towards personalized medicine. By selecting a specific patient population to study, investigations with iPSC-RPE have gained fundamental insight into disease mechanisms for both monogenic diseases, such as Best disease [41, 42] and Sorsby’s Fundus Dystrophy [43], as well as genetically complex diseases, such as AMD [21–23, 44]. Investigations focusing on specific risk SNPs associated with AMD have revealed key insight into potential pathologic mechanisms. Studies of iPSC-RPE harboring the ARMS2/HTRA1 (rs1040924/rs11200638) genes, which confer the greatest risk for AMD, showed greater susceptibility to oxidative damage, reduced antioxidant defense, and higher expression of inflammatory molecules [45, 46]. Our laboratory and others have shown that iPSC-RPE expressing the CFH high risk SNP have reduced mitochondrial function, increased inflammation and cellular stress, deposition of lipid droplets, damaged lysosomes and reduced autophagy [21, 24, 25]. Taken together, results from the current and previous studies support the use of iPSC-RPE to reveal how specific genetic variants drive disease pathology.
Cigarette smoke, composed of more than 9,000 chemicals [47], is the single most important environmental risk factor for developing AMD. Pro-oxidant compounds, such as hydroquinone and acrolein, are part of the complex chemical mixture and have been shown to cause significant oxidative damage to mitochondria and actin cytoskeleton reorganization in cultured RPE [17, 48]. The effect of CSE, first extensively characterized in ARPE-19 and human primary RPE cells, showed evidence of elevated superoxide production and oxidative damage to proteins and lipids, mitochondrial damage, and decreased glutathione content [14]. Later studies with CSE confirmed the significant damaging effect on mitochondria [16, 49] and showed CSE-induced complement activation [50, 51]. It is important to note that these studies measured the effect of CSE after an acute dose, which is in contrast with our chronic treatment that measured the effect after two weeks.
Consistent with findings after an acute dose of CSE, chronic long-term CSE induced complement activation (Supplement Fig 1) and caused significant damage to mitochondria resulting in reduced function (Fig 4). Although insufficient to restore function, the novel observation of increased mitochondrial content (Fig 2,3) may be an attempt by the cell to compensate for damaged mitochondria. Our proteomic analysis provided an extensive overview of other major changes induced by CSE, including upregulation of pathways involving the detoxification/protection from oxidative stress and multiple mitochondrial processes in addition to oxidative phosphorylation (Fig. 6). These results parallel prior reports of upregulation of the unfolded protein response and ER stress markers after an acute CSE treatment [51, 52]. Additionally, the dramatic increase of adipogenesis proteins observed in our proteomics suggested an increase in lipid droplet formation following CSE treatment. Previous studies have shown that cigarette smoke exposure significantly alters the lipid profiles in both in vitro and in vivo models, including increased total cholesterol, triglycerides, low-density lipoprotein cholesterol and lipid droplet accumulation[51, 53, 54]. Since dysregulated lipid metabolism plays a significant role in the AMD pathology [4, 55, 56]. our future studies will focus on how oxidative stress affects lipid profiles in both CFH LR and HR cells. Downregulation of proteins involved in EMT, apical junctions, and cytoskeleton networks indicates compromised cell cytoskeleton organization, cell polarity, and signal transduction after chronic oxidative stress. Previous studies reported altered ZO-1 staining and dysmorphic cell shape, consistent with protein changes associated with cytoskeletal reorganization [52]. We also observed downregulation of proteins essential for melanogenesis that paralleled the obvious hypopigmentation of CSE-treated RPE cultures (Fig. 1). The reduced uptake of tyrosine, a precursor for melanin synthesis, further supports the idea of decreased melanin production (Fig 5; Supplementary Fig 3). A reduction in melanin production was also observed following a single dose of either hydroquinone or hydrogen peroxide [57, 58], suggesting the loss of pigmentation may be a general response of the RPE to oxidative stress. These in vitro observations may have application to the clinic, where RPE hypopigmentation in AMD patients is often observed [59]. Melanin functions as a free radical scavenger, offers photoprotection to underlying layers, and binds potentially harmful metals within the RPE. RPE melanin does not regenerate, so the loss of melanin due to oxidative stress can have a significant detrimental effect on the cell survival.
Chronic CSE treatment also had profound effects on RPE metabolism, significantly altering the consumption and secretion of various metabolites. These changes not only suggest oxidative stress induced by CSE, as evidenced by increased secretion of oxidized glutathione and altered levels of carnosine, but also indicate impaired mitochondrial function. The altered metabolites span a wide range of processes, including nutrient transport, the TCA cycle, amino acid metabolism, ketone body synthesis, fatty acid oxidation, and nucleotide catabolism. Notably, similar metabolic disruptions have been observed in primary RPE cells with inhibited mitochondrial respiration, where extracellular metabolic changes closely reflected intracellular disturbances [33]. This strongly suggests that detrimental effects of CSE on RPE cells result mainly by induced mitochondrial dysfunction.
In addition to investigating the effect of CSE, the greatest environmental risk factor for AMD, we also examined how genotype influenced the outcomes we measured. The strong contribution of genetics on AMD risk, with an estimated heritability of 48- 71% [60], was mainly determined from genome-wide association studies (GWAS) of SNPs using large populations of patients and controls. One of these prominent studies identified 52 independent variants at 34 genetic loci associated with AMD [4]. Many of the variants are within genes involved in pathways associated with high-density lipoprotein/cholesterol processing (APOE, LIPC, CETP), extracellular/collagen matrix (TIMP3, COL8A1, COL10A1), angiogenesis signaling (VEGFA, TGFBR1), and the complement system (CFH, C2/CFB, C3, C9, CFI, VTN) [61]. One of the central questions in the field is how genetic variants confer risk for AMD, especially when these variants participate in disparate biological pathways. Multiple high-throughput “omics” techniques, analyzing DNA (genomics and epigenomics), RNA (transcriptomics), proteins (proteomics), metabolites (metabolomics) and lipids (lipidomics), have been used to reveal the functional consequences of AMD-causing variants [62]. These studies reported immune mediated processes, including inflammation, and oxidative stress response, as the most common mechanisms linked to the etiology of AMD. Quantitative trait loci (QTL) studies have also helped elucidate causal genes by overcoming the limitation of GWAS, which identified many SNPs located in non-coding regions that often contain regulatory elements for neighboring or distant genes. A recent study integrating QTL mapping of DNA methylation and expression with AMD-GWAS variants identified 87 genes that likely mediate AMD genotype effects [63]. Of note, the QTL study identified epigenetic regulation of immune response and metabolism, as well as processes involving glutathione, which are pathways revealed in our proteomic analysis that showed genotype-specific differences.
Of the 52 variants that were independently associated with AMD in the GWAS study, more than one third of these variants reside in or close to a gene in the complement system [64]. The overrepresentation of the complement system in the GWAS SNP list emphasizes the importance of this pathway in contributing to AMD pathology. As part of the innate immune response, the role of extracellular complement in recognizing and removing pathogens and waste material is well described. While the liver is the main source of complement proteins in circulation, ocular tissue, including the RPE (Supplement Table 5), also produce complement proteins that act locally. Recent studies have begun defining a new role for intracellular complement in regulating multiple cellular processes by describing cellular phenotypes associated with CFH genotypes in iPSC-RPE or after silencing CFH expression in hTERT-RPE. Examples of the CFH genotype-dependent cellular changes include mitochondrial dysfunction and metabolic disruptions [21, 24, 65], oxidative damage to proteins, lipids, and DNA [65–67], altered lipid profile and lipid accumulation [24, 65, 68], decreased proteolysis and lysosomal dysfunction [25, 69, 70], and increased inflammation [71, 72]. These CFH genotype-dependent differences provide an indication of the cellular processes that CFH either directly or indirectly regulates, including metabolism, protection from oxidative stress, protein degradation, and regulation of lipids.
Consistent with the above-mentioned studies, results from our bioinformatic analysis of the altered proteins revealed many of the genotype-dependent changes involved pathways in the mitochondria, lipid metabolism, detoxification, the cytoskeleton and extracellular matrix (ECM) (Fig. 7). These changes were present in untreated cells, suggesting fundamental differences in RPE protein content in CFH HR cells that could elicit multiple detrimental effects. For example, adverse changes to RPE mitochondria and lipid metabolism could prime the cell for a bioenergetic crisis, a mechanism previously proposed for AMD [73]. The RPE and photoreceptors form a metabolic ecosystem where the cells are co-dependent on each other for survival and partition metabolites used to produce energy [74, 75]. Damage to RPE mitochondria due to AMD would disrupt the delicate distribution of metabolites, leading to energy deficits and eventual death of both the RPE and photoreceptors, a hallmark of advanced AMD. Likewise, the scenario created by destabilizing RPE cytoskeleton and ECM would compromise retinal function by reducing the ability of the RPE to form a physical barrier between the retina and Bruch’s membrane/choroid thereby disrupting the selective flow of nutrients, molecules, and waste products into and out of the retina. Disruption in RPE barrier function could also permit abnormal choroidal blood vessels to transverse the barrier into the retina, an action associated with choroidal neovascularization or wet AMD [76]. Thus, the genotype-dependent changes in protein content observed in our study provides novel insight into the cellular changes that increase the risk for developing advanced AMD in patients harboring the HR CFH genotype. These results also provide a putative mechanistic basis for impaired RPE homeostasis, which likely contributes to AMD pathogenesis and progression.
In addition to monitoring the effect of CSE and genotype, we also checked for possible interactions between these main effects. The proteins exhibiting significant interaction are likely relevant to disease causation as they reflect genotype-dependent differences in response to stress. Of the 935 proteins exhibiting significant interaction, 109 proteins in nucleic acid metabolism and endosome/membrane trafficking were downregulated only in HR cells. In contrast to HR cells, nucleic acid metabolism was upregulated in LR cells. DNA and mRNA metabolism are required to replace damaged proteins or for altering protein content to adjust to stress, so the reduction in this process would limit the HR cell’s ability to recover from the CSE-induced stress. The processes of endocytosis and membrane trafficking enables material from the plasma membrane and external environment, such as cell surface receptors and phagocytosed outer segments, to enter the cell and be transported to specific cell compartments [77]. The reduction in endocytic/trafficking proteins in HR cells treated with CSE could hamper phagocytosis of outer segments, which is relevant to AMD as phagocytic dysfunction has been reported in cultured RPE from AMD patients [78]. RPE endocytosis can also protect from complement-mediated membrane attack via the uptake and internal transport of the membrane attack complex (MAC) to the lysosomes [79]. Downregulation of MAC endocytosis in HR RPE would be particularly detrimental to cell survival considering the reduced ability of the mutant CFH protein to inhibit the complement cascade thereby allowing for more MAC on RPE. This idea is experimentally supported by the reported 69% increased MAC deposition on the RPE/choroid from AMD donors homozygous for the HR CFH genotype compared with LR donors [80].
In LR RPE, the 84 proteins that were significantly upregulated were involved in detoxification, nucleotide and lipid metabolism. Important detoxification proteins include enzymatic antioxidants, such as SOD2, catalase, and several members of the glutathione S-transferase family, which were significantly upregulated, indicating a robust antioxidant response that would help protect the cell from damage. In contrast, HR cells demonstrated a less pronounced response, with either no significant or reduced upregulation of some antioxidants. Upregulation of lipid metabolism in LR cells would be beneficial as lipids are critical for repairing or building cell membranes and for use as an energy source. Taken together, these results show contrasting differences in the way LR and HR cells are responding to CSE-induced stress and highlight potential sites of defect that could promote HR RPE dysfunction or death.
In summary, iPSC-RPE are an ideal model system to interrogate the effect of genetic background with or without environmental stressors. Advantages of iPSC-RPE include the ability to generate cell lines from many different genetic backgrounds and from a variety of somatic cell sources that are readily obtainable from patients. Additionally, the potential for nearly unlimited expansion is critical when large cell numbers are required for analyses or treatments, such as testing multiple doses of CSE in the current study. Limitations of this study include the relatively small number of individual biological samples that were compared, which may bias our results. Another limitation is the potential for changes in epigenetic markers during cell reprogramming that may remove characteristics relevant to AMD. However, we view the loss of epigenetic markers as an advantage for our study as it provides a clean slate for focusing on genetic background as the main effect. A final caveat is that while our results implicate the observed proteome changes are directly associated with the CFH genotype, it is possible that this effect may be indirect due to other currently unknown polymorphisms linked to CFH.
Conclusions
Using CSE as a physiologically relevant environmental stressor, we showed that exposure of iPSC-RPE to chronic CSE treatment has a significant effect on the proteome and metabolome, with mitochondria as one of the major targets affected by the treatment. We also found genotype-specific difference in the proteome at baseline and in response to stress. These differences in protein content could place CFH 402H HR RPE at greater risk for damage, making them less resilient to environmental stress. Taken together, our observations provide a putative mechanism for the increased risk in developing advanced AMD for patients harboring the HR CFH genotype.
In addition to providing novel insights into how the CFH HR variant and cigarette smoke extract confer risk for developing AMD, the large database produced by this study will serve as a valuable resource for generating hypotheses and planning future experiments. The database also provides an opportunity for in-depth analysis of specific altered pathways, which could reveal site(s) for new interventions to treat AMD.
Supplementary Material
Supplementary Figure 1. The abundance of complement proteins in cells with or without CSE treatment is provided from log2 transformed intensities. Significance was determined by repeated measures two-way ANOVA analysis. C (CSE), G (genotype), C&G (the interaction of genotype and CSE)., ns= not significant, * p<0.05, *** p< 0.001, **** p < 0.0001. Data from individual cell lines are shown.
Supplementary Figure 2. Heatmaps show normalized abundance of proteins involved in oxidative phosphorylation (OxPhos) for Complexes I to V (A), the tricarboxylic acid (TCA) cycle (B), and mitochondrial structural protein complexes, translocase of the outer and inner membrane (TOM/TIM) (C).
Supplementary Figure 3. Heatmap shows normalized abundance of metabolites altered by CSE in the conditioned media. Secreted metabolites are highlighted in yellow.
Supplementary Figure 4. Heatmap shows proteins that were altered only by genotype (A) and the pathway analysis (B).
Highlights.
The Y402H polymorphism of complement factor H and cigarette smoke are predominant genetic and environmental risk factors for age-related macular degeneration.
iPSC-RPE from human donors harboring either the high-risk or low-risk genetic profiles was an excellent model system for distinguishing genotype-dependent differences.
Cell exposure to cigarette smoke extra (CSE) showed significant detrimental effects on the mitochondria.
HR iPSC-RPE showed significant differences in proteins associated with the cytoskeleton and in MAPK signaling at baseline and less robust antioxidant response after CSE treatment.
LR cell upregulated proteins involved in lipid metabolism and chemical detoxification after CSE exposure.
Acknowledgements:
Support: National Institutes of Health R01 EY028554 (to DF and JRD); EY031324 (to J. D.), EY032462 (to J. D.), The Stephen J. Ryan-Arnold and Mabel Beckman Foundation (to DAF); The Retina Research Foundation (to J. D.). This work is also supported in part by an unrestricted grant from Research to Prevent Blindness, Inc. to the Department of Ophthalmology at UCLA.
Footnotes
Publisher's Disclaimer: This is a PDF file of an unedited manuscript that has been accepted for publication. As a service to our customers we are providing this early version of the manuscript. The manuscript will undergo copyediting, typesetting, and review of the resulting proof before it is published in its final form. Please note that during the production process errors may be discovered which could affect the content, and all legal disclaimers that apply to the journal pertain.
Credits:
Conceptualization- DF, JRD
Data Curation- PS, HA, JH
Formal Analysis- PS, JH, ME, XZ, SS
Funding Acquisition- DF, JRD
Investigation- PS, HA, JH, ZG, XZ, SS, ME, MZ
Methodology- PS, SS, ME
Project administration- PS, ZG
Resources- DF, JD, JRD, JQ, SM
Supervision- DF, JRD, JQ, JD
Visualization- PS, JH, EH
Writing original draft- PS, DF
Writing- review & editing- PS, HA, JH, ZG, XZ, SS, ME, EH, MZ, JQ, JD, SM, JRD, DF
Declarations of interest: None
References
- 1.Friedman DS, et al. Prevalence of age-related macular degeneration in the United States. Arch Ophthalmol, 2004. 122(4): p. 564–72. [DOI] [PubMed] [Google Scholar]
- 2.Wong WL, et al. Global prevalence of age-related macular degeneration and disease burden projection for 2020 and 2040: a systematic review and meta-analysis. Lancet Glob Health, 2014. 2(2): p. e106–16. [DOI] [PubMed] [Google Scholar]
- 3.Velilla S, et al. Smoking and age-related macular degeneration: review and update. J Ophthalmol, 2013. 2013: p. 895147. [DOI] [PMC free article] [PubMed] [Google Scholar]
- 4.Fritsche LG, et al. A large genome-wide association study of age-related macular degeneration highlights contributions of rare and common variants. Nat Genet, 2016. 48(2): p. 134–43. [DOI] [PMC free article] [PubMed] [Google Scholar]
- 5.Sofat R, et al. Complement factor H genetic variant and age-related macular degeneration: effect size, modifiers and relationship to disease subtype. Int J Epidemiol, 2012. 41(1): p. 250–62. [DOI] [PMC free article] [PubMed] [Google Scholar]
- 6.Schaumberg DA, et al. A prospective study of 2 major age-related macular degeneration susceptibility alleles and interactions with modifiable risk factors. Arch Ophthalmol, 2007. 125(1): p. 55–62. [DOI] [PubMed] [Google Scholar]
- 7.Edwards AO, et al. Complement factor H polymorphism and age-related macular degeneration. Science, 2005. 308(5720): p. 421–4. [DOI] [PubMed] [Google Scholar]
- 8.Ferreira VP, Pangburn MK, and Cortes C, Complement control protein factor H: the good, the bad, and the inadequate. Mol Immunol, 2010. 47(13): p. 2187–97. [DOI] [PMC free article] [PubMed] [Google Scholar]
- 9.Clark SJ, et al. Impaired binding of the age-related macular degeneration-associated complement factor H 402H allotype to Bruch’s membrane in human retina. J Biol Chem, 2010. 285(39): p. 30192–202. [DOI] [PMC free article] [PubMed] [Google Scholar]
- 10.Tan JS, et al. Smoking and the long-term incidence of age-related macular degeneration: the Blue Mountains Eye Study. Arch Ophthalmol, 2007. 125(8): p. 1089–95. [DOI] [PubMed] [Google Scholar]
- 11.Blindness GBD, Vision Impairment C, and Vision S Loss Expert Group of the Global Burden of Disease, Causes of blindness and vision impairment in 2020 and trends over 30 years, and prevalence of avoidable blindness in relation to VISION 2020: the Right to Sight: an analysis for the Global Burden of Disease Study. Lancet Glob Health, 2021. 9(2): p. e144–e160. [DOI] [PMC free article] [PubMed] [Google Scholar]
- 12.Seddon JM, Widjajahakim R, and Rosner B, Rare and Common Genetic Variants, Smoking, and Body Mass Index: Progression and Earlier Age of Developing Advanced Age-Related Macular Degeneration. Invest Ophthalmol Vis Sci, 2020. 61(14): p. 32. [DOI] [PMC free article] [PubMed] [Google Scholar]
- 13.Despriet DD, et al. Complement factor H polymorphism, complement activators, and risk of age-related macular degeneration. JAMA, 2006. 296(3): p. 301–9. [DOI] [PubMed] [Google Scholar]
- 14.Bertram KM, et al. Molecular regulation of cigarette smoke induced-oxidative stress in human retinal pigment epithelial cells: implications for age-related macular degeneration. Am J Physiol Cell Physiol, 2009. 297(5): p. C1200–10. [DOI] [PMC free article] [PubMed] [Google Scholar]
- 15.Huang C, et al. Erp29 Attenuates Cigarette Smoke Extract-Induced Endoplasmic Reticulum Stress and Mitigates Tight Junction Damage in Retinal Pigment Epithelial Cells. Invest Ophthalmol Vis Sci, 2015. 56(11): p. 6196–207. [DOI] [PMC free article] [PubMed] [Google Scholar]
- 16.Henning Y, et al. Cigarette smoke causes a bioenergetic crisis in RPE cells involving the downregulation of HIF-1alpha under normoxia. Cell Death Discov, 2023. 9(1): p. 398. [DOI] [PMC free article] [PubMed] [Google Scholar]
- 17.Pons M, et al. Cigarette smoke-related hydroquinone induces filamentous actin reorganization and heat shock protein 27 phosphorylation through p38 and extracellular signal-regulated kinase 1/2 in retinal pigment epithelium: implications for age-related macular degeneration. Am J Pathol, 2010. 177(3): p. 1198–213. [DOI] [PMC free article] [PubMed] [Google Scholar]
- 18.Strauss O, The retinal pigment epithelium in visual function. Physiol Rev, 2005. 85(3): p. 845–81. [DOI] [PubMed] [Google Scholar]
- 19.Ferrington DA, et al. Altered bioenergetics and enhanced resistance to oxidative stress in human retinal pigment epithelial cells from donors with age-related macular degeneration. Redox Biol, 2017. 13: p. 255–265. [DOI] [PMC free article] [PubMed] [Google Scholar]
- 20.Golestaneh N, et al. Dysfunctional autophagy in RPE, a contributing factor in age-related macular degeneration. Cell Death Dis, 2017. 8(1): p. e2537. [DOI] [PMC free article] [PubMed] [Google Scholar]
- 21.Ebeling MC, et al. Impaired Mitochondrial Function in iPSC-Retinal Pigment Epithelium with the Complement Factor H Polymorphism for Age-Related Macular Degeneration. Cells, 2021. 10(4). [DOI] [PMC free article] [PubMed] [Google Scholar]
- 22.Golestaneh N, et al. Repressed SIRT1/PGC-1alpha pathway and mitochondrial disintegration in iPSC-derived RPE disease model of age-related macular degeneration. J Transl Med, 2016. 14(1): p. 344. [DOI] [PMC free article] [PubMed] [Google Scholar]
- 23.Gong J, et al. Stem cell-derived retinal pigment epithelium from patients with age-related macular degeneration exhibit reduced metabolism and matrix interactions. Stem Cells Transl Med, 2020. 9(3): p. 364–376. [DOI] [PMC free article] [PubMed] [Google Scholar]
- 24.Hallam D, et al. An Induced Pluripotent Stem Cell Patient Specific Model of Complement Factor H (Y402H) Polymorphism Displays Characteristic Features of Age-Related Macular Degeneration and Indicates a Beneficial Role for UV Light Exposure. Stem Cells, 2017. 35(11): p. 2305–2320. [DOI] [PMC free article] [PubMed] [Google Scholar]
- 25.Cerniauskas E, et al. Complement modulation reverses pathology in Y402H-retinal pigment epithelium cell model of age-related macular degeneration by restoring lysosomal function. Stem Cells Transl Med, 2020. 9(12): p. 1585–1603. [DOI] [PMC free article] [PubMed] [Google Scholar]
- 26.Ferrington DA, et al. Increased retinal mtDNA damage in the CFH variant associated with age-related macular degeneration. Exp Eye Res, 2016. 145: p. 269–277. [DOI] [PMC free article] [PubMed] [Google Scholar]
- 27.Geng Z, et al. Generation of retinal pigmented epithelium from iPSCs derived from the conjunctiva of donors with and without age related macular degeneration. PLoS One, 2017. 12(3): p. e0173575. [DOI] [PMC free article] [PubMed] [Google Scholar]
- 28.Chacko BK, et al. The Bioenergetic Health Index: a new concept in mitochondrial translational research. Clin Sci (Lond), 2014. 127(6): p. 367–73. [DOI] [PMC free article] [PubMed] [Google Scholar]
- 29.Shen S, et al. Surfactant Cocktail-Aided Extraction/Precipitation/On-Pellet Digestion Strategy Enables Efficient and Reproducible Sample Preparation for Large-Scale Quantitative Proteomics. Anal Chem, 2018. 90(17): p. 10350–10359. [DOI] [PubMed] [Google Scholar]
- 30.Shen S, et al. Quantitative Proteomics of Human Retinal Pigment Epithelium Reveals Key Regulators for the Pathogenesis of Age-Related Macular Degeneration. Int J Mol Sci, 2023. 24(4). [DOI] [PMC free article] [PubMed] [Google Scholar]
- 31.Shen S, et al. High-quality and robust protein quantification in large clinical/pharmaceutical cohorts with IonStar proteomics investigation. Nat Protoc, 2023. 18(3): p. 700–731. [DOI] [PMC free article] [PubMed] [Google Scholar]
- 32.Li B, et al. Metabolic Features of Mouse and Human Retinas: Rods versus Cones, Macula versus Periphery, Retina versus RPE. iScience, 2020. 23(11): p. 101672. [DOI] [PMC free article] [PubMed] [Google Scholar]
- 33.Zhang R, et al. Inhibition of Mitochondrial Respiration Impairs Nutrient Consumption and Metabolite Transport in Human Retinal Pigment Epithelium. J Proteome Res, 2021. 20(1): p. 909–922. [DOI] [PMC free article] [PubMed] [Google Scholar]
- 34.Olsen TW and Feng X, The Minnesota Grading System of eye bank eyes for age-related macular degeneration. Invest Ophthalmol Vis Sci, 2004. 45(12): p. 4484–90. [DOI] [PubMed] [Google Scholar]
- 35.Mishra S, Moulik S, and Murphy LJ, Prohibitin binds to C3 and enhances complement activation. Mol Immunol, 2007. 44(8): p. 1897–902. [DOI] [PubMed] [Google Scholar]
- 36.Wensel TG, Phosphoinositides in Retinal Function and Disease. Cells, 2020. 9(4). [DOI] [PMC free article] [PubMed] [Google Scholar]
- 37.Shang P, et al. betaA3/A1-crystallin regulates apical polarity and EGFR endocytosis in retinal pigmented epithelial cells. Commun Biol, 2021. 4(1): p. 850. [DOI] [PMC free article] [PubMed] [Google Scholar]
- 38.Bonilha VL, Finnemann SC, and Rodriguez-Boulan E, Ezrin promotes morphogenesis of apical microvilli and basal infoldings in retinal pigment epithelium. J Cell Biol, 1999. 147(7): p. 1533–48. [DOI] [PMC free article] [PubMed] [Google Scholar]
- 39.Muzio G, Barrera G, and Pizzimenti S, Peroxisome Proliferator-Activated Receptors (PPARs) and Oxidative Stress in Physiological Conditions and in Cancer. Antioxidants (Basel), 2021. 10(11). [DOI] [PMC free article] [PubMed] [Google Scholar]
- 40.Kim T and Yang Q, Peroxisome-proliferator-activated receptors regulate redox signaling in the cardiovascular system. World J Cardiol, 2013. 5(6): p. 164–74. [DOI] [PMC free article] [PubMed] [Google Scholar]
- 41.Singh R, et al. iPS cell modeling of Best disease: insights into the pathophysiology of an inherited macular degeneration. Hum Mol Genet, 2013. 22(3): p. 593–607. [DOI] [PMC free article] [PubMed] [Google Scholar]
- 42.Marmorstein AD, et al. Mutant Best1 Expression and Impaired Phagocytosis in an iPSC Model of Autosomal Recessive Bestrophinopathy. Sci Rep, 2018. 8(1): p. 4487. [DOI] [PMC free article] [PubMed] [Google Scholar]
- 43.Galloway CA, et al. Drusen in patient-derived hiPSC-RPE models of macular dystrophies. Proc Natl Acad Sci U S A, 2017. 114(39): p. E8214–E8223. [DOI] [PMC free article] [PubMed] [Google Scholar]
- 44.Ebeling MC, et al. Testing Mitochondrial-Targeted Drugs in iPSC-RPE from Patients with Age-Related Macular Degeneration. Pharmaceuticals (Basel), 2022. 15(1). [DOI] [PMC free article] [PubMed] [Google Scholar]
- 45.Yang J, et al. Validation of genome-wide association study (GWAS)-identified disease risk alleles with patient-specific stem cell lines. Hum Mol Genet, 2014. 23(13): p. 3445–55. [DOI] [PMC free article] [PubMed] [Google Scholar]
- 46.Saini JS, et al. Nicotinamide Ameliorates Disease Phenotypes in a Human iPSC Model of Age-Related Macular Degeneration. Cell Stem Cell, 2017. 20(5): p. 635–647 e7. [DOI] [PMC free article] [PubMed] [Google Scholar]
- 47.Rodgman A, and Perfetti TA, The chemical components of tobacco and tobacco smoke. 2nd ed. 2013, Boca Raton: CRC Press, xciii, 2238 p. [Google Scholar]
- 48.Jia L, et al. Acrolein, a toxicant in cigarette smoke, causes oxidative damage and mitochondrial dysfunction in RPE cells: protection by (R)-alpha-lipoic acid. Invest Ophthalmol Vis Sci, 2007. 48(1): p. 339–48. [DOI] [PMC free article] [PubMed] [Google Scholar]
- 49.Cano M, et al. Nrf2 deficiency decreases NADPH from impaired IDH shuttle and pentose phosphate pathway in retinal pigmented epithelial cells to magnify oxidative stress-induced mitochondrial dysfunction. Aging Cell, 2021. 20(8): p. e13444. [DOI] [PMC free article] [PubMed] [Google Scholar]
- 50.Wang L, et al. Nrf2 signaling modulates cigarette smoke-induced complement activation in retinal pigmented epithelial cells. Free Radic Biol Med, 2014. 70: p. 155–66. [DOI] [PMC free article] [PubMed] [Google Scholar]
- 51.Kunchithapautham K, Atkinson C, and Rohrer B, Smoke exposure causes endoplasmic reticulum stress and lipid accumulation in retinal pigment epithelium through oxidative stress and complement activation. J Biol Chem, 2014. 289(21): p. 14534–46. [DOI] [PMC free article] [PubMed] [Google Scholar]
- 52.Cano M, et al. Oxidative stress induces mitochondrial dysfunction and a protective unfolded protein response in RPE cells. Free Radic Biol Med, 2014. 69: p. 1–14. [DOI] [PMC free article] [PubMed] [Google Scholar]
- 53.Ma B, et al. Cigarette smoke exposure impairs lipid metabolism by decreasing low-density lipoprotein receptor expression in hepatocytes. Lipids Health Dis, 2020. 19(1): p. 88. [DOI] [PMC free article] [PubMed] [Google Scholar]
- 54.Yang Y, et al. Cigarette smoking exposure breaks the homeostasis of cholesterol and bile acid metabolism and induces gut microbiota dysbiosis in mice with different diets. Toxicology, 2021. 450: p. 152678. [DOI] [PubMed] [Google Scholar]
- 55.Malek G, et al. Apolipoprotein B in cholesterol-containing drusen and basal deposits of human eyes with age-related maculopathy. Am J Pathol, 2003. 162(2): p. 413–25. [DOI] [PMC free article] [PubMed] [Google Scholar]
- 56.Colijn JM, et al. Increased High-Density Lipoprotein Levels Associated with Age-Related Macular Degeneration: Evidence from the EYE-RISK and European Eye Epidemiology Consortia. Ophthalmology, 2019. 126(3): p. 393–406. [DOI] [PubMed] [Google Scholar]
- 57.Nishiyama T, et al. Alteration in Melanin Content in Retinal Pigment Epithelial Cells upon Hydroquinone Exposure. Int J Mol Sci, 2023. 24(23). [DOI] [PMC free article] [PubMed] [Google Scholar]
- 58.Jimenez-Cervantes C, et al. Inhibition of melanogenesis in response to oxidative stress: transient downregulation of melanocyte differentiation markers and possible involvement of microphthalmia transcription factor. J Cell Sci, 2001. 114(Pt 12): p. 2335–44. [DOI] [PubMed] [Google Scholar]
- 59.Kaufmann M and Han Z, RPE melanin and its influence on the progression of AMD. Ageing Res Rev, 2024. 99: p. 102358. [DOI] [PMC free article] [PubMed] [Google Scholar]
- 60.Seddon JM, et al. The US twin study of age-related macular degeneration: relative roles of genetic and environmental influences. Arch Ophthalmol, 2005. 123(3): p. 321–7. [DOI] [PubMed] [Google Scholar]
- 61.Priya RR, Chew EY, and Swaroop A, Genetic studies of age-related macular degeneration: lessons, challenges, and opportunities for disease management. Ophthalmology, 2012. 119(12): p. 2526–36. [DOI] [PMC free article] [PubMed] [Google Scholar]
- 62.Lauwen S, et al. Omics Biomarkers in Ophthalmology. Invest Ophthalmol Vis Sci, 2017. 58(6): p. BIO88–BIO98. [DOI] [PubMed] [Google Scholar]
- 63.Advani J, et al. QTL mapping of human retina DNA methylation identifies 87 gene-epigenome interactions in age-related macular degeneration. Nat Commun, 2024. 15(1): p. 1972. [DOI] [PMC free article] [PubMed] [Google Scholar]
- 64.Geerlings MJ, de Jong EK, and den Hollander AI, The complement system in age-related macular degeneration: A review of rare genetic variants and implications for personalized treatment. Mol Immunol, 2017. 84: p. 65–76. [DOI] [PMC free article] [PubMed] [Google Scholar]
- 65.Armento A, et al. Loss of Complement Factor H impairs antioxidant capacity and energy metabolism of human RPE cells. Sci Rep, 2020. 10(1): p. 10320. [DOI] [PMC free article] [PubMed] [Google Scholar]
- 66.Velazquez-Soto H, et al. Exogenous CFH Modulates Levels of Pro-Inflammatory Mediators to Prevent Oxidative Damage of Retinal Pigment Epithelial Cells with the At-Risk CFH Y402H Variant. Antioxidants (Basel), 2023. 12(8). [DOI] [PMC free article] [PubMed] [Google Scholar]
- 67.Borras C, et al. CFH exerts anti-oxidant effects on retinal pigment epithelial cells independently from protecting against membrane attack complex. Sci Rep, 2019. 9(1): p. 13873. [DOI] [PMC free article] [PubMed] [Google Scholar]
- 68.Kurzawa-Akanbi M, et al. Retinal pigment epithelium extracellular vesicles are potent inducers of age-related macular degeneration disease phenotype in the outer retina. J Extracell Vesicles, 2022. 11(12): p. e12295. [DOI] [PMC free article] [PubMed] [Google Scholar]
- 69.Armento A, Ueffing M, and Clark SJ, The complement system in age-related macular degeneration. Cell Mol Life Sci, 2021. 78(10): p. 4487–4505. [DOI] [PMC free article] [PubMed] [Google Scholar]
- 70.Ramos de Carvalho JE, et al. Complement factor C3a alters proteasome function in human RPE cells and in an animal model of age-related RPE degeneration. Invest Ophthalmol Vis Sci, 2013. 54(10): p. 6489–501. [DOI] [PubMed] [Google Scholar]
- 71.Armento A, et al. CFH Loss in Human RPE Cells Leads to Inflammation and Complement System Dysregulation via the NF-kappaB Pathway Int J Mol Sci, 2021. 22(16). [DOI] [PMC free article] [PubMed] [Google Scholar]
- 72.Cao S, et al. CFH Y402H polymorphism and the complement activation product C5a: effects on NF-kappaB activation and inflammasome gene regulation. Br J Ophthalmol, 2016. 100(5): p. 713–8. [DOI] [PMC free article] [PubMed] [Google Scholar]
- 73.Fisher CR and Ferrington DA, Perspective on AMD Pathobiology: A Bioenergetic Crisis in the RPE. Invest Ophthalmol Vis Sci, 2018. 59(4): p. AMD41–AMD47. [DOI] [PMC free article] [PubMed] [Google Scholar]
- 74.Hurley JB, Lindsay KJ, and Du J, Glucose, lactate, and shuttling of metabolites in vertebrate retinas. J Neurosci Res, 2015. 93(7): p. 1079–92. [DOI] [PMC free article] [PubMed] [Google Scholar]
- 75.Adijanto J, et al. The retinal pigment epithelium utilizes fatty acids for ketogenesis. J Biol Chem, 2014. 289(30): p. 20570–82. [DOI] [PMC free article] [PubMed] [Google Scholar]
- 76.Campochiaro PA, Molecular pathogenesis of retinal and choroidal vascular diseases. Prog Retin Eye Res, 2015. 49: p. 67–81. [DOI] [PMC free article] [PubMed] [Google Scholar]
- 77.Storm T, Burgoyne T, and Futter CE, Membrane trafficking in the retinal pigment epithelium at a glance. J Cell Sci, 2020. 133(16). [DOI] [PubMed] [Google Scholar]
- 78.Inana G, et al. RPE phagocytic function declines in age-related macular degeneration and is rescued by human umbilical tissue derived cells. J Transl Med, 2018. 16(1): p. 63. [DOI] [PMC free article] [PubMed] [Google Scholar]
- 79.Georgiannakis A, et al. Retinal Pigment Epithelial Cells Mitigate the Effects of Complement Attack by Endocytosis of C5b-9. J Immunol, 2015. 195(7): p. 3382–9. [DOI] [PMC free article] [PubMed] [Google Scholar]
- 80.Mullins RF, et al. Elevated membrane attack complex in human choroid with high risk complement factor H genotypes. Exp Eye Res, 2011. 93(4): p. 565–7. [DOI] [PMC free article] [PubMed] [Google Scholar]
Associated Data
This section collects any data citations, data availability statements, or supplementary materials included in this article.
Supplementary Materials
Supplementary Figure 1. The abundance of complement proteins in cells with or without CSE treatment is provided from log2 transformed intensities. Significance was determined by repeated measures two-way ANOVA analysis. C (CSE), G (genotype), C&G (the interaction of genotype and CSE)., ns= not significant, * p<0.05, *** p< 0.001, **** p < 0.0001. Data from individual cell lines are shown.
Supplementary Figure 2. Heatmaps show normalized abundance of proteins involved in oxidative phosphorylation (OxPhos) for Complexes I to V (A), the tricarboxylic acid (TCA) cycle (B), and mitochondrial structural protein complexes, translocase of the outer and inner membrane (TOM/TIM) (C).
Supplementary Figure 3. Heatmap shows normalized abundance of metabolites altered by CSE in the conditioned media. Secreted metabolites are highlighted in yellow.
Supplementary Figure 4. Heatmap shows proteins that were altered only by genotype (A) and the pathway analysis (B).