Abstract
Pancreatic cancer (PC) is a malignancy of the gastrointestinal tract that is characterized by a poor prognosis. This study investigates the roles of immunogenic cell death (ICD) genes in the prognosis and progression of PC. Expression data for PC patients were obtained from The Cancer Genome Atlas (TCGA) and Gene Expression Omnibus (GEO) datasets, while ICD genes were sourced from published literature. We explored the expression patterns and identified two distinct clusters based on ICD genes. Kaplan–Meier analysis, differential expression analysis, tumor mutational burden analysis, and immune cell infiltration analysis were performed on these clusters. An ICD gene-based risk model was developed, categorizing samples from the TCGA and GEO datasets into low- and high-risk groups. Additionally, we investigated the expression levels of the genes included in the risk model within the TCGA cohort and our own samples. Finally, a loss-of-function assay was conducted to assess the role of MYD88 in PC. Two clusters of PC samples were identified, patients in the ICD-low cluster exhibited a higher degree of immune cell enrichment. The survival time of patients in the low-risk group was longer than that of those in the high-risk group. The genes included in the risk model (CASP1, MYD88, and PIK3CA) showed upregulated expression levels in tumor samples. Furthermore, the predictive accuracy of our risk model was validated using our own samples. Genetic inhibition of MYD88 led to significantly decreased proliferation and migration of PC cells in the loss-of-function assay. There were disparities in survival time and tumor immune microenvironment (TIME) between two ICD gene clusters. Additionally, we developed an ICD-related risk model that was validated as an independent prognostic indicator for patients with PC.
Supplementary Information
The online version contains supplementary material available at 10.1007/s10238-024-01533-7.
Keywords: Pancreatic cancer, Immunogenic cell death, Risk model, MYD88
Introduction
Pancreatic cancer (PC) is one of the most lethal malignancies, with a median survival time of only 6 months [1]. Despite advancements in surgical treatment, chemotherapy, and immune checkpoint therapy in recent decades, outcomes for PC patients remain bleak, with a 5-year survival rate of only 8% [2, 3]. Furthermore, PC was the fourth leading cause of cancer-related fatalities in Europe in 2020 and is projected to become the second leading cause by 2030 [4, 5].
Immunotherapy has demonstrated advancements in the realm of PC; however, compared to other cancer types, research in this area remains in its nascent stages [6, 7]. Immune checkpoint inhibitors serve to augment the immune system’s antitumor efficacy in PC by impeding the tumor cells’ evasions of immune surveillance. Despite initial advancements in utilizing immune checkpoint inhibitors for PC treatment, the overall response rate remains modest [8]. Vaccine therapies tailored to tumor-specific antigens possess the potential to elicit the patient’s immune response against PC cells, with ongoing clinical trials assessing the efficacy of various vaccine formulations in PC patients [9, 10]. CAR-T cell therapy represents a personalized immunotherapeutic approach involving the engineering of a patient’s own T cells for targeted tumor recognition and elimination [11]. Presently, investigations are underway on the prospective application of CAR-T cell therapy in managing PC [12]. Notwithstanding some headway in immunotherapy research for PC, persisting challenges encompass the immunosuppressive microenvironment characteristic of PC, inadequate tumor antigen expression levels, and tumor heterogeneity, all of which restrict the effectiveness of immunotherapy interventions [13]. As such, ongoing clinical investigations, novel immunotherapeutic initiatives, and tailored treatment strategies are pivotal areas of focus within this research domain.
Upon exposure to external stimuli, tumor cells undergo cell death, shifting from evading the immune response to activating it. This change initiates the immune reaction against the tumor in the host, known as immunogenic cell death (ICD) [14]. Throughout the ICD process in cancer cells, various signaling molecules are released, notably calreticulin displayed on the surface of the cell, High Mobility Group Box 1 (HMGB1) emitted by tumor cells, ATP molecules released from the cells, and heat shock proteins (HSP70 and HSP90) [15]. The released DAMPs can bind to Pattern Recognition Receptors (PRRs) on the surface of dendritic cells, which initiate a sequence of cellular reactions that eventually trigger both innate and adaptive immune responses.
This research focused on investigating the expression patterns of ICD genes in PC. The study revealed that the majority of these genes exhibited elevated expression levels in PC. Furthermore, we performed a clustering analysis of PC samples based on the expression of ICD genes and characterized the distinct clusters identified through survival analysis, Gene Ontology/Kyoto Encyclopedia of Genes and Genomes (GO/KEGG) enrichment analysis, mutation burden analysis, and immune infiltration analysis. Subsequently, a predictive model was developed using the ICD gene expression data from The Cancer Genome Atlas (TCGA) PC samples, and its performance was validated in an independent Gene Expression Omnibus (GEO) dataset. The results indicated that patients classified as high-risk according to the predictive model experienced significantly shorter survival times compared to those classified as low-risk. Moreover, we conducted a thorough investigation into the expression of the ICD gene, specifically MYD88 Innate Immune Signal Transduction Adaptor (MYD88), in PC. Through loss-of-function and gain-of-function assays, we outlined the potential mechanisms by which MYD88 may influence the onset and progression of PC. These findings provide valuable insights for predicting patient outcomes, identifying potential targets for immunotherapy, and improving the efficacy of immunotherapeutic interventions in PC.
Material and methods
Data collection
RNA-seq data and clinicopathological information for PC patients were collected from two different sources: TCGA database (https://portal.gdc.cancer.gov/) and the GEO database (https://www.ncbi.nlm.nih.gov/geo). The training set utilized PC samples from the TCGA-PAAD dataset, while the testing set incorporated PC samples from the GSE183795 and GSE57495 datasets. Additionally, the scRNA-seq data was obtained using TISCH database (http://tisch1.comp-genomics.org) based on GSE111672 dataset. To guarantee the study’s credibility, cases lacking survival data were excluded. Furthermore, a control group was incorporated for comparative assessment, which included full mRNA-seq information from healthy pancreas samples sourced from the Genotype-Tissue Expression (GTEx) initiative. Finally, to enhance the comparability of data across different sources and ensure the robustness of subsequent analyses, the potential batch effects were eliminated.
Consensus unsupervised clustering
The 34 ICD genes were acquired from published research, and attached in supplementary Table S2 [16]. To identify molecular clusters linked to ICD genes, we conducted unsupervised consensus clustering using the R package ‘ConsensusClusterPlus’. To ensure robustness, we obtained stable results by evaluating the optimal cluster numbers across a range from k = 2 to 9, repeated 1,000 times. The proportion of ambiguous clustering was used to ascertain the k value.
Identification of differentially expressed genes and functional enrichment
Differentially expressed genes (DEGs) were assessed with the R package ‘limma’. Significance criteria were defined as FDR p-values < 0.05 and an absolute log-fold change (logFC) > 1. The comparison of enriched pathways and biological functions with DEGs was conducted using GO, and KEGG through the ‘clusterProfiler’ R package, with a threshold of FDR p values below 0.05.
Tumor mutational burden (TMB)
The TMB for every sample was acquired, followed by summarization and analysis with the assistance of the ‘maftools’ package. Waterfall plots were used to visualize the mutational data, and survival analysis of different TMBs was conducted with the help of the ‘survminer’ and ‘survival’ packages.
Tumor-infiltrating immune cells profiles
To compare the differences in tumor immune microenvironment between the two clusters, we used several analyses. The ‘ESTIMATE’ package was used to calculate the tumor purity and immune scores initially (https://bioinformatics.mdanderson.org/estimate) [17]. Then the ‘CIBERSORT’ algorithm (https://cibersort.stanford.edu) and ‘MCPcounter’ package (http://github.com/ebecht/MCPcounter) were employed to evaluate the levels of infiltrating immune cells [18]. Moreover, the differential expression of immune checkpoint key molecules and HLA molecules between two clusters were analyzed by t test. The criteria for significance were p value less than 0.05.
Creating and verifying the risk prediction model
Initially, we performed univariate Cox regression analysis in the TCGA-PAAD dataset to identify prognostic correlation genes (p < 0.05) for establishing a risk model based on ICD genes. Following this, a Least Absolute Shrinkage and Selection Operator (LASSO) regression analysis was employed to develop and improve the risk model. Consequently, the formula was established as followed:
Exp (gene) showed gene expression levels, whereas coef (gene) denoted the regression coefficient. The ‘survminer’ and ‘survival’ packages were employed to demonstrate the receiver operating characteristic (ROC) curves and the areas under the time-dependent ROC curves (AUCs). The risk model validation was conducted using the testing set.
Principal component analysis (PCA)
PCA was conducted to decrease dimensionality and identify characteristics from the pair of groups. The ‘scatterplot3d’ function was used in this analysis [19].
Nomogram and calibration curves
A nomogram was created that included the risk score along with additional clinicopathological characteristics. The nomogram allowed for forecasting the survival rates of individuals with pancreatic cancer at 1, 3, and 5 years. The accuracy of the predicted outcomes was assessed and depicted through the calibration curve.
Quantitative real-time PCR
TRIzol (Takara Bio, Dalian, China) was used to extract total RNA from human samples and cells. Following this, the Prime Script RT Master Mix reagent (Takara Bio, Dalian, China) was used to convert the RNA into cDNA. The qRT-PCR primer sequences were provided in supplementary Table S3, with GAPDH selected as the internal reference gene.
Cell culture
Pancreatic cell lines, MIA PaCa-2, Patu8988, SW-1990, and PDC 0034 were bought from Cell Bank of the Chinese Academy of Sciences (Shanghai, China). The cells were maintained in Dulbecco’s modified Eagle’s medium (DMEM) with 10% fetal bovine serum (FBS) and 1% penicillin/streptomycin (P/S). Culturing occurred in a humidified incubator at 37 °C with 5% CO2.
Gene knockdown and overexpression assays
Cells were seeded in a six-well plate. The next day, siRNA and the transfection agent (Lipo2000, Thermo Fisher, USA) were included as per the guidelines provided by the manufacturer. Approximately 48 h post-transfection, cells were harvested for validation of knockdown efficacy via qRT-PCR. The efficient siRNA sequence targeting MYD88 was employed to generate short hairpin RNA (shRNA) using the GV112 vector. In the KPC1199 cells, Myd88 was downregulated through the CRISPR-Cas9 system. The sequences of the oligos for the small guide RNA (sgRNA) are provided below: sgMyd88: 5′—TGACGATTATCTACAGAGCA—3′, sgLacZ: 5′—CCCGAATCTCTATCGTGCGG—3′. The sgRNA oligos were introduced into the Lenti-CRISPR V2 plasmid. The NM_002468.5 sequence was used for the MYD88 overexpression assay.
Western blot
The Western blot analysis was conducted following the protocol described in a prior study [20]. The primary antibodies used were: anti-MYD88 (1:1000, Servicebio, GB111554), anti-β-actin (1:5000, Servicebio, GB15003). Goat anti-rabbit secondary antibody (1:5000, Abways, AB0101) was employed.
Cell counting Kit-8
Cell growth tests were performed with the CCK-8 reagent (CCK‐8, Yeasen, China). Cells were seeded at an appropriate density in 96-well plates, followed by mixing the CCK-8 reagent with the medium to achieve a final concentration of 10%. Following a 2-h period of incubation, the optical density at 450 nm was recorded for each well utilizing a Power Wave XS microplate reader manufactured by BIO‐TEK. The study was conducted multiple times on days 0 through 4 to assess growth potential, and the growth patterns were plotted using GraphPad Prism. The procedure was independently repeated three times.
Colony‐formation assays
In colony-formation experiments, 3000 cells/ml were seeded in six-well dishes. After a 2-week incubation, colonies were collected, treated with a 4% paraformaldehyde solution, and then dyed with 0.5% (w/v) crystal violet. Image J was utilized for quantification. This experiment was replicated twice.
Transwell chamber assays
A total of 40,000 cells were seeded in transwell chambers using serum-free medium, while the lower chambers were supplemented with 10% FBS. Following a 2-day incubation period, the top compartment was rinsed with PBS, and cells were immobilized with 4% paraformaldehyde for around half an hour. Afterward, the cells were dyed with 0.1% crystal violet and measured with ImageJ. The experiment was independently replicated three times.
Subcutaneous and orthotopic xenograft model
Subcutaneous xenograft model was established by injecting a total of 2 × 10⁶ shNC or shMYD88 PATU8988 cells in 100 μL of DMEM into the right back flank of Athymic male nu/nu mice. After 30 days, the mice were euthanized, and the tumors were excised. Tumor volumes were calculated using the formula: Volume = 0.5 * length * width. Male C57BL/6 mice were used for establishing orthotopic xenograft models. KPC1199 cells (1 × 10⁶) including one experimental group (sgMyd88) and one control group (sgLacZ), were suspended in 20 µl of PBS and then transplanted into the body of the pancreas in C57BL/6 mice. The mice were sacrificed three weeks after implantation. Tumor volumes were calculated using the formula: Volume = 0.5 * length * width.
Statistical analysis
The R (version 4.0.2) software was used to conduct all the bioinformatics analyses. GraphPad Prism 8.4.3 was used for analyzing numerical data. Statistical significances between groups were determined using the student’s t-test, or ANOVA, as applicable. The Kaplan–Meier survival curve was used to visualize survival, while the differences in survival time were compared by Log-rank test. Statistical significance was defined as P values < 0.05 for all results.
Results
Expression patterns and consensus unsupervised clustering of ICD genes in pancreatic cancer
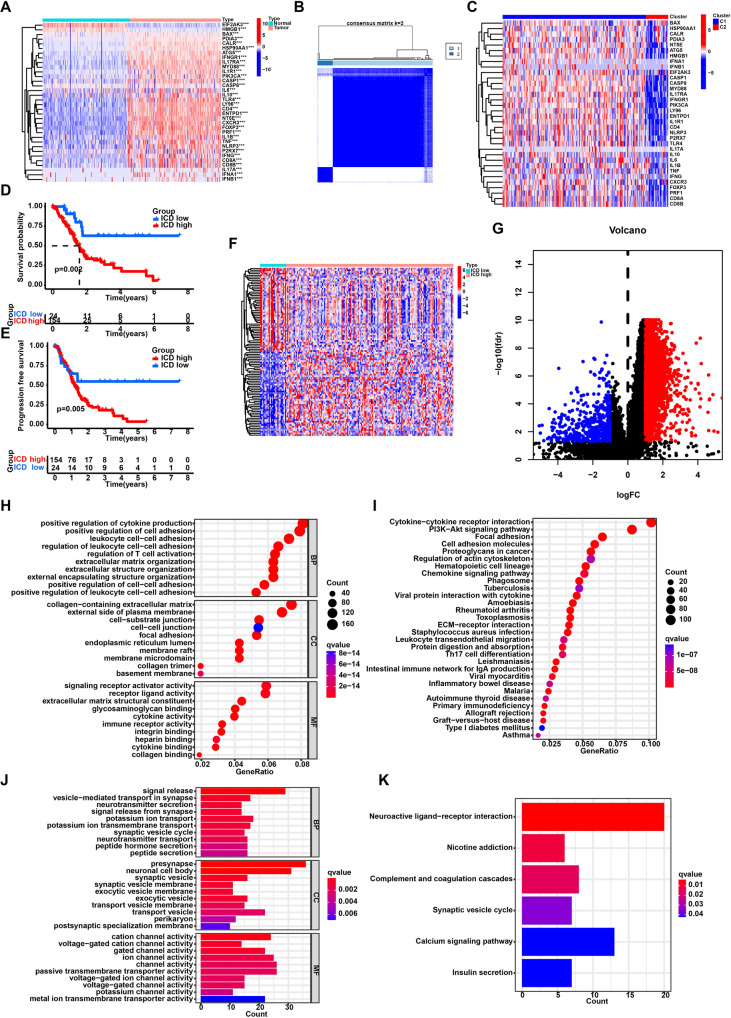
Initially, the research examined the expression pattern of ICD genes in PC samples compared to normal samples. The study revealed significant differences in gene expression between PC and normal samples. The majority of ICD genes showed higher expression levels in cancer samples than in normal samples (Fig. 1A). Subsequently, utilizing consensus unsupervised clustering on the TCGA cohort, two distinct clusters (C1 and C2) were identified (Fig. 1B). Comparative analysis of these clusters revealed that the majority of ICD genes exhibited significantly elevated expression levels in cluster C1 as opposed to cluster C2 (Fig. 1C). Therefore, cluster C1 was categorized as the ICD-high cluster, while cluster C2 was designated as ICD-low cluster. Notably, survival analysis revealed a favorable prognosis for the low cluster of ICD (Fig. 1D, E).
Fig. 1.
Identification of the ICD-related clusters in pancreatic cancer. A The expression patterns of ICD genes in pancreatic cancer samples and normal pancreas tissues. B The heatmap of consensus clustering solution (k = 2) in pancreatic cancer samples. C The expression of ICD genes in two clusters. D Kaplan–Meier curve of overall survival in two clusters. E Kaplan–Meier curve of progression free survival in two clusters. F The heatmap of differently expressed genes between two clusters. G The volcano plot of differently expressed genes between two clusters. H GO analysis of highly expressed genes in the ICD-high clusters. I KEGG enrichment analysis of highly expressed genes in the ICD-high clusters. J GO analysis of highly expressed genes in the ICD-low clusters. K KEGG enrichment analysis of highly expressed genes in the ICD-low clusters. ***P < 0.001; **P < 0.01; *P < 0.05
Functional enrichment analysis of DEGs in distinct clusters of ICD
Following this, we conducted differential analysis between the low and high clusters of ICD, finding 2627 genes with varying expression levels (Fig. 1F, G). Subsequently, enrichment analyses for GO, and KEGG were carried out on these genes. GO and KEGG analyses highlighted that DEGs upregulated in ICD-high cluster were enriched in regulation of T cell activation, leukocyte proliferation, extracellular matrix organization and Cytokine-cytokine receptor interaction (Fig. 1H, I). The DEGs upregulated in ICD-low cluster were enriched in signal release, neurotransmitter secretion, and neuroactive ligand-receptor interaction (Fig. 1J, K).
Correlation of different clusters and TMB
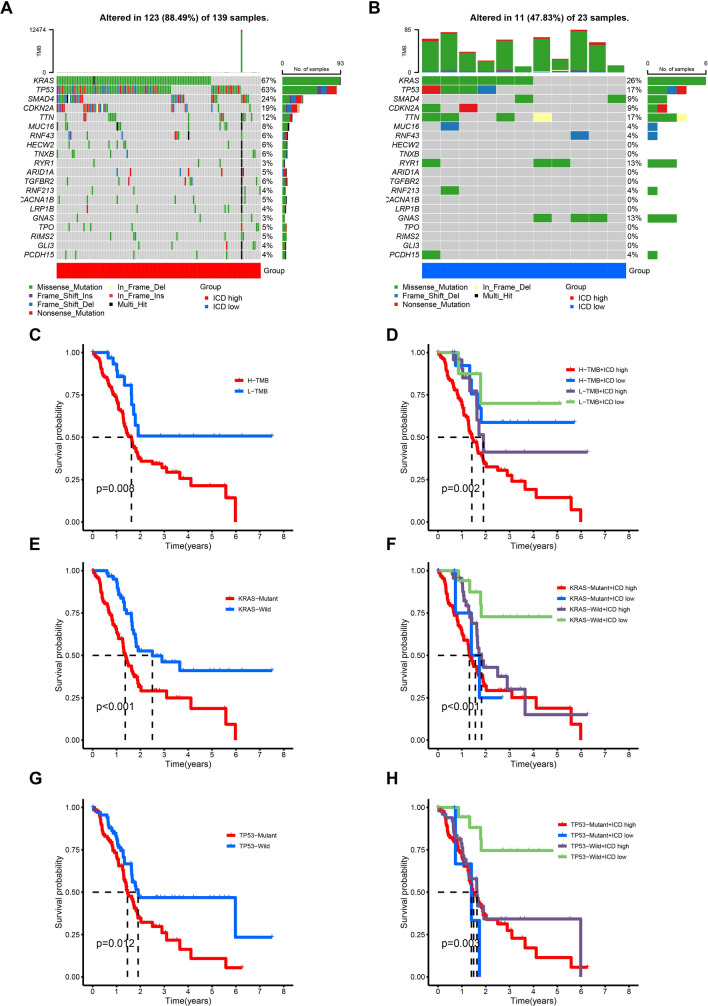
Numerous studies have consistently demonstrated a strong correlation between TMB and patient prognosis [21–23]. To examine potential disparities in TMB between two clusters, we collected and organized the mutation data. The analysis revealed KRAS, TP53, SMAD4, and CDKN2A as the most frequently mutated genes in both clusters (Fig. 2A, B). Survival analysis clearly showed that patients with higher TMB had a much worse prognosis than those with lower TMB (Fig. 2C). Subsequent combined survival analysis considering TMB and clusters disclosed that patients with higher TMB and higher expression levels of ICD genes experienced the most unfavorable prognosis, whereas patients with lower TMB and lower expression levels of ICD genes showed a more favorable prognosis (Fig. 2D). Given that KRAS and TP53 were the two genes exhibiting the highest mutation frequencies in PC, we investigated the influences of mutations in these genes on patient prognosis. Our initial findings revealed a substantial decrease in the prognosis of PC patients carrying KRAS mutations, particularly those with a combination of KRAS mutations and higher expression levels of ICD genes who displayed the most unfavorable prognosis (Fig. 2E, F). Similarly, our analysis indicated an association between TP53 mutations and prognosis, with patients possessing TP53 mutations and higher expression levels of ICD genes experiencing a less favorable prognosis (Fig. 2G, H).
Fig. 2.
Tumor mutational burden (TMB) analysis in the two clusters. A, B Visual waterfall plots of mutated genes in two clusters. C Kaplan–Meier curve of H-TMB and L-TMB samples. D Kaplan–Meier curve stratified by clusters and TMB status. E Kaplan–Meier curve of KRAS-Mutant and KRAS-Wild samples. F Kaplan–Meier curve stratified by clusters and KRAS mutation status. G Kaplan–Meier curve of TP53-Mutant and TP53-Wild samples. H Kaplan–Meier curve stratified by clusters and TP53 mutation status
Analysis of the TIME in clusters with low and high levels of ICD
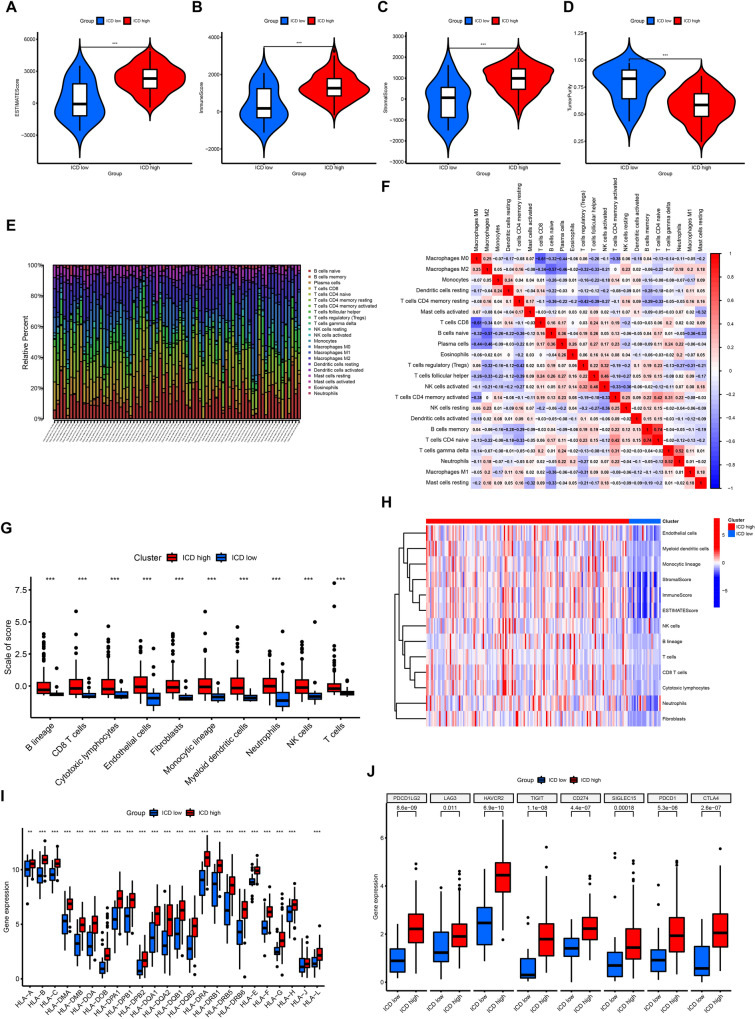
Increasing evidence suggests that tumor-infiltrating immune cells play a crucial role in the tumor microenvironment [24]. Thus, we investigated the variances in the TIME between the two clusters. At first, we examined the ESTIMATE score, immune score, stromal score, and tumor purity in both the ICD-high and ICD-low clusters. The results showed increased stromal, immune, and ESTIMATE scores in the ICD-high cluster, along with decreased tumor purity (Fig. 3A–D). Additionally, utilizing ssGSEA, we examined potential associations between distinct clusters and immune cell infiltration (Fig. 3E). The results showed the correlation between various types of immune cells in PC (Fig. 3F). Notable variances in the presence of different types of immune cells, including B cells, CD8 T lymphocytes, and cytotoxic lymphocytes, were observed among these clusters. Specifically, these immune cells were more abundant in the ICD-high cluster, indicating an enhanced immune response in the TIME of this cluster (Fig. 3G, H). Additionally, we investigated the differences in expression of HLA molecules within these clusters and found increased levels in the ICD-high cluster, indicating potential anti-cancer immune reactions (Fig. 3I). Finally, an analysis of the differences in the main molecules of immune checkpoints among the clusters showed increased levels in the ICD-high cluster, providing possible clues for predicting the reaction to immune checkpoint inhibitors (Fig. 3J).
Fig. 3.
The differences of tumor immune microenvironment between two clusters. A–D Comparison of ESTIMATE score, immune score, stromal score, and tumor purity between the two clusters. E The distributions of infiltrating immune cells between the two clusters calculated by CIBERSORT algorithm. F The correlations of infiltrating immune cells in pancreatic cancer samples calculated by CIBERSORT algorithm. G The scores of infiltrating immune cells between the two clusters calculated by MCPcounter package. H The distinction of infiltrating immune cells between the two clusters calculated by MCPcounter package. I Comparison of the expression of HLA molecules between the two clusters. J Comparison of the expression of immune checkpoint key molecules between the two clusters. ***P < 0.001; **P < 0.01; *P < 0.05
Construction of the prediction model for ICD genes in PC
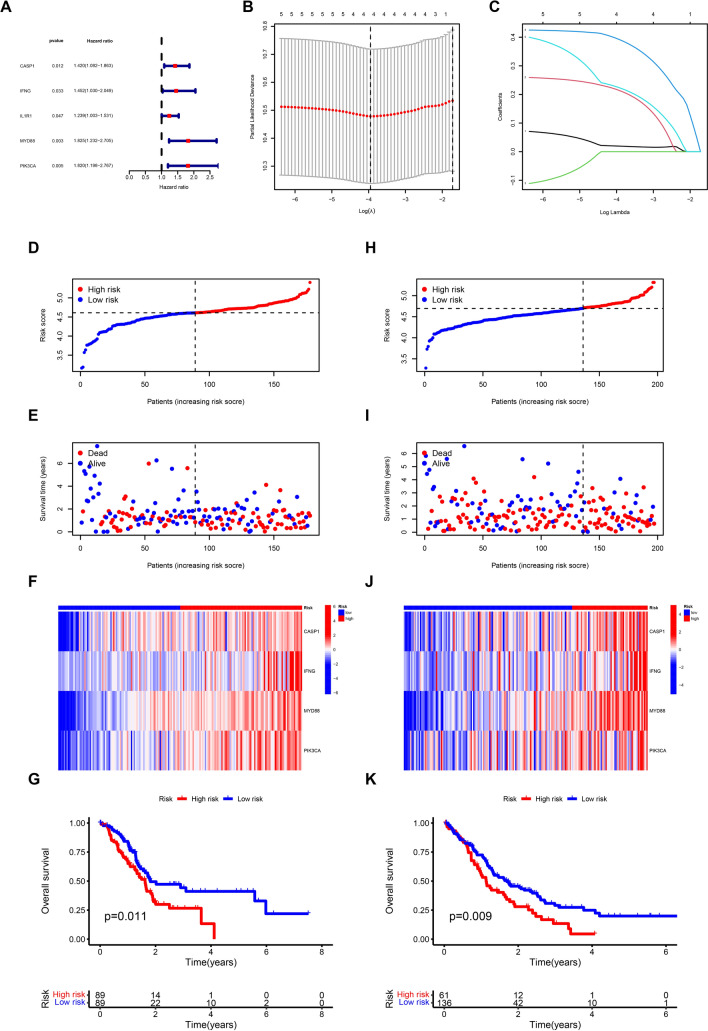
We conducted a univariate COX regression analysis on the TCGA dataset to create a predictive model for genes associated with ICD. This analysis revealed that five genes, namely CASP1, IFNG, IL1R1, MYD88, and PIK3CA, were significantly correlated with patient prognosis (Fig. 4A). Subsequently, following univariate Cox regression analysis, we performed LASSO regression analysis on these five genes to construct a prognostic model (Supplementary Table S1). The results revealed that the prognostic model included four genes (CASP1, IFNG, MYD88, and PIK3CA) (Fig. 4B, C). Individual risk scores were calculated for each sample using a designated formula. Subsequently, individuals were categorized into high-risk and low-risk groups based on the median risk score. As the risk score escalated, the high-risk group demonstrated a decrease in survival rates and an increase in mortality compared to the low-risk group (Fig. 4D, E). The heatmap indicated that the expression of these four genes was increased in patients classified as high-risk, implying a notable role of these genes in the advancement of PC (Fig. 4F). Survival analysis exhibited a strong association between the risk score and patient outcomes, indicating that individuals in the high-risk category had significantly poorer outcomes compared to those in the low-risk category (Fig. 4G). To validate the feasibility of the model, the GEO dataset was employed for external validation and to assess its accuracy. The results demonstrated that the validation set showed parallel performance to the training set. With the risk score increasing, the survival rates of patients decreased (Fig. 4H, I). Analysis of gene expression showed increased levels of these four genes in patients at high risk (Fig. 4J). Additionally, patients with a higher risk level had worse outcomes in comparison to patients with a lower risk level (Fig. 4K). Collectively, these findings supported the robust predictive capacity of the model and its potential for clinical application.
Fig. 4.
Construction of the risk model based on ICD genes in pancreatic cancer. A The results of the Univariate Cox regression analysis conducted in TCGA-PAAD dataset. B Cross-validation plot for the results of LASSO regression analysis. C Plots for LASSO expression coefficients of the ICD genes. D The risk score of each sample in the TCGA cohort. E The risk score and survival status of each sample in the TCGA cohort. F The expression levels of four genes in TCGA samples. G Kaplan–Meier curve of overall survival between two groups in TCGA cohort. H The risk score of each sample in the GEO cohort. I The risk score and survival status of each sample in the GEO cohort. J The expression levels of four genes in GEO samples. K Kaplan–Meier curve of overall survival between two groups in GEO cohort
Assessment of predictive capacity: risk model versus other clinical characteristics
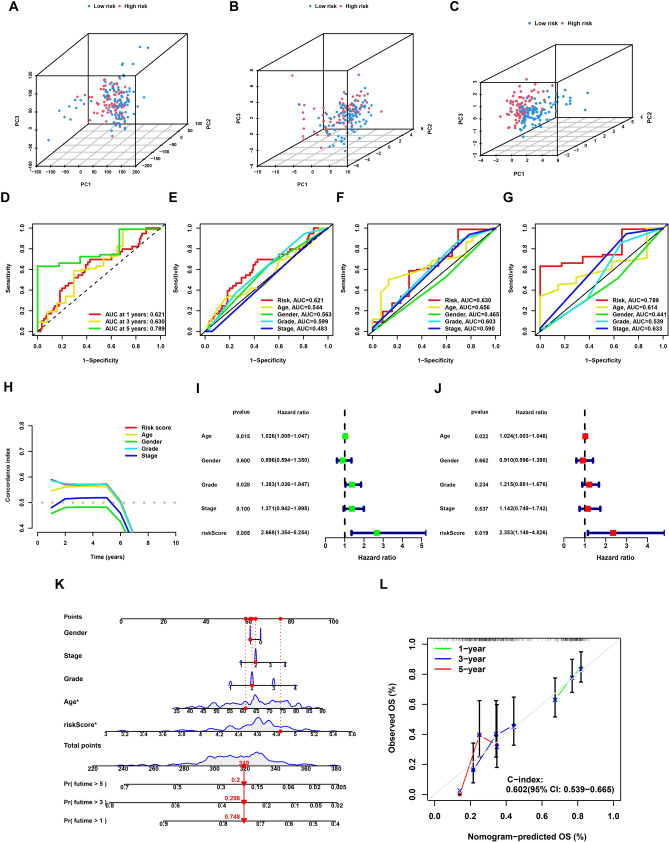
First of all, PCA was employed to assess the risk signature’s grouping capability. By combining whole-genome expression profiles with 34 ICD genes and a risk model, the analysis successfully divided samples into two distinct risk groups, demonstrating the risk model’s ability to effectively stratify samples (Fig. 5A–C). We next compared the prognostic prediction capabilities of the risk model with other clinicopathological characteristics through ROC curve analysis. The analysis validated the risk score as the most effective predictor among the variables studied (Fig. 5D–G). Moreover, these results were corroborated through the use of the c-index (Fig. 5H). Cox regression was used to evaluate the model’s individual influence on the outcome of PC patients. The results confirmed the risk model as a significant and independent prognostic factor, exerting a substantial influence on PC patient outcomes (Fig. 5I, J). The development of a nomogram ultimately offered a tangible and numerical approach for forecasting outcomes in individuals with PC (Fig. 5K). Calibration curves were used to assess the dependability and consistency of the nomogram, revealing a strong correlation between the projected and observed survival rates (Fig. 5L). These findings collectively indicated that the risk model developed in this study exhibited stable and reliable prognostic prediction capabilities for patients with PC.
Fig. 5.
Validation of the stability of the risk model. A Principal component analysis of all genes. B Principal component analysis of ICD genes. C Principal component analysis of risk score. D The ROC curves of the risk model in the TCGA cohort. E–G The ROC curves of 1-, 3-, and 5-year overall survival for the risk score and other clinical characteristics. H The c-index for the risk score and other clinical characteristics. I The results of Univariate Cox regression analysis in TCGA cohort based on risk score and other clinical characteristics. J The results of Multivariate Cox regression analysis in TCGA cohort based on risk score and other clinical characteristics. K The nomogram established by risk score and other clinical characteristics in the TCGA cohort. L 1-, 3-, 5-year nomogram calibration curves. ***P < 0.001; **P < 0.01; *P < 0.05
Assessment of the validity and predictive significance of genes within the model
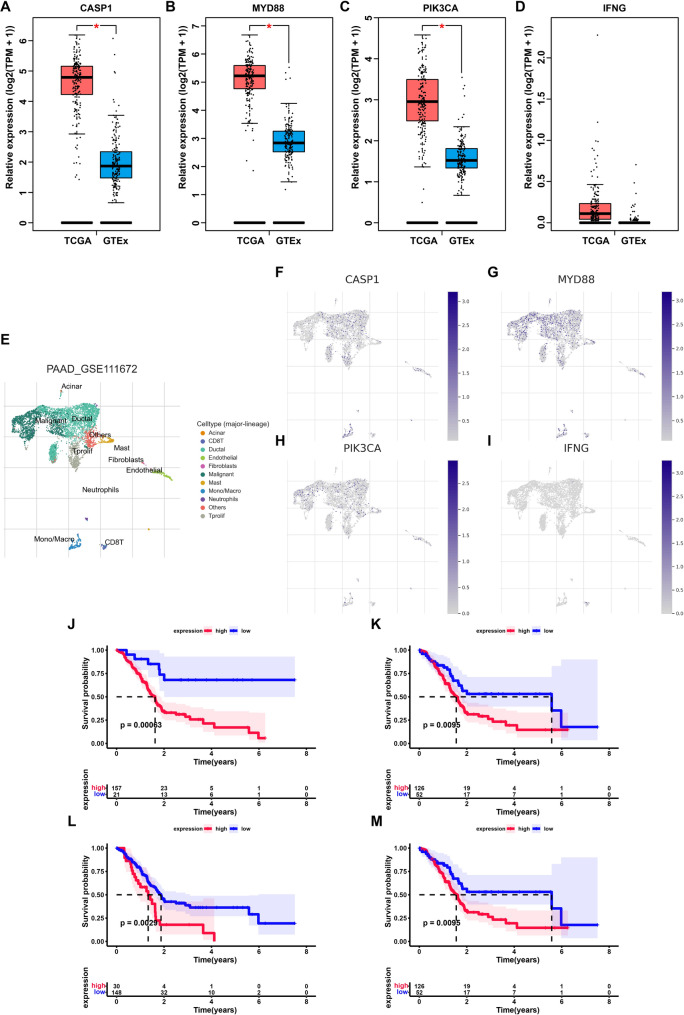
Based on the preceding results, a prognostic model for PC was constructed utilizing ICD genes. The model showed robust predictive ability and acted as an independent prognostic indicator for PC patients, including four distinct genes. In order to investigate the functions of these four genes in PC more comprehensively, their expression profiles were initially downloaded from the GEPIA (http://gepia.cancer-pku.cn/). The findings revealed elevated expression levels of CASP1, MYD88, and PIK3CA in PC tissues (Fig. 6A–D). Subsequently, the levels of expression of these genes in cancer cells were examined utilizing single-cell datasets. The findings indicated that in addition to their expression in immune cells, these genes demonstrated elevated expression in cancer cells (Fig. 6E–I). Furthermore, leveraging the TCGA dataset, we explored the influence of these four genes’ expression on the prognoses of patients with PC. The findings revealed that elevated expression of these four genes collectively exerted an adverse effect on patient prognosis (Fig. 6J–M). The discovery of these genes suggested that they were crucial in the advancement of PC.
Fig. 6.
Validation of the expression and prognostic value of genes in the model. A–D Comparison of expression levels of four genes in tumor and normal samples. E The cell types revealed by the scRNA-seq dataset GSE111672. F–I The expression levels of four genes in different cell types. J–M Kaplan–Meier curves of four genes in the model. ***P < 0.001; **P < 0.01; *P < 0.05
Validation of the risk model in our own PC samples
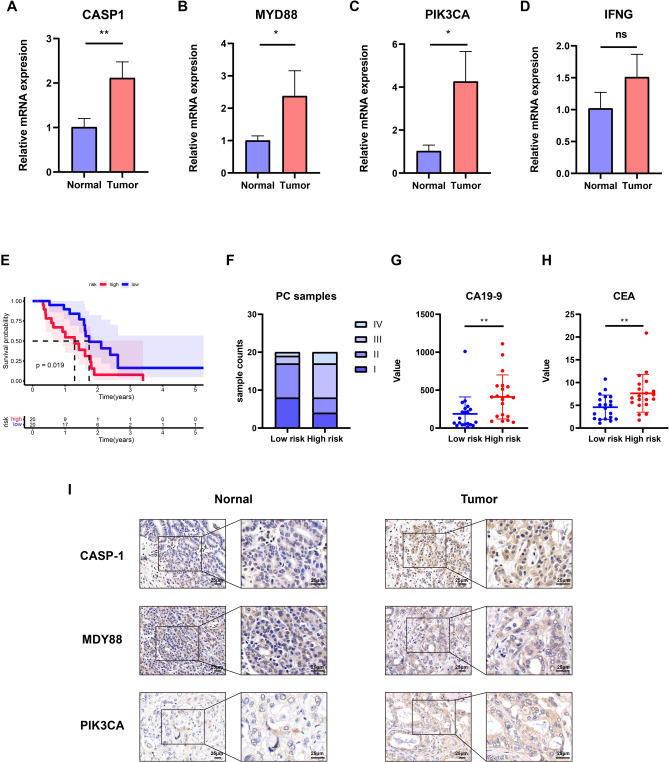
To enhance the model’s accuracy, we validated it using our PC samples. Initially, we assessed the expression levels of the four genes in PC and adjacent normal tissues through qRT-PCR. Our findings revealed significant upregulation of CASP1, MYD88, and PIK3CA in PC compared to the adjacent normal samples, aligning with earlier results and highlighting the pivotal roles of these genes in PC progression (Fig. 7A–D). Subsequently, the expression levels of these four genes were integrated using the established risk score formula, enabling the categorization of patients into high-risk and low-risk groups based on their respective risk scores. Survival analysis results indicated that individuals in the high-risk group had significantly worse outcomes than those in the low-risk group, consistent with previous research findings (Fig. 7E). Furthermore, the two groups were compared in terms of patient stage, as well as CA19-9 and CEA levels. The examination showed that there was a greater percentage of patients in advanced stages III and IV within the group at high risk, as well as increased levels of CA19-9 and CEA (Fig. 7F–H). To confirm the expression levels of these genes in PC, we conducted IHC staining on both tumor tissues and adjacent normal tissues from PC patients, demonstrating elevated expression of these genes within the tumors (Fig. 7I). In summary, the risk model exhibited remarkable accuracy and robustness, demonstrating its efficacy not only within the database but also within our patient cohort.
Fig. 7.
validation of the risk model in our own samples. A–D Comparison of expression levels of four genes between normal and tumor samples. E Kaplan–Meier curve of overall survival between two groups in our own samples. F The differences of tumor stage between two groups in our own samples. G, H The differences of tumor markers (CA19-9 and CEA) between two groups in our own samples. I Representative CASP-1, MYD88, and PIK3CA IHC staining images in normal and tumor samples. Scale bar, 25 μm. ***P < 0.001; **P < 0.01; *P < 0.05
MYD88 promoted PC cells proliferation and migration in vitro
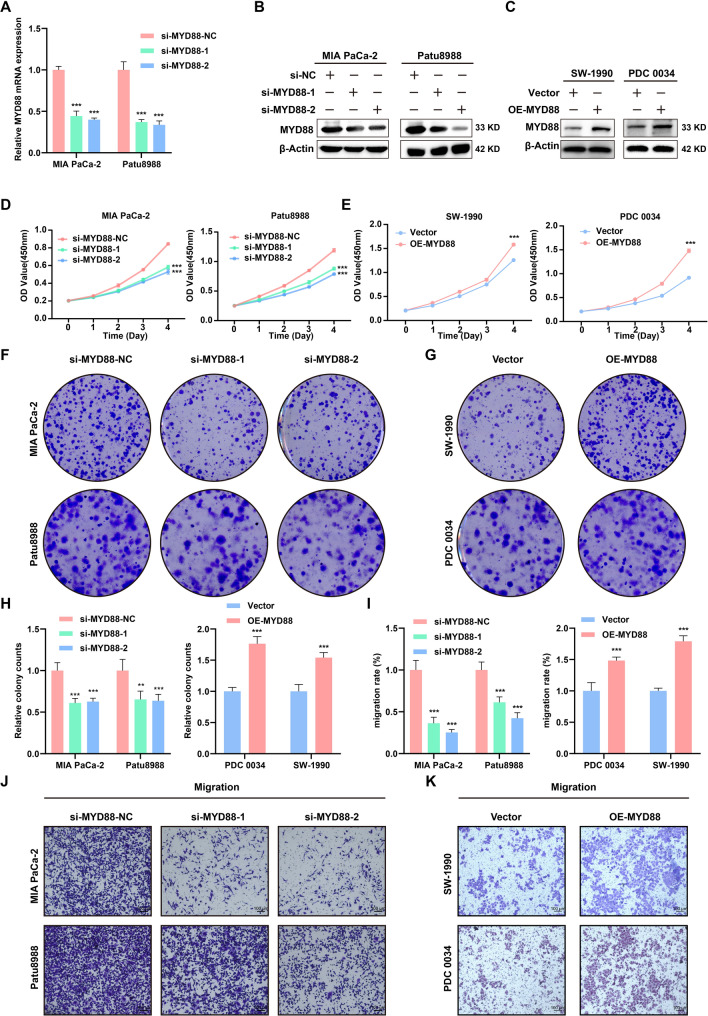
Studies have demonstrated the significant involvement of MYD88 in tumorigenesis. However, its specific role in PC remains uncertain. Therefore, we investigated its function in the forthcoming experiments. We evaluated the impact of MYD88 on PC progression by examining the proliferation and migration of PC cells. Subsequent to the transfection of siRNA targeting MYD88, the efficiency of knockdown was validated at the mRNA and protein levels (Fig. 8A, B). In addition, two cell lines were selected for exogenous overexpression (Fig. 8C). The CCK-8 assay indicated that reducing MYD88 expression effectively suppressed in vitro cell proliferation (Fig. 8D). On the contrary, the overexpression of MYD88 led to the enhancement of their proliferation (Fig. 8E). Similarly, the colony-formation assay produced consistent results (Fig. 8F–H). Moreover, we explored the effect of MYD88 on the migration rate of PC cells. The results showed a notable decrease in the migratory capacity of PC cells following MYD88 knockdown, as well as a significant increase in their migratory ability following MYD88 overexpression (Fig. 8I–K). The above data showed that MYD88 had a significant impact on the growth and migration of PC cells.
Fig. 8.
The effects of MYD88 on PC cells in vitro. A The mRNA knockdown efficiency of MYD88 in MIA PaCa-2 and Patu8988. B The knockdown efficiency of MYD88 in MIA PaCa-2 and Patu8988 validated by Western blot assay. C The overexpression efficiency of MYD88 in SW-1990 and PDC 0034 validated by Western blot assay. D The effect of MYD88 knockdown on the proliferation of PC cells demonstrated through the CCK-8 assay. E The effect of MYD88 overexpression on the proliferation of PC cells demonstrated through the CCK-8 assay. F–H The effects of MYD88 knockdown or overexpression on the proliferation of PC cells demonstrated through the colony-formation assay. I–K The effects of MYD88 knockdown or expression on the migration of PC cells demonstrated through the transwell assay. ***P < 0.001; **P < 0.01; *P < 0.05
MYD88 genetic inhibition suppressed the growth PC cells in vivo
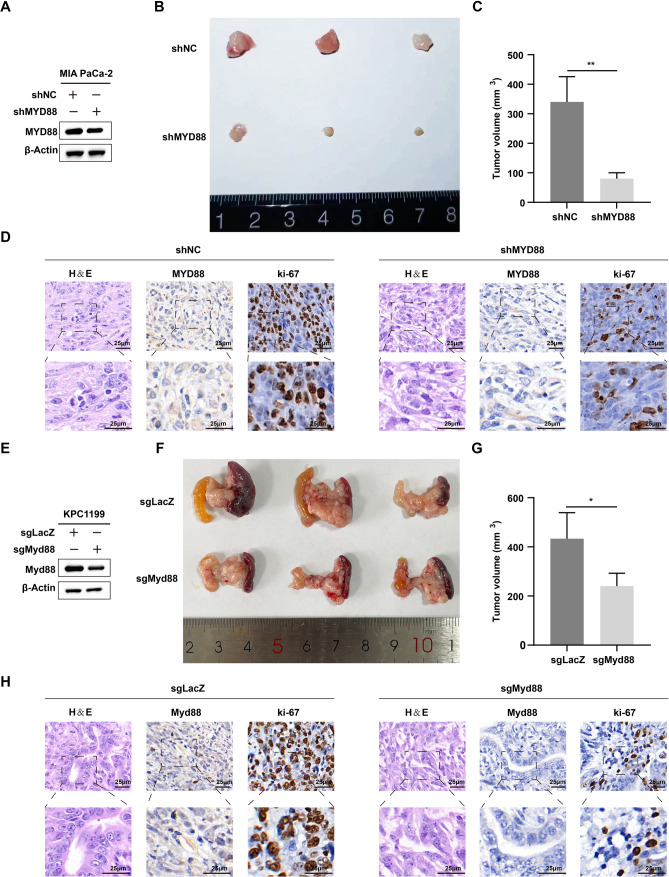
To verify the influence of MYD88 genetic inhibition on the proliferation of PC cells in vivo, we established the subcutaneous xenograft model. The result showed that mice injected with MYD88 knockdown cells displayed a reduced tumor burden compared to the control group (Fig. 9A). In terms of tumor volume, the mice injected with NC cells exhibited larger tumors compared to the mice injected with shMYD88 cells (Fig. 9B, C). Additionally, immunohistochemical results also showed that the ki-67 positivity rate in the shMYD88 group was significantly lower than that in the NC group (Fig. 9D). Subsequently, we established the orthotopic xenograft model to corroborate the findings. Consistent with the subcutaneous tumor results, the tumor burden in the mice injected with sgMyd88 cells was significantly smaller than that in the mice injected with sgLacZ cells (Fig. 9E-G). The immunohistochemical results indicated that the ki-67and Myd88 positivity rates in the sgMyd88 group was significantly lower than that in the sgLacZ group (Fig. 9H). All these results indicated that MYD88 knockout significantly inhibits the proliferation of PC cells in vivo.
Fig. 9.
PC cell proliferation is suppressed by genetic inhibition of MYD88 in vivo. A The protein level of MYD88 in shNC and shMYD88 Patu8988 cells validated by Western blot assay. B, C Growth of subcutaneous xenografts from shMYD88 cells. D Representative MYD88, ki-67 IHC and H&E staining images showed the role of MYD88 in vivo. E The protein level of Myd88 in sgLacZ and sgMyd88 KPC1199 cells validated by Western blot assay. F, G Growth of orthotopic xenografts from sgMyd88 cells. H Representative Myd88, ki-67 IHC and H&E staining images showed the role of MYD88 in vivo. ***P < 0.001; **P < 0.01; *P < 0.05
Discussion
Pancreatic cancer, a highly aggressive tumor of the gastrointestinal tract, typically presents insidiously and carries a poor prognosis for patients. Treatment modalities for PC primarily include surgical intervention, chemotherapy, radiotherapy, and targeted therapy. Surgical intervention is a common therapeutic approach for PC, allowing for the complete excision of tumors in early-stage cases. Unfortunately, most patients are ineligible for surgical intervention by the time of diagnosis due to missing the window for surgical treatment [25].
Immunotherapy represents a novel approach in cancer treatment, leveraging the innate immune system to target cancer cells. PC presents a significant challenge because it is often detected at a late stage and shows limited responsiveness to traditional treatments like chemotherapy and radiation therapy. Consequently, immunotherapy appears as a promising strategy to enhance the therapeutic outcomes of PC. However, immunotherapy still has significant limitations in the treatment of PC. Initially, the microenvironment of PC may harbor numerous immune-suppressive cells and immune evasion mechanisms, thereby impeding the efficacy of immunotherapy [26]. Furthermore, PC cells often present insufficient antigen expression levels, impeding the capacity of immune cells to recognize and eradicate tumor cells [27]. Hence, immunotherapy for PC continues to encounter challenges, necessitating further exploration of enhanced treatment strategies to optimize its effectiveness.
ICD refers to the process of cell death that occurs under specific conditions, playing an important role in activating the immune system and regulating immune responses [28, 29]. Unlike non-immunogenic cell death, the cell fragments or organelles generated by ICD can serve as antigens presented to immune cells. This process, in turn, facilitates the activation of immune cells and immune responses [30, 31]. ICD can be triggered through diverse mechanisms, encompassing apoptosis, necrosis, necroptosis, and various other pathways leading to cellular demise [32, 33]. This mode of cell death can arise from a range of external and internal factors like chemotherapy agents, radiation therapy, viral infections, and other agents [34–36]. The cellular constituents and signaling molecules liberated during ICD can be engulfed and metabolized by dendritic cells or other antigen-presenting cells, ultimately kickstarting an immune response [37]. PC often frequently evades immune surveillance through multiple mechanisms, one of which includes inhibiting the initiation of ICD. ICD can elicit the immune system’s response against tumors; however, in PC, tumor cells may dampen immune reactions by altering ICD pathways and impeding relevant signaling cascades. Consequently, researchers are actively investigating methods to restore or enhance ICD in PC cells to enhance the efficacy of immunotherapy [38, 39]. They aim to develop novel treatment approaches to improve the survival outcomes and quality of life for patients with PC.
Recent research has examined the role of ICD-related signatures in the progression of PDAC [40–42]. However, these studies primarily focus on the prognostic value of these signatures based on publicly available datasets. In our study, we established a prognostic model using the TCGA dataset and validated it with the GEO database; additionally, we conducted preliminary validation of the model’s reliability in our own cohort. We also investigated the expression levels of the genes in the signature in PDAC compared to adjacent normal tissue using IHC. Furthermore, we assessed the effects of MYD88 on pancreatic cancer progression both in vitro and in vivo for the first time, which has not been previously documented in the literature.
This study first examined the expression patterns of ICD genes in PC and observed that the majority of genes demonstrated significantly heightened expression levels in this disease. Cluster analysis revealed that patients with elevated expression of these genes exhibited inferior overall survival (OS) and disease-free survival (DFS), highlighting the significant involvement of ICD in the advancement of PC. Moreover, by conducting functional enrichment and immune infiltration analyses on two clusters of samples, we uncovered substantial disparities. The findings indicated that the DEGs in these sample clusters primarily show enrichment in immune responses and the activation of immune cells. Analysis of immune infiltration also uncovered a greater presence of immune cells in the ICD-high cluster. Moreover, numerous immune checkpoint regulators that modulate immune responses exhibited higher expression levels within this cluster. The results collectively suggested notable variances in the TIME between the two patient clusters, offering insights into the responsiveness of immunotherapy in PC.
Subsequent to these findings, we constructed a prognostic model using ICD genes from the TCGA dataset and evaluated its efficacy in an external validation cohort. This model, consisting of the genes CASP1, MYD88, IFNG, and PIK3CA, revealed that individuals with higher risk scores had significantly worse prognoses compared to those with lower risk scores. As per COX regression analysis, this prognostic model served as an independent risk factor in PC. The ROC curves indicated that this model demonstrated superior predictive capability for the prognosis of PC patients when compared to other clinical characteristics. Moreover, we validated the accuracy of this model in our own samples, yielding consistent results that revealed patients at high risk had a poorer prognosis. These findings collectively affirmed that the prognostic model based on ICD genes possessed accurate predictive ability for prognosis. The model demonstrated clinical validity and assisted clinicians in making precise clinical decisions.
CASP1 (Caspase-1) is an important protease closely associated with inflammation and cellular apoptosis. Abnormal expression of CASP1 in certain tumors is linked to key processes such as tumor development. Several studies propose a close association between CASP1 activity and the progression and metastasis of pancreatic cancer [43]. Moreover, specific medications could potentially influence the therapeutic effectiveness in pancreatic cancer treatment through the regulation of CASP1 activity [44]. MYD88 is a vital signaling molecule that plays a pivotal role in immune responses and regulating inflammation [45, 46]. In tumors, research on MYD88 is also receiving significant attention. The function of MYD88 in tumors may involve aspects such as tumor growth, progression, and immune evasion [47]. Several studies propose a close association between aberrant MYD88 expression and the onset and progression of diverse tumors, encompassing lymphomas and solid tumors [48]. Furthermore, MYD88 is also considered a potential therapeutic target for some tumors, and drug development targeting MYD88 is currently underway [49]. The PIK3CA gene encodes the PI3Kα protein kinase subunit, a member of the phospholipase family, playing a crucial role in cell proliferation, growth, and survival pathways [50, 51]. PIK3CA mutations are detected in multiple malignancies, such as pancreatic cancer, where the abnormal activation of PIK3CA is intricately connected to tumor cell proliferation, invasion, and metastasis. This underscores the significant potential importance of therapeutic approaches aimed at targeting PIK3CA in treating this disease [52, 53].
In our study, we identified increased levels of CASP1, MYD88, and PIK3CA in pancreatic cancer, observed in both public databases and our clinical specimens. Moreover, individuals with elevated expression of these genes experienced significantly worse outcomes than those with lower levels, highlighting the substantial influence of these genes on PC progression. Diminishing MYD88 expression demonstrated a remarkable effect on the proliferation and migration of PC cells in vitro. Nevertheless, further investigations are warranted to elucidate the roles of these genes in PC and their impact on disease advancement.
Despite these findings, our results have certain limitations. First, the small sample size may introduce bias, emphasizing the need for validation with a larger cohort in future studies. Therefore, we plan to include additional PDAC samples to further validate the reliability of our model. Second, although we explored the role of MYD88 in PDAC, the functions of the other genes in the model remain unclear. Moving forward, we aim to investigate the effects of these remaining genes on PDAC through both in vitro and in vivo experiments. While we found that these genes are upregulated in PDAC via IHC, additional samples are required for validation. Furthermore, although our study identified MYD88 as a promoter of PDAC progression, the underlying mechanisms remain elusive. We will continue to explore these potential mechanisms using both in vitro and in vivo approaches.
Supplementary Information
Below is the link to the electronic supplementary material.
Acknowledgements
The authors declare no acknowledgment.
Authors contributions
Rong Hua, and Da-Peng Xu conceived the project; Rong Hua, and Da-Peng Xu designed experiments and wrote the manuscript; Cheng-Yu Hu, Yi-Fan Yin and Yu Xu performed bioinformatics analyses and wrote the manuscript; Jian-Yu Yang, and Yan-Nan Xu performed cell experiments. All authors read and approved the final manuscript.
Funding
This work was supported by the National Natural Science Foundation of China (Grant Number 82372622 to Rong Hua).
Data availability
The data utilized in this study are accessible from the TCGA database (https://portal.gdc.cancer.gov/) and the GEO database (https://www.ncbi.nlm.nih.gov/geo/).
Declarations
Conflict of interest
The authors declare no competing interests or personal relationships that could have influenced the reported work in this paper.
Ethical approval
The study was approved under the number RA-2019-116 assigned by the Research Ethics Committee of Ren Ji Hospital, School of Medicine, Shanghai Jiao Tong University.
Informed consent
Informed consent was obtained from all subjects involved in the study.
Footnotes
Publisher's Note
Springer Nature remains neutral with regard to jurisdictional claims in published maps and institutional affiliations.
Cheng-Yu Hu, Yi-Fan Yin and Yu Xu have contributed equally to this work.
Contributor Information
Da-Peng Xu, Email: xdp.1982@163.com.
Rong Hua, Email: 13611657722@sina.cn.
References
- 1.Mizrahi JD, et al. Pancreatic cancer. Lancet. 2020;395(10242):2008–20. [DOI] [PubMed] [Google Scholar]
- 2.Moore A, Donahue T. Pancreatic cancer. Jama. 2019;322(14):1426. [DOI] [PMC free article] [PubMed] [Google Scholar]
- 3.Neoptolemos JP, et al. Therapeutic developments in pancreatic cancer: current and future perspectives. Nat Rev Gastroenterol Hepatol. 2018;15(6):333–48. [DOI] [PubMed] [Google Scholar]
- 4.Rahib L, et al. Projecting cancer incidence and deaths to 2030: the unexpected burden of thyroid, liver, and pancreas cancers in the United States. Cancer Res. 2014;74(11):2913–21. [DOI] [PubMed] [Google Scholar]
- 5.Schnipper J, et al. Ion channel signature in healthy pancreas and pancreatic ductal adenocarcinoma. Front Pharmacol. 2020;11:568993. [DOI] [PMC free article] [PubMed] [Google Scholar]
- 6.Jiang J, et al. Immunotherapy in pancreatic cancer: New hope or mission impossible? Cancer Lett. 2019;445:57–64. [DOI] [PubMed] [Google Scholar]
- 7.Gössling GCL, et al. Combination immunotherapy for pancreatic cancer: challenges and future considerations. Expert Rev Clin Immunol. 2022;18(11):1173–86. [DOI] [PubMed] [Google Scholar]
- 8.Henriksen A, et al. Checkpoint inhibitors in pancreatic cancer. Cancer Treat Rev. 2019;78:17–30. [DOI] [PubMed] [Google Scholar]
- 9.Matsui H, et al. Combination treatment of advanced pancreatic cancer using novel vaccine and traditional therapies. Expert Rev Anticancer Ther. 2018;18(12):1205–17. [DOI] [PubMed] [Google Scholar]
- 10.Bassani-Sternberg M, et al. A phase Ib study of the combination of personalized autologous dendritic cell vaccine, aspirin, and standard of care adjuvant chemotherapy followed by Nivolumab for resected pancreatic adenocarcinoma—a proof of antigen discovery feasibility in three patients. Front Immunol. 2019;10:1832. [DOI] [PMC free article] [PubMed] [Google Scholar]
- 11.Sterner RC, Sterner RM. CAR-T cell therapy: current limitations and potential strategies. Blood Cancer J. 2021;11(4):69. [DOI] [PMC free article] [PubMed] [Google Scholar]
- 12.Qi C, et al. CT041 CAR T cell therapy for Claudin18.2-positive metastatic pancreatic cancer. J Hematol Oncol. 2023;16(1):102. [DOI] [PMC free article] [PubMed] [Google Scholar]
- 13.Bear AS, Vonderheide RH, O’Hara MH. Challenges and opportunities for pancreatic cancer immunotherapy. Cancer Cell. 2020;38(6):788–802. [DOI] [PMC free article] [PubMed] [Google Scholar]
- 14.Krysko DV, et al. Immunogenic cell death and DAMPs in cancer therapy. Nat Rev Cancer. 2012;12(12):860–75. [DOI] [PubMed] [Google Scholar]
- 15.Ahmed A, Tait SWG. Targeting immunogenic cell death in cancer. Mol Oncol. 2020;14(12):2994–3006. [DOI] [PMC free article] [PubMed] [Google Scholar]
- 16.Liu Z, et al. An immunogenic cell death-related signature predicts prognosis and immunotherapy response in stomach adenocarcinoma. Apoptosis. 2023;28(11–12):1564–83. [DOI] [PubMed] [Google Scholar]
- 17.Yoshihara K, et al. Inferring tumour purity and stromal and immune cell admixture from expression data. Nat Commun. 2013;4:2612. [DOI] [PMC free article] [PubMed] [Google Scholar]
- 18.Newman AM, et al. Robust enumeration of cell subsets from tissue expression profiles. Nat Methods. 2015;12(5):453–7. [DOI] [PMC free article] [PubMed] [Google Scholar]
- 19.Kim S, et al. Meta-analytic principal component analysis in integrative omics application. Bioinformatics. 2018;34(8):1321–8. [DOI] [PMC free article] [PubMed] [Google Scholar]
- 20.Jiang SH, et al. Increased serotonin signaling contributes to the warburg effect in pancreatic tumor cells under metabolic stress and promotes growth of pancreatic tumors in mice. Gastroenterology. 2017;153(1):277-291.e19. [DOI] [PubMed] [Google Scholar]
- 21.Valero C, et al. The association between tumor mutational burden and prognosis is dependent on treatment context. Nat Genet. 2021;53(1):11–5. [DOI] [PMC free article] [PubMed] [Google Scholar]
- 22.Cai Y, et al. Correlations between tumor mutation burden and immune infiltrates and their prognostic value in pancreatic cancer by bioinformatic analysis. Life Sci. 2021;277:119505. [DOI] [PubMed] [Google Scholar]
- 23.Yao HF, et al. Analysis of cuproptosis-related lncRNA signature for predicting prognosis and tumor immune microenvironment in pancreatic cancer. Apoptosis. 2023;28(7–8):1090–112. [DOI] [PubMed] [Google Scholar]
- 24.Chen ZG, et al. A quantitative score of immune cell infiltration predicts the prognosis in pancreatic ductal adenocarcinoma. Int Immunopharmacol. 2021;98:107890. [DOI] [PubMed] [Google Scholar]
- 25.Clancy TE. Surgery for pancreatic cancer. Hematol Oncol Clin North Am. 2015;29(4):701–16. [DOI] [PubMed] [Google Scholar]
- 26.Amedei A, Niccolai E, Prisco D. Pancreatic cancer: role of the immune system in cancer progression and vaccine-based immunotherapy. Hum Vaccin Immunother. 2014;10(11):3354–68. [DOI] [PMC free article] [PubMed] [Google Scholar]
- 27.Dodson LF, Hawkins WG, Goedegebuure P. Potential targets for pancreatic cancer immunotherapeutics. Immunotherapy. 2011;3(4):517–37. [DOI] [PMC free article] [PubMed] [Google Scholar]
- 28.Duan X, Chan C, Lin W. Nanoparticle-mediated immunogenic cell death enables and potentiates cancer immunotherapy. Angew Chem Int Ed Engl. 2019;58(3):670–80. [DOI] [PMC free article] [PubMed] [Google Scholar]
- 29.Fucikova J, et al. Detection of immunogenic cell death and its relevance for cancer therapy. Cell Death Dis. 2020;11(11):1013. [DOI] [PMC free article] [PubMed] [Google Scholar]
- 30.Alzeibak R, et al. Targeting immunogenic cancer cell death by photodynamic therapy: past, present and future. J Immunother Cancer. 2021;9(1):e001926. [DOI] [PMC free article] [PubMed] [Google Scholar]
- 31.Choi M, et al. Immunogenic cell death in cancer immunotherapy. BMB Rep. 2023;56(5):275–86. [DOI] [PMC free article] [PubMed] [Google Scholar]
- 32.Jeong SD, et al. enhanced immunogenic cell death by apoptosis/ferroptosis hybrid pathway potentiates PD-L1 blockade cancer immunotherapy. ACS Biomater Sci Eng. 2022;8(12):5188–98. [DOI] [PubMed] [Google Scholar]
- 33.Meng Q, et al. Interrelation between programmed cell death and immunogenic cell death: take antitumor nanodrug as an example. Small Methods. 2023;7(5):e2201406. [DOI] [PubMed] [Google Scholar]
- 34.Sprooten J, et al. Trial watch: chemotherapy-induced immunogenic cell death in oncology. Oncoimmunology. 2023;12(1):2219591. [DOI] [PMC free article] [PubMed] [Google Scholar]
- 35.Zhu M, et al. Immunogenic cell death induction by ionizing radiation. Front Immunol. 2021;12:705361. [DOI] [PMC free article] [PubMed] [Google Scholar]
- 36.Wang X, et al. Targeting STAT3 enhances NDV-induced immunogenic cell death in prostate cancer cells. J Cell Mol Med. 2020;24(7):4286–97. [DOI] [PMC free article] [PubMed] [Google Scholar]
- 37.Lamberti MJ, et al. Dendritic cells and immunogenic cancer cell death: a combination for improving antitumor immunity. Pharmaceutics. 2020;12(3):256. [DOI] [PMC free article] [PubMed] [Google Scholar]
- 38.Shen J, et al. Sequential receptor-mediated mixed-charge nanomedicine to target pancreatic cancer, inducing immunogenic cell death and reshaping the tumor microenvironment. Int J Pharm. 2021;601:120553. [DOI] [PubMed] [Google Scholar]
- 39.Zhao X, et al. Inducing enhanced immunogenic cell death with nanocarrier-based drug delivery systems for pancreatic cancer therapy. Biomaterials. 2016;102:187–97. [DOI] [PubMed] [Google Scholar]
- 40.Yu W, Li M, Xia J. Identification of immunogenic cell death-related prognostic signatures in pancreatic cancer. Oncol Lett. 2023;26(5):473. [DOI] [PMC free article] [PubMed] [Google Scholar]
- 41.Wang X, et al. An immunogenic cell death-related gene expression signature in predicting prognosis of pancreatic ductal adenocarcinoma. BMC Genomics. 2024;25(1):205. [DOI] [PMC free article] [PubMed] [Google Scholar]
- 42.Peng W, et al. Immunogenic cell death-associated biomarkers classification predicts prognosis and immunotherapy efficacy in pancreatic ductal adenocarcinoma. Front Oncol. 2023;13:1178966. [DOI] [PMC free article] [PubMed] [Google Scholar]
- 43.Wang X, et al. CASP1 is a target for combination therapy in pancreatic cancer. Eur J Pharmacol. 2023;961:176175. [DOI] [PubMed] [Google Scholar]
- 44.Hong W, et al. Pan-cancer analysis of the CASP gene family in relation to survival, tumor-infiltrating immune cells and therapeutic targets. Genomics. 2020;112(6):4304–15. [DOI] [PubMed] [Google Scholar]
- 45.Owen AM, et al. MyD88-dependent signaling drives toll-like receptor-induced trained immunity in macrophages. Front Immunol. 2022;13:1044662. [DOI] [PMC free article] [PubMed] [Google Scholar]
- 46.Thomas SY, et al. MyD88-dependent dendritic and epithelial cell crosstalk orchestrates immune responses to allergens. Mucosal Immunol. 2018;11(3):796–810. [DOI] [PMC free article] [PubMed] [Google Scholar]
- 47.Zheng H, et al. MyD88 signaling pathways: role in breast cancer. Front Oncol. 2024;14:1336696. [DOI] [PMC free article] [PubMed] [Google Scholar]
- 48.Wang L, et al. Dual functional roles of the MyD88 signaling in colorectal cancer development. Biomed Pharmacother. 2018;107:177–84. [DOI] [PubMed] [Google Scholar]
- 49.Wang L, et al. Blockade of Myd88 signaling by a novel MyD88 inhibitor prevents colitis-associated colorectal cancer development by impairing myeloid-derived suppressor cells. Invest New Drugs. 2022;40(3):506–18. [DOI] [PMC free article] [PubMed] [Google Scholar]
- 50.Cathomas G. PIK3CA in colorectal cancer. Front Oncol. 2014;4:35. [DOI] [PMC free article] [PubMed] [Google Scholar]
- 51.Choi S, et al. PIK3CA mutation subtype delineates distinct immune profiles in gastric carcinoma. J Pathol. 2023;260(4):443–54. [DOI] [PubMed] [Google Scholar]
- 52.Sivaram N, et al. Tumor-intrinsic PIK3CA represses tumor immunogenecity in a model of pancreatic cancer. J Clin Invest. 2019;129(8):3264–76. [DOI] [PMC free article] [PubMed] [Google Scholar]
- 53.Payne SN, et al. PIK3CA mutations can initiate pancreatic tumorigenesis and are targetable with PI3K inhibitors. Oncogenesis. 2015;4(10):e169. [DOI] [PMC free article] [PubMed] [Google Scholar]
Associated Data
This section collects any data citations, data availability statements, or supplementary materials included in this article.
Supplementary Materials
Data Availability Statement
The data utilized in this study are accessible from the TCGA database (https://portal.gdc.cancer.gov/) and the GEO database (https://www.ncbi.nlm.nih.gov/geo/).


