

Abstract
Background
The advantages of robot‐assisted minimally invasive esophagectomy (RA‐MIE) over conventional minimally invasive esophagectomy (C‐MIE) are unknown. This nationwide large‐scale study aimed to compare surgical outcomes between RA‐MIE and C‐MIE using rigorous propensity score methods, including detailed covariates and relevant outcomes.
Methods
This Japanese nationwide retrospective cohort study included RA‐MIE or C‐MIE for esophageal malignant tumors performed between October 2018 and December 2019 and registered in the Japanese National Clinical Database. The primary outcome measure was postoperative complications classified as Clavien–Dindo Grade IIIa or higher. Propensity score matching was performed to create a balanced covariate distribution between the two groups.
Results
After propensity score matching, 1092 patients were selected. The RA‐MIE group had a significantly longer operation time and greater blood loss than the C‐MIE group (565 vs. 477 min and 120 vs. 90 mL). Furthermore, the R0 resection rate was lower in the RA‐MIE group than in the C‐MIE group (95.1% vs. 97.8%). The RA‐MIE and C‐MIE groups had no differences regarding overall complications ≥ Grade IIIa (22.0% vs. 20.3%, p = 0.52), 30‐day mortality rates (0.4% vs. 0.5%), and operative mortality rates (0.7% vs. 0.7%). Deep SSI was less frequent (2.7% vs. 6.0%) and pulmonary embolism was more frequent (2.4% vs. 0.5%) in the RA‐MIE group than in the C‐MIE group.
Conclusions
In the initial phase of implementation, RA‐MIE and C‐MIE demonstrated comparable morbidity rates when performed by skilled board‐certified endoscopic surgeons.
Keywords: esophagectomy, morbidity, propensity score, robotics, surgical outcomes
In Japan, the national universal health insurance system started to cover robot‐assisted minimally invasive esophagectomy (RA‐MIE) in April 2018. In this Japanese nationwide study using rigorous propensity score methods, 1092 patients were selected, and RA‐MIE and C‐MIE demonstrated comparable morbidity rates. RA‐MIE was safely introduced in the nation.
1. INTRODUCTION
Esophageal cancer ranks seventh in terms of incidence and is the sixth most common cause of cancer‐related death. 1 The principal treatment for localized esophageal cancer is esophagectomy with regional lymphadenectomy, and minimally invasive esophagectomy (MIE) has been adapted to reduce surgical damage. 2 , 3 To overcome some of the drawbacks of conventional MIE (C‐MIE), robotic technology has been employed in this procedure by Kernstine et al. in 2002. 4 Since then, robot‐assisted MIE (RA‐MIE) has been widely used worldwide, and it is expected to have greater patient outcomes than C‐MIE. 5 To date, comparisons between RA‐MIE and C‐MIE have been conducted only in small‐scale studies or database studies including only a few covariates and outcome data. 6 , 7 , 8 , 9 , 10 , 11 Therefore, the advantages of RA‐MIE over C‐MIE have not been confirmed.
In Japan, nearly 70% of patients underwent MIE in 2019, and the number of RA‐MIE cases has been increasing since the national universal health insurance system started to cover RA‐MIE in April 2018. 12 , 13 The Japanese National Clinical Database (NCD) is a nationwide, web‐based data entry system that includes approximately 5000 facilities and covers approximately 95% of surgeries performed in Japan. 14 , 15 , 16 , 17 The NCD collects data on detailed patient demographics, preexisting comorbidities, and preoperative laboratory values. 17 In addition, postoperative complications categorized using the Clavien–Dindo (CD) classification and specific complications, such as recurrent laryngeal nerve (RLN) palsy, were also collected. 18 This large‐scale nationwide study aimed to compare the surgical outcomes between RA‐MIE and C‐MIE using rigorous propensity score methods, including detailed covariates and outcome, and to determine whether RA‐MIE has been safely implemented in the nation.
2. METHODS
2.1. Patients and the data source
This retrospective study included patients who were registered in the gastroenterological section of NCD and underwent RA‐MIE or C‐MIE for primary esophageal malignant tumor between October 2018 and December 2019. The guidelines published by the Japanese Society for Endoscopic Surgery (JSES) set surgeon standards for robotic surgery. The surgeons who performed robotic surgery were limited to those who were certified by the Endoscopic Surgical Skill Qualification System (ESSQS) of the JSES. 13 , 19 , 20 The ESSQS evaluates experience and surgical technique of endoscopic surgery using documents and unedited videos in a double‐blind fashion with strict criteria. Only highly skilled endoscopic surgeons could obtain this certification. However, no specific surgeon standards were set for C‐MIE. To fairly compare the two approaches, the operating surgeons in both groups were confined to ESSQS‐certified surgeons.
This study excluded patients who underwent esophagectomy without reconstruction, those who underwent only a transhiatal approach, and those who refused to register in the NCD. Patients who had the following were also excluded: Stage IV esophageal cancer (T4b or M1); Tx, Nx, or Mx; disseminated cancer; emergency surgery; and concurrent surgical procedures other than cholecystectomy, appendectomy, gastrostomy, and enterostomy. Staging was registered according to the 8th edition of the Union for International Cancer Control TNM classification. 21
NCD collects perioperative data up to 90 days after surgery. The definition of variables can be accessed via the internet, and an annual educational meeting and e‐learning system are provided for data managers. Data consistency is validated through site visits or remote audits for randomly chosen institutions. 22 , 23
2.2. Outcomes
The primary outcome measure was postoperative complications ≥ Grade IIIa according to the CD classification. 18 The secondary outcome measures were conversion to open surgery; duration of surgery; intraoperative bleeding volume; intraoperative bleeding ≥1000 mL; intraoperative red blood cell transfusion; surgical curability (R0, R1, R2); duration of intensive care unit (ICU) stay; length of postoperative hospital stay (LHS); reoperation rate within 30 days after surgery; readmission rate within 30 days after surgery; 30‐day mortality; and operative mortality. Thirty‐day mortality was defined as any death within 30 days following surgery, regardless of hospitalization status and cause of death. Operative mortality was defined as death from any cause during the index hospital admission up to 90 days and death after hospital discharge within 30 days following surgery.
In addition, we evaluated specific postoperative complications, such as surgical site infection (SSI), anastomotic leakage, RLN palsy, pneumonia, atelectasis, empyema, unplanned intratracheal intubation, artificial respiration, postoperative sepsis, postoperative blood transfusion, tracheal necrosis, gastric tube necrosis, and pulmonary embolism. SSI was classified as either superficial, deep, or organ space infection.
2.3. Selection of confounding factors
In this retrospective study, propensity score matching (PSM) was performed to create a balanced covariate distribution between the two groups. Our study team held several consensus meetings before performing PSM to identify confounding factors to achieve greater comparability. As presented in the Supplemental Table—Data S1, 37 covariates, including details of patient characteristics, comorbidities, laboratory data, tumor findings, and preoperative treatment, were selected. The abdominal approach, reconstruction method, and combined surgery were also selected because they might influence the decision to choose a surgical approach. In addition, the hospital annual case volume of MIE was evaluated as either ≥ or <10 cases/year because hospital volume is a strong predictor of surgical outcomes, and the minimum volume standards for claim submission were set to 10 cases per year for only RA‐MIE. 24
2.4. Statistical analysis
The propensity score was estimated using logistic regression models by a biostatistician (H.K.) who was blinded to the outcomes. Using a greedy nearest‐neighbor matching algorithm with no replacement, patients who underwent RA‐MIE were matched to those who underwent C‐MIE at a 1:1 ratio using the logit of PS, with a caliper of 0.2 of its standard deviation. The balance of each covariate between the groups was evaluated before and after matching using absolute standardized differences. Absolute standardized differences above 0.1 were considered as a sign of a meaningful imbalance. After a study team confirmed the balance of the two groups in matched samples, comparisons of outcomes were performed only once by the biostatistician. McNemar's test was employed for categorical variables, whereas the Wilcoxon signed‐rank test was employed for continuous variables. All comparisons were two‐sided, and p < 0.05 was considered statistically significant. All analyses were conducted using SAS version 9.4 (SAS Institute, Cary, NC, USA).
3. RESULTS
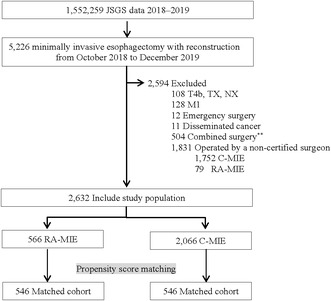
A flow diagram of the patient selection process is presented in Figure 1. The analysis included 5226 patients who underwent RA‐MIE or C‐MIE during the study period in Japan, among whom 2632 (50%) met the inclusion criteria and were treated by ESSQS‐certified surgeons. The baseline characteristics are presented in Table 1. Patients who were young, female, had a normal body mass index, had normal laboratory data, and had earlier disease tended to undergo RA‐MIE. Furthermore, those with better American Society of Anesthesiologists Physical Status scores were likely to undergo RA‐MIE. Moreover, patients who underwent neoadjuvant chemotherapy, open abdomen procedure, retrosternal reconstruction, and combined surgery were less likely to undergo RA‐MIE. Although most patients (93.3%) in the RA‐MIE group underwent surgery at hospitals with ≥10 cases of minimally invasive surgery per year, approximately 25% of patients underwent C‐MIE at hospitals with case volume of less than 10. Matching based on propensity scores produced 546 patients in each group. All standardized differences were within ±0.06, and the characteristics of both groups were well balanced. Both RA‐MIE and C‐MIE performed at hospitals having ≥10 cases of minimally invasive surgery per year exceeded 90%.
FIGURE 1.

Flow diagram of patient selection. C‐MIE, conventional minimally invasive esophagectomy; JSGS, Japan Society for Gastroenterological Surgery; RA‐MIE, robot‐assisted minimally invasive esophagectomy.
TABLE 1.
Patient background.
| Before matching | After matching | |||||
|---|---|---|---|---|---|---|
| No. (%) | SD | No. (%) | SD | |||
| RA‐MIE | C‐MIE | RA‐MIE | C‐MIE | |||
| (N = 566) | (N = 2066) | (N = 546) | (N = 546) | |||
| Age, years | ||||||
| <60 | 124 (21.9%) | 361 (17.5%) | 0.19 | 121 (22.2%) | 129 (23.6%) | 0.06 |
| 60–64 | 99 (17.5%) | 285 (13.8%) | 94 (17.2%) | 104 (19.0%) | ||
| 65–69 | 119 (21.0%) | 425 (20.6%) | 115 (21.1%) | 104 (19.0%) | ||
| 70–74 | 121 (21.4%) | 592 (28.7%) | 117 (21.4%) | 115 (21.1%) | ||
| 75–79 | 80 (14.1%) | 358 (17.3%) | 77 (14.1%) | 73 (13.4%) | ||
| ≥80 | 23 (4.1%) | 145 (7.0%) | 22 (4.0%) | 21 (3.8%) | ||
| Sex | ||||||
| Female | 140 (24.7%) | 382 (18.5%) | 0.15 | 136 (24.9%) | 137 (25.1%) | 0.00 |
| BMI, kg/m2 | ||||||
| <18.5 | 75 (13.3%) | 351 (17.0%) | 0.11 | 69 (12.6%) | 72 (13.2%) | 0.00 |
| 18.5≤ BMI <25 | 415 (73.3%) | 1418 (68.6%) | 403 (73.8%) | 402 (73.6%) | ||
| ≥25 | 76 (13.4%) | 297 (14.4%) | 74 (13.6%) | 72 (13.2%) | ||
| ASA‐PS | ||||||
| 3–5 | 26 (4.6%) | 190 (9.2%) | −0.18 | 25 (4.6%) | 19 (3.5%) | 0.06 |
| ADL | ||||||
| With any assistance | 2 (0.4%) | 21 (1.0%) | −0.08 | 2 (0.4%) | 1 (0.2%) | 0.03 |
| Smoking | 216 (38.2%) | 723 (35.0%) | 0.07 | 208 (38.1%) | 210 (38.5%) | −0.01 |
| Habitual alcohol consumption | 390 (68.9%) | 1376 (66.6%) | 0.05 | 374 (68.5%) | 369 (67.6%) | 0.02 |
| Chronic steroid use | 8 (1.4%) | 14 (0.7%) | 0.07 | 7 (1.3%) | 5 (0.9%) | 0.04 |
| Weight loss >10% | 29 (5.1%) | 95 (4.6%) | 0.02 | 29 (5.3%) | 26 (4.8%) | 0.03 |
| Bleeding risk factor | 52 (9.2%) | 199 (9.6%) | −0.02 | 52 (9.5%) | 45 (8.2%) | 0.05 |
| Preoperative sepsis | 0 (0.0%) | 1 (0.0%) | −0.03 | 0 (0.0%) | 0 (0.0%) | 0.00 |
| Respiratory distress | 3 (0.5%) | 18 (0.9%) | −0.04 | 3 (0.5%) | 1 (0.2%) | 0.06 |
| Artificial respiration | 2 (0.4%) | 1 (0.05%) | 0.07 | 0 (0.0%) | 0 (0.0%) | 0.00 |
| Comorbidities | ||||||
| DM (with insulin use) | 17 (3.0%) | 74 (3.6%) | −0.03 | 15 (2.7%) | 14 (2.6%) | 0.01 |
| COPD | 48 (8.5%) | 131 (6.3%) | 0.08 | 43 (7.9%) | 41 (7.5%) | 0.01 |
| Hypertension | 225 (39.8%) | 852 (41.2%) | −0.03 | 217 (39.7%) | 192 (35.2%) | 0.09 |
| CVD | 15 (2.7%) | 47 (2.3%) | 0.02 | 15 (2.7%) | 12 (2.2%) | 0.04 |
| Hemodialysis | 1 (0.2%) | 9 (0.4%) | −0.05 | 1 (0.2%) | 1 (0.2%) | 0.00 |
| Laboratory data | ||||||
| WBC >9000/μL | 18 (3.2%) | 111 (5.4%) | −0.11 | 18 (3.3%) | 17 (3.1%) | 0.01 |
| Hemoglobin <10 g/dL | 49 (8.7%) | 205 (9.9%) | −0.04 | 48 (8.8%) | 45 (8.2%) | 0.02 |
| Platelet count <10 × 104 /μL | 6 (1.1%) | 29 (1.4%) | −0.03 | 5 (0.9%) | 5 (0.9%) | 0.00 |
| ALB <2.5 g/dL | 2 (0.4%) | 5 (0.2%) | 0.02 | 2 (0.4%) | 3 (0.5%) | −0.03 |
| ALP >340 U/L | 36 (6.4%) | 100 (4.8%) | 0.06 | 35 (6.4%) | 27 (4.9%) | 0.06 |
| Creatinine >1.2 mg/dL | 20 (3.5%) | 170 (8.2%) | −0.20 | 19 (3.5%) | 19 (3.5%) | 0.00 |
| Na <138 mEq/L | 36 (6.4%) | 215 (10.4%) | −0.15 | 34 (6.2%) | 29 (5.3%) | 0.04 |
| CRP ≥1.0 mg/dL | 31 (5.5%) | 182 (8.8%) | −0.13 | 30 (5.5%) | 25 (4.6%) | 0.04 |
| PT‐INR >1.1 | 17 (3.0%) | 70 (3.4%) | −0.02 | 17 (3.1%) | 16 (2.9%) | 0.01 |
| T factor | ||||||
| ≤T1a | 62 (11.0%) | 219 (10.6%) | 0.20 | 58 (10.6%) | 58 (10.6%) | 0.06 |
| T1b | 212 (37.5%) | 607 (29.4%) | 206 (37.7%) | 196 (35.9%) | ||
| T2 | 92 (16.3%) | 308 (14.9%) | 88 (16.1%) | 98 (17.9%) | ||
| T3 | 188 (33.2%) | 847 (41.0%) | 183 (33.5%) | 184 (33.7%) | ||
| T4a | 12 (2.1%) | 85 (4.1%) | 11 (2.0%) | 10 (1.8%) | ||
| N factor | ||||||
| N0 | 315 (55.7%) | 983 (47.6%) | 0.17 | 304 (55.7%) | 305 (55.9%) | 0.03 |
| N1 | 143 (25.3%) | 597 (28.9%) | 137 (25.1%) | 142 (26.0%) | ||
| N2 | 79 (14.0%) | 368 (17.8%) | 78 (14.3%) | 71 (13.0%) | ||
| N3 | 29 (5.1%) | 118 (5.7%) | 27 (4.9%) | 28 (5.1%) | ||
| Histology | ||||||
| SCC | 485 (85.7%) | 1779 (86.1%) | 0.09 | 468 (85.7%) | 472 (86.4%) | 0.03 |
| Adenocarcinoma | 72 (12.7%) | 217 (10.5%) | 70 (12.8%) | 68 (12.5%) | ||
| Other | 9 (1.6%) | 70 (3.4%) | 8 (1.5%) | 6 (1.1%) | ||
| Neoadjuvant chemotherapy | 282 (49.8%) | 1131 (54.7%) | −0.10 | 273 (50.0%) | 276 (50.5%) | −0.01 |
| Neoadjuvant radiotherapy | 25 (4.4%) | 63 (3.0%) | 0.07 | 24 (4.4%) | 21 (3.8%) | 0.03 |
| Use of laparoscopy | 488 (86.2%) | 1663 (80.5%) | 0.15 | 472 (86.4%) | 475 (87.0%) | −0.02 |
| Reconstruction organ | ||||||
| Gastric tube | 552 (97.5%) | 1991 (96.4%) | 0.07 | 533 (97.6%) | 531 (97.3%) | 0.02 |
| Others | 14 (2.5%) | 75 (3.6%) | 13 (2.4%) | 15 (2.7%) | ||
| Reconstruction routes | ||||||
| Retrosternal | 320 (56.5%) | 1720 (83.3%) | 0.17 | 307 (56.2%) | 318 (58.2%) | 0.04 |
| Antethoracic | 13 (2.3%) | 72 (3.5%) | 11 (2.0%) | 12 (2.2%) | ||
| Posterior mediastinal | 233 (41.2%) | 674 (32.6%) | 228 (41.8%) | 216 (39.6%) | ||
| Combined surgery | 116 (20.5%) | 479 (23.2%) | 0.17 | 109 (20.0%) | 98 (17.9%) | 0.05 |
| Hospital volume (≥10 cases/year) | 528 (93.3%) | 1626 (78.7%) | 0.43 | 510 (93.4%) | 510 (93.4%) | 0.00 |
Abbreviations: ADL, activities of daily living; ALB, albumin; ALP, alkaline phosphatase; ASA‐PS, American Society of Anesthesiologists‐physical status; BMI, body mass index; C‐MIE, conventional minimally invasive esophagectomy; COPD, chronic obstructive pulmonary disease; CRP, C‐reactive protein; DM, diabetes mellitus; Na, sodium; PT‐INR, Prothrombin Time–International Normalized Ra; RA‐MIE, robot‐assisted minimally invasive esophagectomy; SD, standardized difference; WBC, white blood cell count.
The intraoperative outcomes are summarized in Table 2. The RA‐MIE group had a significantly longer operation time and greater blood loss than the C‐MIE group (565 vs. 477 min, 120 vs. 90 mL, respectively). Furthermore, the R0 resection rate was lower in the RA‐MIE group than in the C‐MIE group (95.1% vs. 97.8%). There were no significant differences in the rate of conversion to open surgery and massive bleeding (≥1000 mL) between the groups.
TABLE 2.
Intraoperative outcomes.
| Before matching | After matching | ||||
|---|---|---|---|---|---|
| No. (%)/median (p5‐p95) | No. (%)/median (p5‐p95) | p‐value | |||
| RA‐MIE | C‐MIE | RA‐MIE | C‐MIE | ||
| (n = 566) | (n = 2066) | (n = 546) | (n = 546) | ||
| Conversion to open surgery | 3 (0.5%) | 13 (0.6%) | 3 (0.5%) | 1 (0.2%) | 0.32 |
| Intraoperative cardiac arrest | 0 (0.0%) | 0 (0.0%) | 0 (0.0%) | 0 (0.0%) | ‐ |
| Intraoperative myocardial infarction | 0 (0.0%) | 0 (0.0%) | 0 (0.0%) | 0 (0.0%) | ‐ |
| Total operative time, min | 567 (391–827) | 490 (295–725) | 565 (388–828) | 477 (287–676) | <0.001 |
| Estimate blood loss, mL | 120 (5–569) | 120 (10–593) | 120 (5–569) | 90 (10–540) | 0.02 |
| Massive bleeding (≥1000 mL) | 7 (1.2%) | 35 (1.7%) | 6 (1.1%) | 10 (1.8%) | 0.32 |
| Intraoperative blood transfusion | 40 (7.1%) | 152 (7.4%) | 39 (7.1%) | 30 (5.5%) | 0.28 |
| Intraoperative RCC transfusion, unit | 2 (0–6) | 2 (0–8) | 2 (0–6) | 2 (0–10) | 1.00 |
| Residual tumor | |||||
| R0 | 519 (91.7%) | 1960 (94.9%) | 519 (95.1%) | 534 (97.8%) | 0.02 |
| R1 | 16 (2.8%) | 38 (1.8%) | 16 (2.9%) | 6 (1.1%) | |
| R2 | 5 (0.9%) | 27 (1.3%) | 4 (0.7%) | 3 (0.5%) | |
| Rx | 8 (1.4%) | 7 (0.3%) | 7 (1.3%) | 3 (0.5%) | |
Abbreviations: C‐MIE, conventional minimally invasive esophagectomy; p5‐p95, 5th and 95th percentile; RA‐MIE, robot‐assisted minimally invasive esophagectomy; RCC, red cell concentrate.
The postoperative outcomes are listed in Table 3. There were no differences between the two groups in terms of the rate of overall complications ≥ Grade IIIa (22.0% vs. 20.3%, p = 0.52). Deep SSI occurred less frequently in the RA‐MIE group than in the C‐MIE group (2.7% vs. 6.0%), although the incidence of pulmonary embolism was higher in the RA‐MIE group than in the C‐MIE group (2.4% vs. 0.5%). The incidence of RLN paralysis and pneumonia were higher in the RA‐MIE group than in the C‐MIE group, but this difference was not statistically significant (17.0% vs. 12.8%, 16.8% vs. 13.0%, respectively). No differences were observed in terms of superficial/organ space SSI, anastomotic leakage, and other complications between the groups. Although there were no differences in the reoperation and readmission rates, the length of ICU and hospital stay was longer in the RA‐MIE group than in the C‐MIE group (3 vs. 3 days, 23 vs. 19 days, respectively). There were no differences in the 30‐day and operative mortality rates between the groups (0.4% vs. 0.5%, 0.7% vs. 0.7%, respectively).
TABLE 3.
Postoperative outcomes.
| Before matching | After matching | ||||
|---|---|---|---|---|---|
| No. (%)/median (p5‐p95) | No. (%)/median (p5‐p95) | p‐value | |||
| RA‐MIE | C‐MIE | RA‐MIE | C‐MIE | ||
| (n = 566) | (n = 2066) | (n = 546) | (n = 546) | ||
| Overall complication ≥ Grade IIIa | 122 (21.6%) | 450 (21.8%) | 120 (22.0%) | 111 (20.3%) | 0.52 |
| Specific complication | |||||
| Superficial SSI | 39 (6.9%) | 164 (7.9%) | 39 (7.1%) | 49 (9.0%) | 0.26 |
| Deep SSI | 15 (2.7%) | 87 (4.2%) | 15 (2.7%) | 33 (6.0%) | 0.01 |
| Organ space SSI | 42 (7.4%) | 181 (8.8%) | 39 (7.1%) | 47 (8.6%) | 0.37 |
| Anastomotic leakage | 66 (11.7%) | 299 (14.5%) | 62 (11.4%) | 76 (13.9%) | 0.11 |
| Recurrent laryngeal nerve paralysis | 95 (16.8%) | 300 (14.5%) | 93 (17.0%) | 70 (12.8%) | 0.06 |
| Pneumonia | 95 (16.8%) | 306 (14.8%) | 92 (16.8%) | 71 (13.0%) | 0.07 |
| Atelectasis | 24 (4.2%) | 113 (5.5%) | 23 (4.2%) | 21 (3.8%) | 0.75 |
| Empyema | 9 (1.6%) | 19 (0.9%) | 8 (1.5%) | 4 (0.7%) | 0.25 |
| Unplanned intratracheal intubation | 23 (4.1%) | 98 (4.7%) | 22 (4.0%) | 17 (3.1%) | 0.42 |
| Artificial respiration | 30 (5.3%) | 118 (5.7%) | 29 (5.3%) | 22 (4.0%) | 0.33 |
| Postoperative sepsis | 11 (1.9%) | 25 (1.2%) | 11 (2.0%) | 6 (1.1%) | 0.23 |
| Postoperative blood transfusion | 25 (4.4%) | 98 (4.7%) | 24 (4.4%) | 24 (4.4%) | 1.00 |
| Tracheal necrosis | 0 (0.0%) | 0 (0.0%) | 0 (0.0%) | 0 (0.0%) | ‐ |
| Gastric tube necrosis | 3 (0.5%) | 3 (0.1%) | 3 (0.5%) | 1 (0.2%) | 0.32 |
| Pulmonary embolism | 13 (2.3%) | 18 (0.9%) | 13 (2.4%) | 3 (0.5%) | 0.01 |
| ICU stay, days | 3 (2–10) | 3 (0–11) | 3 (2–10) | 3 (0–9) | 0.01 |
| LOS, days | 23 (12–68) | 22 (11–84) | 23 (12–65) | 19 (11–72) | 0.001 |
| Reoperation within 30 days | 30 (5.3%) | 104 (5.0%) | 29 (5.3%) | 25 (4.6%) | 0.59 |
| Readmission within 30 days | 10 (1.8%) | 44 (2.1%) | 8 (1.5%) | 9 (1.6%) | 0.81 |
| 30‐Day mortality | 2 (0.4%) | 12 (0.6%) | 2 (0.4%) | 3 (0.5%) | 0.66 |
| Operative mortality | 4 (0.7%) | 30 (1.5%) | 4 (0.7%) | 4 (0.7%) | 1.00 |
Abbreviations: C‐MIE, conventional minimally invasive esophagectomy; ICU, intensive care unit; LOS, length of postoperative hospital stay; p5‐p95, 5th percentile and the 95th percentile; RA‐MIE, robot‐assisted minimally invasive esophagectomy; SSI, surgical site infection.
4. DISCUSSION
This study included 1092 matched patients in a real‐world setting and rigorously compared the surgical outcomes between RA‐MIE and C‐MIE using a nationwide database with a high‐coverage rate. During the study period, only ESSQS‐certified surgeons performed robotic surgery, whereas noncertified surgeons performed approximately 46% of C‐MIE procedures. To achieve greater comparability between the two approaches, operating surgeons in both groups were confined to skilled board‐certified endoscopic surgeons. The PSM analysis included 37 detailed variables. Unlike other large databases, NCD collects postoperative complications classified in accordance with CD classification. The primary endpoint of this study was the overall rate of complications ≥ Grade IIIa. 6 , 7 , 8 After we confirmed that the characteristics of both groups were well balanced, comparisons of outcomes were performed only once by a biostatistician who was blinded to the outcomes. No difference was observed between the two groups in this primary endpoint. This was the first large‐scale nationwide study to compare surgical outcomes (based on the CD classification) between RA‐MIE and C‐MIE using rigorous propensity score methods, including detailed covariates.
Our research team, comprising expert surgeons and epidemiologists, rigorously decided all outcomes before conducting data analyses. We set postoperative complications ≥ Grade III as the primary endpoint and identified 15 specific complications, including leakage, and six surgical outcomes, such as mortality. This study found no differences in the incidence of postoperative complications ≥ Grade IIIa (22.0% vs. 20.3%, p = 0.52). Following the results of this primary endpoint, ad hoc analyses were conducted to determine the incidence of postoperative complications ≥ Grade II (44.1% vs. 39.9%, p = 0.16). Although a larger difference was observed, it did not change the study's conclusions. Although Tsunoda et al. reported a better overall postoperative morbidity rate with RA‐MIE than with C‐MIE (11% vs. 29%, p = 0.04), no significant difference was observed between the two groups in the meta‐analysis and a randomized controlled trial. 9 , 10 , 11 , 25 We expected RA‐MIE to provide better surgical outcomes, but this study supports the finding of the meta‐analysis. RA‐MIE has been reimbursed by the National Health Insurance system since April 2018 in Japan, and many enrolled patients might undergo RA‐MIE in institutions where the robotic procedure has been introduced within 1 year. The learning curve of RA‐MIE reportedly comprises approximately 50–70 procedures. 26 , 27 Significant reductions in morbidity were observed after the learning curve completion. 26 , 28 Therefore, many enrolled operating surgeons might still be in the process of learning. Conversely, C‐MIE has been reimbursed by the national insurance system for more than 10 years. This study suggests that even in the initial phase of implementation, the morbidity rate after RA‐MIE was comparable to that after C‐MIE, despite the latter being well‐established by skilled board‐certified endoscopic surgeons. We expect that the surgical outcomes of RA‐MIE will improve alongside the technical proficiency of surgeons in the future.
RA‐MIE and C‐MIE had no significant differences in 30‐day mortality (0.4% vs. 0.5%, p = 0.66) and operative morality (0.7% vs. 0.7%, p = 1.00). Similarly, no difference was observed in mortality rates in the meta‐analysis. 9 , 11 Compared with the nationwide 30‐day mortality rate after C‐MIE in the United States (2.2% and 3.2%) and in previous NCD studies (0.7% and 0.9%), the present results were favorable in both groups. 2 , 6 , 8 , 29 A similar trend was observed in the rates of reoperation, readmission, and massive intraoperative blood loss (≥1000 mL). 2 , 6 , 7 , 8 , 29 These findings further support that RA‐MIE, despite being in the initial phase of implementation, had comparable outcomes to the well‐established C‐MIE and has been safely implemented in Japan.
Although there is an international consensus that RA‐MIE is superior to C‐MIE in terms of RLN palsy, the incidence of RLN palsy tended to be higher in the RA‐MIE group than in the C‐MIE group in this study (17.0% vs. 12.8%, p = 0.06). 9 , 10 , 11 , 30 , 31 , 32 The exact reason for the difference between the present and previous reports is unclear, but we speculate that this is attributable to several factors. As mentioned above, many operating surgeons might be in the learning phase and are thus unfamiliar with the use of the robotic arm. Owing to the absence of tactile feedback from the da Vinci Surgical System, operating surgeons must understand the tension on the tissue through visual feedback. When dissecting the RLN lymph node in RA‐MIE, good traction can be achieved because of the multi‐joint robotic arms. However, excessive traction of the nerve should be avoided as it leads to RLN palsy. Controlling the force created by robotic arms is usually difficult for inexperienced surgeons; therefore, excessive force might be applied to the RLN. In the randomized controlled trial including surgeons who experienced at least 50 RA‐MIE, the RA‐MIE group had a significant lower incidence of left RLN palsy than the C‐MIE group (20.4% vs. 34%, p = 0.029). 25
The incidence of deep SSI was lower in patients with RA‐MIE than in those with C‐MIE (2.7% vs. 6.0%, p = 0.01). Deep SSI is defined as infections involving deep soft tissues, such as layers of the fascia and muscle. It is associated with healthcare cost, pain, and negative feelings. 33 , 34 Although the exact reason for this difference was also unclear, minithoracotomy is sometimes used in C‐MIE, which may cause a difference between the groups. Moreover, RA‐MIE may minimize excessive trauma to the body wall due to a remote center fixing point around which the surgical arm moves.
In terms of intraoperative outcomes, the operation time was longer for RA‐MIE than for C‐MIE (565 vs. 477 min, p < 0.001), which is in agreement with previous studies. 9 , 10 , 35 , 36 , 37 In this study, pulmonary embolism occurred more often in RA‐MIE than in C‐MIE (2.4% vs. 0.5%, p = 0.01). The longer operation time may have affected these results. The estimated intraoperative blood loss was also greater for RA‐MIE than for C‐MIE (120 vs. 90 mL, p = 0.02). However, blood losses of 215 and 442 mL have been reported in C‐MIE using NCD. In this study, blood loss in both groups was relatively low, and thus, the difference might have a limited clinical meaning. 2 , 29
Moreover, the R0 resection rate was lower in the RA‐MIE group than in the C‐MIE group (95.1% vs. 97.8%, p = 0.02). Although exact reasons for this difference were unclear, the absence of tactile feedback in RA‐MIE may have influenced the excision technique of the tumor and surrounding tissue, particularly during the initial phase of implementation. However, no differences were observed between the groups in the R0 resection rate in the meta‐analysis. 11 The R0 rate in RA‐MIE in this study is equivalent to that in reports using the national cancer registry in the United States. 7 , 8 Future Japanese nationwide studies should reexamine the difference in the R0 resection rate, which is one of the most important oncological outcomes.
Regarding the rate of open conversion, this study demonstrated no difference in both groups (0.2% in RA‐MIE vs. 0.5% in C‐MIE, p = 0.32), which was similar to the results of a previous meta‐analysis. 11 However, the present nationwide conversion rate was much lower than that in the National Surgical Quality Improvement Program in the United States (8.4% in RA‐MIE vs. 11% in C‐MIE, p = 0.41). 6
Regarding the postoperative course, this study demonstrated that the median LHS was 4 days longer in RA‐MIE than in C‐MIE (23 vs. 19 days, p = 0.001), although no difference was observed in the meta‐analysis. 11 We speculated that RLN palsy and pneumonia tended to occur more frequently after RA‐MIE and that LHS might be extended, although no differences were observed in postoperative complication rates. In addition, patients who underwent RA‐MIE at hospitals where the new approach (RA‐MIE) was implemented may be more carefully observed after surgery than those who undergo conventional treatment. However, the nationwide LHS in this study was shorter than that after C‐MIE in a previous NCD report (40 days). 29 Patients in Japan traditionally have longer LHS than those in Western countries; thus, the present results in the real‐world setting might be acceptable from a clinical point of view.
Overall, the results in both groups in this study are neither inferior nor superior to those observed in previous studies conducted inside and outside the country. When the National Health Insurance system reimbursed robotic procedures, strict facility, and surgeon standards were established by the government and academic society for safe implementation. 13 In addition, the academic society JSES decided to collect perioperative data of robotic procedures in the NCD, which were registered by the surgeons. We believe that this professional autonomy made this comparison possible, and the strict regulations contributed to favorable outcomes after RA‐MIE in the initial phase of implementation. Hereafter, we will analyze the learning curve of RA‐MIE and C‐MIE and conduct comparisons between the two groups, including only surgeons who have achieved a learning plateau, using the NCD.
This study has several limitations. First, this study was conducted retrospectively; thus, unmeasured and unknown confounding factors may exist. For example, the extent of lymphadenectomy was not included in the covariates of PSM. Furthermore, the enrolled surgeons usually have more experience with C‐MIE than with RA‐MIE. However, this study included 37 variables in PSM to adjust for patient background; thus, the comparability might be greater than any previous large‐scale studies. 7 , 8 Second, long‐term outcomes and cost‐effectiveness were outside the scope of this study because the information has not been registered in the NCD. There is an international consensus among experts that RA‐MIE should be superior to C‐MIE in terms of extensive mediastinal lymphadenectomy. 30 However, this study was not able to evaluate the difference in the number of dissected lymph nodes around the RLN or the postoperative recurrence rate in the upper mediastinum between the groups. At present, cooperative efforts between NCD, site‐specific cancer registries, and the National Health Insurance claims data are ongoing. As the advantage of RA‐MIE over C‐MIE was not clearly demonstrated in this study, the comparison in comprehensive endpoints including oncological outcomes should be performed in a future nationwide study involving experienced RA‐MIE surgeons. Third, this study did not assess the benefit of RA‐MIE among surgeons inexperienced with C‐MIE. With evolving academic society regulations, RA‐MIE has gained popularity among young, inexperienced surgeons in Japan. The procedures should be compared among this group of surgeons in the future.
In conclusion, the morbidity rate of RA‐MIE, despite being in the initial phase of implementation, was comparable to that of the well‐established C‐MIE when performed by skilled board‐certified endoscopic surgeons. RA‐MIE was safely introduced in the Japan after insurance coverage.
AUTHOR CONTRIBUTIONS
This study included 17 authors, and all authors significantly contributed to the manuscript. All authors accept direct responsibility for this nationwide, multicenter study. Conceptualization and methodology: T.N. K.O., K.S., S.T., Y.Y., M.H., S.S., T.T., M.T., H.N., and I.U. Project administration, resources, and supervision: Y.K., M.I., Y.K., H.M., and Y.S. Investigation and formal analysis: H.K. Writing—original draft preparation: T.N. Writing—review and editing: T.N., H.K., K.O., K.S., S.T., Y.Y., M.H., S.S., T.T., M.T., H.N., Y.K., M.I., Y.K., H.M., Y.S., and I.U.
FUNDING INFORMATION
This study was funded by Intuitive Surgical Sàrl for administrative support provided by EP‐CRSU Co., Ltd. The funder was not involved in the study design, collection, analysis, interpretation of data, writing of this article, or decision to submit it for publication.
CONFLICT OF INTEREST STATEMENT
K.O. received lecture fees from Intuitive Surgical, Intuitive Surgical, Inc., outside the submitted work. H.K. reports receiving consultation fees from EPS Corporation and speaker fees from Chugai Pharmaceutical Co., Ltd. H.K. and H.M. are affiliated with the Department of Healthcare Quality Assessment at the University of Tokyo, which is a social collaboration department supported by grants from NCD, Johnson & Johnson K.K., Nipro Corporation, and Intuitive Surgical Sàrl. K.S. was funded by Sysmex, Co., in relation to the Collaborative Laboratory for Research and Development in Advanced Surgical Intelligence, Fujita Health University. S.T. received lecture fees from Intuitive Surgical, Inc., Covidien Japan Inc., Ethicon Inc., and Olympus Corporation. T.T. and I.U. were also funded by Medicaroid, Inc., in relation to the Collaborative Laboratory for Research and Development in Advanced Surgical Technology, Fujita Health University. K.S. received advisory fees from Medicaroid, Inc., outside the submitted work. I.U. reports holding stocks in Intuitive Surgical, Inc. Y.K. reports grants from Chugai Pharmaceutical Co., Ltd., grants from Taiho Pharmaceutical Co., Ltd, grants from Yakult Honsha Co. Ltd., grants from Asahi Kasei Pharma Corporation, grants from Otsuka Pharmaceutical Co., Ltd., grants from Takeda Pharmaceutical Co., Ltd., grants from Ono Pharmaceutical CO., Ltd., grants from Tsumura & CO., grants from Kyouwa Hakkou Kirin Co., Ltd., grants from EA Pharma Co., Ltd., grants from Medicon INC., grants from Kaken Pharmaceutical co. Ltd., grants from Eisai Co., Ltd., grants from Otsuka Pharmaceutical Factory Inc., grants from Teijin Pharma Limited., grants from Nihon Pharmaceutical Co., Ltd., grants from Nippon Covidien Inc., personal fees from Asahi Kasei Pharma Corporation, personal fees from AstraZeneca K.K., personal fees from Ethicon Inc., personal fees from Ono Pharmaceutical CO., Ltd., personal fees from Otsuka Pharmaceutical Factory, Inc., personal fees from Olympus Corporation, personal fees from Nippon Covidien Inc., personal fees from Shionogi & Co., Ltd., personal fees from Taiho Pharmaceutical Co., Ltd, personal fees from Chugai Pharmaceutical Co., Ltd., personal fees from Bristol‐Myers Squibb K.K., personal fees from MSD K.K., personal fees from Smith & Nephew KK, personal fees from Kaken Pharmaceutical Co., Ltd., personal fees from Miyarisan Pharmaceutical Co., LTD., and personal fees from ASKA Pharmaceutical Co., Ltd. outside the submitted work. I.U. received lecture fees from Intuitive Surgical, Inc., outside the submitted work. Y.K., M.I., and Y.K. are editorial board members of Annals of Gastroenterological Surgery. The remaining authors have no commercial association with or financial involvement that might pose a conflict of interest in connection with the submitted article.
ETHICS STATEMENT
Approval of the research protocol: This study was conducted in accordance with the Helsinki Declaration of 1964 and its later versions. This study was approved by the institutional review boards of all participating institutions.
Informed Consent: The requirement for informed consent was waived because all data included in the NCD were deidentified and anonymized.
Registry and the Registration No. of the study/trial: N/A.
Animal Studies: N/A.
Supporting information
Data S1.
ACKNOWLEDGMENTS
We would like to thank all data managers and hospitals for participating in the NCD project and for their great efforts in entering the data. We also thank the working members of the NCD Committee of the JSES and the Database Committee of the Japanese Society of Gastroenterological Surgery. This study was supported by JSES. We thank Mr. Miyoshi Sakai and Ms. Chie Yamamoto of EP‐CRSU Co., Ltd. (Tokyo, Japan) for their dedicated administrative support.
Nishigori T, Kumamaru H, Obama K, Suda K, Tsunoda S, Yoda Y, et al. Short‐term outcomes of robot‐assisted versus conventional minimally invasive esophagectomy: A propensity score‐matched study via a nationwide database. Ann Gastroenterol Surg. 2025;9:109–118. 10.1002/ags3.12854
REFERENCES
- 1. Sung H, Ferlay J, Siegel RL, Laversanne M, Soerjomataram I, Jemal A, et al. Global cancer statistics 2020: GLOBOCAN estimates of incidence and mortality worldwide for 36 cancers in 185 countries. CA Cancer J Clin. 2021;71(3):209–249. [DOI] [PubMed] [Google Scholar]
- 2. Yoshida N, Yamamoto H, Baba H, Miyata H, Watanabe M, Toh Y, et al. Can minimally invasive esophagectomy replace open esophagectomy for esophageal cancer? Latest analysis of 24,233 esophagectomies from the Japanese national clinical database. Ann Surg. 2020;272(1):118–124. [DOI] [PubMed] [Google Scholar]
- 3. Biere SS, van Berge Henegouwen MI, Maas KW, Bonavina L, Rosman C, Garcia JR, et al. Minimally invasive versus open oesophagectomy for patients with oesophageal cancer: a multicentre, open‐label, randomised controlled trial. Lancet. 2012;379(9829):1887–1892. [DOI] [PubMed] [Google Scholar]
- 4. Kernstine KH, DeArmond DT, Karimi M, Van Natta TL, Campos JC, Yoder MR, et al. The robotic, 2‐stage, 3‐field esophagolymphadenectomy. J Thorac Cardiovasc Surg. 2004;127(6):1847–1849. [DOI] [PubMed] [Google Scholar]
- 5. Seto Y, Mori K, Aikou S. Robotic surgery for esophageal cancer: merits and demerits. Ann Gastroenterological Surg. 2017;1(3):193–198. [DOI] [PMC free article] [PubMed] [Google Scholar]
- 6. Harbison GJ, Vossler JD, Yim NH, Murayama KM. Outcomes of robotic versus non‐robotic minimally invasive esophagectomy for esophageal cancer: an American College of Surgeons NSQIP database analysis. Am J Surg. 2019;218(6):1223–1228. [DOI] [PubMed] [Google Scholar]
- 7. Weksler B, Sullivan JL. Survival after esophagectomy: a propensity‐matched study of different surgical approaches. Ann Thorac Surg. 2017;104(4):1138–1146. [DOI] [PubMed] [Google Scholar]
- 8. Espinoza‐Mercado F, Imai TA, Borgella JD, Sarkissian A, Serna‐Gallegos D, Alban RF, et al. Does the approach matter? Comparing survival in robotic, minimally invasive, and open esophagectomies. Ann Thorac Surg. 2019;107(2):378–385. [DOI] [PubMed] [Google Scholar]
- 9. Zheng C, Li XK, Zhang C, Zhou H, Ji SG, Zhong JH, et al. Comparison of short‐term clinical outcomes between robot‐assisted minimally invasive esophagectomy and video‐assisted minimally invasive esophagectomy: a systematic review and meta‐analysis. J Thorac Dis. 2021;13(2):708–719. [DOI] [PMC free article] [PubMed] [Google Scholar]
- 10. Tsunoda S, Obama K, Hisamori S, Nishigori T, Okamura R, Maekawa H, et al. Lower incidence of postoperative pulmonary complications following robot‐assisted minimally invasive esophagectomy for esophageal cancer: propensity score‐matched comparison to conventional minimally invasive esophagectomy. Ann Surg Oncol. 2021;28(2):639–647. [DOI] [PubMed] [Google Scholar]
- 11. Jin D, Yao L, Yu J, Liu R, Guo T, Yang K, et al. Robotic‐assisted minimally invasive esophagectomy versus the conventional minimally invasive one: a meta‐analysis and systematic review. Int J Med Robot. 2019;15(3):e1988. [DOI] [PubMed] [Google Scholar]
- 12. Marubashi S, Takahashi A, Kakeji Y, Hasegawa H, Ueno H, Eguchi S, et al. Surgical outcomes in gastroenterological surgery in Japan: report of the National Clinical Database 2011‐2019. Ann Gastroenterol Surg. 2021;5(5):639–658. [DOI] [PMC free article] [PubMed] [Google Scholar]
- 13. Nishigori T, Ichihara N, Obama K, Uyama I, Miyata H, Inomata M, et al. Prevalence and safety of robotic surgery for gastrointestinal malignant tumors in Japan. Ann Gastroenterol Surg. 2022;6(6):746–752. [DOI] [PMC free article] [PubMed] [Google Scholar]
- 14. Tomotaki A, Kumamaru H, Hashimoto H, Takahashi A, Ono M, Iwanaka T, et al. Evaluating the quality of data from the Japanese National Clinical Database 2011 via a comparison with regional government report data and medical charts. Surg Today. 2019;49(1):65–71. [DOI] [PubMed] [Google Scholar]
- 15. Hasegawa H, Takahashi A, Kakeji Y, Ueno H, Eguchi S, Endo I, et al. Surgical outcomes of gastroenterological surgery in Japan: report of the National Clinical Database 2011‐2017. Ann Gastroenterological Surg. 2019;3(4):426–450. [DOI] [PMC free article] [PubMed] [Google Scholar]
- 16. Seto Y, Kakeji Y, Miyata H, Iwanaka T. National Clinical Database (NCD) in Japan for gastroenterological surgery: brief introduction. Ann Gastroenterol Surg. 2017;1(2):80–81. [DOI] [PMC free article] [PubMed] [Google Scholar]
- 17. Gotoh M, Miyata H, Hashimoto H, Wakabayashi G, Konno H, Miyakawa S, et al. National Clinical Database feedback implementation for quality improvement of cancer treatment in Japan: from good to great through transparency. Surg Today. 2016;46(1):38–47. [DOI] [PMC free article] [PubMed] [Google Scholar]
- 18. Dindo D, Demartines N, Clavien PA. Classification of surgical complications: a new proposal with evaluation in a cohort of 6336 patients and results of a survey. Ann Surg. 2004;240(2):205–213. [DOI] [PMC free article] [PubMed] [Google Scholar]
- 19. Mori T, Kimura T, Kitajima M. Skill accreditation system for laparoscopic gastroenterologic surgeons in Japan. Minim Invasive Ther Allied Technol. 2010;19(1):18–23. [DOI] [PubMed] [Google Scholar]
- 20. Kimura T, Mori T, Konishi F, Kitajima M. Endoscopic surgical skill qualification system in Japan: five years of experience in the gastrointestinal field. Asian J Endosc Surg. 2010;3(2):66–70. [Google Scholar]
- 21. Brierley JD, Gospodarowicz MK, Wittekind C. Skin Tumours. TNM classification of malignant tumours. Chichester: John Wiley & Sons; 2017. [Google Scholar]
- 22. Kanaji S, Takahashi A, Miyata H, Marubashi S, Kakeji Y, Konno H, et al. Initial verification of data from a clinical database of gastroenterological surgery in Japan. Surg Today. 2019;49(4):328–333. [DOI] [PubMed] [Google Scholar]
- 23. Hasegawa H, Takahashi A, Kanaji S, Kakeji Y, Marubashi S, Konno H, et al. Validation of data quality in a nationwide gastroenterological surgical database: the National Clinical Database site‐visit and remote audits, 2016‐2018. Ann Gastroenterological Surg. 2021;5(3):296–303. [DOI] [PMC free article] [PubMed] [Google Scholar]
- 24. Nishigori T, Miyata H, Okabe H, Toh Y, Matsubara H, Konno H, et al. Impact of hospital volume on risk‐adjusted mortality following oesophagectomy in Japan. Br J Surg. 2016;103(13):1880–1886. [DOI] [PubMed] [Google Scholar]
- 25. Chao Y‐K, Li Z, Jiang H, Wen YW, Chiu CH, Li B, et al. Multicentre randomized clinical trial on robot‐assisted versus video‐assisted thoracoscopic oesophagectomy (REVATE trial). Br J Surg. 2024;111(7):znae143. [DOI] [PMC free article] [PubMed] [Google Scholar]
- 26. Han Y, Zhang Y, Zhang W, Xiang J, Chen K, Huang M, et al. Learning curve for robot‐assisted Ivor Lewis esophagectomy. Dis Esophagus. 2022;35(2):doab026. [DOI] [PubMed] [Google Scholar]
- 27. van der Sluis PC, Ruurda JP, van der Horst S, Goense L, van Hillegersberg R. Learning curve for robot‐assisted minimally invasive thoracoscopic esophagectomy: results from 312 cases. Ann Thorac Surg. 2018;106(1):264–271. [DOI] [PubMed] [Google Scholar]
- 28. Yang Y, Li B, Hua R, Zhang X, Jiang H, Sun Y, et al. Assessment of quality outcomes and learning curve for robot‐assisted minimally invasive McKeown esophagectomy. Ann Surg Oncol. 2021;28(2):676–684. [DOI] [PMC free article] [PubMed] [Google Scholar]
- 29. Takeuchi H, Miyata H, Ozawa S, Udagawa H, Osugi H, Matsubara H, et al. Comparison of short‐term outcomes between open and minimally invasive esophagectomy for esophageal cancer using a nationwide database in Japan. Ann Surg Oncol. 2017;24(7):1821–1827. [DOI] [PubMed] [Google Scholar]
- 30. Li B, Yang Y, Toker A, Yu B, Kang CH, Abbas G, et al. International consensus statement on robot‐assisted minimally invasive esophagectomy (RAMIE). J Thorac Dis. 2020;12(12):7387–7401. [DOI] [PMC free article] [PubMed] [Google Scholar]
- 31. Suda K, Ishida Y, Kawamura Y, Inaba K, Kanaya S, Teramukai S, et al. Robot‐assisted thoracoscopic lymphadenectomy along the left recurrent laryngeal nerve for esophageal squamous cell carcinoma in the prone position: technical report and short‐term outcomes. World J Surg. 2012;36(7):1608–1616. [DOI] [PubMed] [Google Scholar]
- 32. Oshikiri T, Goto H, Horikawa M, Urakawa N, Hasegawa H, Kanaji S, et al. Incidence of recurrent laryngeal nerve palsy in robot‐assisted versus conventional minimally invasive McKeown esophagectomy in prone position: a propensity score‐matched study. Ann Surg Oncol. 2021;28(12):7249–7257. [DOI] [PubMed] [Google Scholar]
- 33. Andersson AE, Bergh I, Karlsson J, Nilsson K. Patients' experiences of acquiring a deep surgical site infection: an interview study. Am J Infect Control. 2010;38(9):711–717. [DOI] [PubMed] [Google Scholar]
- 34. Badia JM, Casey AL, Petrosillo N, Hudson PM, Mitchell SA, Crosby C. Impact of surgical site infection on healthcare costs and patient outcomes: a systematic review in six European countries. J Hosp Infect. 2017;96(1):1–15. [DOI] [PubMed] [Google Scholar]
- 35. Deng HY, Luo J, Li SX, Li G, Alai G, Wang Y, et al. Does robot‐assisted minimally invasive esophagectomy really have the advantage of lymphadenectomy over video‐assisted minimally invasive esophagectomy in treating esophageal squamous cell carcinoma? A propensity score‐matched analysis based on short‐term outcomes. Dis Esophagus. 2019;32(7):doy110. [DOI] [PubMed] [Google Scholar]
- 36. Siaw‐Acheampong K, Kamarajah SK, Gujjuri R, Bundred JR, Singh P, Griffiths EA. Minimally invasive techniques for transthoracic oesophagectomy for oesophageal cancer: systematic review and network meta‐analysis. BJS Open. 2020;4(5):787–803. [DOI] [PMC free article] [PubMed] [Google Scholar]
- 37. Yang Y, Zhang X, Li B, Li Z, Sun Y, Mao T, et al. Robot‐assisted esophagectomy (RAE) versus conventional minimally invasive esophagectomy (MIE) for resectable esophageal squamous cell carcinoma: protocol for a multicenter prospective randomized controlled trial (RAMIE trial, robot‐assisted minimally invasive esophagectomy). BMC Cancer. 2019;19(1):608. [DOI] [PMC free article] [PubMed] [Google Scholar]
Associated Data
This section collects any data citations, data availability statements, or supplementary materials included in this article.
Supplementary Materials
Data S1.