Bloom syndrome (BSyn, OMIM #210900) is a rare autosomal recessive disorder characterized by growth restriction, sun sensitivity, insulin resistance, mild immune deficiency, and increased risk of early-onset malignancy.1 BSyn cases are caused by homozygous or compound heterozygous pathogenic variants (PV) in BLM, with over 547 different PV identified in ClinVar.2 The Bloom Syndrome Registry (BSR) recently reported that 53% of participants had developed cancer, with hematologic malignancies being the most common cancer risk.3 While several studies have shown no association of carriers having increased risk,4,5 recent studies have identified increased risk of cancers in BLM PV carriers such as colorectal cancer,6 breast cancer7 and mesothelioma.8
Clonal hematopoiesis of indeterminate potential (CHIP) is characterized by somatic mutations in leukemia-related genes detected in individuals without apparent hematologic malignancy.9 CHIP is associated with an annual increased risk of leukemia ranging from 0.5% to 1.0%.9 Increased age and presence of germline variants in DNA repair and telomere maintenance genes are associated with increased prevalence of CHIP.10
The latter suggests that germline PV can create a “permissive” environment for clonal evolution,11 leading to clonal selection in hematopoietic cells. In a longitudinal study spanning 14 years with 4,596 participants who developed blood malignancies, 18 genes were found to predispose individuals to clonal hematopoiesis. Notably, BLM was one of these genes.12 Therefore, we hypothesized that one or two germline BLM PV may heighten CHIP risk in a dose-dependent fashion with one germline PV associated with mildly elevated malignancy risk while two germline PV are associated with increased malignancy risk at an early age. Using exome sequencing of BSyn patients and BLM carriers, we found that both BSyn probands and BLM carriers exhibited an increased frequency of CHIP compared to sex- and age-matched controls. This study sheds new light on the interplay between genetic predispositions and somatic variation and highlights the need for additional studies to further evaluate the mechanisms and potential clinical implications for patients with one or two BLM P V.
All study participants provided informed consent under a protocol for the BSR approved by the Weill Cornell Medical College Institutional Review Board, and a material transfer agreement was obtained. We performed exome sequencing with the Nextera DNA Flex Pre-Enrichment Library Prep and the Roche NimbleGen exome capture kit following standard protocols. Libraries were indexed, multiplexed and sequenced on a 2x150 Illumina NovaSeq S1 flowcell at the UCLA Technology Center for Genomics and Bioinformatics. Age- and sex-matched control trios were obtained from the publicly available dbGAP study phs000178.v11.p8.c1, submitted by the Center for Mendelian Genomics (CMG) - The Broad Institute Joint Center for Mendelian Genomics - The Broad Institute Joint Center for Mendelian Genomics. Control trios harbored undiagnosed disease without cancer phenotypes and samples were processed with the Illumina Nextera Exome Kit and sequenced on an Illumina HiSeq. The following public datasets were used: SRA ID SRS2136666, SRS2813808, SRS2136486, SRS2140039, SRS2140061, SRS2136721, SRS2203482, SRS2202906, SRS2202907, SRS2130875, SRS2136628, SRS2130876, SRS2197363, SRS2197826, SRS2197795, SRS2140305, SRS2137393, SRS2137389, SRS2200570, SRS2200550, SRS2200596, SRS2195820, SRS2195786, SRS2195798, SRS2200588, SRS2200627, SRS2200615, SRS2205811, SRS2195821, SRS2195834, SRS2136679, SRS2136619, SRS2136617, SRS2136629, SRS2136659, SRS2136613, SRS2203316, SRS2202950, SRS2202953, SRS2203490, SRS2203471, SRS2203336, SRS2200551, SRS2200573, SRS2200609, SRS2200624, SRS2200562, SRS2200610, SRS2200576, SRS2200561, SRS2288808, SRS2288810, SRS2288816, SRS2200626, SRS2200613, SRS2288805, SRS2200605
All FASTQ files underwent unified quality control, mapping and variant-calling based on GATK best-practices pipeline13 (Online Supplementary Figure S1A, B). Variant calls were filtered to maintain read depth (DP)>10 over the alternate allele. Variants were initially filtered for DP and analyzed for coverage across regions of interest. Subsequent filtering for genotype quality (GQ) and a quality score of “PASS” were included (Online Supplementary Figure S1B).
Variant allele frequencies (VAF), representing the percentage of sequencing reads matching a specific DNA variant, were used as a surrogate measure of allele proportion. A VAF<0.3 indicated acquired somatic variants, while VAF≥0.3 indicated likely germline or de novo variants.14 CHIP is further defined as a somatic mutation in peripheral blood leukocytes with a VAF>0.02.15
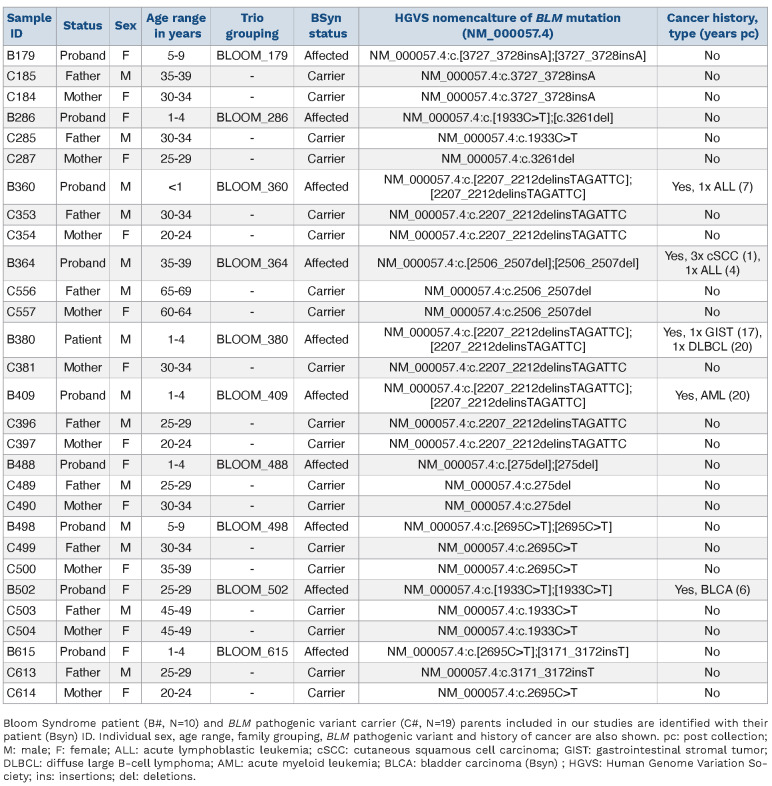
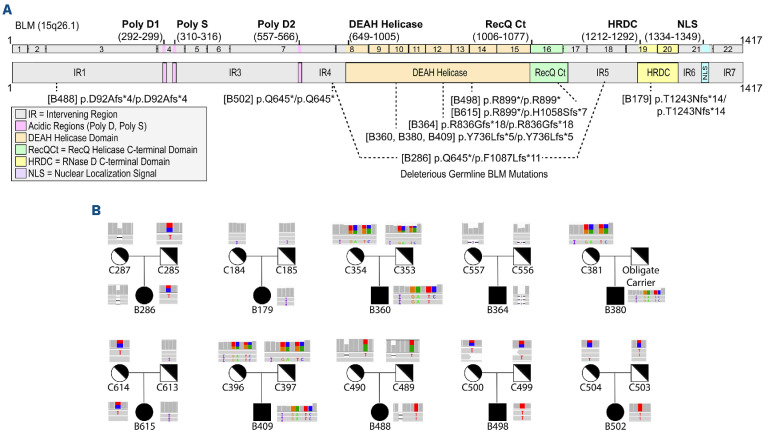
We performed exome sequencing on 29 peripheral blood DNA samples obtained from the BSR. The cohort consisted of ten BSyn probands and their biological parents who are obligate carriers of PV in BLM (Table 1). Among the ten BSyn probands, there were equal numbers of males and females, ranging from 10 months to 36 years of age at time of sample collection. Five of the BSyn probands had a history post-collection of at least one type of cancer (Table 1). None of the patients had been diagnosed with a hematologic malignancy at time of collection. The BLM PV spanned amino acid 25 to 1,243, with most variants clustered in the DEAH helicase and RecQ helicase C-terminal domains (Figure 1A). Visual inspection of BLM variants confirmed family structure (Figure 1B).
No significant difference in mean number of total reads was identified between BSyn and control trio samples (Online Supplementary Figure S1C; t test, P=0.268). After mapping to exome targets, BSyn trio samples had a mean coverage of 113.1x compared to controls with 106.5x coverage (Online Supplementary Figure S1D; t test, P=0.018). This coverage consistency extended across all chromosomes (Online Supplementary Figure S1E).
Samples were categorized into four groups: BSyn proband samples (N=10) designated as “affected”, BLM variant carrier samples as “carrier” (N=19), and control proband (N=19) and control parents (N=38) as “unaffected.” In our somatic variant analysis, we separately considered control parent and control children as age-matched controls to assess the frequency of CHIP in relation to age.
Table 1.
Bloom syndrome patient and BLM pathogenic variant carrier demographics.
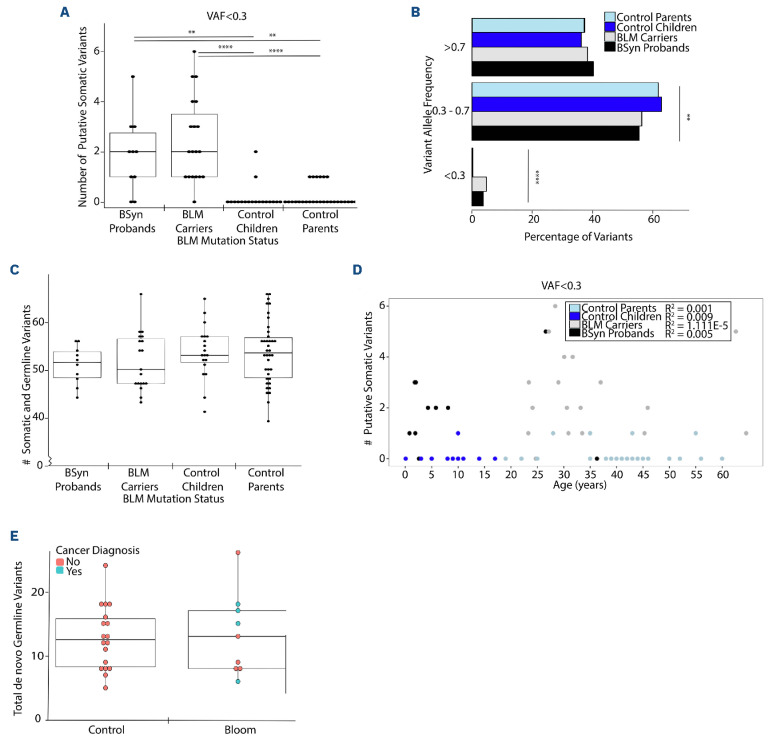
We explored multiple DP cut-offs for loci in CHIP genes (data not shown), and at DP required to identify high quality, low frequency variants, we found that BSyn probands and BLM variant carriers had statistically significantly more low frequency, putative somatic variants (0.02<, VAF<0.3) in CHIP genes with a median of 2, compared to control cohorts where no somatic CHIP gene variants were detected (median =0) (Kruskal Wallis, P=1.50E-06 to 6.37E-03) (Figure 2A). We further categorized variants in CHIP genes into putative somatic or germline based on VAF (Figure 2B). Consistently, significant differences were observed across all likely somatic variant comparisons between BSyn groups (model mean =3.70-4.80%) and control groups (model mean =0.30%) (P=1.41E-06 to 1.60E-03). No significant differences were found in the mean proportion of germline and somatic variants between BSyn probands and BLM carriers (P=0.447), nor between control probands and control parents (P=0.991) (Figure 2B).
Our analysis identified no significant correlations between mean somatic and germline variants in CHIP genes and the putative somatic subset (Online Supplementary Figure S2A). Across the four sample groups, we identified no significant difference between mean somatic and germline number of variants in CHIP genes (Figure 2C). There were no significant differences identified using mean proportion comparison models in somatic (VAF<0.3) CHIP variant analysis when comparing the type of variant (Online Supplementary Figure S2B; Refseq Genes 110, NCBI), pathogenicity (Online Supplementary Figure S2C, ClinVar 2023-01-05, NCBI), or CHIP genes to which these variants mapped (Online Supplementary Figure S2D; Refseq Genes 110, NCBI).
One-way ANOVA with random family effect confirmed that all variants (no VAF cutoff) in CHIP genes followed a normal distribution (Online Supplementary Figure S3A). No significant differences were observed in the type of variant (Online Supplementary Figure S3B) or pathogenicity (Online Supplementary Figure S3C). Breakdown of these variants across all 56 established CHIP genes identified in literature was plotted using a heatmap based on gene of variation (y axis) and by sample (x axis) using hierarchical clustering (Online Supplementary Figure S3D). The heatmap depicts the distribution of all CHIP variants regardless of VAF identified in the samples, with each row representing a CHIP gene and each column representing a sample. Despite the hierarchical clustering, there are no discernible relationships between the sample cohort and the genes where variants were identified, suggesting a heterogeneous pattern of CHIP gene variants across the samples.
Figure 1.
Genomic analysis of BLM pathogenic variants in Bloom syndrome patients and carriers. (A) Schematic representation of the BLM transcript (ENST00000355112.8) and protein (GenBank: BLM; NM000057.4; GRCh38), its functional domains (solid lines above transcript), and pathogenic variants (dotted lines below transcript) causing Bloom syndrome (BSyn). Variants listed correspond to BSyn probands and are tagged with patient identifiers (B#, see Table 1). Deleterious biallelic pathogenic variants are shown with 1 dotted line, while compound heterozygous pathogenic variants are shown with 2 dotted lines. (B) Variants in each BSyn proband (B#) and BSyn carrier (C#) verified in Integrative Genomic Viewer v.2.9.4. Each IGV screenshot shows coverage at the BLM variant at the top and the first 2 to 3 sequencing reads below with reference bases in grey and genetic variants in color. Histograms represent the coverage around the Bsyn variants at that site. Each trio relationship is depicted.
Figure 2.
Somatic CHIP gene variants and de novo Bloom syndrome probands and carriers. Bloom Syndrome (BSyn) probands (N=10, black), BSyn carrier parents (N=19, grey), control children (N=19, light blue) and control parents (N=38, dark blue). (A) Number of putative somatic clonal hematopoiesis of indeterminate potential (CHIP) variants using a variant allele frequency (VAF) cutoff <0.3. (B) Mean proportions shown for CHIP gene variants subsetted based on VAF grouping. (C) Total number of germline and somatic CHIP gene variants. (D) Effect of age on number of putative somatic variants in CHIP genes. Linear regression analysis performed separately for each cohort and R2 values indicate goodness of fit for each model: R2=0.005 (BSyn proband), R2=1.111E-05 (carrier), R2=0.009 (control child), R2=0.001 (control parent). (E) Number of germline de novo variants (VAF.0.3) for each sample. t test, not significant or no stars denote P>0.05, *P.0.05, **P<0.01, ***P<0.001, ****P<0.0001.
We also explored the influence of age on the number of putative somatic variants in CHIP genes in each cohort (Figure 2D). Linear regression analysis identified very weak linear relationships between age and the frequency of putative somatic CHIP variants at VAF<0.3 in our cohorts (R2=1.111E-05 to 0.009). Lastly, we assessed whether BLM PV affect germline de novo rates. Proband B380 was excluded from this analysis as sequencing from only one parent was available. High quality coding variants in probands of each trio (N=9; Online Supplementary Figure S3E) that were not inherited from either parent were identified, representing de novo variants (DNV, VAF≥0.3). No significant difference in total de novo germline variants was found between BSyn and control cohorts, regardless of cancer diagnosis (Figure 2E). This study addresses the impact of BLM PV on the incidence of de novo variants and somatic variants. Our findings reveal an increased frequency of low frequency, putatively somatic variants in CHIP genes in BSyn probands and BLM carriers, compared to sex- and age-matched controls.
An oral presentation at the American Society of Hematology 2023 meeting identified BLM as one of 18 clonal hematopoiesis genes associated with hematopoietic malignancy in the heterozygous state,12 consistent with our CHIP findings. These variants were predominantly synonymous variants in BSyn probands and splice variants in BLM carriers. In contrast to prior studies on clonal hematopoiesis, which have identified somatic variants most frequently in DNMT3A, ASXL1, and TET2,9 we identified mainly synonymous and benign splice variants primarily in NOTCH1 and CUX1.
The absence of significant differences in mean somatic and germline variants between BSyn probands and BLM carriers suggests other factors besides BLM mutations, such as environmental exposures or other genetic modifiers, may influence mutation patterns. Limitations of our study include small sample size, use of two different exome enrichment methods, and use of exome sequencing to detect ultra-low-frequency clones. Future studies using deep-amplicon sequencing of longitudinal samples could validate these findings.
Our study contributes to the growing literature on increased somatic mutation rate and cancer risk in carriers for genes important in maintaining genomic integrity. These findings may pave the way for early biomarkers in cancer detection and general health assessment in rare disease patients and carriers. Larger-scale studies with BSyn cohorts are imperative to unravel the mechanisms underpinning BLM PV and their contribution to CHIP and cancer risk.
Supplementary Material
Acknowledgments
We thank the UCLA Technology for Genomics and Bioinformatics for their sequencing expertise, and Dr. Jeff Gornbein from the UCLA Statistics Department for his expertise and aid in statistical analyses. We would like to acknowledge the families and patients who participated in this study and donated their time and efforts to make this possible.
Funding Statement
Funding: This work was supported by the following funding sources awarded to VAA: NIH DP5OD024579 and the ASXL Research Related Endowment Pilot Grant (2020-2022), IL: NIH T32 GM008042 and VYC: NIH 1K08HL138305. CC and NK received support from The New York Community Trust.
Data-sharing statement
Data available on request to corresponding author.
References
- 1.Cunniff C, Bassetti JA, Ellis NA. Bloom’s syndrome: clinical spectrum, molecular pathogenesis, and cancer predisposition. Mol Syndromol. 2017;8(1):4-23. [DOI] [PMC free article] [PubMed] [Google Scholar]
- 2.Landrum MJ, Lee JM, Riley GR, et al. ClinVar: public archive of relationships among sequence variation and human phenotype. Nucleic Acids Res. 2014;42(database issue):D980-9855. [DOI] [PMC free article] [PubMed] [Google Scholar]
- 3.Sugrañes TA, Flanagan M, Thomas C, Chang VY, Walsh M, Cunniff C. Age of first cancer diagnosis and survival in Bloom syndrome. Genet Med. 2022;24(7):1476-1484. [DOI] [PubMed] [Google Scholar]
- 4.Laitman Y, Boker-Keinan L, Berkenstadt M, et al. The risk for developing cancer in Israeli ATM, BLM, and FANCC heterozygous mutation carriers. Cancer Genet. 2016;209(3):70-74. [DOI] [PubMed] [Google Scholar]
- 5.Bogdanova N, Togo AV, Ratajska M, et al. Prevalence of the BLM nonsense mutation, p.Q548X, in ovarian cancer patients from Central and Eastern Europe. Fam Cancer. 2015;14(1):145-149. [DOI] [PubMed] [Google Scholar]
- 6.de Voer RM, Hahn M-M, Mensenkamp AR, et al. Deleterious germline BLM mutations and the risk for early-onset colorectal cancer. Sci Rep. 2015;5:14060. [DOI] [PMC free article] [PubMed] [Google Scholar]
- 7.Thompson ER, Doyle MA, Ryland GL, et al. Exome sequencing identifies rare deleterious mutations in DNA repair genes FANCC and BLM as potential breast cancer susceptibility alleles. PLoS Genet. 2012;8(9):e1002894. [DOI] [PMC free article] [PubMed] [Google Scholar]
- 8.Bononi A, Goto K, Ak G, et al. Heterozygous germline BLM mutations increase susceptibility to asbestos and mesothelioma. Proc Natl Acad Sci U S A. 2020;117(52):33466-33473. [DOI] [PMC free article] [PubMed] [Google Scholar]
- 9.Jaiswal S, Fontanillas P, Flannick J, et al. Age-related clonal hematopoiesis associated with adverse outcomes. N Engl J Med. 2014;371(26):2488-2498. [DOI] [PMC free article] [PubMed] [Google Scholar]
- 10.Bick AG, Weinstock JS, Nandakumar SK, et al. Inherited causes of clonal haematopoiesis in 97,691 whole genomes. Nature. 2020;586(7831):763-768. [DOI] [PMC free article] [PubMed] [Google Scholar]
- 11.Schratz KE, Haley L, Danoff SK, et al. Cancer spectrum and outcomes in the Mendelian short telomere syndromes. Blood. 2020;135(22):1946-1956. [DOI] [PMC free article] [PubMed] [Google Scholar]
- 12.Liu J, Tran D, Chan ICC, et al. Genetic determinants of clonal hematopoiesis and progression to hematologic malignancies in 479,117 individuals. Blood. 2023;142(Suppl 1):811. [Google Scholar]
- 13.McKenna A, Hanna M, Banks E, et al. The genome analysis toolkit: a MapReduce framework for analyzing next-generation DNA sequencing data. Genome Res. 2010;20(9):1297-1303. [DOI] [PMC free article] [PubMed] [Google Scholar]
- 14.Coffee B, Cox HC, Bernhisel R, et al. A substantial proportion of apparently heterozygous TP53 pathogenic variants detected with a next-generation sequencing hereditary pan-cancer panel are acquired somatically. Hum Mutat. 2020;41(1):203-211. [DOI] [PMC free article] [PubMed] [Google Scholar]
- 15.Steensma DP, Bejar R, Jaiswal S, et al. Clonal hematopoiesis of indeterminate potential and its distinction from myelodysplastic syndromes. Blood. 2015;126(1):9-16. [DOI] [PMC free article] [PubMed] [Google Scholar]
Associated Data
This section collects any data citations, data availability statements, or supplementary materials included in this article.
Supplementary Materials
Data Availability Statement
Data available on request to corresponding author.


