

Abstract
• PURPOSE:
To determine if a family history of age-related macular degeneration (AMD) and genetic variants identify eyes at higher risk for progression to advanced AMD (AAMD), after controlling for baseline demographics, behavioral factors, and macular status.
• DESIGN:
Prospective, longitudinal cohort study.
• METHODS:
Eyes were classified using the Age-Related Eye Disease Study severity scale. Non-genetic and genetic predictors for progression to AAMD, geographic atrophy, and neovascular disease were evaluated. Cox proportional hazards models using the eye as the unit of analysis were used to calculate hazard ratios (HRs), accounting for correlated data. Discrimination between progressing and non-progressing eyes was assessed using C-statistics and net reclassification improvement (NRI).
• RESULTS:
Among 4910 eyes, 863 progressed to AAMD over 12 years. Baseline AMD severity scale and status of the fellow eye were important predictors; genes provided additional discrimination. A family history of AMD also independently predicted progression after accounting for genetic and other covariates: 1 family member versus none (HR 1.21 [95% confidence interval {CI} 1.02-1.43]; P = 0.03); ≥2 family members versus none (HR 1.55 [95% CI 1.26-1.90]; P < 0.001). A composite risk score calculated using β estimates of both non-genetic and significant genetic factors predicted progression to AAMD (HR 5.57; 90th vs 10th percentile; area under the receiver operating characteristic curve [AUC] = 0.92), providing superior fit compared with other models, including one with only ocular variables (NRI = 0.34; P < 0.001; AUC = 0.87, ΔAUC 0.05 ± 0.005; P < 0.001).
• CONCLUSION:
Genetic variants and family history provided additional discrimination for predicting progression to AAMD, after accounting for baseline macular status and other covariates.
The prevalence of age-related macular degeneration (AMD), a progressive neurodegenerative disease affecting the central part of the retina, is growing as the proportion of elderly individuals is growing worldwide.1,2 The visual impact associated with early and intermediate stages of AMD can be mild, but some individuals progress to advanced stages of the disease with geographic atrophy (GA) or neovascular disease (NV), which are major events causing visual impairment and reduced quality of life. Identifying subtypes of early disease that pose a higher risk of progression over time to the vision-threatening forms of AMD, could lead to earlier intervention, more frequent monitoring, and reduced burden of visual loss caused by AMD.3 A set of characteristics that discriminates high versus low risk of progression among patients with similar macular pathology at baseline could also facilitate selection of subjects for clinical trials and specific treatments. Personalized decision making will become increasingly more important as new treatments are coming to market and others are under investigation.
Previous models assessing the likelihood of having AMD or progressing to AAMD included a variety of parameters, starting with only a few known AMD genes4 followed by models that included an increasing number of demographic, baseline ocular, behavioral and genetic factors in several biologic pathways.5-16 None to date have assessed the impact of adding family history of AMD along with a range of genetic predictors, among eyes with similar phenotypic characteristics and fellow eye status assessed using the AMD severity scale.17 This is important to determine if there is more information that can be derived about the risk of progression in eyes that have not yet developed late AMD, beyond observing macular signs on clinical examination. In this study, we expand upon previous work and determine the independent contributions of family history of AMD and polygenic susceptibility to risk of progression to Advanced AMD (AAMD), GA, and NV, adjusting for baseline AMD severity and other covariates.
We demonstrate that a composite risk score that includes family history, non-genetic factors, and the most predictive genetic variants can separate high and low risk of progression among eyes with the same baseline AMD severity group.
METHODS
• STUDY POPULATION:
Data from the Age-Related Eye Disease Study (AREDS), a multicenter randomized clinical trial, were used in analyses to develop the models.18 Informed consent was obtained from participants. Research adhered to the tenets of the Declaration of Helsinki and was performed under approved institutional review board protocols. This trial was registered at clinicaltrials.gov as NCT00594672. Information about demographic factors (age, sex, race, education), lifestyle factors (body mass index [BMI], smoking, multivitamin intake) and family history of AMD were obtained from questionnaires. Assignment to one of the active AREDS treatment groups or the placebo group was also included. Macular characteristics and status of fellow eyes were determined from grading of color photographs.17 Genetic variables were derived from our previous genotyping and sequencing analyses.2,4,8,11,19-22
• STATISTICAL ANALYSES:
Demographic and behavioral variables considered as potential covariates in analyses of incident AAMD were age (55-64, 65-74, or ≥75 years), sex, race (white, non-white), education (high school or less, more than high school), BMI (<25, 25-29, or ≥30 kg/m2 ), smoking status (never, past, current), AREDS treatment group (either placebo or one of the active treatment groups: zinc, antioxidants, and antioxidants plus zinc), and use of multivitamins. Ocular variables were AMD severity group (described below) and status of the fellow eye at baseline. Family history of AMD and 31 genetic variants confirmed by genotyping or sequencing were also considered.2,4,8,11,20-26
All statistical analyses were performed using SAS software (version 9.4). Characteristics of eyes that progressed versus eyes that did not progress were compared using univariate analyses based on the SAS PROC PHREG procedure with the eye as the unit of analysis, adjusting for age and baseline AMD severity group. Progression in an eye was defined as transition from no AMD or early or intermediate AMD to AAMD at 2 consecutive visits 6 months apart.14 A similar definition was used for GA and NV, except that eyes that progressed to NV were no longer considered at risk for GA.
We used the Cox proportional hazards model and calculated hazard ratios (HRs) with the eye as the unit of analysis to assess progression to advanced AMD. Four models were assessed:
Model 1 included (a) demographic and lifestyle factors including age, race, smoking, BMI, AREDS treatment group and multivitamin intake; (b) baseline severity scales 1-8 defined based on drusen area and size, and increased pigment or depigmentation17 separately by eye, and grouped into 3 categories as group 1: low risk (scale 1), group 2: medium risk (scales 2-4), and group 3: high risk (scales 5-8); (c) baseline AMD status of the fellow eye categorized as advanced or non-advanced and (d) family history of AMD classified according to the number of parents, siblings, or cousins with AMD, categorized as 0 (for none or unsure), 1, or ≥2.
Model 2 included all variables in Model 1 plus the 2 genetic variants CFH Y402H (rs1061170) and ARMS2/HTRA1 (rs10490924) available in some commercially available genetic ancestry tests.
Model 3 included all variables in Model 2 plus genetic variants that were significantly related to progression in a stepwise regression model after forcing in the variables in model 2 with P = 0.05 to enter and remove genetic variables from the model. A composite risk score was calculated as a sum of β coefficients for non-genetic variables and β coefficients multiplied by the number of minor alleles present for each significant genetic variant.
Model 4 included all non-genetic variables from Model 1 plus 31 genetic variants related to the prevalence of AMD. The polygenic risk score (PRS) was derived based on the 31 genetic variables.
We used the SAS PROC PHREG procedure with the aggregate option using the eye as the unit of analysis to control for inter-eye correlation. Time since baseline (quantified by the visit number) was used as the time scale for this analysis. An eye was censored either because of loss to follow-up, death, or progression to NV. We computed survival curves for progression to AAMD according to family history and PRS tertile (based on Model 4) for high-risk eyes at baseline (severity scales 5-8), adjusting for all other covariates.
We computed the area under the receiver operating characteristic curve (AUC) and the AUCs of different models using previously published methods.13,14 Because differences in AUC can be small, we also compared competing models using the net reclassification improvement (NRI) measure.13,14,27 Using this measure, 5-year risk of progression was grouped into 5 categories as defined previously14: 1) very low (<1%); 2) low (1% - <10%); 3) medium (10% - <30%); 4) high (30% - <50%); and 5) very high risk (≥50%), and each eye was cross-classified according to their risk category in 2 different models.
Cumulative incidence of progression to AAMD at 2, 5, and 10 years after baseline, based on the composite risk score in Model 3, was calculated for a representative sample of 24 eyes, and analyses were adjusted for competing mortality risks using previously published methods.13,14 Two-sided tests were used and the alpha level for statistical significance was set a priori at P < 0.05.
RESULTS
There were 2672 subjects and 4910 eyes in the analyses: 863 eyes progressed to AAMD (among 654 subjects), of which 439 eyes progressed to GA (from 339 subjects) and 456 eyes progressed to NV (from 389 subjects). Some eyes first progressed to GA and subsequently progressed to NV (n = 39 eyes). There were 7 eyes that progressed to GA and then progressed to NV at a subsequent visit and therefore met the criteria for progression to AAMD but not for GA or NV (which requires 2 consecutive visits with the same outcome). The mean age at baseline was 68.8 (± 4.9) years with a range of 55 to 81 years. Subjects were followed up to 12 years (median 11 years, IQR 10-11 years).
Characteristics of progressing and non-progressing eyes are shown in Supplemental Table 1. In univariate analyses, progressing eyes occurred in individuals who were older, Caucasian, had a lower level of education, a higher BMI, and who smoked. No difference was seen according to sex. Progressing eyes were much more likely to be in AMD severity group 3 and less likely to be from severity group 1 than non-progressing eyes. There was a strong association between fellow eye status and progression: 29% of progressing eyes and 5% of non-progressing eyes had a fellow eye that had AAMD at baseline. They were also more likely to have ≥1 family members with a history of AMD. Many genes were associated with a higher risk of AMD progression in univariate analyses: CFH Y402H, the common C3 variant R102G, the rare C3 variant K155Q, and ARMS2/HTRA1. Smaller effects were seen for NPLOC4/TSPAN10 and HSPH1/B3GALTL. Protective effects were seen for CFH rs1410996, CFB R32Q, CTRB1, TIMP3, and RAD51B. A smaller protective effect was seen for C2 E318D.
• FACTORS INDEPENDENTLY ASSOCIATED WITH PROGRESSION TO AAMD, GA AND NV:
Table 1 shows multivariate results for factors related to progression to AAMD over 12 years for 4 models with different covariates.
TABLE 1.
Multivariate Cox Regression Analyses Identifying Predictors for Incident Advanced Age-Related Macular Degeneration Over 12 Years of Follow-Up (863 Progressing Eyes, 4910 Eyes)
| Variables | Model 1 HR (95% CI); P Value |
Model 2 HR (95% CI); P Value |
Model 3a HR (95% CI); P Value |
Model 4b HR (95% CI); P Value |
|---|---|---|---|---|
| Demographic variables | ||||
| Age (y) | ||||
| 55-64 (ref) | 1.00 | 1.00 | 1.00 | 1.00 |
| 65-<75 | 1.58 (1.30-1.92); <0.001 | 1.62 (1.33-1.97); <0.001 | 1.67 (1.37-2.04); <0.001 | 1.60 (1.28-2.00); <0.001 |
| ≥75 | 1.92 (1.53-2.41); <0.001 | 1.98 (1.58-2.48); <0.001 | 2.07 (1.65-2.61); <0.001 | 1.94 (1.50-2.51); <0.001 |
| Race: white vs nonwhite | 2.31 (1.21-4.41); 0.012 | 2.11 (1.09-4.07); 0.027 | 1.77 (0.89-3.50); 0.10 | 2.35 (1.13-4.87); 0.022 |
| Behavioral variables | ||||
| BMI (kg/m2) | ||||
| <25 (ref) | 1.00 | 1.00 | 1.00 | 1.00 |
| 25-29 | 1.21 (1.01-1.46); 0.038 | 1.21 (1.03-1.45); 0.047 | 1.26 (1.07-1.48); 0.006 | 1.23 (1.02-1.47); 0.029 |
| ≥30 | 1.32 (1.07-1.61); 0.008 | 1.31 (1.09-1.57); 0.004 | 1.33 (1.08-1.60); 0.002 | 1.34 (1.09-1.64); 0.005 |
| Smoking Status | ||||
| Never smoker (ref) | 1.00 | 1.00 | 1.00 | 1.00 |
| Current smoker | 2.06 (1.54-2.75); <0.001 | 2.04 (1.56-2.66); <0.001 | 1.98 (1.51-2.60); <0.001 | 2.03 (1.51-2.74); <0.001 |
| Past smoker | 1.15 (1.00-1.33); 0.089 | 1.13 (0.98-1.30); 0.10 | 1.14 (0.98-1.32); 0.07 | 1.16 (0.99-1.36); 0.075 |
| AREDS treatment group | ||||
| Activec vs placebo | 0.94 (0.80-1.14); 0.62 | 0.93 (0.78-1.12); 0.45 | 0.96 (0.82-1.13); 0.61 | 0.97 (0.81-1.16); 0.73 |
| Multivitamin intake at baseline | ||||
| Yes vs no | 0.94 (0.81-1.09); 0.43 | 0.96 (0.84-1.09); 0.52 | 0.93 (0.81-1.06); 0.26 | 0.94 (0.81-1.09); 0.43 |
| Ocular variables | ||||
| Baseline AMD severity group | ||||
| 1, low risk (ref) | 1.00 | 1.00 | 1.00 | 1.00 |
| 2, medium risk | 9.77 (5.91-16.16); <0.001 | 9.27 (6.19-13.87); < 0.001 | 8.98 (5.42-14.87); < 0.001 | 9.68 (5.86-15.99); < 0.001 |
| 3, high risk | 70.05 (42.79-114.69); < 0.001 | 59.67 (45.69-77.93); < 0.001 | 54.66 (33.08-90.33); < 0.001 | 65.45 (39.87-107.45); < 0.001 |
| Fellow eye status at baseline | ||||
| Advanced vs non-advanced | 2.50 (2.10-2.97); <0.001 | 2.35 (2.00-2.80); <0.001 | 2.34 (1.97-2.79); <0.001 | 2.45 (2.06-2.90); <0.001 |
| Family history of AMD | ||||
| No family history (ref) | 1.00 | 1.00 | 1.00 | 1.00 |
| 1 family member | 1.34 (1.12-1.57); 0.002 | 1.22 (1.04-1.44); 0.032 | 1.21 (1.02-1.43); 0.03 | 1.30 (1.08-1.55); 0.005 |
| ≥2 family members | 1.68 (1.36-2.08); <0.001 | 1.51 (1.21-1.88); <0.001 | 1.55 (1.26-1.90); <0.001 | 1.62 (1.31-2.00); <0.001 |
| Genetic variants d | All genetic variants (Supplemental Table 1) | |||
| Complement pathway | ||||
| CFH Y402H: rs1061170 | 1.19 (1.08-1.30); <0.001 | 1.02 (0.90-1.14); 0.81 | ||
| CFH: rs1410996 | 0.72 (0.61-0.84); <0.001 | |||
| CFH R1210C: rs121913059 | 2.19 (1.13-4.26); 0.02 | |||
| C3 R102G: rs2230199 | 1.18 (1.06-1.33); 0.002 | |||
| C3 K155Q: rs147859257 | 2.07 (1.47-2.91); <0.001 | |||
| Angiogenesis pathway | ||||
| TGFBR1: rs334353 | 0.86 (0.77-0.97); 0.01 | |||
| Lipid pathway | ||||
| ABCA1: rs1883025 | 1.16 (1.04-1.30); <0.001 | |||
| Immune/inflammatory pathway | ||||
| ARMS2/HTRA1: rs10490924 | 1.40 (1.26-1.54); <0.001 | 1.36 (1.21-1.52); <0.001 | ||
| SLC16A8: rs8135665 | 1.13 (1.01-1.27); 0.04 | |||
| Extracellular matrix | ||||
| TIMP3: rs9621532 | 0.72 (0.56-0.94); 0.02 | |||
| DNA repair/protein binding | ||||
| RAD51B: rs8017304 | 0.83 (0.75-0.92); <0.001 | |||
| HSPH1/B3GALTL: rs9542236 | 1.18 (1.07-1.30); <0.001 | |||
| Composite risk score d | ||||
| Composite risk score_tertilee | ||||
| Tertile 1 (Ref) | 1.00 | |||
| Tertile 2 | 2.73 (1.95-3.82); <0.001 | |||
| Tertile 3 | 5.88 (4.27-8.08); <0.001 | |||
| Composite risk score_continuousf | 2.68 (2.39-2.98); <0.001 | |||
| 90th vs 10th percentileg | 5.57 (4.60-6.74) | |||
| PRS h | ||||
| PRS_tertilei | ||||
| Tertile 1 (Ref) | 1.00 | |||
| Tertile 2 | 1.35 (1.08-1.69); 0.008 | |||
| Tertile 3 | 1.62 (1.32-1.98); <0.001 | |||
| PRS_continuousj | 1.31 (1.19-1.44); <0.001 | |||
| 90th vs 10th percentilek | 1.83 (1.48-2.27) |
AAMD = advanced age-related macular degeneration; AMD = age-related macular degeneration; AREDS = Age-Related Eye Disease Study; BMI = body mass index; CI = confidence interval; HR = hazard ratio; PRS = polygenic risk score.
Model 3 including age, race, BMI, smoking status, AREDS treatments group, multivitamin intake, baseline AMD severity group, AMD status of fellow eye, family history of AMD, and genetic variants selected from stepwise regression.
Model 4 including age, race, BMI, smoking status, AREDS treatments group, multivitamin intake, baseline AMD severity group, AMD status of fellow eye, family history of AMD, and 31 genetic variants.
Active group consists of subjects treated by antioxidants only, zinc only, or a combination of antioxidants and zinc.
Estimates for genetic variants are per allele.
Composite risk score based on all variables in Model 3 and calculated as the sum of β coefficients for non-genetic variables and β multiplied by the number of minor alleles present for each genetic variant.
Composite risk score_ter t iles: tert ile 1: ≤2.90; tertile 2: 2.91-3.43; tertile 3: ≥3.44.
Composite risk score continuous: mean = 3.2 (standard deviation = 0.69), range 0.72-5.95, HR shown per 1-unit increase (90th percentile = +4.12; 10th percentile = +2.38).
Adjusting for all variables in Model 4 and calculated as the sum of β coefficients multiplied by the number of minor alleles present for each genetic variant.
PRS_tertiles: tertiles in Model 4. Tertile 1: ≤0.65; tertile 2: 0.66-1.41; tertile 3: ≥1.42.
PRS_continuous: mean = 1.03 (standard deviation = 0.85), range −1.6 to 3.55; HR shown per 1-unit increase.
90th percentile = +2.16; 10th percentile = −0.11.
Non-genetic factors
Older age at baseline was strongly associated with progression in all models. White subjects were at higher risk in all models (HRs 1.7-2.4) compared with non-white patients. Sex and education were not significantly related to progression and therefore were not included in the multivariate analyses. There was a significant positive association for BMI ≥30 kg/m2 versus BMI <25 kg/m2 , with a HR of approximately 1.3 in all models. Current smoking was associated with higher risk and past smoking had a weak nonsignificant trend. Neither multivitamin use nor AREDS supplement intake were associated with progression to overall AAMD adjusting for all covariates. Baseline severity scale group was strongly related to progression in all models. Subjects with 1 eye with AAMD at baseline had more than double the risk of progression compared with having bilateral non-AAMD at baseline. A family history of AMD, especially if ≥2 relatives had AMD, was positively associated with risk of progression in all models.
Genetic factors
In Table 1, Model 2, the genetic variants CFH Y402H and ARMS2/HTRA1 were independently associated with progression to AAMD, controlling for other factors. In Model 3, strong associations were seen for CFH rs1410996, CFH R1210C, C3 K155Q, ARMS2/HTRA1, and RAD51B genetic variants. Variants in TGFBR1, ABCA1, SLC16A8, TIMP3, and HSPH1/B3GALTL had smaller significant associations with progression to AAMD. The CFH Y402H variant was no longer significantly associated with progression to overall AAMD, after adjusting for other CFH variants.
Composite risk scores for AAMD, GA, and NV
The composite risk score, which included 21 predictors (including 12 genetic variants) was significantly associated with progression to AAMD. The HR for the 90th percentile versus the 10th percentile was 5.57 (95% CI 4.60-6.74). For each unit increase in the score, the HR was 2.68 (95% CI 2.39-2.98). For tertile 2 versus tertile 1, the HR was 2.73 (95% CI 1.95-3.82) and for tertile 3 versus tertile 1, the HR was 5.88 (95% CI 4.27-8.08). The composite risk scores were also highly related to progression to GA and NV, with similar effect sizes as seen for AAMD (see Supplemental Appendix). Some major differences between GA and NV were seen: 1) there was a suggestive, nonsignificant protective effect of use of AREDS supplements and multivitamin intake on risk of progression to NV but not GA; 2) having a family history of AMD was more strongly associated with NV compared with GA; 3) there were 11 genetic variants significantly associated with progression to GA and 6 were associated with NV; 4) for progression to GA, variants CFH rs1410996 and C3 K155Q had the strongest effects (both P < 0.001) and for progression to NV, ARMS2/HTRA1 (HR 1.49), CFH Y402H (HR 1.26), and RAD51B (HR 0.75) with P ≤ 0.003 were most highly associated. The AUCs for Model 3 for progression over 5 years were 0.94 for AAMD, 0.94 for GA, and 0.93 for NV. The AUCs over 12 years were 0.92 for AAMD, 0.90 for GA, and 0.88 for NV.
Polygenic risk score
The PRS based on 31 genetic variants (Table 1, Model 4) was associated with progression to AAMD, independent of other risk factors in the model. The HRs for PRS tertile 2 versus 1 (HR 1.4 [95% CI 1.1-1.7]) and tertile 3 versus 1 (HR 1.6 [95% CI 1.3-2.0]) were statistically significantly related to progression even after adjusting for baseline AMD severity group and family history of AMD. The HR for the 90th versus the 10th percentile of PRS was 1.8 (95% CI 1.5-2.3).
• FAMILY HISTORY OF AMD ASSOCIATED WITH AAMD PROGRESSION:
A family history of AMD was independently associated with progression to overall AAMD and progression to GA or NV. Figure 1 shows the association of family history of AMD with progression to AAMD outcomes, adjusting for all demographic, behavioral, and genetic factors in Model 3. Compared with no family history, the HR for progression to AAMD was 1.21 (95% CI 1.02-1.43; P = 0.03) for a history of 1 family member affected with AMD and was 1.55 (95% CI 1.26-1.90; P < 0.001) for a history of ≥2 relatives affected with AMD. Similar results for family history of AMD were seen for GA and NV.
FIGURE 1.
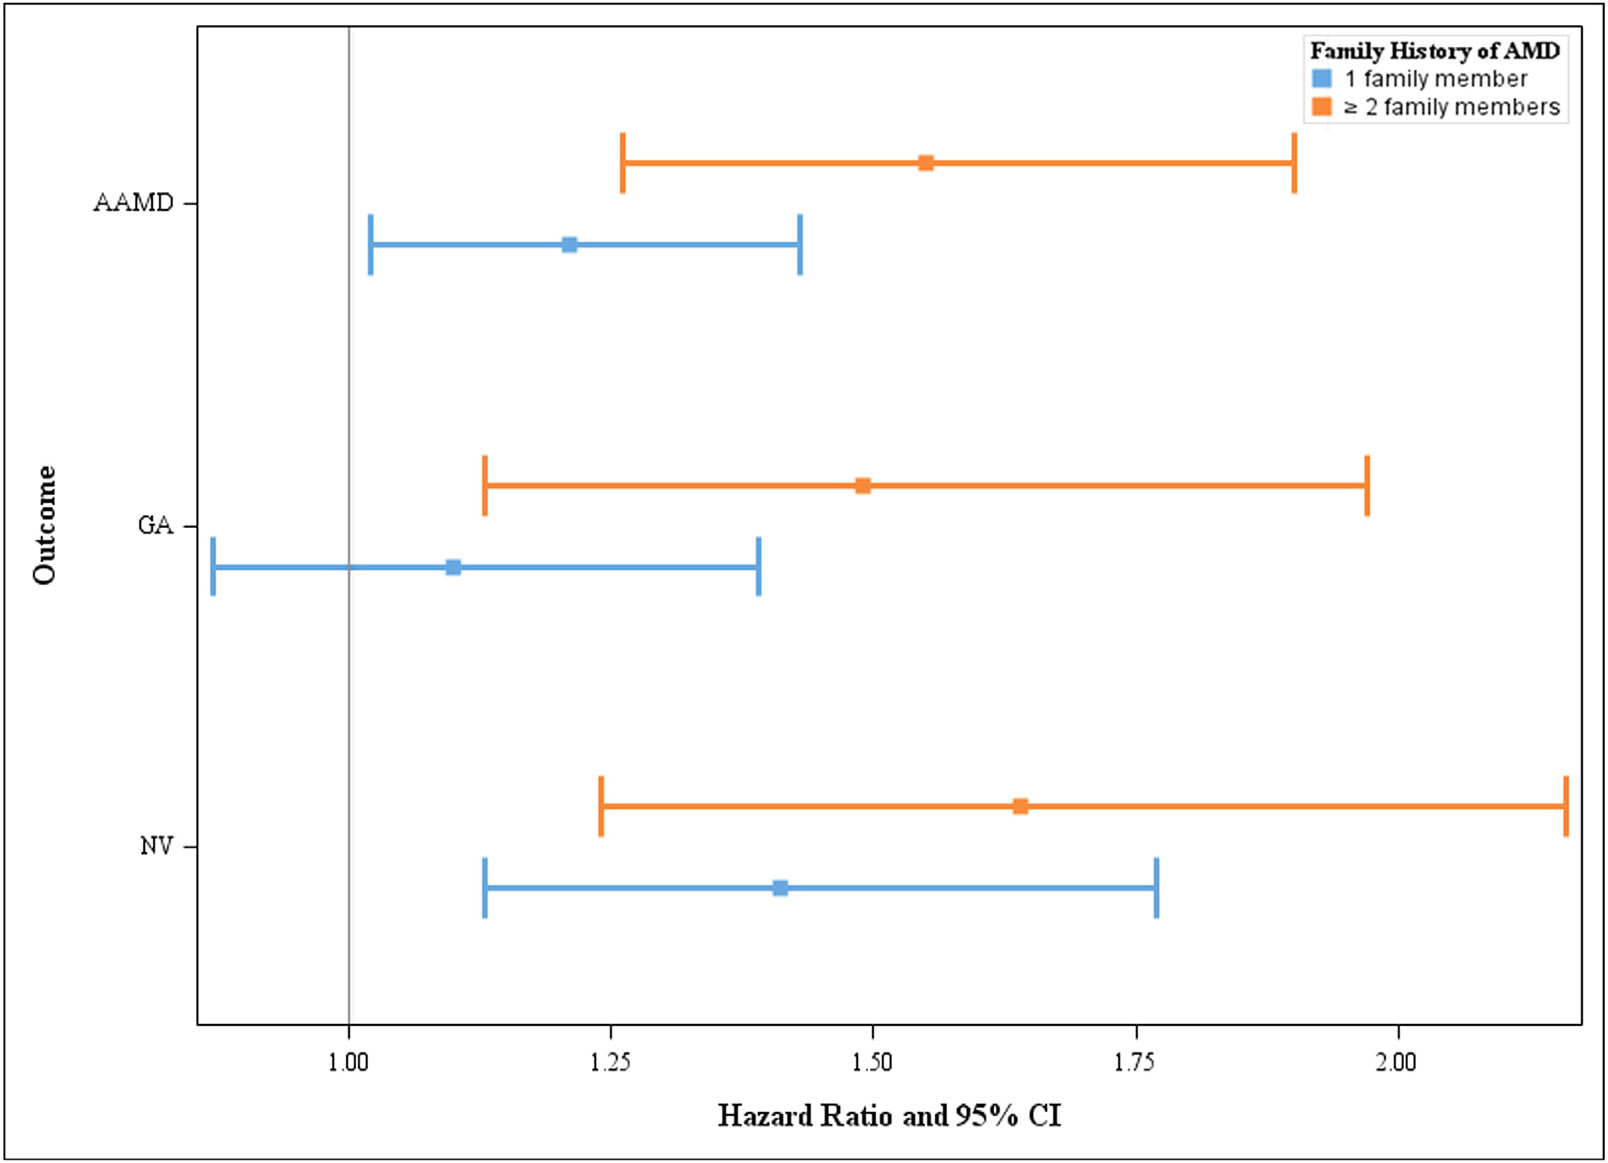
Associations between family history of age-related macular degeneration (AMD) and progression to advanced AMD (AAMD), geographic atrophy (GA), and neovascular (NV). Hazard ratios and 95% confidence intervals (CIs) adjusting for age, race, body mass index, smoking status, Age-Related Eye Disease Study treatment group, multivitamin intake, baseline AMD severity group, AMD status of the fellow eye, family history of AMD, and genetic variants selected from stepwise regression (Model 3).
Figure 2 shows the impact of family history of AMD on estimated 5-year cumulative incidence (absolute risk) of progression to AAMD. We restricted the sample to the high-risk severity group 3 and adjusted for variables in Model 3. This figure shows that 52% of people with ≥2 affected family members have a higher 5-year risk (ie, a ≥30% incidence of progression) compared with 20% of people with no family history.
FIGURE 2.
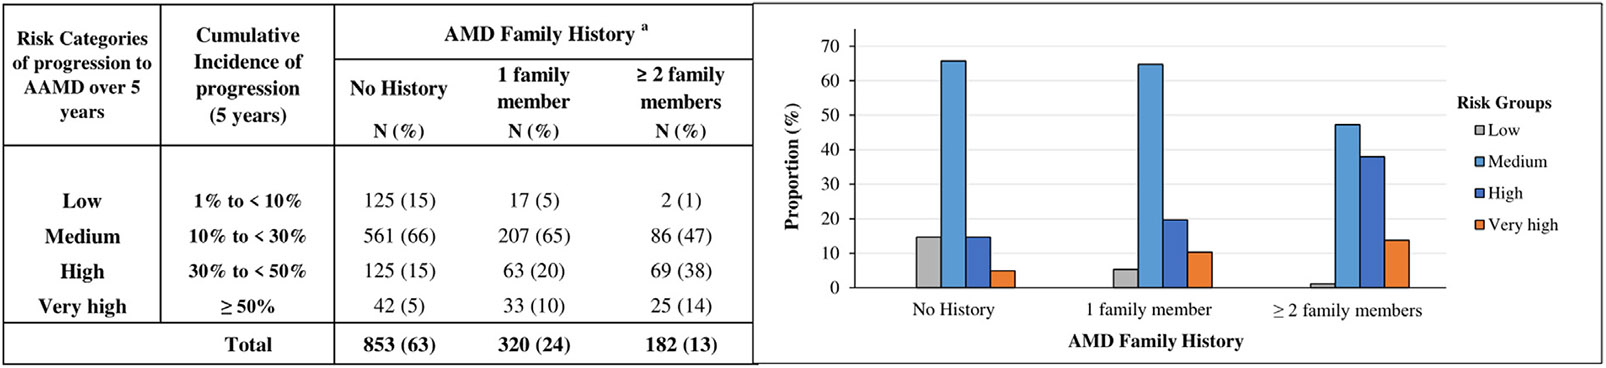
Estimated 5-year cumulative incidence of progression to advanced age-related macular degeneration (AAMD) stratified by family history of AMD among individuals with high-risk non-advanced AMD at baseline, adjusting for age, race, body mass index, smoking status, Age-Related Eye Disease Study treatment group, multivitamin intake, baseline AMD severity group, AMD status of fellow eye, family history of AMD, and genetic variants in the stepwise regression model (Model 3). aProportion of subjects in risk categories according to AMD family history.
Among all subjects, the association between family history and progression persisted even after adjusting for all 31 genetic variants (HR 1.6 [95% CI 1.3-2.0]; Table 1, Model 4). Among eyes with high-risk baseline AMD severity group 3, the impact of family history on progression to AAMD, GA, and NV was further evaluated (Figure 3). Family history was associated with progression within each PRS tertile and for each AMD outcome. In addition, the effect of family history was more apparent with increasing PRS tertile. For eyes with severity group 3 at baseline and PRS tertile 3, the 12-year estimated progression to AAMD ranged from 61% with no affected relatives to 74% for ≥2 affected relatives. In this higher-risk macular and genetic susceptibility subgroup, the 12-year probability of progression for GA ranged from 37% with no affected relatives to 48% for ≥2 affected relatives. Finally for NV, the 12-year rate of progression ranged from 29% for no affected relatives to 40% for ≥ 2 affected relatives. These results suggest that having ≥2 affected relatives was associated with a higher risk of progression to AAMD compared with not having a family history of AMD, even after considering genetic susceptibility.
FIGURE 3.
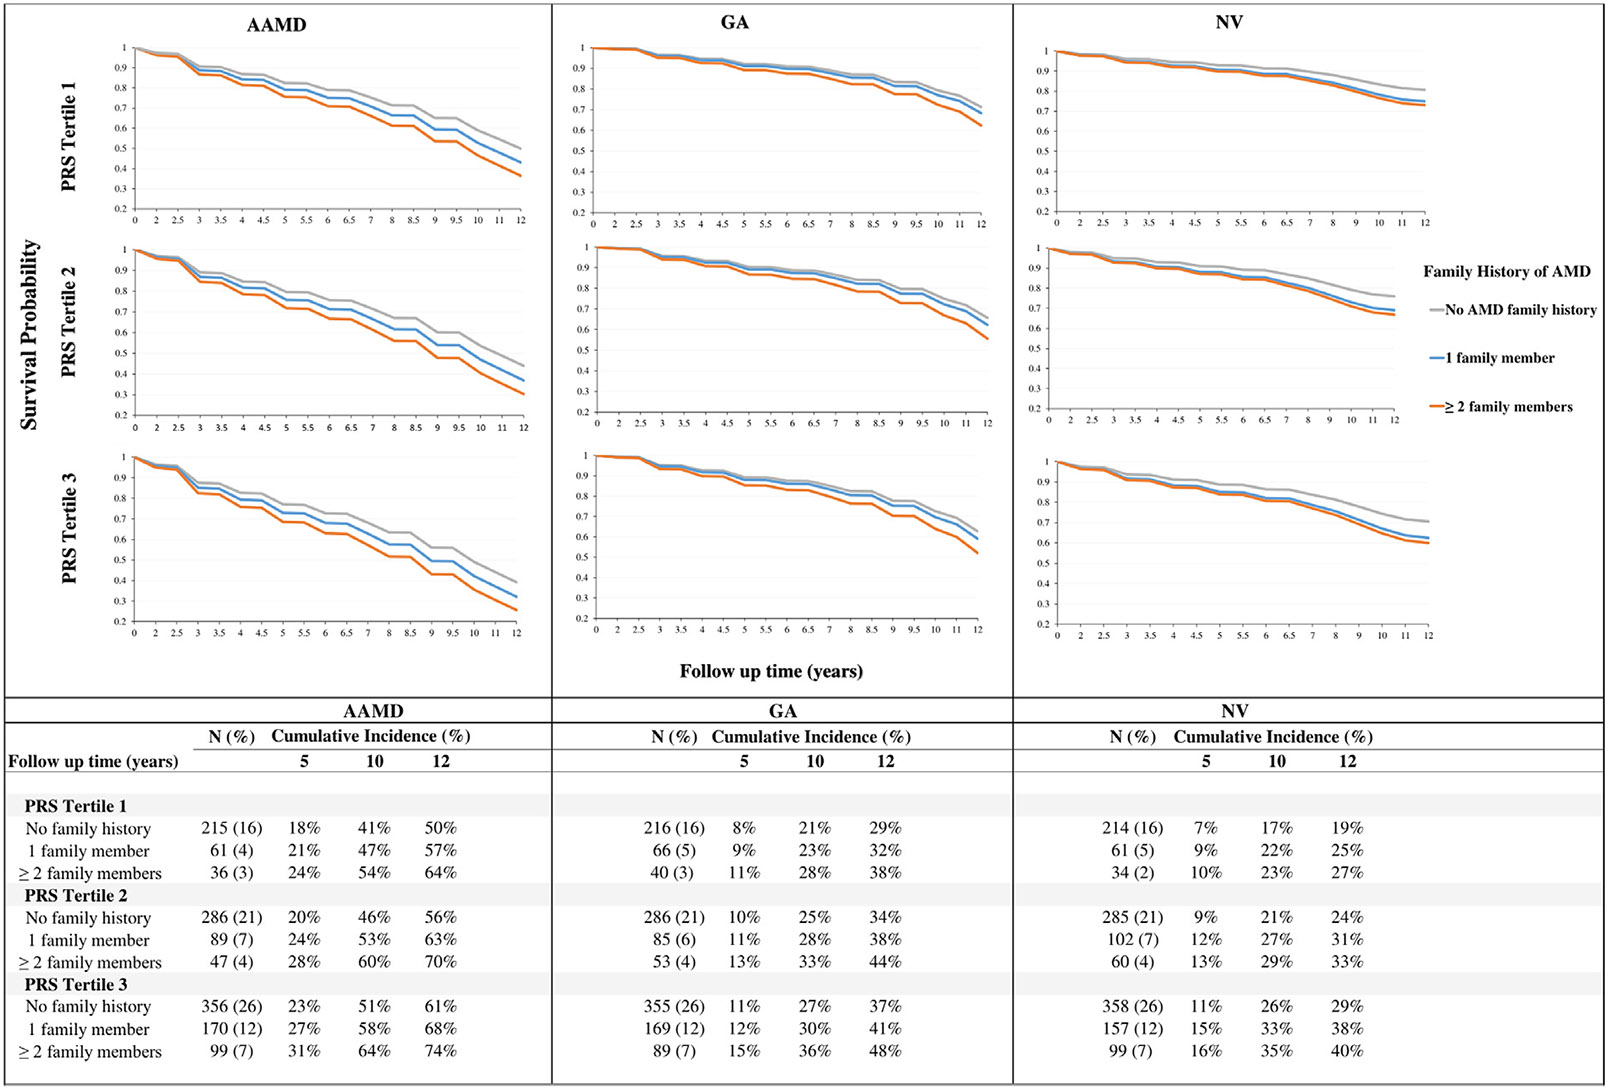
Kaplan-Meier survival curves for probability of not progressing to advanced age-related macular degeneration (AAMD), geographic atrophy (GA), and neovascular (NV) among eyes with high-risk non-AAMD (severity group 3) at baseline stratified by family history of AMD and polygenic risk score (PRS) tertiles. Results based on Model 4 adjusting for age, race, body mass index, smoking status, Age-Related Eye Disease Study treatment group, multivitamin intake, baseline AMD severity group, AMD status of the fellow eye, family history of AMD, and 31 genetic variants.
• COMPARISON OF COMPOSITE RISK SCORE MODEL WITH OTHER MODELS:
Composite risk score versus baseline severity scale
To determine if variables included in the composite risk score were better at predicting progression compared with only baseline AMD severity score group, we performed AUC analyses and compared a model with just severity scale group versus the composite risk model for progression to AAMD. The AUC for a model with only severity scale groups was 0.87 and increased to 0.92 for the composite risk model (ΔAUC 0.05 ± 0.005; P < 0.001) for progression over 12 years. Since the differences in AUC after reaching 0.90 are small, we compared different models using NRI. NRI measures the probability that a random eye would move to a higher category minus the probability that it would move to a lower category in 2 different predictive models. Comparing Model 3 to a model with only macular severity groups for 5-year progression to AAMD (Supplemental Table 2), the NRI for progressing eyes was 0.433 (P < 0.001), and for 12-year progression to AAMD (Supplemental Table 3), the NRI was 0.324 (P < 0.001) indicating that 43.3% and 32.4% of progressing eyes were more appropriately classified for risk of progressing to AAMD after 5 years and 12 years, respectively. For non-progressing eyes, the NRI was significantly greater than 0 at 12 years, but not at 5 years. Results of these analyses suggest that there is better discrimination between progressing and non-progressing eyes to AAMD using the composite risk score. The NRI for progressing eyes was higher for 5-year predictions than 12-year predictions possibly because the risk score included non-genetic variables assessed at baseline.
Composite risk score versus model with no genes
We assessed if there was an increase in risk category for Model 3 with genes versus Model 1 without genes among progressors, and a decrease in risk category among nonprogressors (Supplemental Table 4). The detailed comparison shows 88 of 384 progressing eyes (22.9%) moved to a higher category versus 40 eyes (10.4%) to a lower category in a comparison between Model 3 and Model 1 (NRI = 0.125; P < 0.001). In non-progressing eyes, 246 of 4507 (5.5%) moved to a lower category and 133 (3.0%) moved to a higher category (NRI = 0.025; P < 0.001). Therefore, both progressing eyes and non-progressing eyes were more accurately classified after incorporating genetic susceptibility information compared with a model without genetic information.
Composite risk score versus model with 2 genetic variants
To determine if >2 genes improved risk classification compared with only 2 genes, we also compared model 3 versus model 2 for AAMD (Supplemental Table 5). Results indicate there was additional discrimination provided by the other genes in model 3 compared with Model 2.
Composite risk score versus model with more genetic variants
To determine if incorporating all 31 genes associated with AMD improved risk discrimination compared with genes found to be most predictive based on stepwise regression, we compared Model 4 to Model 3 (Supplemental Table 6). The performance of Model 4 was inferior to Model 3, possibly because of the addition of random noise from the 19 additional genes not identified in the stepwise model and not significantly related to progression to AAMD, which therefore did not improve risk classification. Furthermore, for the genes identified as most predictive of progression in Model 3, the β coefficients showed only minor differences when additional genes in Model 4 were included (data not shown). This supports the higher impact of genes selected using the stepwise model on progression to AAMD outcomes. In summary, the composite risk score from Model 3 provided the best risk classification for both progressing and non-progressing eyes for AAMD among the 4 models. A summary of all NRI analyses is provided in Table 2.
TABLE 2.
Net Reclassification Improvement Analysis Comparing 5-Year Probability of Progression to Advanced Age-Related Macular Degeneration Between Models
| Model A | Model B | Progressing Eyes, n = 384 | Non-progressing Eyes, n = 4047 | All Eyes, N = 4431 | |||
|---|---|---|---|---|---|---|---|
| NRI | P Value | NRI | P Value | Overall NRI | P Value | ||
| Model with severity groups only | Model 3 c | 0.43 | <0.001 | −0.0009 | 0.07 | 0.424 | < 0.001 |
| Model 1a | Model 3 c | 0.125 | <0.001 | 0.025 | < 0.001 | 0.15 | < 0.001 |
| Model 2b | Model 3 c | 0.057 | 0.028 | 0.027 | < 0.001 | 0.084 | 0.001 |
| Model 3 c | Model 4d | −0.052 | 0.039 | −0.029 | < 0.001 | −0.081 | < 0.001 |
AAMD = advanced age-related macular degeneration; AREDS = Age-Related Eye Disease Study; NRI = net reclassification improvement.
NRI is the proportion of progressing/non-progressing eyes whose risk category was higher with model B versus model A minus the proportion of eyes whose risk category was lower with model B compared with model A within 5 years of follow-up. Model 3 performed significantly better compared with other models in appropriately classifying risk of progression to AAMD over 5 years for both progressing and non-progressing eyes.
Model 1 adjusting for age, race, body mass index, smoking status, AREDS treatment group, multivitamin intake, baseline AMD severity group, AMD status of fellow eye, and family history of AMD (non-genetic variables).
Model 2 adjusting for non-genetic variables (Model 1) CFH Y402H rs1061170 and ARMS2/HTRA1 rs10490924.
Model 3 adjusting for age, race, body mass index, smoking status, AREDS treatment group, multivitamin intake, baseline AMD severity group, AMD status of fellow eye, family history of AMD, and genetic variants selected from stepwise regression.
Model 4 adjusting for age, race, body mass index, smoking status, AREDS treatments group, multivitamin intake, baseline AMD severity group, AMD status of fellow eye, family history of AMD, and 31 genetic variants.
COMPOSITE RISK SCORE DISCRIMINATES BETWEEN PROGRESSING AND NON-PROGRESSING EYES:
Figure 4A, shows a clear differentiation between the proportion of progressing and non-progressing eyes according to the composite risk score based on Model 3. There is minimal overlap between the risk distributions of progressing and non-progressing eyes overall. Scores >10 were common (95%) among progressing eyes and relatively uncommon (27%) among non-progressing eyes. Figure 4B through D, show the composite risk score within strata formed by baseline AMD severity groups at baseline. There was separation between progressing and non-progressing eyes within each severity score group. These results suggest that the composite risk score including genetic and non-genetic variables can differentiate eyes with high and low risk of progression among eyes within the same macular severity group at baseline.
FIGURE 4.
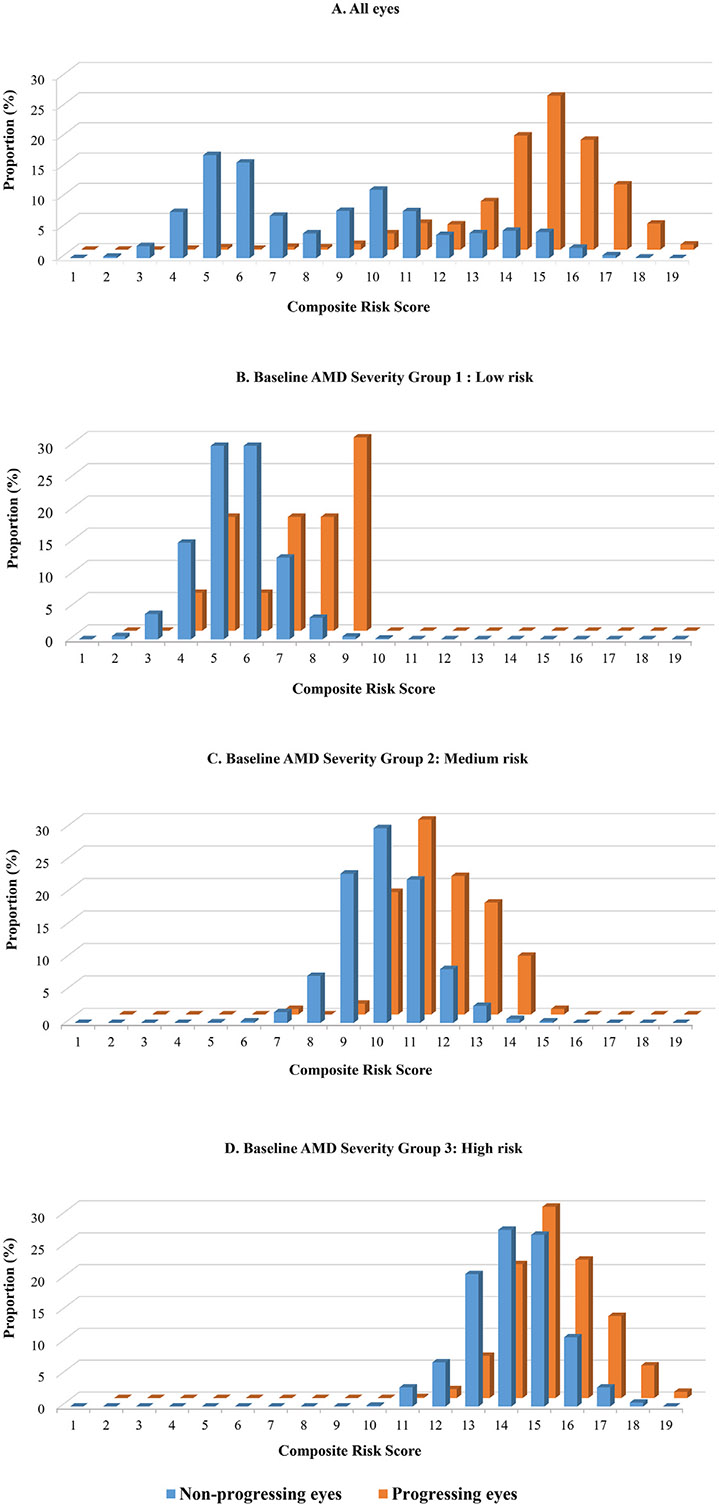
A. Composite risk scores for non-progressing and progressing eyes. Composite risk scores include both non-genetic and genetic variables adjusting for age, race, body mass index, smoking status, Age-Related Eye Disease Study treatment group, multivitamin intake, baseline age-related macular degeneration (AMD) severity group, AMD status of the fellow eye, family history of AMD, and 12 genetic variants (Model 3). B through D. Composite risk scores for progressing and non-progressing eyes stratified by baseline non-advanced AMD severity group (B, severity group 1 = low risk [severity scale 1]; C, severity group 2 = medium risk [severity scales 2-4]; D, severity group 3 = high risk [severity scales 5-8]). AAMD = advanced age-related macular degeneration.
• APPLICATION OF THE COMPOSITE RISK SCORE FOR PREDICTION OF AAMD:
Predicted cumulative risk of AAMD over 2, 5, and 10 years for 24 representative eyes using the composite risk score can be found in Supplemental Table 7. A low-risk eye, such as eye 21 with a 1.2% 10-year risk of progression, is characterized by a baseline severity scale group 1, a fellow eye without AAMD at baseline, and no risk alleles for 9 of the 12 genes considered (composite risk score of 7). A high-risk eye, such as eye 17, with a 10-year risk of 94.5% for progression to AAMD, had a baseline AMD severity group 3, a fellow eye with AAMD, 1 relative with AMD, and had the risk variants CFH Y402H, ARMS2/HTRA1, C3 R1210G, C3 K155Q, ABCA1, and SLC16A8 (composite risk score of 18). Other eyes had ranges of risk accounting for competing mortality between these 2 levels. Among the 2 eyes with composite risk scores ≤10, none progressed, and of 9 eyes with scores between 11 and 14, 3 (33%) progressed, and for the 12 eyes with scores ≥15, 9 (75%) progressed to AAMD over 12 years. We also estimated cumulative incidence of progression to AAMD over 5 years based on risk categories in Figure 2: among eyes in lower risk categories, 1 of 8 (13%) progressed, and 5 of 7 eyes (71%) progressed to AAMD in the highest-risk categories. An online risk calculator is being updated to implement these methods.
DISCUSSION
Ocular features were highly predictive of progression to AAMD, including the level of severity of the study eye and whether the fellow eye had progressed. However, our results show that the composite risk model that included both non-genetic factors and genetic variants was highly predictive of progression and provided greater discrimination between progressors and nonprogressors than a model without genetic variants. It also added more discrimination than incorporating only the 2 most common genes (CFH and ARMS2) found in publicly available genetic testing kits. The genetic variants that predicted progression were in the complement, immune, inflammatory, lipid, extracellular matrix, angiogenesis, and DNA repair pathways. Interestingly, this composite risk score model also appeared more effective at prediction of progression than the model with >30 genetic variants known to be related to prevalent AMD. This could possibly be caused by the addition of genetic variants that are associated with prevalence but are not strongly associated with progression, which may add random noise to the model. A family history of AMD conferred additional important information in risk prediction even after adjusting for genetic susceptibility and other factors. This could be explained in part by other shared environmental or lifestyle factors among families or other unknown genetic variants.
In addition, for each baseline severity scale group, the distribution of the composite risk score was substantially higher in eyes that progressed than eyes that did not progress. This suggests that the course of the disease differs among eyes with similar non-advanced stages of disease at baseline. Some people with higher-risk ocular features are less likely to progress than others based on non-ocular features, including genetic susceptibility. The value of such a score is that individuals with higher composite risk scores could be monitored more closely and encouraged to adhere to healthier habits. This patient management would include advice about not smoking,28 increasing consumption of foods rich in lutein and zeaxanthin,29 and maintaining an optimal weight including lower abdominal weight.30 Reduction in levels of certain fats31 and increasing intake of omega-3-fatty-acids32-34 can also be beneficial. Many of these nutritional recommendations are included in the Mediterranean style diet which was first reported to reduce the progression to AAMD in 201535 and then subsequently confirmed in a European population.36 AREDS supplements are also recommended for individuals with intermediate AMD.37
Prediction models for AMD began by initially including the few known genes related to prevalence of the disease.4 Subsequently, non-genetic variables including demographic, environmental, and lifestyle as well as ocular factors were added, along with addition of some newly discovered genetic variants that were also significantly related to progression.2,14 Other analyses were done in different cohorts using similar methods both in the United States and other countries.38 Family history of AMD has previously been shown to be a risk factor for AMD.39,40 The prevalence of age-related maculopathy among first-degree relatives of subjects with age-related maculopathy, particularly with neovascular disease, was greater than among first-degree relatives of subjects without this disease.39
This report differs in several important ways: 1) we assessed risk of progression in individual eyes classified using the AREDS severity scale groups, and adjusted for fellow eye status; 2) we incorporated the family history of AMD and assessed lower or higher risk based on number of affected relatives (no family history, 1 family member, and ≥2 family members); 3) the outcome included AAMD as well as GA and NV separately for each eye, requiring confirmation at 2 successive visits to reduce misclassification; 4) analyses accounted for correlation between eyes for the outcomes, and adjusted for competing mortality risk; and 5) the online calculator incorporates several genetic variants most highly related to progression, can accommodate missing genetic data, and can be used if information regarding genetic variants is unknown by incorporating the minor allele frequencies in the general population for selected genes.
We assessed the relative performance of different models, with and without genetic variants, and within different baseline AMD severity scale groups. The composite risk score combining non-genetic factors with the most predictive genetic factors performed best in assessing progression to AAMD over 12 years. The AUC for this model was 0.93 for progression at 5 years and 0.92 for progression at 12 years, higher than some previous models.
In a previous article to assess response to AREDS supplementation according to genetic factors,41 we reported a protective effect of antioxidants plus zinc versus placebo for progression to overall advanced AMD (HR 0.83 [95% CI 0.67-1.03]; P = 0.084), NV (HR 0.71 [95% CI 0.53-0.96]; P = 0.024), but not for GA (HR 0.96 [95% CI 0.72-1.29]; P = 0.79). A protective treatment effect was seen for the CFH nonrisk genotype and the risk ARMS2 genotype, with significant treatment–genotype interactions, particularly for progression to NV. These results were based on survival analysis using the eye as the unit of analysis and controlled for baseline Clinical Age-Related Maculopathy Staging grade42 and baseline drusen size for eyes without AAMD at baseline. The above analyses were conducted over the duration of the clinical trial (mean follow-up, 6.6 years).
In the current article, analyses differed and were conducted over the full 12 years of follow-up, and the 3 active treatment groups were combined and compared with placebo. Furthermore, baseline severity was controlled for using the 12-point AREDS Severity Scale. Finally, because some eyes that progressed at 1 visit were graded in AREDS as not progressing at a subsequent follow-up, we used a more conservative definition of progression requiring progression at 2 consecutive visits for confirmation. The effects were in the same direction as our previous results but weaker (AAMD: HR 0.96 [95% CI 0.82-1.13]; P = 0.61; GA: HR 0.96 [95% CI 0.80-1.16]; P = 0.69; NV: HR 0.85 [95% CI 0.71-1.03]; P = 0.096). It is expected that the HR for active treatment versus placebo would be closer to the null after the clinical trial ended, since all subjects were offered active treatment after the primary results were published.
In the original AREDS clinical trial,18 a significant effect of antioxidants plus zinc versus placebo was reported for AAMD (OR 0.72 [95% CI 0.52-0.98]; P = 0.007) and NV (OR 0.62 [95% CI 0.43-0.90]; P = 0.001), and a nonsignificant trend for central GA (OR 0.75 [95% CI 0.45-1.24]; P = 0.13). However, there were some differences in analytic techniques used in that article comparted with ours. First, in the report of the clinical trial results, a generalized estimating equations analysis was used instead of survival analysis. This allowed subjects who were graded as progressing at successive visits in the original AREDS paper to be counted multiple times after the first occurrence, which will often exaggerate treatment differences, although it does offer protection against the issue of some progressing eyes regressing at subsequent visits. Also, the unit of analysis was the person instead of the eye, which is less efficient, particularly if baseline eye-specific macular status is used as a covariate. The conservative definition of progression used in the current study is a good compromise between over- and undercounting progressing eyes.
The limitations of our study include possible overestimation of the predictive accuracy (AUC and NRI). Results should be validated in large independent study cohorts that have comparable baseline predictors and many eyes that progress to AAMD. Family history was self-reported by participants. There may be some misclassification, especially for individuals who reported no family history if their parents died young and they had no siblings. Ideally, information about parents and siblings, ages of death, and number of siblings should be collected. We classified baseline AMD severity scale groups into low, medium, and high-risk to enhance the clinical application of the model and practical use of the online calculator. However, there may be residual confounding within these groups.
• CLINICAL RELEVANCE:
These results could inform physicians who conduct assessment of presence and degree of macular degeneration and provide guidance to obtain family history of disease, because it relates to subsequent progression to more advanced stages of the disease. It also highlights that genetic susceptibility plays a role, even independent of family history and the clinical status of the macula. The composite risk score including genetic factors could be useful for clinical management to identify individuals who are more likely to progress to advanced stages of AMD, who could then be advised to have more frequent follow-up appointments, encouraged to adhere to healthy habits, and identified for participation in clinical trials.43 This information is gaining more importance as new treatments aimed at genetic pathways are coming to market and others are under investigation.44
In summary, baseline macular AMD severity and status of the fellow eye (presence or absence of advanced disease) are important predictors of progression. Family history of AMD, especially ≥2 affected relatives, and genetic variants in several biologic pathways, provide additional discrimination between progressing and non-progressing eyes, after accounting for baseline macular status. Finally, a composite risk score model that combines non-genetic and genetic variables was most informative in terms of predicting risk of progression from non-advanced to advanced stages of AMD, compared with models with only macular status or only non-genetic factors.
An overall summary of the risk calculations can be obtained from the online calculator that uses the composite risk score, incorporating demographic, behavioral, ocular, nutritional, and genetic factors. This free resource enables the user to obtain an AMD risk score both with and without genetic information, with additional discrimination if genetic variants are included.
Supplementary Material
Funding/Support:
Supported in part by National Eye Institute grants R01-EY011309, R01-EY028602, and R01-EY022445, the American Macular Degeneration Foundation, and the Macular Degeneration Center of Excellence, University of Massachusetts Chan Medical School, Department of Ophthalmology and Visual Sciences. The sponsor or funding organization had no role in the design or conduct of this research.
Footnotes
Supplemental Material available at AJO.com.
All authors have completed and submitted the ICMJE form for disclosure of potential conflicts of interest.
Financial Disclosures: J.M.S. has equity interests in Gemini Therapeutics and Apellis Pharmaceuticals and has been a consultant for Thea Laboratoires, Inc. All authors attest that they meet the current ICMJE criteria for authorship.
Contributor Information
JOHANNA M. SEDDON, Department of Ophthalmology and Visual Sciences, University of Massachusetts Chan Medical School, Worcester, Massachusetts, USA
DIKHA DE, Department of Ophthalmology and Visual Sciences, University of Massachusetts Chan Medical School, Worcester, Massachusetts, USA.
BERNARD ROSNER, Department of Medicine, Channing Division of Network Medicine, Harvard Medical School, Boston, Massachusetts, USA.
REFERENCES
- 1.Lim LS, Mitchell P, Seddon JM, Holz FG, Wong TY. Age-related macular degeneration. Lancet. 2012;379(9827):1728–1738. doi: 10.1016/S0140-6736(12)60282-7. [DOI] [PubMed] [Google Scholar]
- 2.Seddon JM. Macular degeneration epidemiology: nature-nurture, lifestyle factors, genetic risk, and gene-environment interactions – The Weisenfeld Award Lecture. Invest Ophthalmol Vis Sci. 2017;58(14):6513–6528. doi: 10.1167/iovs.17-23544. [DOI] [PMC free article] [PubMed] [Google Scholar]
- 3.Mangione CM, Gutierrez PR, Lowe G, Orav EJ, Seddon JM. Influence of age-related maculopathy on visual functioning and health-related quality of life. Am J Ophthalmol. 1999;128(1):45–53. doi: 10.1016/s0002-9394(99)00169-5. [DOI] [PubMed] [Google Scholar]
- 4.Maller J, George S, Purcell S, et al. Common variation in three genes, including a noncoding variant in CFH, strongly influences risk of age-related macular degeneration. Nat Genet. 2006;38(9):1055–1059. doi: 10.1038/ng1873. [DOI] [PubMed] [Google Scholar]
- 5.Seddon JM, George S, Rosner B, Klein ML. CFH gene variant, Y402H, and smoking, body mass index, environmental associations with advanced age-related macular degeneration. Hum Hered. 2006;61(3):157–165. doi: 10.1159/000094141. [DOI] [PubMed] [Google Scholar]
- 6.Seddon JM, Francis PJ, George S, Schultz DW, Rosner B, Klein ML. Association of CFH Y402H and LOC387715 A69S with progression of age-related macular degeneration. JAMA. 2007;297(16):1793–1800. doi: 10.1001/jama.297.16.1793. [DOI] [PubMed] [Google Scholar]
- 7.Seddon JM, Reynolds R, Maller J, Fagerness JA, Daly MJ, Rosner B. Prediction model for prevalence and incidence of advanced age-related macular degeneration based on genetic, demographic, and environmental variables. Invest Ophthalmol Vis Sci. 2009;50(5):2044–2053. doi: 10.1167/iovs.08-3064. [DOI] [PMC free article] [PubMed] [Google Scholar]
- 8.Raychaudhuri S, Iartchouk O, Chin K, et al. A rare penetrant mutation in CFH confers high risk of age-related macular degeneration. Nat Genet. 2011;43(12):1232–1236. doi: 10.1038/ng.976. [DOI] [PMC free article] [PubMed] [Google Scholar]
- 9.Yu Y, Reynolds R, Rosner B, Daly MJ, Seddon JM. Prospective assessment of genetic effects on progression to different stages of age-related macular degeneration using multistate Markov models. Invest Ophthalmol Vis Sci. 2012;53(3):1548–1556. doi: 10.1167/iovs.11-8657. [DOI] [PMC free article] [PubMed] [Google Scholar]
- 10.Seddon JM, Reynolds R, Yu Y, Rosner B. Validation of a prediction algorithm for progression to advanced macular degeneration subtypes. JAMA Ophthalmol. 2013;131(4):448–455. doi: 10.1001/jamaophthalmol.2013.2578. [DOI] [PMC free article] [PubMed] [Google Scholar]
- 11.Seddon JM, Yu Y, Miller EC, et al. Rare variants in CFI, C3 and C9 are associated with high risk of advanced age-related macular degeneration. Nat Genet. 2013;45(11):1366–1370. doi: 10.1038/ng.2741. [DOI] [PMC free article] [PubMed] [Google Scholar]
- 12.Seddon JM, Reynolds R, Yu Y, Rosner B. Three new genetic loci (R1210C in CFH, variants in COL8A1 and RAD51B) are independently related to progression to advanced macular degeneration. PloS One. 2014;9(1):e87047. doi: 10.1371/journal.pone.0087047. [DOI] [PMC free article] [PubMed] [Google Scholar]
- 13.Seddon JM, Silver RE, Kwong M, Rosner B. Risk prediction for progression of macular degeneration: 10 common and rare genetic variants, demographic, environmental, and macular covariates. Invest Ophthalmol Vis Sci. 2015;56(4):2192–2202. doi: 10.1167/iovs.14-15841. [DOI] [PMC free article] [PubMed] [Google Scholar]
- 14.Seddon JM, Rosner B. Validated prediction models for macular degeneration progression and predictors of visual acuity loss identify high-risk individuals. Am J Ophthalmol. 2019;198:223–261. doi: 10.1016/j.ajo.2018.10.022. [DOI] [PMC free article] [PubMed] [Google Scholar]
- 15.Seddon JM, Widjajahakim R, Rosner B. Rare and common genetic variants, smoking, and body mass index: progression and earlier age of developing advanced age-related macular degeneration. Invest Ophthalmol Vis Sci. 2020;61(14):32. doi: 10.1167/iovs.61.14.32. [DOI] [PMC free article] [PubMed] [Google Scholar]
- 16.Widjajahakim R, Rosner B, Seddon JM. Prediction of AMD progression within eye-specific baseline severity scales, and attributable fraction for modifiable factors and a genetic risk score. Invest Ophthalmol Vis Sci. 2021;62(8):325. [Google Scholar]
- 17.Age-Related Eye Disease Study Research Group The Age-Related Eye Disease Study severity scale for age-related macular degeneration: AREDS report no. 17. Arch Ophthalmol. 2005;123(11):1484–1498. doi: 10.1001/archopht.123.11.1484. [DOI] [PMC free article] [PubMed] [Google Scholar]
- 18.Age-Related Eye Disease Study Research Group A randomized, placebo-controlled, clinical trial of high-dose supplementation with vitamins C and E, beta carotene, and zinc for age-related macular degeneration and vision loss: AREDS report no. 8. Arch Ophthalmol. 2001;119(10):1417–1436. doi: 10.1001/archopht.119.10.1417. [DOI] [PMC free article] [PubMed] [Google Scholar]
- 19.McMahon O, Hallam TM, Patel S, et al. The rare C9 P167S risk variant for age-related macular degeneration increases polymerization of the terminal component of the complement cascade. Hum Mol Genet. 2021;30(13):1188–1199. doi: 10.1093/hmg/ddab086. [DOI] [PMC free article] [PubMed] [Google Scholar]
- 20.Neale BM, Fagerness J, Reynolds R, et al. Genome-wide association study of advanced age-related macular degeneration identifies a role of the hepatic lipase gene (LIPC). Proc Natl Acad Sci U S A. 2010;107(16):7395–7400. doi: 10.1073/pnas.0912019107. [DOI] [PMC free article] [PubMed] [Google Scholar]
- 21.Maller JB, Fagerness JA, Reynolds RC, Neale BM, Daly MJ, Seddon JM. Variation in complement factor 3 is associated with risk of age-related macular degeneration. Nat Genet. 2007;39(10):1200–1201. doi: 10.1038/ng2131. [DOI] [PubMed] [Google Scholar]
- 22.Fagerness JA, Maller JB, Neale BM, Reynolds RC, Daly MJ, Seddon JM. Variation near complement factor I is associated with risk of advanced AMD. Eur J Hum Genet. 2009;17(1):100–104. doi: 10.1038/ejhg.2008.140. [DOI] [PMC free article] [PubMed] [Google Scholar]
- 23.Klein RJ, Zeiss C, Chew EY, et al. Complement factor H polymorphism in age-related macular degeneration. Science . 2005;308(5720):385–389. doi: 10.1126/science.1109557. [DOI] [PMC free article] [PubMed] [Google Scholar]
- 24.Rivera A, Fisher SA, Fritsche LG, et al. Hypothetical LOC387715 is a second major susceptibility gene for age-related macular degeneration, contributing independently of complement factor H to disease risk. Hum Mol Genet. 2005;14(21):3227–3236. doi: 10.1093/hmg/ddi353. [DOI] [PubMed] [Google Scholar]
- 25.Sobrin L, Reynolds R, Yu Y, et al. ARMS2/HTRA1 locus can confer differential susceptibility to the advanced subtypes of age-related macular degeneration. Am J Ophthalmol. 2011;151(2):345–352 e3. doi: 10.1016/j.ajo.2010.08.015. [DOI] [PMC free article] [PubMed] [Google Scholar]
- 26.Schramm EC, Clark SJ, Triebwasser MP, Raychaudhuri S, Seddon JM, Atkinson JP. Genetic variants in the complement system predisposing to age-related macular degeneration: a review. Mol Immunol. 2014;61(2):118–125. doi: 10.1016/j.molimm.2014.06.032. [DOI] [PMC free article] [PubMed] [Google Scholar]
- 27.Pencina MJ, Steyerberg EW, D’Agostino RB. Extensions of net reclassification improvement calculations to measure usefulness of new biomarkers. Stat Med. 2011;30(1):11–21. doi: 10.1002/sim.4085. [DOI] [PMC free article] [PubMed] [Google Scholar]
- 28.Seddon JM, Willett WC, Speizer FE, Hankinson SE. A prospective study of cigarette smoking and age-related macular degeneration in women. JAMA . 1996;276(14):1141–1146. doi: 10.1001/jama.1996.03540140029022. [DOI] [PubMed] [Google Scholar]
- 29.Seddon JM, Ajani UA, Sperduto RD, et al. Dietary carotenoids, vitamins A, C, and E, and advanced age-related macular degeneration. JAMA. 1994;272(18):1413–1420. doi: 10.1001/jama.1994.03520180037032. [DOI] [PubMed] [Google Scholar]
- 30.Seddon JM, Cote J, Davis N, Rosner B. Progression of age-related macular degeneration: association with body mass index, waist circumference, and waist-hip ratio. Arch Ophthalmol. 2003;121(6):785–792. doi: 10.1001/archopht.121.6.785 . [DOI] [PubMed] [Google Scholar]
- 31.Seddon JM, Rosner B, Sperduto RD, et al. Dietary fat and risk for advanced age-related macular degeneration. Arch Ophthalmol. 2001;119(8):1191–1199. doi: 10.1001/archopht.119.8.1191. [DOI] [PubMed] [Google Scholar]
- 32.Seddon JM, Cote J, Rosner B. Progression of age-related macular degeneration: association with dietary fat, transunsaturated fat, nuts, and fish intake. Arch Ophthalmol. 2003;121(12):1728–1737. doi: 10.1001/archopht.121.12.1728. [DOI] [PMC free article] [PubMed] [Google Scholar]
- 33.Seddon JM, George S, Rosner B. Cigarette smoking, fish consumption, omega-3 fatty acid intake, and associations with age-related macular degeneration: the US Twin Study of Age-Related Macular Degeneration. Arch Ophthalmol. 2006;124(7):995–1001. doi: 10.1001/archopht.124.7.995. [DOI] [PubMed] [Google Scholar]
- 34.Reynolds R, Rosner B, Seddon JM. Dietary omega-3 fatty acids, other fat intake, genetic susceptibility, and progression to incident geographic atrophy. Ophthalmology. 2013;120(5):1020–1028. doi: 10.1016/j.ophtha.2012.10.020. [DOI] [PMC free article] [PubMed] [Google Scholar]
- 35.Merle BMJ, Silver RE, Rosner B, Seddon JM. Adherence to a Mediterranean diet, genetic susceptibility, and progression to advanced macular degeneration: a prospective cohort study. Am J Clin Nutr. 2015;102(5):1196–1206. doi: 10.3945/ajcn.115.111047. [DOI] [PMC free article] [PubMed] [Google Scholar]
- 36.Merle BMJ, Colijn JM, Cougnard-Grégoire A, et al. Mediterranean diet and incidence of advanced age-related macular degeneration: the EYE-RISK Consortium. Ophthalmology . 2019;126(3):381–390. doi: 10.1016/j.ophtha.2018.08.006. [DOI] [PubMed] [Google Scholar]
- 37.Age-Related Eye Disease Study 2 Research Group Lutein + zeaxanthin and omega-3 fatty acids for age-related macular degeneration: the Age-Related Eye Disease Study 2 (AREDS2) randomized clinical trial. JAMA. 2013;309(19):2005–2015. doi: 10.1001/jama.2013.4997. [DOI] [PubMed] [Google Scholar]
- 38.Buitendijk GHS, Rochtchina E, Myers C, et al. Prediction of age-related macular degeneration in the general population: the Three Continent AMD Consortium. Ophthalmology. 2013;120(12):2644–2655. doi: 10.1016/j.ophtha.2013.07.053. [DOI] [PMC free article] [PubMed] [Google Scholar]
- 39.Seddon JM, Ajani UA, Mitchell BD. Familial aggregation of age-related maculopathy. Am J Ophthalmol. 1997;123(2):199–206. doi: 10.1016/S0002-9394(14)71036-0. [DOI] [PubMed] [Google Scholar]
- 40.Klein ML, Francis PJ, Ferris FL, Hamon SC, Clemons TE. Risk assessment model for development of advanced age-related macular degeneration. Arch Ophthalmol. 2011;129(12):1543–1550. doi: 10.1001/archophthalmol.2011.216. [DOI] [PubMed] [Google Scholar]
- 41.Seddon JM, Silver RE, Rosner B. Response to AREDS supplements according to genetic factors: survival analysis approach using the eye as the unit of analysis. Br J Ophthalmol. 2016;100(12):1731–1737. doi: 10.1136/bjophthalmol-2016-308624. [DOI] [PMC free article] [PubMed] [Google Scholar]
- 42.Seddon JM, Sharma S, Adelman RA. Evaluation of the clinical age-related maculopathy staging system. Ophthalmology . 2006;113(2):260–266. doi: 10.1016/j.ophtha.2005.11.001. [DOI] [PubMed] [Google Scholar]
- 43.Seddon JM, Reynolds R, Yu Y, Daly MJ, Rosner B. Risk models for progression to advanced age-related macular degeneration using demographic, environmental, genetic, and ocular factors. Ophthalmology . 2011;118(11):2203–2211. doi: 10.1016/j.ophtha.2011.04.029. [DOI] [PMC free article] [PubMed] [Google Scholar]
- 44.Goldberg R, Heier JS, Wykoff CC, et al. Efficacy of intravitreal pegcetacoplan in patients with geographic atrophy (GA): 12-month results from the phase 3 OAKS and DERBY studies [abstract]. Invest Ophthalmol Vis Sci. 2022;63(7):1500. [Google Scholar]
Associated Data
This section collects any data citations, data availability statements, or supplementary materials included in this article.