Abstract
We present a new method for the calculation of solvent accessible surface areas at the atomic and residue levels, which we call parameter optimized surfaces (POPS-A and POPS-R ). Atomic and residue areas (the latter simulated with a single sphere centered at the Cαs atom for amino acids and at the P atom for nucleotides) have been optimized versus accurate all-atoms methods. We concentrated on an analytical formula for the approximation of solvent accessibilities. The formula is simple, easily derivable and fast to compute, therefore it is practical for use in molecular dynamics simulations as an approximation to the first solvation shell. The residue based approach POPS-R has been derived as a useful tool for the analysis of large macromolecular assemblies like the ribosome, and is especially suited for use in refinement of low resolution structures. The structures of the 70S, 50S and 30S ribosomes have been analyzed in detail and most of the interactions within the subunits and at their interfaces were clearly identified. Some interesting differences between 30S alone and within the 70S have been highlighted. Owing to the presence of the P-tRNA in the 70S ribosome, localized conformational rearrangements occur within the subunits, exposing Arg and Lys residues to negatively charged binding sites of P-tRNA. POPS-R also allows for estimates of the loss of free energy of solvation upon complex formation, particularly useful in designing new protein–RNA complexes and in suggesting more focused experimental work.
INTRODUCTION
In recent years the life sciences have been faced with an explosion of freely available biological information from both gene sequencing and structure determination (1). New research areas like structural genomics (2,3) and functional genomics (4,5) are flourishing at the same time as structural investigation methods are addressing macromolecular assemblages like the RNA polymerases (6), the nucleosome (7) and the ribosome (8–13). In an era in which quantity and quality of data is increasing tremendously, the development of efficient and automated computer-based tools for the analysis and the rationalization of such data is mandatory.
More than 40 years ago, Kauzmann (14) identified the burial of hydrophobic groups as a key driving force for protein folding. Recent analyses revealed that protein–protein interactions are also associated with a significant burial of hydrophobic residues (15,16), and thermodynamic unfolding data showed that ∼75% of the variation in the energetics can be accounted for burial of solvent accessible surface area (SASA) (16). Moreover, the evaluation of SASA was demonstrated to play a pivotal role in methods for assigning folds to sequences (17), function to structures (5) and for describing the dynamic behavior of proteins in solution (18,19) as well as their unfolding modes (20,21).
Here, we present a new method to calculate solvent accessibilities at the atomic and residue levels for proteins and nucleic acids, called parameter optimized surfaces (POPS). The analytical formula we used to approximate the SASA (22) was proved to be particularly effective when combined with molecular dynamics (MD) programs (18,21). In order to improve the performance of the formula, we reparametrized it to reproduce atomic (POPS-A) and residue (POPS-R) SASAs from more accurate methods (23) that do not use an analytical expression. This versatile approach allows us to implement the POPS areas in MD programs and as a weighting factor in structural alignment, threading and structural refinement packages.
The residue level approach is particularly useful for the analysis of large structural assemblies, in order to filter key interactions between molecules due to the burial of surface area. Moreover, it has been designed to characterize the hydrophobic or hydrophilic nature of exposed and buried surfaces and can estimate the loss of solvation free energy upon complex formation. The recently solved structure of the Thermus thermophilus 70S ribosome at residue level (Cα only and P only for proteins and RNAs) (12) is the ideal candidate to demonstrate the efficiency and the predictive power of POPS-R. The 70S ribosome is composed of a small and a large subunit, named 30S and 50S, respectively. The X-ray crystal structure of the 30S subunit comprises 16S rRNA and about 20 proteins (from S2 to S20), while that of the 50S subunit comprises 23S and 5S rRNAs, and about 30 proteins (from L1 to L30). The structure of the 30S isolated subunit was resolved to atomic level (8,10) and it will be used to validate the POPS-R method. Here we will describe key interactions among complexes in the ribosome detected by POPS-R and some, as yet unreported, conformational changes due to the 30S/50S association and to the interaction with P-tRNA.
MATERIALS AND METHODS
Reparametrizing the analytical formula
The total SASA of a molecule composed by N atoms is given by:
where Ai is the SASA of the ith atom.
The algorithm we used to approximate the Ai is based on the analytical expression proposed by Still and co-workers (22,24) and on the probabilistic method of Wodak and Janin (25). The original formula is:
where Si = 4π(Ri + Rsolv)2 is the SASA of the isolated atom i with radius Ri and a solvent probe with radius Rsolv.
The term bij(rij) represents the SASA removed from Si by the overlap of the atoms i and j at a distance rij = │ri – rj│.
If rij > Ri + Rj + 2Rsolv
bij(rij) = 0;
while if rij < Ri + Rj + 2Rsolv
bij(rij) = π(Ri + Rsolv)(Ri + Rj + 2Rsolv – rij)[1 + (Rj – Ri)![]() ]
]
The empirical parameter pi depends on the atom type, while the empirical parameter pij serves as an additional reducing factor that distinguishes between first and next covalently bound neighbor atoms (p1,2 and p1,3, respectively) and non-covalently bound atoms (p≥1,4). These parameters were optimized by Hasel et al. (22), reproducing the exact SASA of a large number of small molecules.
While in the original parametrization of Hasel et al. the pi parameters depend on the atom hybridization and substitution [e.g. CH(sp3), NH(sp2) and so on, for a total of about 25 parameters], we reparametrized the formula by choosing the parameters pi dependent on the type of atom in a given residue (e.g. one pi for the Cβ of each standard amino acid, or one pi for the N1 of each nucleotide, for a total of about 250 parameters) and by splitting off the p≥1,4 connectivity parameter into two parameters, namely p1,4 and p>1,4. Moreover, we applied the same algorithm to approximate the Ai at residue level, which means that each amino acid and nucleotide is represented by a single sphere centered at the Cαs atom for amino acids and at the P atom for nucleotides. In this case each parameter pi corresponds to one amino acid or nucleotide, and Ri is the radius of the sphere that simulates the whole residue, for a total of about 30 parameters Both the POPS-A and POPS-R empirical parameters were optimized over the atomic or residue SASAs of a database of 89 specifically chosen biological molecules (proteins, nucleic acids and protein–nucleic acid complexes). The SASA of the atoms of these molecules were evaluated with the program Naccess (NACS) in Hubbard et al. (23), and constitute the POPS-A training dataset of about 120 000 atoms. The residue NACS SASAs were obtained by adding up the atomic NACS areas, and constitute the POPS-R dataset of about 12 000 residues.
The POPS-A SASAs of the atoms were fitted to the NACS SASAs through a minimization of the σ2 variance of POPS-A from NACS areas with respect to the empirical parameters pi and pij. The atom radii proposed by Hasel et al. (22) were adopted. For the POPS-R parametrization the same procedure was applied by using the areas in the residues dataset. Besides the parameter pi, for each residue the radius Ri of the sphere used to simulate the whole amino acid or nucleotide was also optimized in the fitting procedure.
To assess the predictive power of POPS-A and POPS-R we followed a cross-validation-like resampling procedure (26–29). The size of the datasets (120 000 atoms and 12 000 residues areas for POPS-A and POPS-R, respectively) prevented the leave-one-out cross-validation resampling. The natural choice was to perform a k-fold cross-validation resampling with k = 89, which is the number of molecules in the database. The SASAs in both the atomic and residue datasets were partitioned into 89 subsets, each of them containing the SASAs of the atoms (or residues) of a specific molecule. Then, the pi and pij parameters were fitted to a training set composed by 88 subsets, and were used to predict the SASAs of the omitted subset that represents the test molecule, TM. The predicted atomic (or residues) SASAs of the omitted test molecule, ![]() , were compared with the corresponding NACS SASAs,
, were compared with the corresponding NACS SASAs, ![]() . The cross-validation prediction error
. The cross-validation prediction error ![]() for the test molecule i was evaluated as:
for the test molecule i was evaluated as:
where N corresponds to the number of atoms (or residues) in the test molecule i. This procedure was repeated 89 times, each time leaving out one of the test molecules (subsets), and the single cross-validation prediction errors ![]() were averaged to obtain the overall cross-validation prediction error
were averaged to obtain the overall cross-validation prediction error ![]() :
:
To establish whether the pi and pij parameters were converged, we evaluated the ![]() error, which corresponds to the
error, which corresponds to the ![]() error, but the reference areas are those obtained through a fitting to the full dataset,
error, but the reference areas are those obtained through a fitting to the full dataset, ![]() , i.e. including all the 89 molecules.
, i.e. including all the 89 molecules.
Finally two parameters will often be mentioned as measures of the errors obtained from the fitting: (i) the average absolute error aae and (ii) the average absolute precentual error aape.
NACS was also used to calculate the average fraction of hydrophobic and hydrophilic contributions to the total SASA for each residue in the database. According to these average fractions the POPS-R SASA can be partitioned into hydrophobic and hydrophilic contributions even witha residue-based method.
Finally, the free energy of solvation loss upon complex formation was estimated as Δ![]() = –ΔSASAPhobσPhob – ΔSASAPhilσPhil, where ΔSASAPhob and ΔSASAPhil are the hydrophobic and hydrophilic SASAs buried upon interaction, and σPhob and σPhil are the hydrophobic and hydrophilic solvation parameters set equal to 12 and –60 cal(mol Å2)–1, respectively (18). These values are consistent with experimentally fitted ones (30,31), and for the sake of simplicity they have been extended to nucleic acids.
= –ΔSASAPhobσPhob – ΔSASAPhilσPhil, where ΔSASAPhob and ΔSASAPhil are the hydrophobic and hydrophilic SASAs buried upon interaction, and σPhob and σPhil are the hydrophobic and hydrophilic solvation parameters set equal to 12 and –60 cal(mol Å2)–1, respectively (18). These values are consistent with experimentally fitted ones (30,31), and for the sake of simplicity they have been extended to nucleic acids.
RESULTS
POPS-A and POPS-R models validation
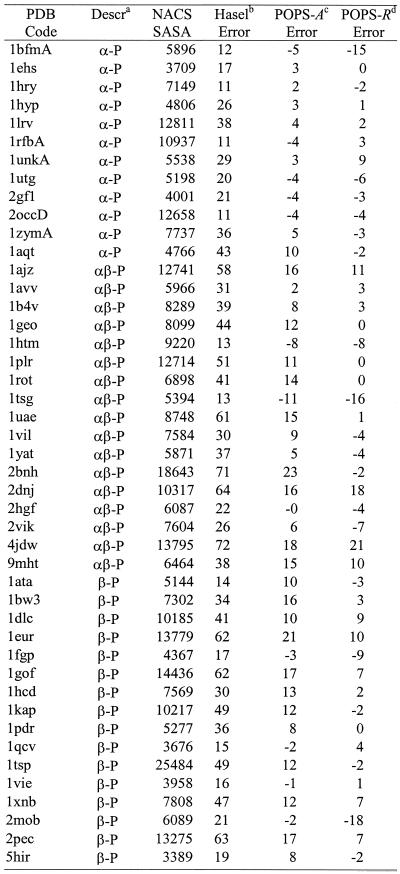
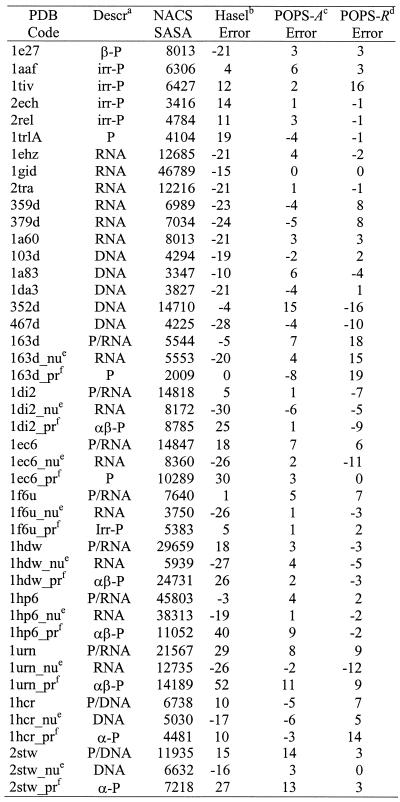
The total NACS SASAs and the % errors of POPS-A and POPS-R of the molecules used to fit the empirical pi and pij parameters are reported in Table 1. As a comparison, the % errors obtained with the original parameters of Hasel et al. (22) (to be compared with the POPS-A SASAs) are also reported. With these original parameters the aape on the total SASAs relative to the NACS ones is 26%, with SASAs of proteins generally underestimated and the nucleic acids ones generally overestimated. After optimization of the POPS-A parameters the aape relative to the NACS values is only 7%. All the molecules with relatively higher errors have an even larger error for the Hasel et al. results (e.g. 2bnh, 4jdw, 1eur, 1gof, etc.), indicating that these targets may represent a difficult test for an approximate formulation. Our results reproduce nucleic acids areas significantly better than the Hasel et al. results (22). The poorer performances of the original parameters is probably a consequence of the size of the molecules used in the Hasel et al. fitting, which was not originally designed as ad hoc for proteins and nucleic acids.
Table 1. NACS SASAs, in Å2, and percentual errors with the Hasel, POPS-A and POPS-R approaches for the molecules in the parameters training set.
aa-P, mainly a protein; b-P, mainly b protein; irr-P, mainly irregular protein, according to CATH’s definition; P, undetermined class protein; P/DNA, protein/DNA complex; P/RNA, protein/RNA complex.
bHasel percentage error calculated as 100 ¥ (SASAHasel – SASANACS)/SASANACS.
cPOPS-A percentage error calculated as 100 ¥ (SASAPOPS-A – SASANACS)/SASANACS. dPOPS-R percentage error calculated as 100 ¥ (SASAPOPS-R – SASANACS)/SASANACS. eX_nu, nucleic acid part of the protein/nucleic acid complex with PDB code X.
fX_pr, proteic part of the protein/nucleic acid complex with PDB code X.
For POPS-R the aape is 6%. The total areas are surprisingly well reproduced even by a coarse-grained method. However, the POPS-A and POPS-R cross-validation prediction errors ![]() , which are equal to 2.6 and 23.4 Å2, respectively, indicate that for POPS-R the particularly good prediction of the total SASAs is due to some errors compensation. The almost negligible
, which are equal to 2.6 and 23.4 Å2, respectively, indicate that for POPS-R the particularly good prediction of the total SASAs is due to some errors compensation. The almost negligible ![]() errors, 0.1 and 0.5 Å2 for POPS-A and POPS-R, respectively, suggest that both sets of empirical parameters are converged. The small POPS-A prediction error (2.6 Å2) we found is comparable to the 2.2 Å2 aae found by Weiser et al. (32) in their analytical method based on tetrahedrally directed neighbor densities (TDND). This method has 21 parameter types derived from a set of 19 compounds of different size (11–4346 atoms). It proved to compute first and second derivatives very fast, but its performance in combination with MD packages is not clear. We had already confidence in the effectiveness of the original POPS formula within MD simulations (18,20,21) and therefore we decided to improve the performance of the same methodology.
errors, 0.1 and 0.5 Å2 for POPS-A and POPS-R, respectively, suggest that both sets of empirical parameters are converged. The small POPS-A prediction error (2.6 Å2) we found is comparable to the 2.2 Å2 aae found by Weiser et al. (32) in their analytical method based on tetrahedrally directed neighbor densities (TDND). This method has 21 parameter types derived from a set of 19 compounds of different size (11–4346 atoms). It proved to compute first and second derivatives very fast, but its performance in combination with MD packages is not clear. We had already confidence in the effectiveness of the original POPS formula within MD simulations (18,20,21) and therefore we decided to improve the performance of the same methodology.
To compare the computer performance of POPS-A with the TDND approach, we calculated the POPS-A SASA of the bovine chymotrypsin complex (PDB entry 1ca0, 4346 atoms) on a SGI R10000/195 MHz processor. The SASA of this molecule was calculated in 0.234 s with the TDND model (32), while only 0.089 s were needed with POPS-A. In both cases the reported CPU times do not include pre-processing steps, like the neighboring atoms list calculation, since these extra steps are already part of a MD calculation scheme. We conclude that the POPS-A model produces a slightly larger error than the TDND model, but it speeds up the calculation by a factor of ∼2.5. In a MD simulation with inclusion of implicit solvent, areas are calculated at every time step. Thus, a key factor in selecting the POPS-A model is its required computational time.
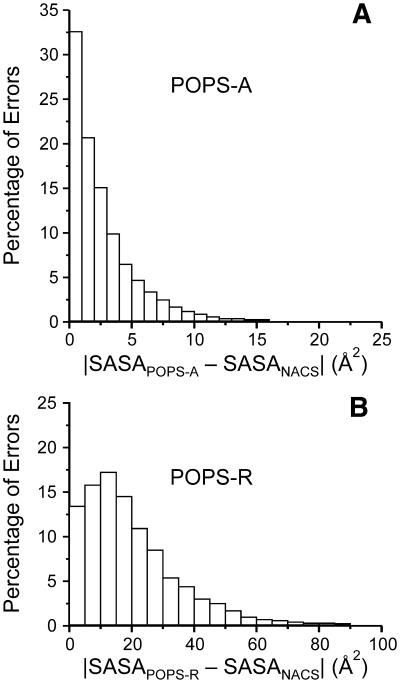
In Figure 1 we report the atomic and residue errors distributions from POPS-A and POPS-R. For POPS-A, ∼33% of the atomic SASAs are within 1 Å2 from the NACS values, and that ∼90% of the atomic SASAs are within 5 Å2 from the NACS values. The fraction of errors >10 Å2 is substantially negligible. For POPS-R, the distribution has a maximum αρουνδ 15%, and the error becomes negligible only at around 40 Å2. However, it must be considered that the average SASA per residue in the dataset is 55 Å2 for the amino acids and 177 Å2 for the nucleotides. The limitation of POPS-R is, of course, on the use of a single sphere to model the whole residue, and we refer our errors to the NACS areas obtained at atomic level and summed up to residue level. Nevertheless, we will show that our coarse-grained model is able to detect key interactions with a sensitivity not far from all-atoms models.
Figure 1.
Percentual distribution of absolute atomic and residue SASAs errors with respect to NACS ones for POPS-A (A) and POPS-R (B). In (B) the NACS areas are calculated at atomic level and summed up to residues.
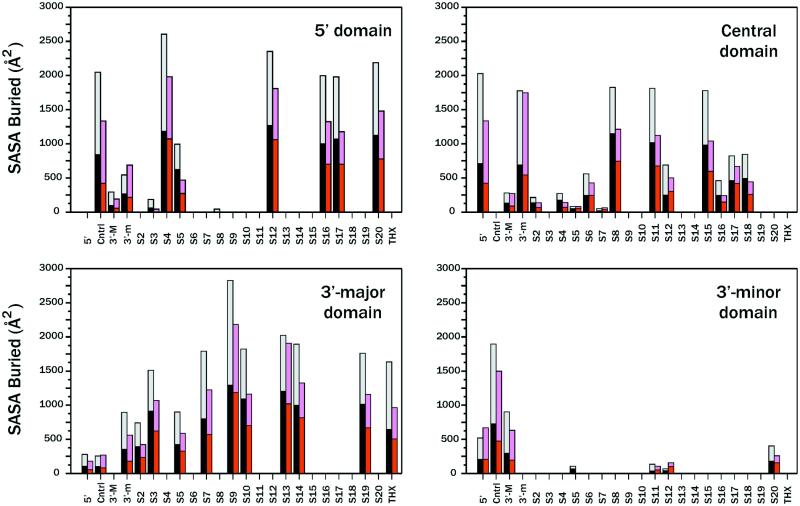
To further test the POPS-R method and show its predictive ability for a large system like the 70S ribosome, we used the high resolution structure of the 30S ribosome subunit (10) for calculating atomic areas with NACS, and then compared these with residue areas with POPS-R. The aape relative to the total POPS-R SASA of the isolated 16S (subdivided into domains 5′, central, 3′-major and 3′-minor), these four domains and of the 19 resolved proteins is 5%, and this number also holds for the hydrophobic and hydrophilic contributions to the total POPS-R SASAs. The NACS and POPS-R SASAs buried by the overlap between different parts of 30S are reported in Figure 2, and POPS-R clearly reproduces the NACS patterns. Even small interactions, such as those of S2, S5 and S7 with the central domain and of S11 and S12 with the 3′-minor domain, are detected by POPS-R which only fails to detect the interactions of S8 with domain 5′, and S5 with the 3′-minor domain. The average absolute error on the relative amount of total SASA buried upon interaction, aaebTot (defined below), is only 4%.
Figure 2.
Naccess and POPS-R SASAs buried by the overlap between different components of 30S from the high resolution structure (10). Black and gray bars correspond to the Naccess hydrophobic and hydrophilic SASAs, respectively, while red and pink bars are the corresponding POPS-R SASAs. Cntrl, 3′-M and 3′-m indicate the central, 3′-major and 3′-minor domains, respectively.
aaebTot =
The absolute error on the relative amount of POPS-R hydrophobic (and hydrophilic) SASA buried upon interaction and relative to the NACS values, aaebPhob (defined below), is 9%.
aaebPhob =
where APhob,Bur and ATot,Bur are the hydrophobic and total SASAs buried upon interaction. We can conclude that POPS-R is able to give almost quantitative estimation of: (i) isolated SASAs; (ii) burial at surface due to interaction between molecules/fragments; and (iii) partitioning into hydrophobic and hydrophilic contributions.
The POPS-A and POPS-R versions and their optimized parameters will be available at the web site http://mathbio.nimr.mrc.ac.uk/~ffranca/POPS. The CPU time required to calculate the SASAs of 30S, 50S and 70S on a Pentium-III 800 MHz processor is equal to 30, 63 and 188 s, respectively. These CPU times include the preprocessing steps.
Key interactions in the ribosome
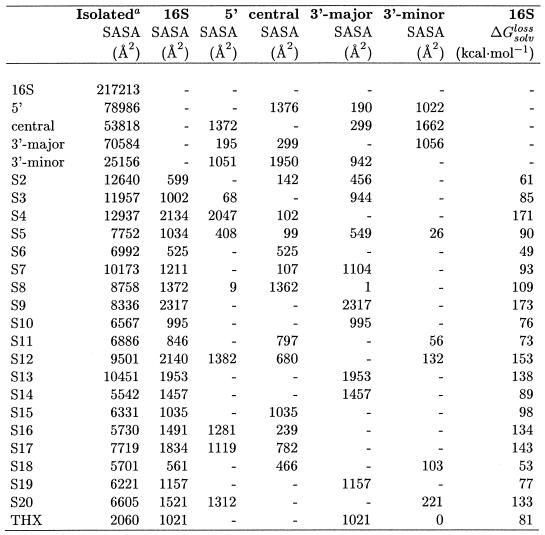
The SASAs buried upon interaction of the different components (proteins and RNA domains) within 30S and 50S from the 70S structure (12) are reported in Table 2A. In addition, the free energy of solvation loss upon complex formation (Δ![]() ) is reported for each protein.
) is reported for each protein.
Table 2A. Solvent accessible surface area buried upon interaction of various components of 30S as calculated from the 70S crystallographic structure.
The free energy of solvation loss upon complex formation, Δ![]() is also reported (see Materials and Methods). Nomenclature follows that in Yusupov et al. (12).
is also reported (see Materials and Methods). Nomenclature follows that in Yusupov et al. (12).
aSASA of the isolated component.
Proteins in the 30S subunit interact with 809 nt of 16S, indicating that almost 50% of the nucleotides are in contact with an amino acid, while for the 50S there are 956 of these contacts (only 32% of nucleotides interact with an amino acid). The crystallographic study of the 50S subunit from Haloarcula marismortui reported 1157 protein/RNA van der Waals contacts (8).
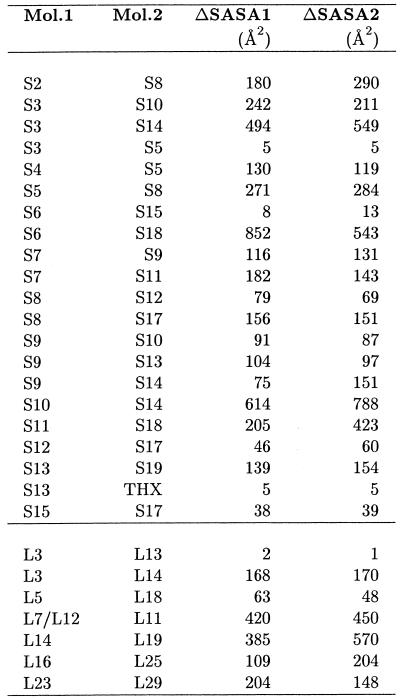
Figure 2 and Table 2A and 2B indicate that only the 3′-minor domain of 16S is not involved in any significant interaction with proteins. Only three proteins show significant surface burial with more than one domain. These are S5 with the 5′- and 3′-major domains, and S12 and S17 with the 5′ and central domains. The 30S subunit also presents the largest number of protein–protein interactions since ∼8300 Å2 of SASA are buried by overlaps between S-proteins, while only 2900 Å2 of SASA are buried by L-protein overlaps in 50S. Solvent accessible buried areas upon interaction between 30S proteins, as calculated from the 70S structure, are reported in Table 3. It is interesting to note that the largest buried areas are observed for proteins S6 and S18, which have been demonstrated to form a heterodimer with a key role in the cooperative binding to the S15–rRNA complex during the ordered assembly of the ribosome. Large buried areas are also observed for proteins S3–S14 and S10–S14; these are all tertiary binding proteins (33) and their mechanism of binding could be similar to the one proposed for S6 and S18.
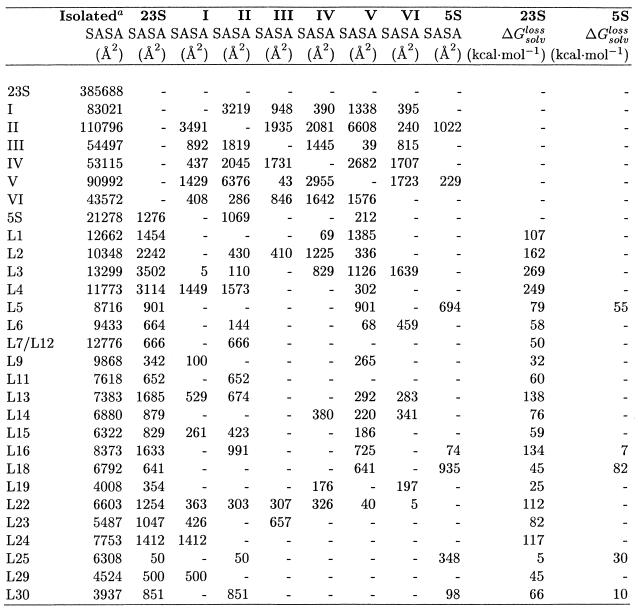
Table 2B. Same as Table 2A, but for the 50S ribosome.
aSASA of the isolated component.
Table 3. SASA buried upon interaction of the proteins of the 30S and 50S subunits as calculated from the 70S crystallographic structure.
In the case of the large subunit, POPS-R is able to detect all the main interactions described for the high resolution structure of the H.marismortui 50S subunit (8). For this reason, POPS-R can be used as a helpful tool in the refinement of low resolution structures, since it is able to identify key interactions starting from less-resolved structures.
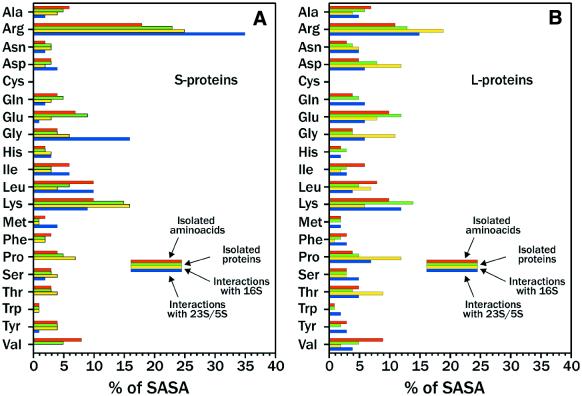
In Figure 3A and B we report the relative contribution of each amino acid of the S- and L-proteins to: (i) the total SASA of the isolated amino acids of the S- and L-proteins (calculated with NACS as Ala-Xaa-Ala sequences); (ii) the total POPS-R SASA of the isolated S- and L-proteins as folded in the 70S structure; (iii) the total POPS-R SASA buried upon interaction of the S- and L-proteins with the RNAs of their own subunit; and (iv) the total POPS-R SASA buried upon interaction of S- and L-proteins with the RNAs of the other subunit. Passing from the isolated amino acid to the folded one in both S- and L-proteins, hydrophilic residues like Arg and Lys increase their solvent accessibility, while hydrophobic ones such as Ala, Leu, Ile and Val become considerably buried.
Figure 3.
Relative contribution of each amino acid of (A) S- and (B) L-proteins to: red bars, total SASA of the isolated amino acids of S- and L-proteins; green bars, total SASA of isolated S- and L-proteins; yellow bars, total SASA buried upon interaction of S- and L-proteins with 16S; blue bars, total SASA buried upon interaction of S- and L-proteins with 23S/5S.
Arginine-rich motifs are known to have high affinity and specificity for RNA (34,35). Indeed, we found that Arg and Lys residues play a key role in these interactions. In fact, for both the S- and L-proteins, Arg residues contribute mostly to interactions with the RNA of the other subunit, while Lys residues contribute mostly to interactions with the RNA of the same subunit.
The poly-functionality of the guanidinium group makes this residue an optimal moiety for protein–RNA interactions, and the long arm of the Arg sidechain can effectively direct the guanidinium group towards acceptors sites of the other subunit. Glycines in the plots show a trend similar to Arg residues, and this could be ascribed to a necessity of flexibility for optimizing interactions with the RNA of the other subunit.
As for the analysis of RNA–RNA interactions, the plots of Figure 2 show that interactions between RNA–RNA domains bury, generally, more hydrophilic surface (61 and 68% according to NACS and POPS-R, respectively) than protein–RNA interactions. Domain 3′-minor interacts substantially with all the other domains, but a greater fraction of its buried area is in common with the central domain. The only other strong domain–domain interaction occurs between the 5′ and the central domains. The most frequently occurring nucleotides in ribosomal RNAs are adenines, followed by cytosines, guanines and uridines. Adenine nucleotides are also mostly involved in domain–domain interactions since 25% of the SASA buried in the inter-domains interactions of both 16S and 23S belongs to A (to be compared with only 20% of adenines in the isolated SASAs of 16S and 23S). It has been observed that adenine is a key residue for helix packing in RNA (36), showing a surface complementarity with the minor groove that optimizes a combination of van der Waals, electrostatic and hydrogen bonding contacts. In addition, adenines are abundant in the recurrent loop E motif present within the three-way junction loop that binds protein S7 to 16S and is involved in RNA–RNA interactions (37).
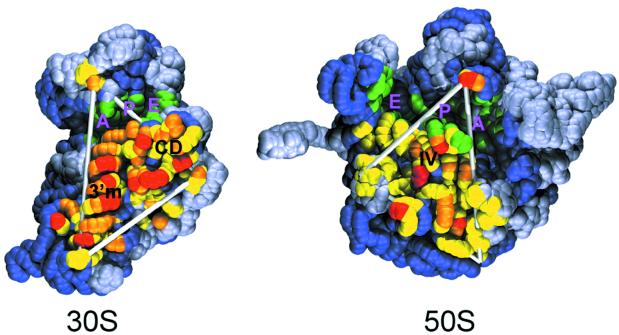
The overall SASA buried at the interface of the 30S and 50S subunits amounts to 8500 Å2, and it is shown in Figure 4. The POPS-R surface at the interface of the 30S and 50S subunits forms a triangular patch (Fig. 4, fitting in the white triangle) (12) where the most exposed residues (in red) belong mainly to the 3′-minor domain. This allows us to speculate that the 3′-minor domain role is mainly to interact with the other subunit. Together with observed electrostatic complementarity of the interface residues (38), exposed surface complementarity of RNA domains is striking. The 70S residues interacting with the tRNAs are marked in green (Fig. 4), and form a deep groove which, in the case of the 30S, separates the head from the base. Almost all the 30S–50S interactions occur in the lower part of the triangle, below the tRNA binding sites. The presence of only one 30S–50S anchoring point above the tRNAs binding groove could allow for relatively easy movements of these regions.
Figure 4.
Interface view of the 30S and 50S subunits from the 70S crystallographic structure (12). Yellow, orange and red spheres correspond to residues which, upon 30S and 50S association, bury <37.5 Å2, between 37.5 and 75 Å2, and >75 Å2 of SASA, respectively. Green spheres correspond to residues that interact with the A-, E- and P-tRNAs.
The nucleotide–nucleotide contacts at the interface involve mostly G–A bases (48 contacts), followed by G–G bases (40 contacts), and U–G and C–A bases (28 contacts in both cases). It is well known that non-canonical Watson–Crick base pairs participate in a large number of edge-to-edge interactions with one or more bases (39).
Ribosome–tRNA interactions
When interactions of 30S and 50S with tRNAs were considered, we used POPS-R for the two ribosome subunits, while we used the POPS-A approach for the tRNAs, since the tRNAs were resolved at atomic level.
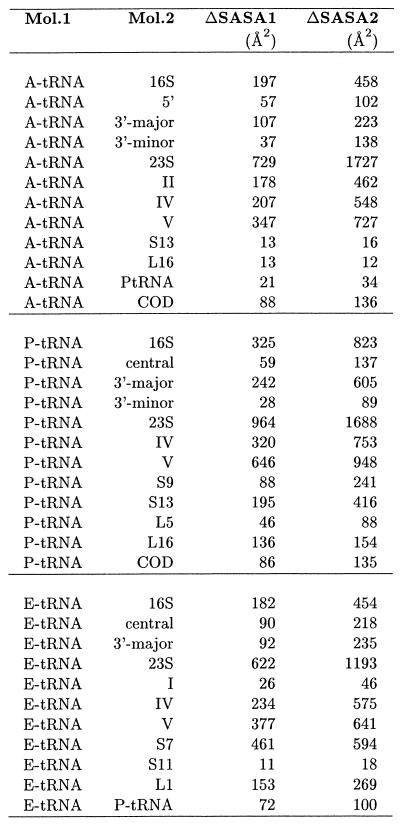
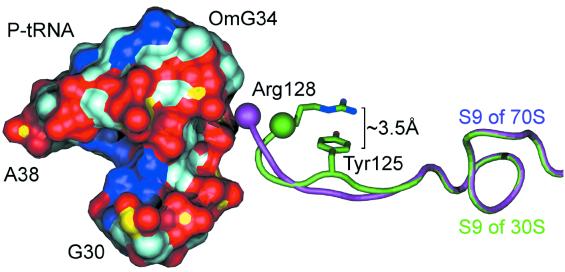
POPS-R is able to clearly identify all previously reported key interactions between 70S and tRNAs (12). In addition, we observe a number of further interactions and we are able to identify some, as yet undetected, conformational changes with respect to the isolated structure of 30S. In fact, clear differences in the binding modes of A-, P- and E-tRNA to the ribosome are detected. The SASAs of interaction between 70S and the A-, P- and E-tRNAs are close to 3000, 5000 and 4000 Å2, respectively. Most strikingly, proteins represent only 1% of the surface of interaction of the A-site. This fraction increases to 26% in the P-site, and reaches its maximum at 35% in the E-site. This gradient in the amount of proteic surface at the tRNAs binding sites could be needed in order to allow for the translocation mechanism to occur. In Table 4 the buried areas upon interaction of tRNAs and 30S and 50S components with tRNAs are reported. As already pointed out, both S- and L-proteins interact with tRNAs (12), and proteins S7, S9 and S13 are found to interact with the anticodon region of the tRNAs. The interaction between S7 and E-tRNA involves quite a high number of proteic residues (from Val75 to Gln86, and from Asp140 to Tyr151) which interact only with one stretch of E-tRNA (from G30 to G42). In addition to this, we observe the participation of proteins L1 and L16 to the interaction with E- and P-tRNAs. One of our most interesting findings concerns protein S9, which protrudes its terminal residue (Arg128) to interact with nucleotides OMC32-U33-OMG34-A35 in the anticodon region of P-tRNA (OMC, 2′-O-methylcytidine; OMG, 2′-O-methylguanosine). This arginine is universally conserved and it is found to form a hydrogen bond with a phosphate of A35 (12). The differences between the S9 terminal arm in the 70S structure compared with the 30S high resolution structure (10) are quite remarkable. By superimposing S9/30S on S9/70S we observe a decrease of ∼200 Å2 of the area buried in the interaction with P-t RNA (Fig. 5). This is mainly due to a movement of 3.3 Å of the terminal Arg128 of S9 in order to reach the negatively charged surface of P-tRNA. In the 30S subunit this arginine has its guanidinium group folded back in a cation-π interaction with Tyr125 of the same chain (Fig. 5). These intramolecular interactions have been found to be strongly recurrent in the PDB and they are recognized as important non-covalent binding interactions (40).
Table 4. SASA buried upon interaction of the tRNAs with the various components of the 30S and 50S subunits as calculated from the 70S crystallographic structure.
Figure 5.
Detailed view of the S9 P-tRNA interaction. Only the surface of the nucleotide stretch between G30 and A38 is reported for P-tRNA. Red, dark blue, light blue and yellow surfaces correspond to O, N, C and P atoms, respectively. The purple ribbon corresponds to the tail of S9 of 70S, while the green ribbon corresponds to the tail of 30S’s S9 after superposition with 70S’s S9. The sidechains of Arg128 and of Tyr125 of S9 of 30S are also reported. The purple and green spheres are centered at the Cα of Arg128.
The interaction between S13 and P-tRNA involves the C-terminal region of S13 from Thr116 to Lys126. This region contains the Lys120-Lys121-Lys122 and Arg125-Lys126 motifs. A comparison similar to that carried out for S9 gives a decrease in the buried SASA due to the interaction of S13/30S with P-tRNA of 250 Å2. The reduction is due to a movement of the C-terminal tail residues of S13 which swing away from the anticodon region of P-tRNA. The conformational changes that POPS-R reveal might be a sign of movements occuring during translation, similar to those of the lever in a watch.
In the 50S, contacts only occur between L1 and A-tRNA and L16 and P-tRNA. The Arg52-Arg53-Ser54 motif is mostly involved in the interaction of L1 with the elbow of A-tRNA around 5MU54 (5MU, 5-methyluridine), while Ser125 interacts (probably through a H-bond) with atom O4 of C56. The interaction of L16 with P-tRNA again involves a H-bond donor residue, Ser22, which overlaps with the ribose of A64, while Asp97 and Asp99 interact with the phosphates of G1 and C2 of P-tRNA.
Energetics of observed interactions
Only limited experimental thermodynamic data are available for the interaction of S- and L-proteins with ribosomal RNAs, and the ΔG values of these interactions are always close to –10 kcal mol–1 (33,41,42). Association requires a negative ΔG for the interaction and, therefore, an unfavorable energetic term due to the loss of solvation (Δ![]() ) must be overcome. POPS-R can provide an estimate of the upper bound magnitude for this term, evaluated by assuming rigid body association. Conformational changes in the unassociated species can reduce this value (43). Considering that the crystal structure of the isolated 30S and 50S are quite similar to 70S (12) we have good reasons to consider this approximation valid in this context.
) must be overcome. POPS-R can provide an estimate of the upper bound magnitude for this term, evaluated by assuming rigid body association. Conformational changes in the unassociated species can reduce this value (43). Considering that the crystal structure of the isolated 30S and 50S are quite similar to 70S (12) we have good reasons to consider this approximation valid in this context.
The magnitude of the Δ![]() values reported in Table 2A suggests that a significant amount of free energy of solvation is lost for any of the interactions considered, and indicate that strong stabilizing interactions are required to obtain association. This conclusion offers an explanation for the high fraction of Arg and Lys residues at the protein–RNA interface of the ribosome already found in other protein–nucleic acids complexes. These positively charged residues promote association through strong interactions with the negatively charged phosphates (44). Hydrogen bonds between proteins and RNAs represent another key stabilizing factor for the complexes. Previous statistical analysis of protein–nucleic acid complexes indicated the occurrence of approximately one intermolecular H-bond per 125 Å2 of interface area (35,44).
values reported in Table 2A suggests that a significant amount of free energy of solvation is lost for any of the interactions considered, and indicate that strong stabilizing interactions are required to obtain association. This conclusion offers an explanation for the high fraction of Arg and Lys residues at the protein–RNA interface of the ribosome already found in other protein–nucleic acids complexes. These positively charged residues promote association through strong interactions with the negatively charged phosphates (44). Hydrogen bonds between proteins and RNAs represent another key stabilizing factor for the complexes. Previous statistical analysis of protein–nucleic acid complexes indicated the occurrence of approximately one intermolecular H-bond per 125 Å2 of interface area (35,44).
The value of Δ![]() term related to the interaction of the whole 30S and 50S to form 70S is quite high (298 kcal mol–1) and the complessive experimental ΔG of interaction in the 70S of Escherichia coli is about –12 kcal mol–1 (45). The high Δ
term related to the interaction of the whole 30S and 50S to form 70S is quite high (298 kcal mol–1) and the complessive experimental ΔG of interaction in the 70S of Escherichia coli is about –12 kcal mol–1 (45). The high Δ![]() we estimated is consistent with the high ionic strength required to prevent ribosome denaturation, since one of the major roles of cations present in solutions [often Mg2+(45)] is to reduce repulsive interactions between phosphates.
we estimated is consistent with the high ionic strength required to prevent ribosome denaturation, since one of the major roles of cations present in solutions [often Mg2+(45)] is to reduce repulsive interactions between phosphates.
CONCLUSIONS
We have presented and validated two novel approaches for the analytical calculation of the SASA of proteins and nucleic acids at atomic and residue levels, named POPS-A and POPS-R, respectively. The analytical formulation on which POPS-A is based is simple, easily derivable and fast to compute. It has already been proven to be well suited for practical use in MD simulations as an approximation to the first solvation shell. The two models have been trained to approximate the atomic and residue accurate NACS SASAs of a database of 89 biological molecules. The cross-validation resampling procedure we followed indicated that POPS-A predicts atomic SASAs with an aae of 2.6 Å2. The POPS-A approach has been implemented in the GROMOS96 (46) package as part of the implicit solvation contribution (to be published).
The residue based approach POPS-R was validated through a comparison with accurate all-atoms approaches. We used the high resolution structure of the 30S ribosome subunit (10) for calculating atomic areas with NACS, and then compared these with residue areas with POPS-R. The aape is 5% for the 30S components. Our coarse-grained model is therefore able to detect key interactions with a sensitivity not far from all-atoms models.
POPS-R was used to examine, in detail, the structures of the 70S, 30S and 50S ribosomes. Most of the interaction within the subunits and at their interfaces were clearly identified. Some interesting differences between 30S alone and within the 70S were highlighted. Owing to the presence of the P-tRNA in the 70S ribosome, conformational rearrangements occur within the subunits, exposing Arg and Lys residues to negatively charged binding sites of P-tRNA.
In our opinion, POPS-R can be a valuable tool for the structural biology community in filtering key interactions of large macromolecular assemblages and in complementing their refinement process. On the other hand, POPS-A can be used for more detailed calculations and in combination with accurate computer simulations methods.
Acknowledgments
ACKNOWLEDGEMENTS
We are grateful to J. Kleinjung, A. Lane, S. Martin and A. Ramos for discussions and critical reading of the manuscript. We would also like to thank R. Ali for assembling the protein database. L.C. thanks the CIMCF of Universitá Federico II, Naples, for technical support.
REFERENCES
- 1. International Human Genome Sequencing Consortium (2001) Initial sequencing and analysis of the human genome. Nature, 409, 860–921. [DOI] [PubMed] [Google Scholar]
- 2.Brenner S. and Levitt,M. (2000) Expectations from structural genomics. Protein Sci., 9, 197–200. [DOI] [PMC free article] [PubMed] [Google Scholar]
- 3.Doudna J. (2000) Structural genomics of DNA. Nature Struct. Biol., Suppl 7, 954–956. [DOI] [PubMed] [Google Scholar]
- 4.Marcotte E., Pellegrini,M., Thompson,M., Yeates,T. and Eisenberg,D. (1999) A combined algorithm for genome-wide prediction of protein function. Nature, 402, 83–86. [DOI] [PubMed] [Google Scholar]
- 5.Thornton J., Todd,A., Milburn,D., Borkakoti,N. and Orengo,C. (2000) From structure to function: approaches and limitations. Nature Struct. Biol., Suppl 7, 991–994. [DOI] [PubMed] [Google Scholar]
- 6.Darst D. (2001) Bacterial RNA polymerase. Curr. Opin. Struct. Biol., 11, 155–162. [DOI] [PubMed] [Google Scholar]
- 7.Luger K., Mader,A., Richmond,R., Sargent,D. and Richmond,T. (1997) Crystal structure of the nucleosome core particle at 2.8 Å resolution. Nature, 389, 251–260. [DOI] [PubMed] [Google Scholar]
- 8.Ban N., Nissen,P., Hansen,J., Moore,P. and Steitz,T. (2000) The complete atomic structure of the large ribosomal subunit at 2.4 Å resolution. Science, 289, 905–920. [DOI] [PubMed] [Google Scholar]
- 9.Nissen P., Hansen,J., Ban,N., Moore,P. and Steitz,T. (2000) The structural basis of ribosome activity in peptide bond synthesis. Science, 289, 920–930. [DOI] [PubMed] [Google Scholar]
- 10.Wimberly B., Brodersen,D., Clemons,W., Carter,A., Vonrhein,C., Hartsch,T. and Ramakrishnan,V. (2000) Structure of the 30S ribosomal subunit. Nature, 407, 327–339. [DOI] [PubMed] [Google Scholar]
- 11.Schluenzen F., Tocilj,A., Zarivach,R., Harms,J., Gluehmann,M., Janell,D., Bashan,A., Bartels,H., Agmon,I., Franceschi,F. and Yonath,A. (2000) Structure of functionally activated small ribosomal subunit at 3.3 Å resolution. Cell, 102, 615–623. [DOI] [PubMed] [Google Scholar]
- 12.Yusupov M., Yusupova,G., Baucom,A., Lieberman,K., Earnest,T., Cate,J. and Noller,H. (2001) Crystal structure of the ribosome at 5.5 Å resolution. Science, 292, 883–896. [DOI] [PubMed] [Google Scholar]
- 13.Puglisi J., Blanchard,S. and Green,R. (2000) Approaching translation at atomic resolution. Nature Struct. Biol., 7, 855–861. [DOI] [PubMed] [Google Scholar]
- 14.Kauzmann W. (1959) Some factors in the interpretation of protein denaturation. Adv. Protein Chem., 14, 1–64. [DOI] [PubMed] [Google Scholar]
- 15.Jones S. and Thornton,J. (1997) Analysis of protein-protein interaction sites using surface patches. J. Mol. Biol., 272, 121–132. [DOI] [PubMed] [Google Scholar]
- 16.Robertson A.D. and Murphy,K.P. (1997) Protein structure and the energetics of protein stability. Chem. Rev., 97, 1251–1267. [DOI] [PubMed] [Google Scholar]
- 17.Bowie J., Lüthy,R. and Eisenberg,D. (1991) A method to identify protein sequences that fold into a known three-dimensional structure. Science, 253, 164–170. [DOI] [PubMed] [Google Scholar]
- 18.Fraternali F. and van Gunsteren,W. (1996) An efficient mean solvation force model for use in molecular dynamics simulations of proteins in aqueous solution. J. Mol. Biol., 256, 939–948. [DOI] [PubMed] [Google Scholar]
- 19.Kleinjung J., Bayley,P. and Fraternali,F. (2000) Leap-dynamics: efficient sampling of conformational space of proteins and peptides in solution. FEBS Lett., 470, 257–262. [DOI] [PubMed] [Google Scholar]
- 20.Ferrara P. and Caflish,A. (2000) Folding simulations of a three-stranded antiparallel β-sheet peptide. Proc. Natl Acad. Sci. USA, 97, 10780–10785. [DOI] [PMC free article] [PubMed] [Google Scholar]
- 21.Gsponer J. and Caflish,A. (2001) Role of native topology investigated by multiple unfolding simulations of four SH3 domains. J. Mol. Biol., 309, 285–298. [DOI] [PubMed] [Google Scholar]
- 22.Hasel W., Hendrikson,T. and Still,W. (1988) A rapid approximation to the solvent accessible surface areas of atoms. Tetrahedron Comput. Methodol., 1, 103–116. [Google Scholar]
- 23.Hubbard S., Campbell,S. and Thornton,J. (1991) Molecular recognition. Conformational analysis of limited proteolytic sites and serine proteinase protein inhibitors. J. Mol. Biol., 220, 507–530. [DOI] [PubMed] [Google Scholar]
- 24.Still W., Tempczyk,A., Hawley,R. and Hendrickson,T. (1990) Semianalytical treatment of solvation for molecular mechanics and dynamics. J. Am. Chem. Soc., 112, 6127–6129. [Google Scholar]
- 25.Wodak S. and Janin,J. (1980) Analytical approximation to the accessible-surface area of proteins. Proc. Natl Acad. Sci. USA, 77, 1736–1740. [DOI] [PMC free article] [PubMed] [Google Scholar]
- 26.Friedl H. and Stampfer,E. (2002) Cross-validation. In El-Shaarawi,A. and Piegorsch,W.E. (eds), Encyclopedia of Environmetrics. Wiley, Chichester, UK, pp. 452–460.
- 27.Friedl H. and Stampfer,E. (2002) Jackknife resampling. In El-Shaarawi,A. and Piegorsch,W.E. (eds), Encyclopedia of Environmetrics. Wiley, Chichester, UK, pp. 1089–1098.
- 28.Friedl H. and Stampfer,E. (2002) Resampling methods. In El-Shaarawi,A. and Piegorsch,W.E. (eds), Encyclopedia of Environmetrics. Wiley, Chichester, UK, pp. 1768–1770.
- 29.Efron B. and Gong,G. (1983) A leisurely look at the bootstrap, the jackknife and the cross-validation. The American Statistician, 37, 36–48. [Google Scholar]
- 30.Wesson L. and Eisenberg,D. (1992) Atomic solvation parameters applied to molecular dynamics of proteins in solution. Protein Sci., 1, 227–235. [DOI] [PMC free article] [PubMed] [Google Scholar]
- 31.Nolde E., Arseniev,A. and Efremov,R. (1997) Atomic solvation parameters for protein in a membrane environment. Application to transmembrane α-helices. J. Biomol. Struct. Dyn., 15, 1–18. [DOI] [PubMed] [Google Scholar]
- 32.Weiser J., Shenkin,P. and Still,W. (1999) Approximate solvent-accessible surface areas from tetraedrally directed neighbor densities. Biopolymers, 50, 373–380. [DOI] [PubMed] [Google Scholar]
- 33.Recht M. and Williamson,J. (2001) Central domain assembly: thermodynamics and kinetics of S6 and S18 binding to an S15-RNA complex. J. Mol. Biol., 313, 35–48. [DOI] [PubMed] [Google Scholar]
- 34.Cheng A., Calabro,V. and Frankel,A. (2001) Design of RNA-binding proteins and ligands. Curr. Opin. Struct. Biol., 11, 478–484. [DOI] [PubMed] [Google Scholar]
- 35.Jones S., Daley,D., Luscombe,N., Berman,H. and Thornton,J. (2001) Protein–RNA interactions: a structural analysis. Nucleic Acids Res., 29, 943–954. [DOI] [PMC free article] [PubMed] [Google Scholar]
- 36.Doherty E., Batey,R., Masquida,B. and Doudna,J. (2001) A universal mode of helix packing in RNA. Nature Struct. Biol., 8, 339–343. [DOI] [PubMed] [Google Scholar]
- 37.Leontis N. and Westhof,E. (1998) A common motif organizes the structure of multi-helix loops in 16S and 23S ribosomal RNAs. J. Mol. Biol., 283, 571–583. [DOI] [PubMed] [Google Scholar]
- 38.Baker N., Sept,D., Joseph,S., Holst,M. and McCammon,J. (2001) Electrostatics of nanosystems: application to microtubules and the ribosome. Proc. Natl Acad. Sci. USA, 98, 10037–10041. [DOI] [PMC free article] [PubMed] [Google Scholar]
- 39.Leontis N. and Westhof,E. (2001) Geometric nomenclature and classification of RNA base pairs. RNA, 7, 499–512. [DOI] [PMC free article] [PubMed] [Google Scholar]
- 40.Gallivan J. and Dougherty,D. (1999) Cation-π interactions in structural biology. Proc. Natl Acad. Sci. USA, 96, 9459–9464. [DOI] [PMC free article] [PubMed] [Google Scholar]
- 41.Mougel M., Ehresmann,B. and Ehresmann,C. (1986) Binding of Escherichia coli ribosomal protein S8 to 16S rRNA: kinetic and thermodynamic characterization. Biochemistry, 25, 2756–2765. [DOI] [PubMed] [Google Scholar]
- 42.Draper D. (1990) Structure and function of ribosomal protein-RNA complexes: thermodynamic studies. In Hill,W., Dahlberg,A., Garrett,R., Moore,P., Schlessinger,D. and Editors,J.R. (eds), The Ribosome Structure, Function and Evolution. American Society of Microbiology, pp. 160–167.
- 43.Spolar R. and Record,M. (1994) Coupling of local folding to site-specific binding of proteins to DNA. Science, 263, 769–770. [DOI] [PubMed] [Google Scholar]
- 44.Nadassy K., Wodak,S. and Janin,J. (1999) Structural features of protein-nucleic acid recognition sites. Biochemistry, 38, 1999–2017. [DOI] [PubMed] [Google Scholar]
- 45.Wishnia A. and Boussert,A. (1977) The non-specific role of Mg2+ in ribosomal subunit association: kinetics and equilibrium in the presence of other divalent metal ions. J. Mol. Biol., 116, 577–591. [DOI] [PubMed] [Google Scholar]
- 46.van Gunsteren W., Billeter,S., Eising,A., Hünenberger,P., Krüger,P., Mark,A., Scott,W. and Tironi,I. (1996) Biomolecular Simulations: the GROMOS96 Manual and User Guide BIOMOS b.v., 1st Edn. Laboratory of Physical Chemistry, ETH Zentrum, Groningen, German.
- 47.Orengo C., Michie,A., Jones,S., Jones,D., Swindells,M. and Thornton,J. (1997) Cath—a hierarchic classification of protein domain structures. Structure, 5, 1093–1108. [DOI] [PubMed] [Google Scholar]


