Abstract
Two-dimensional conductive metal–organic frameworks (2D c-MOFs) with high electrical conductivity and tunable structures hold significant promise for applications in metal-ion batteries. However, the construction of 3D interpenetrated c-MOFs for applications in metal-ion batteries is rarely reported. Herein, a 3D four-fold interpenetrated c-MOF (Cu-DBC) constructed by conjugated and contorted dibenzo[g,p]chrysene-2,3,6,7,10,11,14,15-octaol (DBC) ligands is explored as an advanced cathode material for sodium-ion batteries (SIBs) for the first time. Notably, the expanded conjugated and four-fold interpenetrating structure endows Cu-DBC with transmission channels for electrons and sufficient spacing for sodium ion diffusion. As expected, the Cu-DBC cathode showcases higher specific capacity (120.6 mA h g−1, 0.05 A g−1) and robust cycling stability (18.1% capacity fade after 4000 cycles, 2 A g−1). Impressively, the Cu-DBC cathode also exhibits good electrochemical properties at extreme temperatures (−20 °C and 50 °C). A series of in/ex situ characterizations and systematic theoretical calculations further reveal the sodium-ion storage mechanism of Cu-DBC, highlighting a three-electron redox process on the redox-active [CuO4] units. This work provides valuable insights for exploring and enriching the applications of 3D interpenetrated c-MOFs in metal-ion batteries.
A 3D four-fold interpenetrated conductive metal–organic framework (Cu-DBC) is reported for the first time as a cathode for sodium-ion batteries, which enriches the utility of 3D interpenetrated conductive metal–organic framework in the field of metal-ion batteries.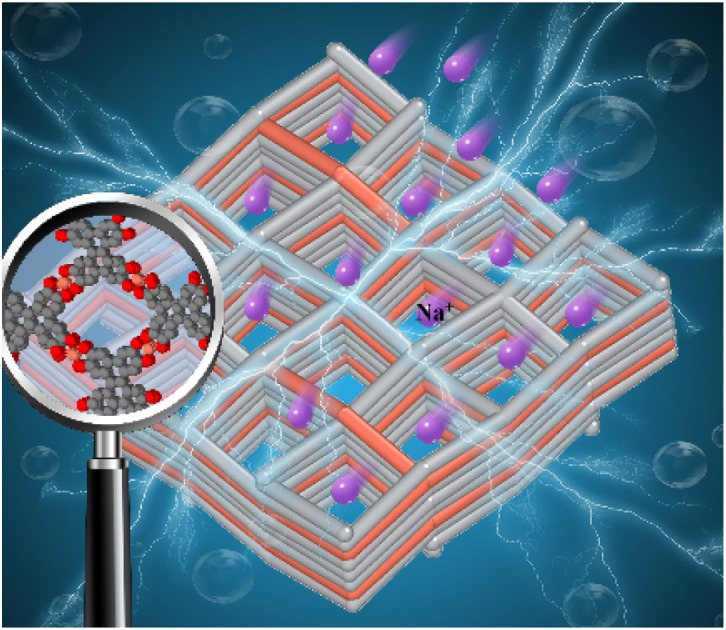
Introduction
Currently, lithium-ion batteries (LIBs) have achieved significant success in both portable electronics and electric automobiles due to their superior cycling stability and energy density, and are also being considered for grid-scale energy storage.1 However, in view of the increasing scarcity of lithium minerals and their uneven distribution around the world, LIBs are unlikely to be a sustainable approach to the need for grid-scale energy storage.2 Sodium-ion batteries (SIBs) are regarded as viable substitutes to LIBs for grid-scale energy storage applications owing to the natural abundance of sodium and the similarity of their working mechanism to that of LIBs.3 However, the intercalation of Na+ with a larger radius poses a challenge for crystal structures of inorganic electrode materials.4 Therefore, exploiting advanced electrode materials remains the primary task for developing SIBs.
Two-dimensional conductive metal–organic frameworks (2D c-MOFs), which are assembled from π-conjugated organic ligands with transition metal ions to constitute 2D layer stacks, have attracted wide attention in various fields owing to their structural flexibility, intrinsic porosity, remarkable electrical conductivity, and high charge carrier mobility.5 Most importantly, the overlap between the π orbitals of the conjugated ligands and d orbitals of the metal nodes allows the delocalization of electrons throughout the system, endowing 2D c-MOFs with intrinsic conductivity and stability.6 In particular, the coordinated centers of 2D c-MOFs provide redox sites that can accept and release electrons, making them promising candidates as electrode materials for metal-ion batteries.7 To date, the reported 2D c-MOFs used in the battery field are derived exclusively from planar conjugated ligands, such as benzene,8 triphenylene,9 tricycloquinazoline,10 and hexaazanonaphthalene.11 However, these commonly used planar conjugated ligands often complicate the synthesis of high-quality 2D c-MOFs due to their poor solubility in organic solvents.12 Moreover, the dense layer stacks of 2D c-MOFs constructed by planar conjugated ligands are detrimental to exposing active sites and intercalating ions with a large radius.13 In this context, nonplanar conjugated ligands are attractive alternatives for building 3D c-MOFs with fine-tuned properties. Their good solubility and concave–convex self-complementarity enable the preparation of 3D c-MOFs with highly ordered stacked column structures.14 Additionally, 3D c-MOFs based on nonplanar conjugated ligands possess interpenetrating, wavy or contorted topologies, which can expose the unique concave and convex faces that facilitate electronic communication and ion storage.15 Recent studies have demonstrated that 3D c-MOFs incorporating nonplanar dibenzo-[g,p]chrysene and hexabenzocoronene ligands with interpenetrating or wavy topology showcase good charge transport properties comparable to the planar counterparts, which are typical features required of electrode materials for metal-ion batteries.16 Therefore, the development of nonplanar 3D c-MOFs as electrode materials for batteries is anticipated, and could overcome the challenges posed by the intercalation of Na+ with its larger radius, thus enabling more active site exposure to achieve robust SIBs.
Herein, we report an electrochemically active and nonplanar 3D c-MOF (Cu-DBC) composed of a contorted conjugated catechol-based linker (dibenzo-[g,p]chrysene-2,3,6,7,10,11,14,15-octaol, 8OH-DBC) and Cu nodes, as an advanced cathode material for SIBs for the first time. The uniqueness of the nonplanar 8OH-DBC ligand could result in the formation of Cu-DBC with a quadruple interpenetration structure, which provides sufficient layer spacing to withstand successive sodium-ion intercalation. Consequently, Cu-DBC exhibits good capacity (120.6 mA h g−1, 0.05 A g−1) and impressive cycling stability (18.1% capacity fade for 4000 cycles at 2 A g−1). Moreover, even at a relatively high-mass loading of 2.5 mg cm−2, Cu-DBC could retain a capacity of 90.7 mA h g−1 (0.2 A g−1) and exhibit stable cycling with 3.2% capacity degradation over 300 cycles. Additionally, the Cu-DBC cathode also displays impressive performance when tested at −20 °C and 50 °C, making it promising in practical applications.
Results and discussion
Theoretical analysis
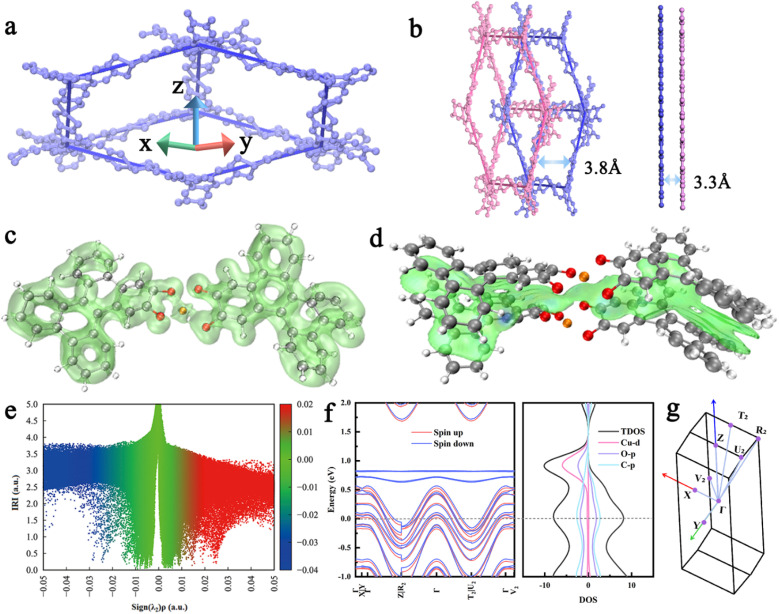
To demonstrate the superiority of interpenetrating 3D c-MOFs, Cu-DBC was chosen as a model to theoretically evaluate the possibility and feasibility of its application to metal-ion batteries. The interpenetrating network of Cu-DBC consists of contorted and conjugated DBC units linked through Cu ions, which induces electron delocalization in a three-dimensional direction (Fig. 1a). The distance between the interpenetrated layers of Cu-DBC is larger than that of densely packed 2D c-MOFs (Cu-HHTP, HHTP = 2,3,6,7,10,11-hexahydroxytriphenylene) (Fig. 1b). Fortunately, the interpenetrating structure enables Cu-DBC to form an informal AA stacking structure, thereby enhancing the electronic coupling between the layers. To further investigate the properties of Cu-DBC, its electronic structure was analyzed using a simplified structural model via DFT calculations. The calculated localized orbital locator-π (LOL-π) isosurface (Fig. 1c) of Cu-DBC shows that the π electrons are highly delocalized over the conjugate plane. The isosurface map of the independent gradient model based on Hirshfeld partition (IGMH) and the scatter map between the interaction region indicator (IRI) and sign(λ2)ρ both express the π–π interaction between the adjacent interpenetrations in Cu-DBC, which are colored green (Fig. 1d and e). In addition, the electronic band structure of Cu-DBC demonstrates that the Fermi level crosses the valence bands in the Γ–Z, Γ–R2, Γ–T2, and Γ–U2 directions (Fig. 1f and g). This indicates that Cu-DBC exhibits metallic properties along the z-axis. These analyses manifest a high degree of electron delocalization in Cu-DBC, which promotes efficient charge transport. Moreover, the density of states (DOS) of Cu-DBC illustrates that the valence band is constituted of the 2p orbitals of O and C, while the aforementioned orbitals and Cu 3d orbitals constitute the conduction band. It is evident from these observations that the electron delocalization is induced by π–d conjugation. The metallic behavior along the z-axis, together with the high degree of electron delocalization, suggests that the interpenetrating Cu-DBC may exhibit much better charge transport properties.
Fig. 1. (a) Diagram of Cu-DBC in one-fold interpenetration. (b) Diagram of double interpenetration for Cu-DBC and double layers for Cu-HHTP. (c) LOL-π isosurface of Cu-DBC segments. (d) Sign(λ2)ρ of Cu-DBC corresponding to IGMH analyses. (e) Colored scatter map between IRI and sign(λ2)ρ. (f) Electronic band structure and density of states (DOS) of Cu-DBC. (g) The Brillouin zone of the Cu-DBC unit cell.
Synthesis and characteristics of Cu-DBC
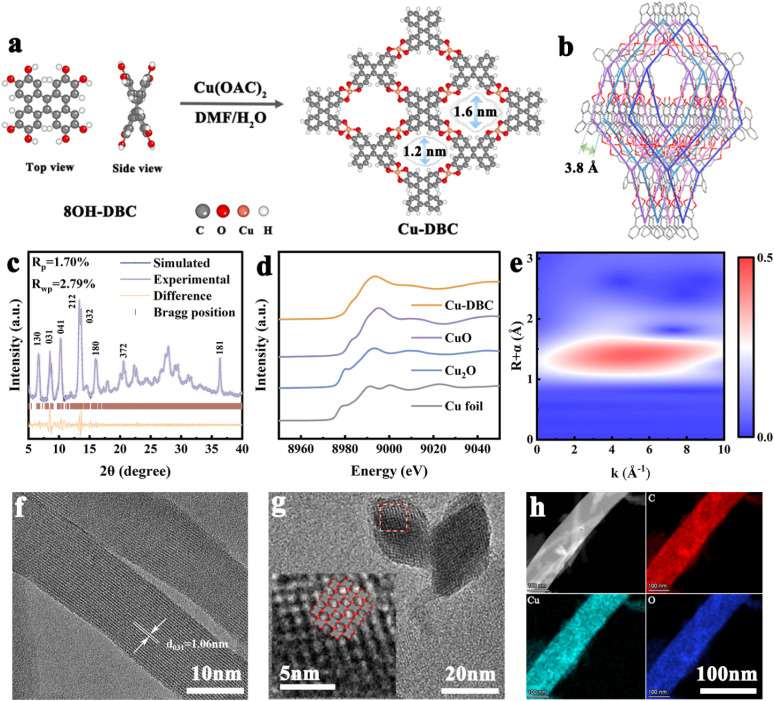
Based on the above theoretical analysis, Cu-DBC was synthesized using a contorted conjugated ligand (8OH-DBC) with Cu2+ through a simple solvothermal method (Fig. 2a, see ESI† for synthetic details). Powder X-ray diffraction (PXRD) analysis was performed to characterize the crystal structure of Cu-DBC. The lattice parameters of Cu-DBC were identified by Pawley's refinement to be a = 4.4 Å, b = 42.6 Å, and c = 14.6 Å (Rwp = 2.79%, Rp = 1.70%) (Fig. 2c). This also confirms the highly crystalline nature of the prepared Cu-DBC. The four-fold interpenetration of Cu-DBC forms one-dimensional channels measuring 1.2–1.6 nm in pore size along the z-axis. The distance between adjacent interpenetrations is 3.8 Å (Fig. 2b). The intrinsic porosity of Cu-DBC was evaluated using the N2 sorption isotherm (Fig. S1, ESI†). The results indicate a main pore width of 1.5 nm and a BET surface area of 131.8 m2 g−1, aligning with the simulated structural model of Cu-DBC. A comparison of the Fourier-transform infrared spectra(FT-IR) of 8OH-DBC and Cu-DBC verifies that the catechol units are completely coordinated with Cu ions (Fig. S2, ESI†). The characteristic peaks of O–H and C–O–H around 3300 cm−1 and 678 cm−1 in the 8OH-DBC spectrum fully disappeared in Cu-DBC. The presence of the C O characteristic peak (1620 cm−1) indicates that organic ligands were oxidized after deprotonation; thus, catecholates and semi-quinones coexist in Cu-DBC along with free radical formation. The existence of free radicals was proved by electron paramagnetic resonance (EPR) spectra (Fig. S3, ESI†). The strong EPR signal at g = 2.005 is attributed to the C–O· radical species, corroborating the oxidation of the organic ligands, thereby resulting in the coexistence of C O and C–O bonds.17 Comparison of the UV-vis spectra of 8OH-DBC and Cu-DBC shows an overall redshift of the peak due to the formation of an extended conjugated structure after coordination (Fig. S4, ESI†).18 X-ray photoelectron spectroscopy (XPS) was utilized to identify the constituents and chemical states of Cu-DBC (Fig. S5, ESI†). The XPS survey spectrum reveals the presence of the elements C, O, and Cu in Cu-DBC. The Cu 2p peaks at 954.3 eV, 934.4 eV, 952.8 eV, and 932.9 eV correspond to Cu2+ 2p1/2, Cu2+ 2p3/2, Cu+ 2p1/2 and Cu+ 2p3/2, respectively, indicating a slight amount of Cu2+ was reduced to Cu+ in the synthesis process of Cu-DBC. Moreover, the co-existence of C O (533.3 eV) and C–O (531.5 eV) bonds was also observed. Furthermore, X-ray absorption near-edge structure (XANES) and extended X-ray absorption fine structure (EXAFS) were performed to elucidate the coordination environment and valence of Cu in Cu-DBC (Fig. 2d, e and S6, ESI†). The XANES spectra of Cu-DBC prove that the Cu within the framework predominantly exists in a +2 oxidation state, as it shares almost the same white line peaks with CuO. The dominant peak in the k3-weighted Fourier transform EXAFS (FT-EXAFS) spectrum of Cu-DBC is close to that of CuO, consistent with the above result. Wavelet-transformed EXAFS spectroscopy was used to intuitively visualize the coordination mode of Cu-DBC. The FT-EXAFS fitting parameters are summarized in Table S1 (ESI),† and indicate that the first and second peaks in the FT-EXAFS spectra of Cu-DBC correspond to Cu–O bonds, demonstrating the formation of copper bis(dihydroxy) coordination. Additionally, characterization of the morphology of the synthesized Cu-DBC with scanning electron microscopy (SEM), high-resolution transmission electron microscopy (HRTEM), and high-angle annular dark-field scanning transmission electron microscopy (HAADF-STEM) was conducted. Cu-DBC exhibits uniform microcrystalline rods that range from 500 nm to 1 μm in length and are approximately 50 nm in width (Fig. S7, ESI†). The d = 1.06 nm lattice fringe is attributed to the (031) crystal plane of Cu-DBC (Fig. 2f). The lattice fringe indicated a diamond-shaped porous arrangement within the cross-section of the microcrystalline rods. The interlayer distance was measured to be d = 1.42 nm for the (030) crystal plane and 1.15 nm for the (300) crystal plane, in agreement with the established crystal model of Cu-DBC (Fig. 2g). The HAADF-STEM image of Cu-DBC shows Cu species is uniformly dispersed on the matrix (Fig. S8, ESI†). Furthermore, the HAADF-STEM image and corresponding energy-dispersive spectroscopy (EDS) mappings reveal that the elements C, O, and Cu are uniformly distributed in the microcrystalline rods of Cu-DBC (Fig. 2h). Moreover, the actual percentage of the element Cu in the prepared Cu-DBC is 18.15 wt% as determined from the energy dispersive X-ray spectra of the samples, which almost matches the theoretical content of 18.77% (Fig. S9, ESI†). Furthermore, thermogravimetric analysis (TGA) of Cu-DBC under N2 and air was performed to analyse its thermal stability (Fig. S10, ESI†). In the TGA curves, the weight loss above 220 °C is associated with the structural collapse of the materials, while that under 220 °C can be ascribed to the evaporation of the organic reagent and water from the material. Thus, Cu-DBC exhibits good thermal stability under 220 °C without significant decomposition. The observation of 22.75% residual mass at 800 °C provides insight into the composition of Cu in the samples. This result indicates that the percentage composition of Cu in Cu-DBC is 18.17%, which close to the theoretical value. In addition, the stability of Cu-DBC was evaluated after soaking in organic solvents (DMF), electrolytes (DME), NaOH (1 M) and HAC (1 M) for 6 h. The resulting PXRD patterns confirm the high chemical stability of Cu-DBC (Fig. S11, ESI†). To demonstrate the importance of the interpenetrating structure, Cu-HHTP was also synthesized (see ESI† for synthetic details) and characterized (Fig. S12–17, ESI†). The two-probe method was employed to measure the electrical conductivity of Cu-DBC and Cu-HHTP. According to the current–voltage curve, the electrical conductivity of Cu-DBC is 3.5 × 10⁻⁴ S m−1, approaching that of Cu-HHTP (1.7 × 10⁻³ S m−1) (Fig. S18, ESI†).
Fig. 2. (a) Synthetic diagram of Cu-DBC. (b) Topological structure of Cu-DBC. (c) PXRD patterns. (d) Cu K-edge XANES spectra of Cu-DBC, Cu foil, Cu2O, and CuO. (e) Wavelet transform-EXAFS signals of Cu-DBC. (f and g) HRTEM images of Cu-DBC. (h) HAADF-STEM mappings of the elements Cu, O, and C for Cu-DBC.
Electrochemical performance of Cu-DBC cathode
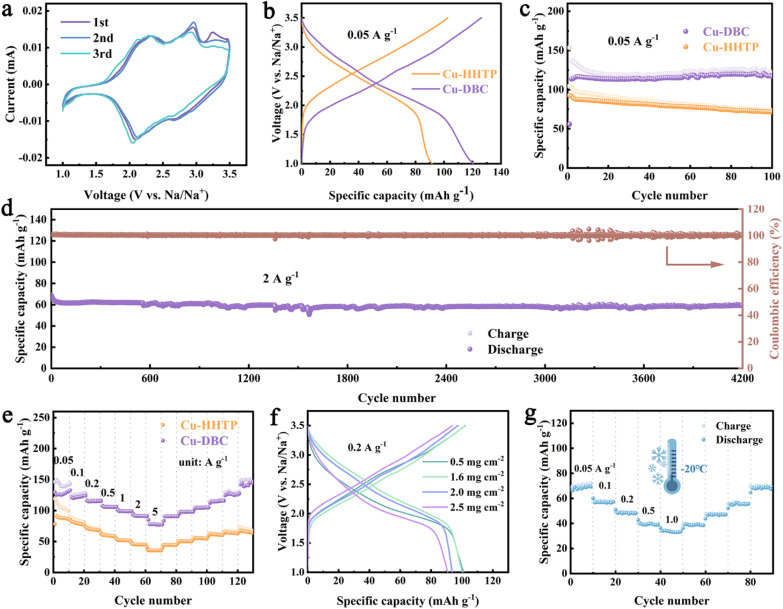
Subsequently, the electrochemical performances of the synthesized Cu-DBC and Cu-HHTP as cathode materials were investigated and compared by assembling coin-type half SIBs. Cyclic voltammetry (CV) tests were carried out at 0.1 mV s−1. The CV curves of Cu-DBC show two pairs of redox peaks, one pair at 2.30 V/2.10 V and another at 2.96 V/2.67 V. These peaks correspond to the reversible redox reactions involving the carbonyl (C O) groups in the ligand of Cu-DBC that accompany the insertion and extraction of Na+ (Fig. 3a). In addition, the oxidation peak at 3.25 V corresponds to the oxidation of CuI. The coincidence of the CV curves in repeated cycles suggests that the Cu-DBC cathode possesses favorable electrochemical reversibility. The CV curves of Cu-HHTP suggest that it shares a similar redox mechanism with Cu-DBC (Fig. S19, ESI†). Fig. 3b shows a comparison of the galvanostatic charge/discharge (GCD) curves between Cu-DBC and Cu-HHTP. Cu-DBC exhibits a better specific capacity (120.6 mA h g−1, 0.05 A g−1) compared to Cu-HHTP (91.8 mA h g−1). Additionally, the capacity of Cu-DBC remains at 116.7 mA h g−1 after 100 cycles with a capacity fade of only 3.2% compared to that of Cu-HHTP (Fig. 3c). Even at 2.0 A g−1, Cu-DBC retains superior cycle stability after 4000 cycles, achieving a capacity retention of 81.9% (Fig. 3d). Moreover, Cu-DBC also displays outstanding rate performance (Fig. 3e) with reversible capacities of 125, 121, 115, 106, 99, 91, and 77 mA h g−1 at 0.05, 0.1, 0.2, 0.5, 1.0, 2.0 and 5.0 A g−1, respectively, which are higher than those of Cu-HHTP. Notably, Cu-DBC exhibits a very small loss in capacity up to 1.0 A g−1. Moreover, these results suggest that the Cu-DBC cathode can be rapidly charged to a capacity of 77 mA h g−1 in merely 56 seconds, equivalent to a specific power density of 11 000 W kg−1. This excellent rate property could be ascribed to the combination of fast diffusion of Na+ in the interpenetrating network and the good electrical conductivity of the expanding conjugated structure. Furthermore, electrochemical impedance spectroscopy (EIS) was performed on Cu-DBC and Cu-HHTP (Fig. S20, ESI†).19 The Nyquist plots are primarily divided into two parts, the high- and low-frequency regions (semicircle and sloping lines). The semicircle corresponds to the charge transfer resistance (Rct), while sloping lines represent the ion diffusion processes within the electrode material, known as the Warburg impedance. Cu-DBC exhibited an Rct of 8 Ω, comparable to that of Cu-HHTP (5 Ω), confirming the similar electrical conductivity of the Cu-DBC and Cu-HHTP cathodes. Electrochemical kinetic analysis of Cu-DBC was carried out through CV tests at different scanning rates (Fig. S21, ESI†). With increasing scan rate, the redox peaks shifted due to enhanced polarization. The dynamics of the charge storage mechanism in Cu-DBC can be identified based on the value of b. The b values of Cu-DBC are close to 1, which indicates surface-controlled kinetics.20 In addition, applying the galvanostatic intermittent titration technique (GITT),21 the Na+ diffusion coefficient (DNa+) of Cu-DBC (10−11–10−9 cm2 s−1) can be calculated, and is larger than that of Cu-HHTP (10−12–10−10 cm2 s−1) (Fig. S22, ESI†), indicating higher Na+ diffusivity and fast reaction kinetics. Subsequently, a performance comparison between typical cathodes and Cu-DBC cathode was prepared and is presented in Table S2 (ESI),† showcasing the good rate capability and long-term cycling stability of Cu-DBC.
Fig. 3. (a) CV curves of Cu-DBC at 0.1 mV s−1. (b) GCD profiles of Cu-DBC and Cu-HHTP at 0.05 A g−1. (c) Cycling stability of Cu-DBC and Cu-HHTP at 0.05 A g−1. (d) Cycling stability of Cu-DBC at 2.0 A g−1. (e) Rate capability of Cu-DBC and Cu-HHTP. (f) GCD profiles of Cu-DBC at 0.2 A g−1 with varying active mass loading. (g) Rate capability of Cu-DBC at −20 °C.
In general, due to their poor inherent electrical conductivity, organic materials as electrodes can only withstand modest mass loadings of less than 1.0 mg cm−2.22 Based on its excellent cycling stability and rate performance, the performance of Cu-DBC cathodes with higher mass loadings was investigated. Cathodes with various active material loadings of 0.5–2.5 mg cm−2 were fabricated to evaluate the high active mass loading of Cu-DBC. A Cu-DBC cathode with a high loading (1.6 mg cm−2) showed a capacity of 100.3 mA h g−1 close to that of the 0.5 mg cm−2 cathode at 0.2 A g−1 (Fig. 3f). Additionally, the Cu-DBC cathode with a higher loading of 2.5 mg cm−2 delivered a capacity of 90.7 mA h g−1, which represents a slight capacity degradation compared to that of its 0.5 mg cm−2 counterpart at 0.2 A g−1, further certifying the favorable electronic transfer dynamics of Cu-DBC. Moreover, the Cu-DBC cathode with a loading of 2.5 mg cm−2 maintained long-term cycle stability (3.2% capacity degradation after 300 cycles) (Fig. S23, ESI†). In addition to its high-loading tolerance, the low/high-temperature performance of the Cu-DBC cathode was also assessed. At −20 °C, Cu-DBC cathode was subjected to reversible cycling at currents of 0.05, 0.1, 0.2, 0.5 and 1.0 A g−1, respectively, with no loss of capacity after recovery to 0.05 A g−1 (Fig. 3g). Long-term cycling performance at −20 °C was also achievable with Cu-DBC, with negligible capacity loss after 480 cycles at 0.2 A g−1 (Fig. S24, ESI†). At 50 °C, the Cu-DBC cathode exhibited notable cycling stability with a capacity loss of 8% after 1700 cycles (Fig. S25, ESI†). The above results suggest the fast electron/ion dynamic behavior of the Cu-DBC cathode even in harsh conditions.
Sodium storage mechanism of Cu-DBC
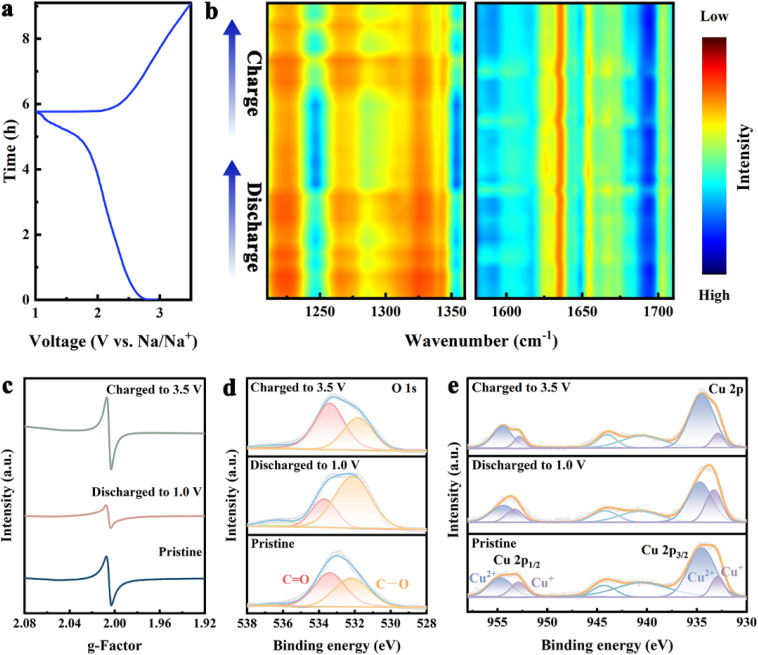
To investigate the Na+ storage mechanism of Cu-DBC, various characterizations of the Cu-DBC cathode were performed during the electrochemical process. In situ FT-IR was carried out to confirm the transformation of the redox active sites. The characteristic peak of C–O bonds (1250 cm−1) is strengthened during discharging processes and weakened during charging processes. Additionally, compared to those of the C–O bonds, the peaks of the C O bonds (1620 cm−1) exhibit the opposite trend during the discharging and charging processes (Fig. 4a and b). It is noteworthy that the enhancement and attenuation of the C–O bonds occurs mainly in the later stages of discharge and the initial stages of charge (i.e. the low-voltage ranges of the GCD process). Therefore, the capacity contribution in the high-voltage range of the GCD process corresponds to the redox of Cu ions. Several conclusions can be reached from the above analysis. Firstly, the [CuO4] units are the active sites of the redox reactions in the Cu-DBC. Secondly, the [CuO4] units undergo two types of redox reactions during the GCD process: the redox of the C O occurring in the low-voltage range and the redox of Cu2+ ion in the high-voltage range. In addition, the in situ Raman spectra reflect the variation and recovery of the Cu–O bond during the GCD process (Fig. S26, ESI†), implying reversible Na+ storage in the [CuO4] units.23 The EPR signal of the Cu-DBC cathode was attenuated and enhanced during the discharging and charging process, corresponding to the transformation and recovery of the C–O· radical (the C O bond exists as a semi-quinones state) (Fig. 4c). Moreover, the reversible conversion between C O and C–O bonds during the GCD processes was also confirmed by changes in the O 1s XPS spectra (Fig. 4d). Fig. 4e reveals the conversion of Cu2+ to Cu+ during the discharging process and the opposite transition for the charging process. Furthermore, the ex situ PXRD patterns and SEM images suggest that the structure of Cu-DBC was not collapsed after the GCD processes (Fig. S27, ESI†). The electrochemical impedance spectra of the coin cell were measured after long-term cycling. The Nyquist plots show that the charge transfer resistance decreased after 100 cycles due to the superior interfacial compatibility in the battery and the optimized interface between the electrode and electrolyte.24
Fig. 4. (a and b) Discharge/charge profile and in situ FT-IR spectra of Cu-DBC. (c) Ex situ EPR spectra of Cu-DBC during the GCD process. (d and e) Ex situ XPS spectra of O 1s and Cu 2p during the GCD process.
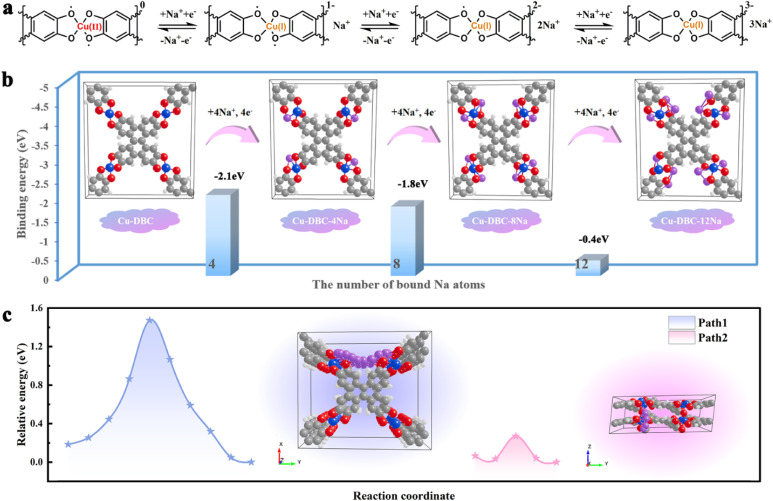
Overall, the Na+ storage mechanism of Cu-DBC can be divided into three steps (Fig. 5a). During the charging process, one repeating [CuO4] unit in a fully discharged state can reversibly extract three Na+, accounting for the CV profiles with three distinct reversible oxidation peaks. During the discharging process, the copper ion of one repeating [CuO4] unit is first reduced from CuII to CuI, accompanied by the insertion of one Na+. Subsequently, the electroneutral [CuO4] units are converted into new states of negative charge by the insertion of two additional Na+. First-principles DFT calculations were performed to deepen our comprehension of the ion storage mechanism of Cu-DBC in SIBs. The results confirmed that one repeating [CuO4] site of Cu-DBC can bind three Na+ with binding energies of −2.1, −1.8, and −0.4 eV during the discharge process (Fig. 5b). Furthermore, computational simulations were conducted to identify the Na+ diffusion pathways in Cu-DBC. Two diffusion pathways of Na+ were considered (Fig. 5c). Path 1 corresponds to intra-layer diffusion along the y-axis, exhibiting a theoretical diffusion energy barrier of 1.47 eV. Path 2 shows a considerably lower diffusion energy barrier of 0.27 eV, corresponding to inter-layer diffusion along the z-axis. It is obvious that Path 2 was the optimal pathway for Na+ ion diffusion in Cu-DBC. The low diffusion barrier of Path 2 facilitates the rapid diffusion of Na+, which greatly contributes to the excellent rate capability exhibited by the Cu-DBC cathode.
Fig. 5. (a) Schematic of the Na+ storage process in the [CuO4] units. (b) Na+ storage behaviour of Cu-DBC. (c) Na+ migration pathways and associated energy barrier.
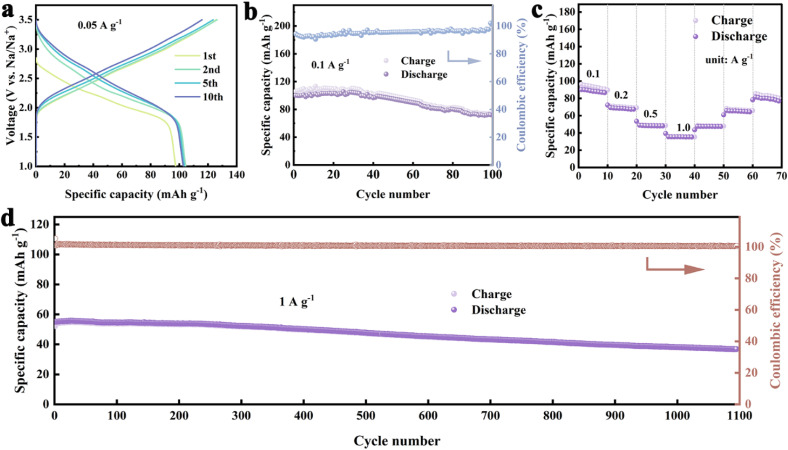
Due to the excellent characteristics of this interpenetrating Cu-DBC, the electrochemical properties of a Cu-DBC cathode consisting of a high electrode material ratio of 80 wt% were investigated, which is rare among common organic electrodes. The GCD profiles at 0.05 A g−1 showed that Cu-DBC could achieve a discharging capacity of 104.4 mA h g−1 (Fig. 6a). Moreover, Cu-DBC shows a capacity fade of 27.5% after 100 cycles at 0.1 A g−1 (Fig. 6b). It is important to note that after 1100 cycles at 1.0 A g−1, Cu-DBC provides a specific capacity of 37 mA h g−1 with 33% capacity fade, maintaining a coulombic efficiency of 100% (Fig. 6d). Moreover, the rate performance evaluation of Cu-DBC demonstrated remarkable electrochemical reversibility. Specifically, when returned to 0.1 A g−1, the discharging capacity of Cu-DBC recovers to 81.5 mA h g−1, corresponding to a noteworthy capacity retention (90%), indicating an impressive rate performance (Fig. 6c).
Fig. 6. (a) GCD profiles, (b and d) cycling stability, and (c) rate capability of the Cu-DBC cathode with a high active material ratio of 80 wt%.
Conclusions
In summary, we have reported an interpenetrating 3D c-MOF, Cu-DBC, with high ionic diffusivity and electrical conductivity as a long-lifetime cathode for SIBs. Cu-DBC possesses greater interlayer space and an expanded conjugated structure that could provide fast diffusion and transmission channels for ions and electrons, respectively. Charging a half-cell including a Cu-DBC cathode to 77 mA h g−1 capacity requires only 56 seconds, achieving a specific power density of 11 000 W kg−1. Additionally, the Cu-DBC cathode exhibits exceptional cycling stability at 2 A g−1, as it can be cycled more than 4000 cycles without significant capacity degradation. In light of the experimental characterizations and DFT calculations, the Na+ storage in Cu-DBC is primarily attributed to sequential redox reactions that occur in the [CuO4] active centers. In addition, Cu-DBC cathode was also subjected to extreme temperatures to further demonstrate its practicality. These results indicate that both conjugation and contortion play pivotal roles in improving the electrochemical performance of 2D-cMOFs, and provide insight into the design of long-life c-MOFs for energy storage applications.
Data availability
The data supporting this article have been included as part of the ESI.†
Author contributions
Z. Liu carried out the theoretical calculation, synthesis, characterization analysis, electrochemical measurements, and writing – original draft; H.-G. Wang and F. Cui carried out the methodology, supervision, and writing – review & editing; J. Chu, L. Cheng and J. Wang assisted the electrochemical measurement and data analysis; C. Zhang and C. Zhang assisted the characterization analysis; G. Zhu carried out the project administration, supervision and resources. All authors contributed to preparing the manuscript.
Conflicts of interest
There are no conflicts to declare.
Supplementary Material
Acknowledgments
This work is financially supported by the National Natural Science Foundation of China (Grant No. U21A20330, 52172186 and 22479023), the Science & Technology Department of Jilin Province (No. 20230101023JC).
Electronic supplementary information (ESI) available. See DOI: https://doi.org/10.1039/d4sc07400a
References
- (a) Liang Y. Yao Y. Joule. 2018;2:1690–1706. [Google Scholar]; (b) Xu J. Cai X. Cai S. Shao Y. Hu C. Lu S. Ding S. Energy Environ. Mater. 2023;6:e12450. [Google Scholar]; (c) Li M. Lu J. Chen Z. Amine K. Adv. Mater. 2018;30:e1800561. doi: 10.1002/adma.201800561. [DOI] [PubMed] [Google Scholar]; (d) Ryu H.-H. Lim H.-W. Lee S. G. Sun Y.-K. Nat. Energy. 2023;9:47–56. [Google Scholar]
- (a) Tian Y. Zeng G. Rutt A. Shi T. Kim H. Wang J. Koettgen J. Sun Y. Ouyang B. Chen T. Lun Z. Rong Z. Persson K. Ceder G. Chem. Rev. 2021;121:1623–1669. doi: 10.1021/acs.chemrev.0c00767. [DOI] [PubMed] [Google Scholar]; (b) Liang Y. Dong H. Aurbach D. Yao Y. Nat. Energy. 2020;5:646–656. [Google Scholar]; (c) Li Z. Zhang Y. Li X. Gu F. Zhang L. Liu H. Xia Q. Li Q. Ye W. Ge C. Li H. Hu H. Li S. Long Y. Z. Yan S. Miao G. X. Li Q. J. Am. Chem. Soc. 2021;143:12800–12808. doi: 10.1021/jacs.1c06115. [DOI] [PubMed] [Google Scholar]
- (a) Zhu Z. Jiang T. Ali M. Meng Y. Jin Y. Cui Y. Chen W. Chem. Rev. 2022;122:16610–16751. doi: 10.1021/acs.chemrev.2c00289. [DOI] [PubMed] [Google Scholar]; (b) Goikolea E. Palomares V. Wang S. de Larramendi I. R. Guo X. Wang G. Rojo T. Adv. Energy Mater. 2020;10:2002055. [Google Scholar]; (c) Jin Y. Le P. M. L. Gao P. Xu Y. Xiao B. Engelhard M. H. Cao X. Vo T. D. Hu J. Zhong L. Matthews B. E. Yi R. Wang C. Li X. Liu J. Zhang J.-G. Nat. Energy. 2022;7:718–725. [Google Scholar]; (d) Li Y. Zhou Q. Weng S. Ding F. Qi X. Lu J. Li Y. Zhang X. Rong X. Lu Y. Wang X. Xiao R. Li H. Huang X. Chen L. Hu Y.-S. Nat. Energy. 2022;7:511–519. [Google Scholar]
- (a) Li M. Du Z. Khaleel M. A. Belharouak I. Energy Storage Mater. 2020;25:520–536. [Google Scholar]; (b) Wang C. Liu L. Zhao S. Liu Y. Yang Y. Yu H. Lee S. Lee G. H. Kang Y. M. Liu R. Li F. Chen J. Nat. Commun. 2021;12:2256. doi: 10.1038/s41467-021-22523-3. [DOI] [PMC free article] [PubMed] [Google Scholar]; (c) Huang J. Li W. Ye D. Xu L. Wu W. Wu X. J. Energy Chem. 2024;94:466–476. [Google Scholar]; (d) Ren M. Zhao S. Gao S. Zhang T. Hou M. Zhang W. Feng K. Zhong J. Hua W. Indris S. Zhang K. Chen J. Li F. J. Am. Chem. Soc. 2023;145:224–233. doi: 10.1021/jacs.2c09725. [DOI] [PubMed] [Google Scholar]
- (a) Kim J. Kim Y. Yoo J. Kwon G. Ko Y. Kang K. Nat. Rev. Mater. 2022;8:54–70. [Google Scholar]; (b) Wang M. Dong R. Feng X. Chem. Soc. Rev. 2021;50:2764–2793. doi: 10.1039/d0cs01160f. [DOI] [PubMed] [Google Scholar]; (c) Lin L. Zhang Q. Ni Y. Shang L. Zhang X. Yan Z. Zhao Q. Chen J. Chem. 2022;8:1822–1854. [Google Scholar]; (d) Majumder M. Santosh M. S. Viswanatha R. Thakur A. K. Dubal D. P. Jayaramulu K. Energy Storage Mater. 2021;37:396–416. [Google Scholar]
- Liu J. Song X. Zhang T. Liu S. Wen H. Chen L. Angew. Chem., Int. Ed. 2021;60:5612–5624. doi: 10.1002/anie.202006102. [DOI] [PubMed] [Google Scholar]
- (a) Zhang C. Fan K. Chen Y. Wu Y. Wang C. ACS Appl. Electron. Mater. 2021;3:1947–1958. [Google Scholar]; (b) Mao P. Lan G. Liu C. Wang Z. Liu Y. Sun H. Huang W. Sustainable Mater. Technol. 2021;30:e00354. [Google Scholar]
- (a) Feng D. Lei T. Lukatskaya M. R. Park J. Huang Z. Lee M. Shaw L. Chen S. Yakovenko A. A. Kulkarni A. Xiao J. Fredrickson K. Tok J. B. Zou X. Cui Y. Bao Z. Nat. Energy. 2018;3:30–36. [Google Scholar]; (b) Jiang Q. Xiong P. Liu J. Xie Z. Wang Q. Yang X. Q. Hu E. Cao Y. Sun J. Xu Y. Chen L. Angew. Chem., Int. Ed. 2020;59:5273–5277. doi: 10.1002/anie.201914395. [DOI] [PubMed] [Google Scholar]
- Chen Y. Zhu Q. Fan K. Gu Y. Sun M. Li Z. Zhang C. Wu Y. Wang Q. Xu S. Ma J. Wang C. Hu W. Angew. Chem., Int. Ed. 2021;60:18769–18776. doi: 10.1002/anie.202106055. [DOI] [PubMed] [Google Scholar]
- Yan J. Cui Y. Xie M. Yang G. Z. Bin D. S. Li D. Angew. Chem., Int. Ed. 2021;60:24467–24472. doi: 10.1002/anie.202110373. [DOI] [PubMed] [Google Scholar]
- (a) Wang B. Li J. Ye M. Zhang Y. Tang Y. Hu X. He J. Li C. C. Adv. Funct. Mater. 2022;32:2112072. [Google Scholar]; (b) Wang J. Jia H. Liu Z. Yu J. Cheng L. Wang H. G. Cui F. Zhu G. Adv. Mater. 2024;36:e2305605. doi: 10.1002/adma.202305605. [DOI] [PubMed] [Google Scholar]
- (a) Xing G. Liu J. Zhou Y. Fu S. Zheng J. J. Su X. Gao X. Terasaki O. Bonn M. Wang H. I. Chen L. J. Am. Chem. Soc. 2023;145:8979–8987. doi: 10.1021/jacs.2c13835. [DOI] [PubMed] [Google Scholar]; (b) Su X. Zhong Z. Yan X. Xu Y. Zhang T. Ma Y. Chen L. J. Am. Chem. Soc. 2024;146:9036–9044. doi: 10.1021/jacs.3c13985. [DOI] [PubMed] [Google Scholar]; (c) Liu L. Su X. Qi M. Gao X. Ren H. Chen L. Chem. Synth. 2024;4:10. [Google Scholar]
- (a) Liu X. Yu M. Liu J. Wu S. Gong J. Small. 2024;20:e2306159. doi: 10.1002/smll.202306159. [DOI] [PubMed] [Google Scholar]; (b) Zhang H. Geng Y. Huang J. Wang Z. Du K. Li H. Energy Environ. Sci. 2023;16:889–951. [Google Scholar]; (c) Pham H. T. B. Choi J. Y. Stodolka M. Park J. Acc. Chem. Res. 2024;57:580–589. doi: 10.1021/acs.accounts.4c00280. [DOI] [PubMed] [Google Scholar]
- Martínez-Abadía M. Stoppiello C. T. Strutynski K. Lerma-Berlanga B. Martí-Gastaldo C. Saeki A. Melle-Franco M. Khlobystov A. N. Mateo-Alonso A. J. Am. Chem. Soc. 2019;141:14403–14410. doi: 10.1021/jacs.9b07383. [DOI] [PubMed] [Google Scholar]
- Zhang J. Zhou G. Un H. I. Zheng F. Jastrzembski K. Wang M. Guo Q. Mücke D. Qi H. Lu Y. Wang Z. Liang Y. Löffler M. Kaiser U. Frauenheim T. Mateo-Alonso A. Huang Z. Sirringhaus H. Feng X. Dong R. J. Am. Chem. Soc. 2023;145:23630–23638. doi: 10.1021/jacs.3c07682. [DOI] [PubMed] [Google Scholar]
- Liu J. Zhou Y. Xie Z. Li Y. Liu Y. Sun J. Ma Y. Terasaki O. Chen L. Angew. Chem., Int. Ed. 2020;59:1081–1086. doi: 10.1002/anie.201912642. [DOI] [PubMed] [Google Scholar]
- Cheng L. Yu J. Chen L. Chu J. Wang J. Wang H.-G. Feng D. Cui F. Zhu G. Small. 2023;19:e2301578. doi: 10.1002/smll.202301578. [DOI] [PubMed] [Google Scholar]
- Dalapati S. Addicoat M. Jin S. Sakurai T. Gao J. Xu H. Irle S. Seki S. Jiang D. Nat. Commun. 2015;6:7786. doi: 10.1038/ncomms8786. [DOI] [PMC free article] [PubMed] [Google Scholar]
- (a) Choi W. Shin H.-C. Kim J. M. Choi J.-Y. Yoon W.-S. J. Electrochem. Sci. Technol. 2020;11:1–13. [Google Scholar]; (b) Gaberscek M. Nat. Commun. 2021;12:6513. doi: 10.1038/s41467-021-26894-5. [DOI] [PMC free article] [PubMed] [Google Scholar]
- (a) Choi C. Ashby D. S. Butts D. M. DeBlock R. H. Wei Q. Lau J. Dunn B. Nat. Rev. Mater. 2019;5:5–19. [Google Scholar]; (b) Liu Y. Jiang S. P. Shao Z. Mater. Today Adv. 2020;7:100072. [Google Scholar]
- Kim J. Park S. Hwang S. Yoon W.-S. J. Electrochem. Sci. Technol. 2022;13:19–31. [Google Scholar]
- Lu Y. Chen J. Nat. Rev. Chem. 2020;4:127–142. doi: 10.1038/s41570-020-0160-9. [DOI] [PubMed] [Google Scholar]
- Zhang Y. Dong L. Z. Li S. Huang X. Chang J. N. Wang J. H. Zhou J. Li S. L. Lan Y. Q. Nat. Commun. 2021;12:6390. doi: 10.1038/s41467-021-26724-8. [DOI] [PMC free article] [PubMed] [Google Scholar]
- Shi Y. Yang J. Yang J. Wang Z. Chen Z. Xu Y. Adv. Funct. Mater. 2022;32:2111307. [Google Scholar]
Associated Data
This section collects any data citations, data availability statements, or supplementary materials included in this article.
Supplementary Materials
Data Availability Statement
The data supporting this article have been included as part of the ESI.†


