

Abstract
INTRODUCTION
Understanding how a research sample compares to the population from which it is drawn can help inform future recruitment planning. We compared the Wisconsin Alzheimer's Disease Research Center (WADRC) participant sample to the Wisconsin state population (WI‐pop) on key demographic, social exposome, and vascular risk measures.
METHODS
The WADRC sample included 930 participants. Population statistics were estimated using several national and state data sources. We compared WADRC to WI‐pop for two age groups, 45–64 years and ≥65 years, separately.
RESULTS
Compared to WI‐pop, WADRC participants were older and included more women, more Black and American Indian individuals, and fewer Hispanic and Asian individuals. WADRC participants had higher levels of educational attainment, consisted of smaller proportions living in rural areas and disadvantaged neighborhoods, and showed lower vascular risks. Greater differences between WADRC and WI‐pop were found for most metrics in the ≥65 group compared to the 45–64 group.
DISCUSSION
The findings revealed opportunities to increase enrollment from the Hispanic/Latino and Asian American populations, to include participants from a broader range of educational backgrounds, and to enroll more residents from rural areas and disadvantaged neighborhoods, which may lead to a broader distribution of cardiovascular risk factors. Expanding sociodemographic and health profiles represented in the participant candidate pool for study selection and including those who are underrepresented in research may potentially reduce selection bias but not eliminate it. Statistical approaches can be applied to address bias and generalize findings from a study sample to its target population by adjusting for their differences in the joint distribution of covariates. Although research centers have different regional populations and specific recruitment focuses for scientific reasons, evaluating their participant characteristics may help plan engagement efforts to improve the inclusion of underrepresented groups and collaboratively support generalizable research nationwide.
Highlights
We compared the characteristics of Wisconsin Alzheimer's Disease Research Center (WADRC) participants with the Wisconsin population.
Metrics of comparison included demographics, social exposomes, and vascular risks.
WADRC participants are different from the Wisconsin population.
We explored the implications and causes of the differences.
We discussed strategies for engaging and recruiting underrepresented groups.
Keywords: Alzheimer's Disease Research Center, Asian American, Black/African American, American Indian, education, Hispanic/Latino, neighborhood disadvantage, population statistics, recruitment, research disparities, rural residence, sample representativeness, social exposome, underrepresented racial/ethnic groups, vascular risks, Wisconsin
1. BACKGROUND
Seven million Americans are living with Alzheimer's disease (AD) and related dementias (ADRD), and this number will double by 2050. 1 , 2 , 3 To fight against this public health crisis, the National Institute on Aging (NIA) funds the Alzheimer's Disease Research Centers (ADRCs) across the United States, including 34 established centers, one exploratory center, and more centers to launch in the future. All centers carry out research with the goal of translating research advances into improved diagnosis and care as well as finding ways to treat and prevent dementia. Research participants are generally recruited from the region where each center is located and longitudinally followed to collect clinical data, brain images, and/or biofluid samples. These collected resources are submitted to the National Alzheimer's Coordinating Center (NACC) and often to additional multicenter research consortia and/or national repositories (Table 1) to be shared for research use. Such cross‐center collaborations using standardized data collections maximize the eligible sample size required by a study, save resources, and share expertise, and thus have become a major trend in ADRD research.
TABLE 1.
Summary of major national databases and repositories, research consortia, multicenter studies, and clinical trials on ADRD and roles of the Wisconsin ADRC.
| Acronym | Full Name | Role of WADRC |
|---|---|---|
| NACC | The National Alzheimer's Coordinating Center | Participating |
| NCRAD | The National Centralized Repository for Alzheimer's Disease and Related Dementia | Participating |
| ADCFB | The Alzheimer's Disease Center Fluid Biomarkers Study | Participating |
| NIAGADS | The National Institute on Aging Genetics of Alzheimer's Disease Data Storage Site | Participating |
| ADSP | The Alzheimer's Disease Sequencing Project Consortia | Participating |
| ADGC | The Alzheimer's Disease Genetics Consortium | Participating |
| ADNI | The Alzheimer's Disease Neuroimaging Initiative | Participating |
| SCAN | The Standardized Centralized Alzheimer's & Related Dementias Neuroimaging Initiative | Participating |
| CLARiTI | The ADRC Consortium for Clarity in ADRD Research Through Imaging | Leading |
| ARMADA | The Advancing Reliable Measurement in Alzheimer's Disease Cognitive Aging Study | Participating |
| VCog | The Validation of a Video Adaptation of the UDSv3 Cognitive Battery (VCog) | Participating |
| The Neighborhoods Study | The Neighborhoods Study: Contextual Disadvantage and Alzheimer's Disease and Related Dementias | Leading |
| Diverse VCID | The Diverse Vascular Contributions to Cognitive Impairment and Dementia Study | Participating |
| ALLFTD | The ARTFL‐LEFFTDS Longitudinal Frontotemporal Lobar Degeneration Research study | Not participating |
| PPMI | The Parkinson's Progression Markers Initiative | Not participating |
| DLBC | The Dementia with Lewy Bodies Consortium | Not participating |
| LEADS | The Longitudinal Early‐Onset AD Study (LEADS) | Not participating |
| DIAN | The Dominantly Inherited Alzheimer Network | Not participating |
| ABC‐DS | The Alzheimer Biomarkers Consortium‐Down Syndrome | See notes |
| ACTC | The Alzheimer's Clinical Trials Consortium | Participating |
| A4 | The Anti‐Amyloid Treatment in Asymptomatic AD Trial | See notes |
| AHEAD 3‐45 | The AHEAD 3‐45 Study | See notes |
| APEX | The AHEAD Plasma Extension Study | See notes |
| START | The Synaptic Therapy Alzheimer's Research Trial | See notes |
| TRC‐PAD | The Trial Ready Cohort for the Prevention of Alzheimer's Dementia | See notes |
| LiBBY | The Life's End Benefits of Cannabidiol and Tetrahydrocannabinol Study | Not participating |
| Clarity | The Clarity Trial | Not participating |
| ADCS | The Alzheimer's Disease Cooperative Study | Participated |
| ATRI | The Alzheimer's Theraeutic Research Institute | Participating |
| EXERT | The Building Memory Through Exercise Trial | Participating |
| PREVENTABLE | The Pragmatic Evaluation of Events and Benefits of Lipid‐lowering in Older Adults | See notes |
Notes. This summary is not a complete list. The role of “participating” refers to that the Wisconsin ADRC contributes data, biofluid samples, or image scans to the national repositories, or the Wisconsin ADRC participants who are eligible and interested voluntarily enroll in the multicenter studies or clinical trials. Enrollment in the ABC‐DS study is through the University of Wisconsin Waisman Center. Enrollment in the A4, AHEAD‐345, APEX, START, and TRC‐PAD trials is through independent studies led by Dr. Cynthia Carlsson, an investigator at the Wisconsin ADRC. Enrollment in the PREVENTABLE study is through the Madison Veteran Affairs (VA) Medical Center.
Abbreviations: ADRC, Alzheimer's Disease Research Center; ADRD, Alzheimer's disease related dementias
The Wisconsin Alzheimer's Disease Research Center (WADRC) is one of the NIA‐funded ADRCs. Since its inception in 2009, the center has enrolled 1134 participants 45 years of age and older with clinical diagnoses of cognitively unimpaired (CU), mild cognitive impairment (MCI), AD, or dementia due to AD and/or non‐AD pathology. Participants are mainly recruited from the state of Wisconsin (WI), including 87.2% WI residents and 12.8% from 25 other states (mostly neighboring states and/or states where WI residents have relocated). Multimodal data, image scans, antemortem biospecimens, and postmortem brain tissues are collected and broadly shared through participation in many multicenter studies and national repositories (Table 1). The utilization of the center resources has resulted in more than 1000 scientific publications, highlighting the important contribution by the WADRC participants to ADRD research.
A recent study showed that the NACC data which include all participants from every ADRC, are not representative of the national population in terms of sociodemographic characteristics and health risk profiles. 4 Another study found that Black and Latino populations are underrepresented in the Alzheimer's Disease Neuroimaging Initiative (ADNI) data. 2 A third study reviewed 101 AD drug trials and concluded that some commonly adopted eligibility criteria for enrollment have limited the inclusion of individuals from underrepresented racial groups, and individuals with low English fluency, less education, or comorbid conditions. 5 Likely, non‐representativeness of the participant sample has been a prevalent issue in many other multicenter studies and national repositories, given that the individuals included are a subset of the NACC/ADRC participants or are also based on volunteer enrollment. The lack of sample representativeness limits the generalizability of research findings on the disease onset, progression, and pathology to under‐ and unrepresented populations 4 , 6 , 7 and raises questions about the safety and efficacy of the interventions and treatments developed and recommended based on such findings. 5 , 7 , 8 Remedying this issue will require the combined effort of all research centers. If each ADRC works to increase enrollment from groups who are underrepresented in their participant sample compared to the regional population from which they recruit, the aggregated multicenter participant samples and data repositories will be more representative nationwide, supporting inclusive and generalizable research in the field.
To understand how similar or different the WADRC participants are relative to the regional population and to identify gaps in enrollment from the underrepresented groups, we compared the WADRC participant sample to the Wisconsin state population (WI‐pop) on key demographics, social exposomes (the social environment where people live), and vascular risks. These factors are associated with ADRD 9 , 10 , 11 , 12 , 13 , 14 , 15 , 16 and serve as important health disparity metrics. Because dementia risk is significantly elevated in adults 65 years or older, 1 , 3 comparisons were performed for two age groups, 45–64 years and ≥65 years, separately. The study does not aim to achieve a proportional distribution of the WADRC sample equal to the distribution in the state population. Rather, our goal is to support future recruitment that expands sociodemographic and health profiles represented in the sample, increasing the participation of groups that are underrepresented in research and allowing them to benefit from research findings.
2. METHODS
2.1. WADRC participants
WADRC participants are recruited from multiple sources (Table A1). Adults 45 years of age and older with decisional capacity and English fluency were eligible for enrollment. Exclusion criteria included active major medical or psychiatric illness (Supplementary Material) or lack of a study partner. The present study included 930 WADRC participants who have their primary address in Wisconsin and completed their baseline visit by March 1, 2023. Of the 930 participants, 331 (35.6%) were from the younger group (45–64 years) and 599 (64.4%) were from the older group (≥65 years). The sample diagnoses included 594 (63.9%) CU, 192 (20.7%) dementia, 108 (11.6%) MCI, and 36 (3.9%) impaired not MCI, with AD etiology contributing to most of the dementia and MCI diagnoses (Table A2).
RESEARCH IN CONTEXT
Systematic review: We conducted a literature review using PubMed and identified several studies that evaluated the sample representativeness of national databases or multicenter studies on Alzheimer's disease and related dementias (ADRD). However, we did not find any study that compared the sample characteristics of an Alzheimer's Disease Research Center (ADRC) to its regional population, from which the participants included in the national databases were originally recruited.
Interpretation: We found that the Wisconsin ADRC participants differed from the Wisconsin state population in demographics, social exposomes, and vascular risks. We explored the implications and causes of the differences and discussed strategies for engaging and recruiting groups who are underrepresented in research.
Future directions: Methodological development is needed to guide further evaluation of joint distributions. Comparing additional social determinants of health and measures of health functions would offer more insights to guide recruitment directions.
Participants self‐reported sex, race, Hispanic ethnicity, and education. Self‐identified primary race was used for this study. Educational attainment was classified into four levels: (1) did not graduate high school, (2) high school graduate, (3) attended college but did not receive a bachelor's degree, and (4) received a bachelor's or higher degree.
Rural residence and neighborhood disadvantage were determined using the participant's current or most recent primary address, representing the most up‐to‐date residence status and quality. Rural residence was identified based on the Federal Office of Rural Health Policy (FORHP) designation of rural zip codes acquired from the Rural Health Information Hub (RHIhub). Neighborhood disadvantage was measured using the 2020 area deprivation index (ADI) state ranking provided by the University of Wisconsin (UW) Center for Health Disparities Research (CHDR). 17 ADI ranks the neighborhood socioeconomic disadvantage at the state or national level based on multiple social determinants of health constructs, including income, education, employment, and housing quality measures. The state ranking is in deciles ranging from 1 to 10, with “1” representing the least disadvantaged 10% neighborhoods and “10” representing the most disadvantaged 10% neighborhoods in a state. 11 , 17
Participants had in‐person or virtual baseline and annual or biennial longitudinal follow‐up visits. Blood pressure (BP), body mass index (BMI), and total cholesterol were measured at in‐person visits. The presence of hypertension and diabetes was evaluated by the clinician at both in‐person and virtual visits based on a review of all available information including new diagnoses during the current visit, previous medical records, lab tests, medication use, and the clinical exam. Data from the most recent visit were used for the study.
2.2. WI‐pop
The WI‐pop percentages on age group, sex, race, and Hispanic ethnicity were calculated based on the 2020 population count estimates provided by the Wisconsin Department of Health Services (DHS). These population estimates were based on the U.S. Census Bureau's state age‐by‐sex, bridged‐race, and ethnicity estimates and were adjusted for county, sex, and age group totals. Bridged race is a single‐race variable derived from multiple‐race reporting data using the race‐bridging method. 18 It represents the race category that most closely reflects an individual's self‐denoted racial identification, allowing data collected from the multiple‐race and single‐race reporting systems to be comparable.
The WI‐pop percentages on educational attainment were estimated based on the 2020 Behavioral Risk Factor Surveillance System (BRFSS) survey data. 19 The BRFSS includes national telephone surveys conducted by the Centers for Disease Control and Prevention (CDC) regarding U.S. residents’ health‐related risk behaviors, chronic health conditions, and use of preventive services. The BRFSS educational attainment includes the following four levels: (1) did not graduate high school, (2) high school graduate, (3) attended college or technical school, and (4) college or technical school graduate.
The WI‐pop percentages on rural residence were calculated using the FORHP designation of rural census tracts based on the 2010 rural‐urban community area (RUCA) codes and the U.S. Census American Community Survey (ACS) 20 2006–2010 5‐year population estimates. The WI‐pop percentages on ADI state rankings were calculated using the 2020 ADI provided by CHDR 17 and the ACS 2016–2020 5‐year population estimates.
The WI‐pop statistics on vascular risk factors were estimated based on the corresponding age groups of the Survey of the Health of Wisconsin (SHOW) Wave II (2014–2016) sample. SHOW includes household‐based examination surveys on representative samples of the general Wisconsin residents' population. 21 BP, BMI, and total cholesterol were measured at the survey visit. Hypertension was defined as self‐reporting current anti‐hypertensive medication use, having measured systolic BP >140 mmHg, or having measured diastolic BP >90 mmHg. Diabetes was defined by self‐reporting ever being told by a clinician to have type 1 or type 2 diabetes or having hemoglobin A1c (HbA1c) ≥6.5% determined at the visit.
2.3. Statistical analysis
Differences between the WADRC participants versus WI‐pop were tested for younger and older groups separately, using the one‐sample z‐test for continuous variables (systolic BP, BMI, total cholesterol), the one‐sample Wilcoxon signed rank test for the ranking variable (ADI), the exact binomial test for binary variables (sex, Hispanic ethnicity, rural residence, hypertension, diabetes), and the exact Monte Carlo multinomial test for categorical variables with more than two categories (race, education). 22 The Benjamini–Hochberg false discovery rate (FDR) correction method was applied to adjust for the inflated type I error rate due to multiple testing. 23 The WADRC to WI‐pop ratios were calculated to compare percentages for categorical variables and medians for ADI state ranking. The WADRC versus WI‐pop standardized differences in means were calculated for continuous variables as the number of WI‐pop standard deviations (SDs). Because population statistic estimates were used as true population values without accounting for sampling variations in these estimates, the interpretation of results was focused on the ratios and standardized differences with minimal reference to statistical significance.
3. RESULTS
Age: WI‐pop had a right‐skewed age distribution including more people in the younger age groups, whereas WADRC had a left‐skewed age distribution including more people in the older age groups. Compared to WI‐pop, WADRC had a lower percentage in each 5‐year age group below 60 but a higher percentage in each age group above 60, and were overall older than WI‐pop (Figure 1).
FIGURE 1.
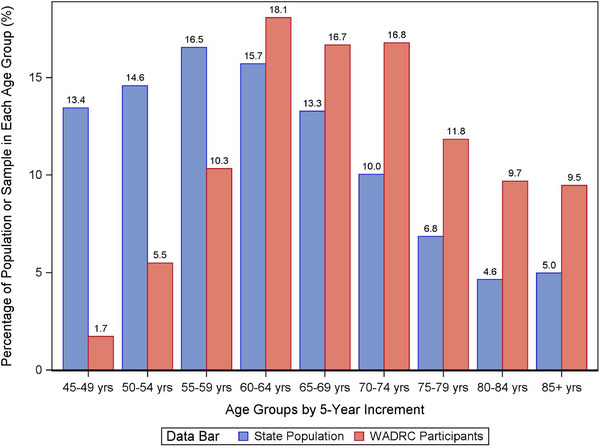
Comparison of age distribution between the Wisconsin ADRC participants versus the WI‐pop of 45 years of age and older. ADRC, Alzheimer's Disease Research Center; WI‐pop, Wisconsin state population.
Sex: WADRC had a higher percentage of women than WI‐pop for both age groups. However, the difference in the older group was small (Table 2; Figure 2).
TABLE 2.
Comparison of demographics, social exposomes, and vascular risk factors between the Wisconsin ADRC participants versus the WI‐pop of 45 years of age and older (n = 930).
| Younger age group (45–64 years; n = 331) | Older age group (≥65 years; n = 599) | |||||||
|---|---|---|---|---|---|---|---|---|
| Metrics | State population (WI‐Pop) | ADRC participants (WADRC) | Ratio or standardized difference | p‐value | State population (WI‐Pop) | ADRC participants (WADRC) | Ratio or standardized difference | p‐value |
| Demographics | ||||||||
| Women, % | 50.3% | 65.0% | 1.29 | <0.0001 | 54.2% | 56.3% | 1.04 | 0.3252 |
| Race, % | <0.0001 | <0.0001 | ||||||
| White | 91.4% | 73.7% | 0.81 | 94.9% | 79.4% | 0.84 | ||
| Black or African American | 5.3% | 21.8% | 4.07 | 3.2% | 15.4% | 4.75 | ||
| American Indian (AI) | 1.1% | 3.9% | 3.64 | 0.7% | 4.9% | 7.35 | ||
| Asian | 2.1% | 0.6% | 0.28 | 1.2% | 0.3% | 0.28 | ||
| Hispanic ethnicity, % | 4.7% | 2.4% | 0.52 | 0.0501 | 1.9% | 1.3% | 0.70 | 0.3704 |
| Education, % | <0.0001 | 0.0001 | ||||||
| Did not graduate high school | 7.5% | 3.0% | 0.40 | 9.3% | 2.5% | 0.27 | ||
| High school graduate | 30.0% | 9.7% | 0.32 | 36.0% | 16.7% | 0.46 | ||
| Attended college | 33.2% | 22.1% | 0.66 | 32.7% | 20.4% | 0.62 | ||
| College graduate | 29.3% | 65.3% | 2.23 | 21.9% | 60.4% | 2.76 | ||
| Social exposome | ||||||||
| Rural residence, % | 34.7% | 17.5% | 0.51 | <0.0001 | 39.3% | 18.5% | 0.47 | <0.0001 |
| ADI state ranking, median | 5.0 | 2.0 | 0.40 | <0.0001 | 5.0 | 3.0 | 0.60 | <0.0001 |
| Vascular risk factors | ||||||||
| Hypertension, % | 41.1% | 36.9% | 0.90 | 0.1541 | 67.0% | 49.9% | 0.74 | <0.0001 |
| Diabetes, % | 13.7% | 15.0% | 1.10 | 0.4969 | 21.0% | 15.9% | 0.76 | 0.0036 |
| Systolic blood pressure (mmHg), mean (SD) | 127.3 (16.6) | 123.0 (16.5) | −0.26 | <0.0001 | 136.1 (18.5) | 130.2 (18.5) | −0.32 | <0.0001 |
| Body mass index (BMI; kg/m2), mean (SD) | 30.6 (7.3) | 29.7 (7.0) | −0.12 | 0.0353 | 29.8 (6.0) | 28.0 (5.5) | −0.30 | <0.0001 |
| Total cholesterol (mg/dL), mean (SD) | 200.2 (40.5) | 195.9 (41.9) | −0.10 | 0.0618 | 187.1 (42.4) | 185.8 (41.9) | −0.03 | 0.4618 |
Note:
1. The name and order of racial and ethnic groups follow the NACC Uniform Data Set (UDS) data dictionary.
2. For education, in the data source for the Wisconsin state population, the categories “attended college” and “college graduate” were defined as “attended college or technical school” and “college or technical school graduate,” respectively. In the Wisconsin ADRC data, the categories “attended college” and “college graduate” were defined as “attended college but did not receive a bachelor's degree” and “received a bachelor's higher degree,” respectively. If the Wisconsin ADRC had used the same definition as for the state population, some participants in the “attended college” category might have been classified as “college graduate,” which would result in even higher percentages of college graduates and greater differences compared to the state population.
3. The ratios were calculated as the ratio of the Wisconsin ADRC sample percentage over the state population percentage. A ratio more (or less) than 1 indicates that the sample percentage is higher (or lower) than the population percentage. A ratio further from 1 indicates a greater deviation between the sample versus the population percentages. Ratios were calculated for categorical variables (sex, race, Hispanic ethnicity, education, rural residence, hypertension, diabetes). Ratios in the sample versus population medians were also calculated for ADI with similar interpretations.
4. The standardized differences between the Wisconsin ADRC sample mean and the state population means were calculated in terms of the number of population standard deviations (SDs), i.e., (the Wisconsin ADRC sample mean–the state population mean)/the state population SDs). A positive (or negative) standardized difference indicates that the sample mean is larger (or smaller) than the population mean. A standardized difference further from zero indicates a greater deviation between the sample versus the population means. Standardized differences were calculated for continuous variables (systolic blood pressure, BMI, total cholesterol).
5. The statistically significant sample versus population differences after adjusting for multiple corrections are in bold face.
Abbreviations: ADI, area deprivation index; BMI, body mass index; SD, standard deviation; WADRC, Wisconsin Alzheimer's Disease Research Center; WI‐pop, Wisconsin state population.
FIGURE 2.
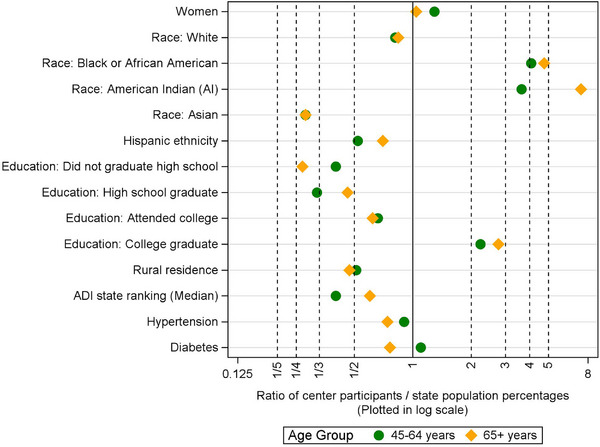
Ratios of the Wisconsin ADRC sample percentage over the WI‐pop percentage for each age group. A ratio more (or less) than 1 indicates that the sample percentage is higher (or lower) than the population percentage. A ratio further from 1 indicates a greater deviation between the sample versus the population percentages. Ratios of ADI state rankings were calculated based on medians instead of percentages with similar interpretations. ADI, area deprivation index; ADRC, Alzheimer's Disease Research Center; WI‐pop, Wisconsin state population.
Race: For both age groups, WADRC had lower percentages of White and Asian participants and much higher percentages of Black and American Indian (AI) participants than WI‐pop. The higher percentages of Black and AI participants in WADRC compared to WI‐pop were greater in the older group than in the younger group, as indicated by their ratios further above 1.
Hispanic ethnicity: In each age group, WADRC had a lower percentage of people with Hispanic ethnicity than WI‐pop.
Education: For both age groups, WADRC had higher levels of educational attainment than WI‐pop, such that the percentage of college graduates was more than doubled, with a greater difference observed for the older group than the younger group.
Rural residence: In each age group, the percentage of rural residence in WADRC was about half of that in WI‐pop. This percentage difference was slightly greater in the older group than in the younger group.
Neighborhood disadvantage ADI state ranking: For each age group, both WI‐pop and WADRC showed a right‐skewed distribution in ADI state ranking, demonstrating fewer people living in more disadvantaged neighborhoods (i.e., neighborhoods with higher ADI rankings). This skewness was slight for WI‐pop but sharp for WADRC, such that WADRC had higher percentages living in less disadvantaged neighborhoods and lower percentages living in more disadvantaged neighborhoods than WI‐pop. WADRC also had a lower median ADI ranking and less neighborhood disadvantage than WI‐pop overall. These findings were generally similar between the two age groups (Figure 3).
FIGURE 3.
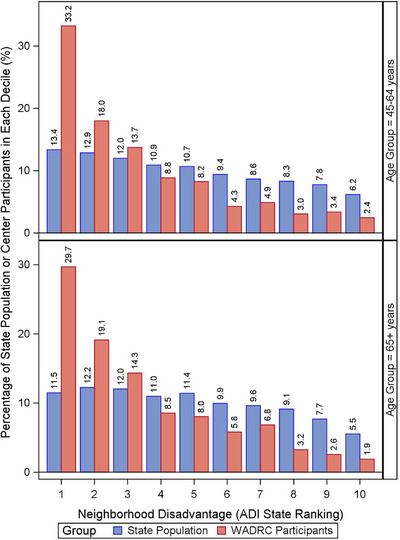
Comparison of neighborhood disadvantage measured by the ADI state ranking between the Wisconsin ADRC participants versus the WI‐pop of 45 years of age and older. ADI, area deprivation index; ADRC, Alzheimer's Disease Research Center; WI‐pop, Wisconsin state population.
Vascular risk factors: For both age groups and compared to WI‐pop, WADRC generally had lower vascular risks, as shown by lower percentages of hypertension, diabetes, and lower average values in systolic BP, BMI, and total cholesterol, except that WADRC had a slightly higher percentage of diabetes than WI‐pop in the younger group. The differences between WADRC versus WI‐pop were generally greater for the older group than the younger group, as indicated by the ratios of percentages further below 1 and standardized differences of averages further below zero (Table 2; Figures 2 & 4).
FIGURE 4.
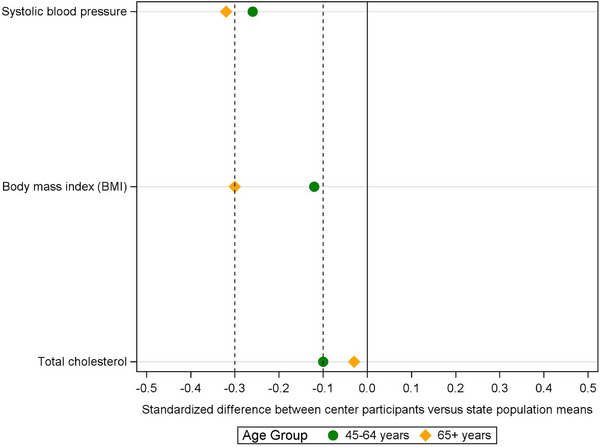
Standardized differences between the Wisconsin ADRC sample mean versus the WI‐pop mean in terms of the number of population standard deviations (i.e., (WADRC mean−state mean)/state SD) for each age group. A positive (or negative) standardized difference indicates that the sample mean is larger (or smaller) than the population mean. A standardized difference further from zero indicates a greater deviation between the sample versus the population means. ADRC, Alzheimer's Disease Research Center; SD, standard deviation; WADRC, Wisconsin Alzheimer's Disease Research Center; WI‐pop, Wisconsin state population.
4. DISCUSSION
WADRC participants are older than the WI‐pop, this is not surprising, given that more than 30% of the participants have dementia or MCI, and age is the leading risk factor for the disease. 1 WADRC participants also include a greater percentage of women than the state population, which is consistent with the gender composition of all ADRCs found in the NACC database. 4
Black and AI populations are overrepresented in ADRD prevalence 10 , 16 and associated risk factors. 24 Our center has invested substantial effort in recruiting these two racial groups by applying the Community Engaged Research approaches 25 and building long‐term relationships and trust with each community. Examples of such efforts include (1) supporting community advisory boards and shared decision‐making to provide culturally competent guidance on research; (2) Designing a variety of outreach and engagement programs that benefit the community, such as healthy cooking and nutrition lessons, fitness programs, computer classes, socialization groups, and newsletters, among others; (3) organizing culturally tailored community events that focus on participant appreciation, health/wellness, and ADRD research education; and (4) establishing research sites in the Black community and on the Oneida reservation (where most of the AI participants are recruited) to make study visits convenient for participants. Due to these efforts, WADRC participants include much higher proportions of Black and AI participants than the state population.
However, a comparison of educational attainment between WADRC versus WI‐pop stratified by race/ethnicity (Supplementary Analysis I; Table A3) reveals that greater proportions of Black and Al participants are highly educated, and smaller proportions have lower educational attainment, compared to their state population counterparts. Similar findings are observed for White, Hispanic, and Asian participants. WADRC Black participants show the least deviation from their population distribution compared to all other racial/ethnic groups. Of the 25 WADRC participants with the lowest educational attainment level—“Did not graduate high school,” 20 (80%) are Black adults. Compared to Black participants, AI participants have a greater deviation from their population distribution; about half have received a bachelor's or higher degree, compared to 14% of their state counterparts. Future recruitment from Black, AI, and all other racial/ethnic groups will focus on engaging individuals with lower educational attainment and from disadvantaged socioeconomic backgrounds and reduce barriers to research participation they face.
While focusing on recruiting Black and AI participants, our center has not devoted efforts in engaging and recruiting from other racial/ethnic communities. This has likely resulted in a lower percentage of Hispanic participants than their state population. In addition, research visits conducted only in English by default exclude individuals who are not fluent in the language. Of WADRC Hispanic participants, only 13% consider Spanish as their primary language, consisting of only 0.21% of the total participant sample. However, more than 4.6% of the WI‐pop speaks Spanish as their primary language. 26 (p10) and 29% of Hispanics/Latinos 65 years of age and older do not speak English or do not speak it well. 27 Given the fast growth of the Hispanic/Latino population and their increased risks for ADRD, 1 offering study visits in English and developing culturally competent engagement and recruitment approaches tailored to the Latino communities are important for increasing their inclusion in ADRD research.
Of all racial/ethnic groups, Asian American participants are most underrepresented compared to their state population; there are only four Asian American participants included in WADRC. This finding mirrors the underrepresentation of Asian Americans in medical research nationwide and the lack of National Institutes of Health (NIH) funding support for research on this racial group. 28 Knowledge about the dementia prevalence and risk factors for Asian Americans remains sparse, 29 and the very limited research has presented inconsistent findings about whether they bear increased or reduced dementia risks compared to White individuals. 16 , 30 Moreover, the limited research does not capture the vast heterogeneity among their diverse subgroups in risks and pathology associated with genetic, cultural, socioeconomic, and immigration history differences. 16 , 31 In addition, cultural misperceptions and stigma about dementia impose barriers to research participation in the group. 29 Including more Asian American participants and expanding the subgroups represented in research is important, especially considering their most rapid growth in the aged population. 32
Compared to the state population, WADRC participants have higher educational attainment and smaller percentages living in rural areas and disadvantaged neighborhoods. These three factors tend to correlate but can vary on an individual level. Research based on participants from a narrower spectrum of sociodemographic profiles could bias our scientific knowledge. For example, previous research has shown that the role of education in cognitive decline and reserve varies between education levels, 4 , 15 such that findings based on the highly educated may not apply to people with lower educational attainment. In studies on neighborhood disadvantages, the ADI distribution is often skewed such that most participants are from advantaged neighborhoods, whereas only a limited number are from severely disadvantaged neighborhoods. To address this data limitation, researchers usually regroup the original deciles of the ADI state ranking into a smaller number of categories (e.g., dichotomizing) for sample size consideration, 33 which prevents an in‐depth evaluation of the role of neighborhood disadvantage in ADRD risks. Expanding sociodemographic profiles represented in the sample and including individuals who are underrepresented and at a disadvantage will support generalizable findings and allow these individuals to benefit from the findings.
To increase enrollment from these underrepresented populations, our center collaborates with the UW Wisconsin Alzheimer's Institute (WAI) Dementia Diagnostic Clinic Network 34 to recruit participants from rural areas and highly disadvantaged neighborhoods across Wisconsin, which includes clinics serving Black and Latino communities. In addition, the Neighborhood Atlas (ADI geographical mapping) developed by UW CHDR 17 is an effective tool to identify disadvantaged neighborhoods for recruitment. Research news and discoveries are widely disseminated to the public through social media, including Twitter, Facebook, and YouTube, as well as the Dementia Matters podcast hosted at the Wisconsin ADRC, 35 serving as effective tools for education and outreach to people from broad educational and socioeconomic backgrounds. In addition, WADRC offers transportation to study visits to help overcome barriers to research participation related to transportation constraints.
WADRC participants generally have lower vascular risks than the state population. Few participants are excluded from participating in the ADRC due to severe cardiovascular disease. Thus, the lower vascular risk profile is likely due to healthy participant bias as this is a volunteer‐based convenience sample. Outreach to more rural areas and disadvantaged neighborhoods and inclusion of individuals with broader educational attainment may increase the breadth of vascular risk profiles.
Greater sample versus population differences were found for the older group than the younger group in most metrics, including race, education, rural residence, and vascular risks. As shown in Table 2, compared to the younger group, the older group of the state population is less racially/ethnically diverse, bears a lower level of educational attainment, has a higher percentage in rural residence, and shows greater overall vascular risks. These age differences in the population characteristics could have contributed to the greater sample versus population differences for the older group and highlighted the importance of adequately representing this age group in research, given their elevated dementia risks. 1 , 3
The values of this study are multifaceted. We provided an extensive summary of national repositories and multicenter studies in ADRD research and highlighted the common lack of sample representativeness in the field. We compared the sample characteristics of the Wisconsin ADRC participants against the WI‐pop, our regional population, to inform recruitment planning. To our knowledge, this study was the first comparison at the center level, that is, on the recruitment source for national repositories. Based on our findings, we explored the implications and causes of the sample versus population differences and discussed strategies for engaging and recruiting groups that are underrepresented in research. We demonstrated data sources that can be used for estimating population statistics and the graphical illustration of ratios and standardized differences between sample versus population statistics and their comparisons across groups. In addition, we offered a unique perspective in assessing research disparities by evaluating the sample characteristics in some social exposome factors, including rural residence and neighborhood disadvantage, which are rarely compared against the population.
Nonetheless, our study also has several limitations. First, except for the stratification by age, we mainly evaluated the marginal distributions of the variables instead of their joint distribution. We attempted to evaluate the joint distribution using multivariable survey logistic regressions. In the models, the individual record data of WADRC and the ACS Integrated Public Use Microdata Series (IPUMS) 36 were stacked together, with sociodemographic variables (age, sex, race/ethnicity, educational attainment) as the predictors and data source as the binary outcome. We tested all possible two‐way, three‐way, and four‐way interactions and found significant two‐way interactions between age and sex and between race/ethnicity and educational attainment. For younger participants, women were more likely than men to be included in WADRC. However, this sex difference diminished for older participants. For all racial/ethnic groups, compared to individuals who received a bachelor's or higher degree, individuals at lower levels of educational attainment were less likely to be included in WADRC. However, the magnitude of this difference varied across racial/ethnic groups. Details of the analysis can be found in the Supplementary Material (Supplementary Analysis II; Tables A4–A9). The results were generally consistent with the findings from the stratified subgroup analyses comparing sex by age group and comparing educational attainment by race/ethnicity reported previously.
A few statistical challenges are noted for this approach: (1) WADRC and ACS were independently sampled, and their data were collected separately. Combining the two data sources created a non‐nested study design. Under this design, the marginal and conditional probabilities for participation in WADRC may not be identifiable. 37 (2) There was non‐ignorable and non‐identifiable partial overlapping of individuals between data sources. 37 (3) The data sources used substantially different sampling approaches, with probability‐based, stratified, and clustered sampling for ACS and volunteer‐based, non‐random sampling of individuals for WADRC. (4) Asian and Hispanic/Latino racial groups might not have reliable estimates due to their extremely small sample sizes and/or having no participants at some variable levels, preventing a complete evaluation of the joint distribution and fairness in receiving research benefits. Methodological development is needed to address these challenges and guide future evaluation of joint distributions.
Second, like many other ADRD studies, enrollment is volunteer‐based without using a systematic probability‐based sampling approach. Volunteers are generally more motivated and accessible for research (e.g., due to clinical diagnosis, known family history, and health literacy). Correspondingly, selection bias can be introduced to both exposures and outcomes of interests and jeopardize the validity of estimating the relationship between these variables. 6 , 38 For example, WADRC recruitment sources varied across races (Table A1) and differed in the variables of interest (Supplementary Analysis III; Table A10). Correspondingly, the observed racial differences in these variables (Supplementary Analysis IV; Table A11) could be partially due to the confounding of recruitment sources. As a result, the associated bias could jeopardize the validity of studies evaluating the effect of race on these variables.
Validity and bias refer to whether the estimated causal effect of an exposure on an outcome in a study sample is equal to or different from the true causal effect in its target population. 39 , 40 Therefore, validity and bias must be defined and evaluated based on the specific exposure, outcome, causal effect, study sample, and target population for a particular study, varying from one study to another. In the current study, we do not evaluate any causal effect or designate any variable as an exposure or outcome. The WADRC sample and the WI‐pop also differ from the sample and population of the studies evaluating causal effects (abbreviated as casual studies). As WADRC serves as a participant registry and a source for national data repositories and cross‐center collaborations, studies involving WADRC participants often include only part of the WADRC sample according to their eligibility criteria and/or simultaneously include participants from other centers. The target populations of these studies may be nationwide and/or be narrowed to people of certain characteristics (e.g., having dementia). As stated previously, the current evaluation aims to help expand sociodemographic and health profiles represented in the WADRC sample, increase participation of groups at research disparity, and support various causal studies by providing eligible participant candidates enriched with characteristics available for selection. We do not aim to achieve a proportional distribution of WADRC equal to the state population, which, even if achieved, would not carry over to the causal studies as their samples and populations would differ from the ones in the current study. Care should be taken to reduce selection bias and approximate the distribution of the target population when enrolling participants for causal studies. However, even if the population distribution is matched in the study sample, bias can still be introduced due to the artificial relationship between the exposure and the outcome caused by confounders. Statistical approaches can be applied to correct bias and generalize the estimated causal effects from the study sample to the target population. 40 , 41 , 42 , 43 , 44 In the correction, the probabilities of being selected into the sample are often predicted from the joint distribution of multiple covariates and used to generate weights for adjusting the sample‐versus‐population difference in the covariate distribution. The causal effect in the population is next estimated using weighted statistical models. 41 , 42 , 45 , 46
Third, race and Hispanic ethnicity were treated as separate demographic factors in this study. This followed how the data were collected from the participants using the NACC standard Uniform Data Set (UDS) 47 required for all ADRCs and was consistent with how the U.S. Census collected the population data. Both the recently revised Census standard 48 and upcoming UDS version 4 (UDS 4) will combine race and ethnicity as one field and list Hispanic as an independent race, supporting proper identification and inclusion of Hispanic participants in future research.
Last, there is asynchrony in data collection years and slight differences in the definitions for some of the metrics used in the sample versus population (Supplementary Material). Future comparison of sample versus population characteristics would benefit from upfront planning for sample data collection to align with available population statistics. Moreover, it would be helpful to include additional metrics for comparison, such as social determinants of health added in the upcoming UDS 4 49 and the impairment in vision, hearing, and mobile functions measured by the ACS Disability Questionnaire. 50
In summary, participants included in the national repositories and multicenter studies are mainly recruited by ADRCs from their regional populations. Recruitment bias at the centers contributes to the lack of representativeness at the national level. Although ADRCs have different regional populations and specific recruitment focuses for scientific reasons, evaluating their participant characteristics may help explore novel approaches to proactively recruit underrepresented groups and collaboratively make the national participant pool and databases more inclusive. Representative samples and inclusive research are fundamental for generalizable scientific discoveries and equitable disease diagnosis, care, and treatment.
CONFLICT OF INTEREST STATEMENT
Drs. Yue Ma, W. Ryan Powell, Yuetiva Deming, Lindsay Clark, and Dorothy Edwards receive grant support from the National Institutes of Health (NIH). Dr. Maria Mora Pinzon receives grant support from the National Institute on Aging (NIA) R00AG076966, and the Wisconsin Alzheimer's Disease Research Center P30‐AG062715. She also serves on an advisory board for the Rand Corporation, and as consultant for education and research initiatives for the American College of Preventive Medicine and Arizona State University. Dr. Tamara LeCaire received grant support from the University of Wisconsin School of Medicine and Public Health Wisconsin Partnership Program (WPP). Dr. Erin Jonaitis receives grant support from the NIH. She also serves on the Data Safety Monitoring Board for a grant funded by the NIA K01AG073587. Dr. Nathaniel Chin consulted for NewAmsterdam and serves as a volunteer member of the Medical and Science Board of the Wisconsin Alzheimer's Association and the Alzheimer's ‘s Foundation of America. Dr. Art Walaszek has received grant support from the NIH and the University of Wisconsin School of Medicine and Public Health WPP. He also receives royalties from American Psychiatric Association Publishing for his books, Behavioral & Psychological Symptoms of Dementia and Late‐Life Depression & Anxiety. Dr. Ozioma Okonkwo receives grant support from the NIH. He also serves as the treasurer for the International Neuropsychological Society. Dr. Sterling Johnson receives grant support from the NIH. He also serves as a consultant for Enigma Biomedical and Alzpath. Dr. Sanjay Asthana receives grant support from the NIH. He also receives royalty as an editor of a textbook entitled, Hazzard's Geriatrics and Gerontology; McGraw Hill, Publisher. Dr. Carey Gleason receives grant support from the NIH. She also serves on the advisory boards for the ACE Trial, the Standard University Alzheimer's Disease Research Center, and University of New Mexico. Dr. Amy Kind receives grant support from the NIH. She has also received travel fund from the Alzheimer's Association. Dr. Babara Bendlin has served on scientific advisory boards and/or as a consultant for Weston Family Foundation, New Amsterdam, Cognito Therapeutics, and Merry Life Biomedical. She has received support from the NIA (R01AG062285, P30AG062715, R01AG037639, R01AG054059, RF1AG057784, R01AG070973, R01AG070883, and R01AG059312). Dr. Cynthia Carlsson receives grant support from the NIH, Department of Veterans Affairs, NIH/Lilly, NIH/Eisai, NIH/Cognition Therapeutics, and research medication support from Amarin Corporation. Andrew Bersch, Drs. William Buckingham, Gilda Ennis, Megan Zuelsdorff, and Richard Chappell, declare no conflicts of interest. Author disclosures are available in the Supporting Information.
CONSENT STATEMENT
Informed consent was obtained from all participants.
Supporting information
Supporting Information
Supporting Information
ACKNOWLEDGMENTS
We would like to thank the Wisconsin Alzheimer's Disease Research Center participants and staff for their contributions. Without their efforts, this study would not have been possible. We also would like to thank all five reviewers, Dr. Berry Greenberg (the editor), and Dr. Issa Dahabreh (Harvard University) for their insightful comments and valuable suggestions, which have benefited the manuscript greatly. This study was supported by the National Institutes of Health (NIH) National Institute on Aging (NIA) [grant numbers: P30 AG062715 (PI: Asthana), R01AG070883 (PIs: Kind & Bendlin), 1RF1AG057784 (PIs: Kind & Bendlin), 1R01MD010243 (PI: Kind), R01AG054059 (PI: Gleason), R01AG062285 (PI: Bendlin), and R01AG037639 (PI: Bendlin)]. Funding for the Survey of the Health of Wisconsin (SHOW) was provided by the University of Wisconsin School of Medicine and Public Health Wisconsin Partnership Program (WPP) Partnership Education and Research Committee (PERC) Award (Grant numbers: 5139, 4444, 2971, 2309, 1686, 658, 233 PRJ 25DJ).
Ma Y, Mora Pinzon MC, Buckingham WR, et al. Comparison of sample characteristics of Wisconsin Alzheimer's Disease Research Center participants with the Wisconsin state population—An evaluation of the recruitment effort. Alzheimer's Dement. 2025;11:e70036. 10.1002/trc2.70036
REFERENCES
- 1. 2023 Alzheimer's disease facts and figures. Alzheimers Dement. 2023;19(4):1598‐1695. doi: 10.1002/alz.13016 [DOI] [PubMed] [Google Scholar]
- 2. Mudrazija S, Vega W, Resendez J, Monroe S. Place and Brain Health Equity: Understanding the County‐Level Impacts of Alzheimer's. UsAgainstAlzheimer's; 2020. [Google Scholar]
- 3. Hendriks S, Peetoom K, Bakker C, et al. Global prevalence of young‐onset dementia: a systematic review and meta‐analysis. JAMA Neurol. 2021;78(9):1080‐1090. doi: 10.1001/jamaneurol.2021.2161 [DOI] [PMC free article] [PubMed] [Google Scholar]
- 4. Arce Rentería M, Mobley TM, Evangelista ND, et al. Representativeness of samples enrolled in Alzheimer's disease research centers. Alzheimers Dement Diagn Assess Dis Monit. 2023;15(2):e12450. doi: 10.1002/dad2.12450 [DOI] [PMC free article] [PubMed] [Google Scholar]
- 5. Franzen S, Smith JE, van den Berg E, et al. Diversity in Alzheimer's disease drug trials: the importance of eligibility criteria. Alzheimers Dement. 2022;18(4):810‐823. doi: 10.1002/alz.12433 [DOI] [PMC free article] [PubMed] [Google Scholar]
- 6. Gleason CE, Norton D, Zuelsdorff M, et al. Association between enrollment factors and incident cognitive impairment in Blacks and Whites: data from the Alzheimer's Disease Center. Alzheimers Dement J Alzheimers Assoc. 2019;15(12):1533‐1545. doi: 10.1016/j.jalz.2019.07.015 [DOI] [PMC free article] [PubMed] [Google Scholar]
- 7. Wilkins CH, Windon CC, Dilworth‐Anderson P, et al. Racial and ethnic differences in amyloid PET positivity in individuals with mild cognitive impairment or dementia: a secondary analysis of the Imaging Dementia–Evidence for Amyloid Scanning (IDEAS) cohort study. JAMA Neurol. 2022;79(11):1139‐1147. doi: 10.1001/jamaneurol.2022.3157 [DOI] [PMC free article] [PubMed] [Google Scholar]
- 8. Schwartz AL, Alsan M, Morris AA, Halpern SD. Why diverse clinical trial participation matters. N Engl J Med. 2023;388(14):1252‐1254. doi: 10.1056/NEJMp2215609 [DOI] [PubMed] [Google Scholar]
- 9. Chêne G, Beiser A, Au R, et al. Gender and incidence of dementia in the Framingham Heart Study from mid‐adult life. Alzheimers Dement J Alzheimers Assoc. 2015;11(3):310‐320. doi: 10.1016/j.jalz.2013.10.005 [DOI] [PMC free article] [PubMed] [Google Scholar]
- 10. Matthews KA, Xu W, Gaglioti AH, et al. Racial and ethnic estimates of Alzheimer's disease and related dementias in the United States (2015‐2060) in adults aged ≥65 years. Alzheimers Dement. 2019;15(1):17‐24. doi: 10.1016/j.jalz.2018.06.3063 [DOI] [PMC free article] [PubMed] [Google Scholar]
- 11. Powell WR, Buckingham WR, Larson JL, et al. Association of neighborhood‐level disadvantage with Alzheimer disease neuropathology. JAMA Netw Open. 2020;3(6):e207559. doi: 10.1001/jamanetworkopen.2020.7559 [DOI] [PMC free article] [PubMed] [Google Scholar]
- 12. Rahman M, White EM, Mills C, Thomas KS, Jutkowitz E. Rural‐urban differences in diagnostic incidence and prevalence of Alzheimer's disease and related dementias. Alzheimers Dement J Alzheimers Assoc. 2021;17(7):1213‐1230. doi: 10.1002/alz.12285 [DOI] [PMC free article] [PubMed] [Google Scholar]
- 13. O'Brien JT, Markus HS. Vascular risk factors and Alzheimer's disease. BMC Med. 2014;12(1):218. doi: 10.1186/s12916-014-0218-y [DOI] [PMC free article] [PubMed] [Google Scholar]
- 14. Mungas D, Gavett B, Fletcher E, Farias ST, DeCarli C, Reed B. Education amplifies brain atrophy effect on cognitive decline: implications for cognitive reserve. Neurobiol Aging. 2018;68:142‐150. doi: 10.1016/j.neurobiolaging.2018.04.002 [DOI] [PMC free article] [PubMed] [Google Scholar]
- 15. Zahodne LB, Mayeda ER, Hohman TJ, et al. The role of education in a vascular pathway to episodic memory: brain maintenance or cognitive reserve?. Neurobiol Aging. 2019;84:109‐118. doi: 10.1016/j.neurobiolaging.2019.08.009 [DOI] [PMC free article] [PubMed] [Google Scholar]
- 16. Mayeda ER, Glymour MM, Quesenberry CP, Whitmer RA. Inequalities in dementia incidence between six racial and ethnic groups over 14 years. Alzheimers Dement J Alzheimers Assoc. 2016;12(3):216‐224. doi: 10.1016/j.jalz.2015.12.007 [DOI] [PMC free article] [PubMed] [Google Scholar]
- 17. Kind AJH, Buckingham WR. Making neighborhood‐disadvantage metrics accessible—the Neighborhood Atlas. N Engl J Med. 2018;378(26):2456‐2458. doi: 10.1056/NEJMp1802313 [DOI] [PMC free article] [PubMed] [Google Scholar]
- 18. Ingram D, Parker J, Schenker N, et al. United States Census 2000 population with bridged race categories. Vital Health Stat. 2003;2(135):1‐62. [PubMed] [Google Scholar]
- 19. Centers for Disease Control and Prevention . The BRFSS data user guide. Centers for Disease Control and Prevention; 2013. [Google Scholar]
- 20. United States Census Bureau . Understanding and using American Community Survey data. United States Census Bureau; 2020. [Google Scholar]
- 21. Malecki KMC, Nikodemova M, Schultz AA, et al. The Survey of the Health of Wisconsin (SHOW) program: an infrastructure for advancing population health. Front Public Health. 2022;10:818777. Accessed September 20, 2023. https://www.frontiersin.org/articles/10.3389/fpubh.2022.818777 [DOI] [PMC free article] [PubMed] [Google Scholar]
- 22. Menzel U. EMT: Exact Multinomial Test: Goodness‐of‐Fit Test for Discrete Multivariate Data. R package EMT version 1.3. Published online 2023. https://cran.r-project.org/web/packages/EMT/EMT.pdf
- 23. Benjamini Y, Hochberg Y. Controlling the false discovery rate: a practical and powerful approach to multiple testing. J R Stat Soc Ser B Methodol. 1995;57(1):289‐300. [Google Scholar]
- 24. Chen HY, Panegyres PK. The role of ethnicity in Alzheimer's disease: findings from The C‐PATH online data repository. J Alzheimers Dis JAD. 2016;51(2):515‐523. doi: 10.3233/JAD-151089 [DOI] [PubMed] [Google Scholar]
- 25. Green‐Harris G, Coley SL, Koscik RL, et al. Addressing disparities in Alzheimer's disease and African‐American participation in research: an asset‐based community development approach. Front Aging Neurosci. 2019;11:125. doi: 10.3389/fnagi.2019.00125 [DOI] [PMC free article] [PubMed] [Google Scholar]
- 26. acutrans19 . Top 10 Languages of Wisconsin. Acutrans | Certified Translation Services. March 7, 2023. Accessed May 16, 2024. https://acutrans.com/top‐10‐languages‐of‐wisconsin/
- 27. United States Census Bureau . PCT062H: Age by language spoken at home by ability to speak english for the population 5 years and over (hispanic or latino). United States Census Bureau. Accessed May 22, 2024. https://data.census.gov/table/DECENNIALSLDS.PCT062H?q=Age%20and%20Sex&t=Language%20Spoken%20at%20Home:Hispanic%20or%20Latino [Google Scholar]
- 28. Nguyen HAT, Zheng A, Gugel A, Kistin CJ. Asians and Asian subgroups are underrepresented in medical research studies published in high‐impact generalist journals. J Immigr Minor Health. 2021;23(3):646‐649. doi: 10.1007/s10903-021-01142-6 [DOI] [PMC free article] [PubMed] [Google Scholar]
- 29. Lim S, Mohaimin S, Min D, et al. Alzheimer's disease and its related dementias among Asian Americans, native Hawaiians, and Pacific Islanders: a scoping review. J Alzheimers Dis JAD. 2020;77(2):523‐537. doi: 10.3233/JAD-200509 [DOI] [PMC free article] [PubMed] [Google Scholar]
- 30. Sentell TL, Valcour N, Ahn HJ, et al. High rates of native Hawaiian and older Japanese patients hospitalized with dementia in Hawai'i. J Am Geriatr Soc. 2015;63(1):158‐164. doi: 10.1111/jgs.13182 [DOI] [PMC free article] [PubMed] [Google Scholar]
- 31. Mayeda ER, Glymour MM, Quesenberry CP, Whitmer RA. Heterogeneity in 14‐year dementia incidence between Asian American subgroups. Alzheimer Dis Assoc Disord. 2017;31(3):181‐186. doi: 10.1097/WAD.0000000000000189 [DOI] [PMC free article] [PubMed] [Google Scholar]
- 32. Wu B, Qi X. Addressing health disparities among older Asian American populations: research, data, and policy. Public Policy Aging Rep. 2022;32(3):105‐111. doi: 10.1093/ppar/prac015 [DOI] [PMC free article] [PubMed] [Google Scholar]
- 33. Hunt JFV, Buckingham W, Kim AJ, et al. Association of Neighborhood‐level disadvantage with cerebral and hippocampal volume. JAMA Neurol. 2020;77(4):451‐460. doi: 10.1001/jamaneurol.2019.4501 [DOI] [PMC free article] [PubMed] [Google Scholar]
- 34. Mora Pinzon M, Krainer J, LeCaire T, et al. The Wisconsin Alzheimer's Institute Dementia Diagnostic Clinic network: a community of practice to improve dementia care. J Am Geriatr Soc. 2022;70(7):2121‐2133. doi: 10.1111/jgs.17768 [DOI] [PMC free article] [PubMed] [Google Scholar]
- 35. Alzheimer's Disease Research Center . Dementia Matters. Alzheimer's Disease Research Center. Accessed May 10, 2024. https://www.adrc.wisc.edu/dementia‐matters [Google Scholar]
- 36. Ruggles S, Flood S, Sobek M, et al. IPUMS USA. Version 15.0. IPUMS; 2023. doi: 10.18128/D010.V15.0 [DOI] [Google Scholar]
- 37. Dahabreh IJ, Haneuse SJPA, Robins JM, et al. Study designs for extending causal inferences from a randomized trial to a target population. Am J Epidemiol. 2021;190(8):1632‐1642. doi: 10.1093/aje/kwaa270 [DOI] [PMC free article] [PubMed] [Google Scholar]
- 38. Howe CJ, Robinson WR. Survival‐related selection bias in studies of racial health disparities: the importance of the target population and study design. Epidemiology. 2018;29(4):521. doi: 10.1097/EDE.0000000000000849 [DOI] [PMC free article] [PubMed] [Google Scholar]
- 39. Lu H, Cole SR, Howe CJ, Westreich D. Toward a clearer definition of selection bias when estimating causal effects. Epidemiol Camb Mass. 2022;33(5):699‐706. doi: 10.1097/EDE.0000000000001516 [DOI] [PMC free article] [PubMed] [Google Scholar]
- 40. Hayes‐Larson E, Zhou Y, Rojas‐Saunero LP, et al. Methods for extending inferences from observational studies: considering causal structures, identification assumptions, and estimators. Epidemiology. 2024;35:753‐763. doi: 10.1097/EDE.0000000000001780 [DOI] [PMC free article] [PubMed] [Google Scholar]
- 41. Dahabreh IJ, Robertson SE, Steingrimsson JA, Stuart EA, Hernán MA. Extending inferences from a randomized trial to a new target population. Stat Med. 2020;39(14):1999‐2014. doi: 10.1002/sim.8426 [DOI] [PubMed] [Google Scholar]
- 42. Dahabreh IJ, Robertson SE, Tchetgen EJ, Stuart EA, Hernán MA. Generalizing causal inferences from individuals in randomized trials to all trial‐eligible individuals. Biometrics. 2019;75(2):685‐694. doi: 10.1111/biom.13009 [DOI] [PMC free article] [PubMed] [Google Scholar]
- 43. Howe CJ, Cole SR, Lau B, Napravnik S, Eron JJ. Selection bias due to loss to follow up in cohort studies. Epidemiol Camb Mass. 2016;27(1):91‐97. doi: 10.1097/EDE.0000000000000409 [DOI] [PMC free article] [PubMed] [Google Scholar]
- 44. Zullo AR, Adams JW, Gantenberg JR, Marshall BDL, Howe CJ. Examining neighborhood poverty‐based disparities in HIV/STI prevalence: an analysis of add health data. Ann Epidemiol. 2019;39:8‐14.e4. doi: 10.1016/j.annepidem.2019.09.010 [DOI] [PMC free article] [PubMed] [Google Scholar]
- 45. Westreich D, Edwards JK, Lesko CR, Stuart E, Cole SR. Transportability of trial results using inverse odds of sampling weights. Am J Epidemiol. 2017;186(8):1010‐1014. doi: 10.1093/aje/kwx164 [DOI] [PMC free article] [PubMed] [Google Scholar]
- 46. Hayes‐Larson E, Mobley TM, Mungas D, et al. Accounting for lack of representation in dementia research: Generalizing KHANDLE study findings on the prevalence of cognitive impairment to the California older population. Alzheimers Dement. 2022;18(11):2209‐2217. doi: 10.1002/alz.12522 [DOI] [PMC free article] [PubMed] [Google Scholar]
- 47. Besser L, Kukull W, Knopman DS, et al. Version 3 of the National Alzheimer's Coordinating Center's Uniform Data Set. Alzheimer Dis Assoc Disord. 2018;32:351‐358. doi: 10.1097/WAD.0000000000000279 [DOI] [PMC free article] [PubMed] [Google Scholar]
- 48. Gamboa S. Hispanic or Latino and Middle Eastern or North African are now federal race categories. NBC News. March 28, 2024. Accessed May 10, 2024. https://www.nbcnews.com/news/latino/hispanic‐latino‐middle‐eastern‐north‐african‐new‐race‐categories‐rcna145376 [Google Scholar]
- 49. National Alzheimer's Coordinating Center (NACC) . Uniform Data Set (UDS) Version 4.0 Form A1a Social Determinants of Health (SDoH). National Alzheimer's Coordinating Center (NACC); 2024. Accessed October 17, 2024. https://files.alz.washington.edu/UDS4/preview‐forms/FormA1a‐Preview‐April2024.pdf [Google Scholar]
- 50. CDC . Disability and Health ‐ Disability Data. Centers for Disease Control and Prevention. November 26, 2019. Accessed May 10, 2024. https://www.cdc.gov/ncbddd/disabilityandhealth/datasets.html [Google Scholar]
Associated Data
This section collects any data citations, data availability statements, or supplementary materials included in this article.
Supplementary Materials
Supporting Information
Supporting Information