Abstract
Knowledge of the rate of point mutation is of fundamental importance, because mutations are a vital source of genetic novelty and a significant cause of human diseases. Currently, mutation rate is thought to vary many fold among genes within a genome and among lineages in mammals. We have conducted a computational analysis of 5,669 genes (17,208 sequences) from species representing major groups of placental mammals to characterize the extent of mutation rate differences among genes in a genome and among diverse mammalian lineages. We find that mutation rate is approximately constant per year and largely similar among genes. Similarity of mutation rates among lineages with vastly different generation lengths and physiological attributes points to a much greater contribution of replication-independent mutational processes to the overall mutation rate. Our results suggest that the average mammalian genome mutation rate is 2.2 × 10⁻⁹ per base pair per year, which provides further opportunities for estimating species and population divergence times by using molecular clocks.
Keywords: neutral evolution‖substitution pattern‖disparity index‖generation length‖molecular clock
Rates of point mutation can be determined indirectly by estimating the rate at which the neutral substitutions accumulate in protein-coding genes (1). Synonymous substitutions in protein-coding genes generally are free from natural selection and are used frequently for inferring neutral substitution rates (1, 2). In particular, the fourfold-degenerate sites are expected to harbor only the neutral substitutions, because all mutations at these sites are synonymous at the amino acid sequence level. By using estimates of evolutionary distances based on neutral substitutions, many studies have examined the null hypotheses of uniformity of neutral mutation rates among genes within a genome and among mammalian lineages and have come to conflicting conclusions (2–9). For example, significant differences in mutation rates among mammalian lineages reported over the last two decades led to the proposal of the generation-time effect hypothesis (10–13). However, Easteal et al. (14) have argued that previous results of substantial differences among lineages observed may have been caused by the use of incorrect fossil dates or inappropriate outgroups. Similarly, there is significant controversy regarding differences in mutation rate among genes within a genome (8, 9, 15) and over 10-fold differences in the estimates of the mutation rates among studies (1.1–12.4 × 10⁻⁹ substitutions per site per year; refs. 3, 11, 12, and 16–19).
One common feature of many of these studies is that they have either analyzed a small number of genes or only a few species. Analysis of a large sample of genes from a genome and diverse phylogenetic lineages is the key to testing the null hypothesis of equal mutation rates within and among genomes. A large number of genes is necessary, because only a fraction (≈15%) of codon positions in a sequence are fourfold-degenerate (see Fig. 1 legend) and we need to sample genomic regions extensively. Furthermore, mutation rate information from many inter- as well as intraordinal mammalian species pairs is necessary to test whether the observed differences, if any, among mammalian orders are likely to be tied significantly to differences in generation times and physiological attributes among groups. Therefore, we have assembled a data set of 17,208 protein-coding DNA sequences belonging to 5,669 different nuclear genes from a total of 326 placental mammalian species to characterize the extent of difference in mutation rates among genes in a genome and among lineages.
Figure 1.
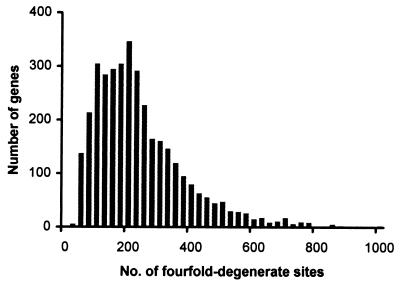
Distribution of the number of fourfold-degenerate sites in the human-mouse orthologous genes. The average number of fourfold-degenerate sites from 3,722 genes of human-mouse comparison is 245, which is 15.7% of the average cDNA length (1,568).
Materials and Methods
Data Mining and Assembly.
Phylogenetic trees of 8,627 gene families in the HOVERGEN database (20) release 36 were constructed from amino acid sequence alignments by using the neighbor-joining method in MEGA2 (21). The cDNA sequence alignments for orthologous sequence sets then were generated using amino acid sequence alignments as guides. Neighbor-joining trees were scanned automatically followed by manual inspection to identify orthologous sequence sets. We enforced strict orthology definitions by considering sequences to be orthologous only if no gene duplication events were detected since their divergence from the most recent common ancestor. All gene families containing fewer than three sequences were excluded, which produced a set of 3,132 gene families. There were a total of 326 species, with 113 species represented by >2 genes. The final data set assembled 17,208 protein-coding DNA sequences belonging to 5,669 different nuclear genes from a total of 326 placental mammalian species available in the databanks. The number of sequences available from different species and groups varied extensively: primates, 5,618 sequences; sciurognath rodents, 8,142 sequences; artiodactyls, 2,042 sequences; lagomorphs, 573 sequences; carnivores, 483 sequences; hystricognath rodents, 205 sequence; and perissodactyls, 145 sequences.
All computations were done by using only the fourfold-degenerate sites for sequence pairs. We took a stringent approach in identifying fourfold-degenerate sites by selecting only those sites that have remained fourfold-degenerate throughout the evolutionary history of the pair of species compared. This task was accomplished by designating a site as fourfold-degenerate only if it was so in both the sequences compared. Fig. 1 shows the distribution of the number of fourfold-degenerate sites in 3,722 genes in the human-mouse comparison.
Estimation of Evolutionary Distance.
Evolutionary divergence (d4) between sequences at fourfold-degenerate sites was estimated by using the Tamura–Nei method (22) to correct for multiple hits by accounting for transition/transversion rate and base-frequency biases. For a given species pair, multigene evolutionary distance was computed by taking the average of evolutionary distance over all genes. For two groups of species, the evolutionary distance was estimated by first computing average gene distances between species belonging to the two groups and then taking an average of these distances over all genes.
Estimation of Expected Variance for a Multigene Distribution.
The expected amount of variance in the distribution of multigene distances for a given pair of species is the sum of the estimation variation (Ve) contributed by the use of distance methods to correct for multiple hits and the variance contributed by the stochastic nature of the evolutionary process (Vs). For a set of N independent genes, Ve = Σi(Ve,i)/N, where Ve,i is the estimation variance for gene i. It is computed by using Tamura–Nei's variance formula (22), VTN, as Ve,i = VTN − di/Li, where Li is the number of sites, and di is the Tamura–Nei distance. Under the null hypothesis of equal mutation rate per site (μ), Vs is obtained by considering a Poisson process governing the arrival of mutations at a finite number of fourfold-degenerate sites in a given gene. For N genes, it is given by Vs = Σi (μ/Li)/N.
Determination of Physical Location of Genes in the Human Genome Map.
Currently the human genome map consists of relative positions of a large number of contigs on each chromosome. The gene content of each contig was obtained from the NCBI ftp site (ftp://ncbi.nlm.nih.gov/genomes/H_sapiens/). We first mapped the GenBank accession numbers of human genes in our data set to their corresponding unique LocusIDs by using the LocusLink public resource (http://ncbi.nlm.nih.gov/locuslink) and then constructed a complete map for all human sequences included in this study. Chromosomal locations of mouse genes also were obtained from LocusLink. For the analysis of gene proximity and mutation rate, the physical distance between a gene pair on human chromosome was estimated by subtracting the ending nucleotide position of the first gene from the starting nucleotide position of the second gene. Only adjacent genes on human chromosome belonging to the same conserved synteny in the mouse genome were used in the gene pairs, and no gene was used more than once. Conserved syntenies were determined by using the contiguous sets of autosomal markers method (23).
Results and Discussion
Homogeneity of Substitution Patterns Between Lineages.
Although the fourfold-degenerate sites are expected to accumulate only synonymous substitutions, the evolutionary distances estimated by using these sites are useful in estimating the underlying mutation rate only if the nucleotide substitutions have accrued with the same substitution pattern in the two species compared. That is, the homologous sites in the two sequences compared in a given gene must have evolved with the same instantaneous substitution matrices. Substitution patterns in a given gene may shift in one lineage as compared with its orthologous counterpart for a number of reasons including chromosomal rearrangements (23), gene transfer (24), or centromere movement (e.g., mouse genome). In these cases, substitution patterns in genes may be affected to fix mutations that make the base composition of the gene to be more similar to its chromosomal location [amelioration effect (24)], and this will be more pronounced at the sites that are selectively neutral. Therefore, the substitution rate at neutral sites in those genes will be higher than the actual mutation rate (25), rendering such genes unsuitable for inferring mutation rates.
Therefore, we conducted the disparity index test for each pair of orthologous sequences (26, 27) to identify genes in which fourfold-degenerate sites are not evolving with homogeneous substitution patterns among the lineages compared. The disparity index test directly examines the null hypothesis of homogeneity of the evolutionary pattern between two lineages by testing whether the observed difference in nucleotide frequencies between sequences is more than that expected by chance alone, given the number of differences observed between sequences. It does not require the knowledge of the actual pattern of substitution, evolutionary relationships among species, or equality of substitution rates among lineages (26, 27).
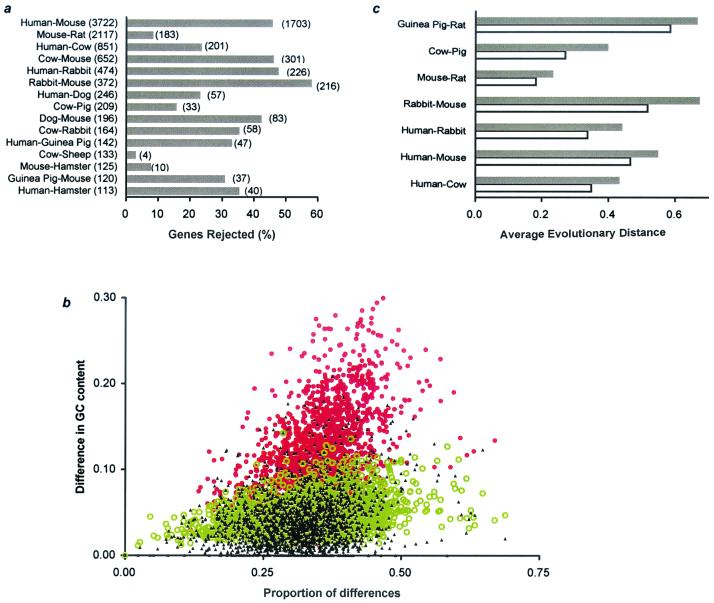
The disparity index test revealed that the fourfold-degenerate sites in a large number of genes have not evolved homogeneously in inter- as well as intraordinal comparisons (Fig. 2a). For instance, sequences of the same gene in human and mouse are evolving with significantly different evolutionary substitution patterns in 1,703 of 3,722 comparisons (46%). The red closed circles in Fig. 2b correspond to genes that were rejected by the disparity index test when the expected and observed difference in GC content was tested. These genes clearly show much higher observed GC content difference than that expected by chance alone (the expected distribution is depicted by green open circles). On the contrary, GC content differences between human and mouse for the genes passing the disparity index test (black closed triangles) show a distribution that overlaps with the expected distribution (Fig. 2b). It is apparent that mutations in the fourfold-degenerate sites are fixed with different patterns of substitution in different genes depending on the chromosomal context (e.g., isochore structure) in the genome (28). However, the observed differences in G + C content in fourfold-degenerate sites among genes may be an indication of differences in actual patterns of substitution or mutation among genes.
Figure 2.
(a) Proportion of genes rejected for 15 mammalian pairs using the disparity index test in testing the null hypothesis of homogeneity of substitution patterns in fourfold-degenerate sites at a 5% significance level (26). The total number of genes examined is shown in parentheses next to the name of the species pair; the number of genes rejected is shown next to the corresponding bar. (b) Scatter plot showing the relationship of ΔGC4 (GC content difference at fourfold-degenerate sites in orthologous sequences) with p4 (proportion of fourfold-degenerate sites with A/T ↔ G/C difference) for genes passing (black) and failing (red) the disparity index test. Green markers show the expected relationship of ΔGC4 calculated from sequence length and p4 for each gene by using equation 10 in ref. 26. (c) Overestimation of evolutionary distance caused by genes evolving with heterogeneous patterns of evolution for seven representative mammalian pairs. Open bars show the estimate of average distance from all genes passing the homogeneity test (26, 27). Dark bars show the average distance for the rejected genes (heterogeneous).
Therefore, synonymous substitutions in a large number of genes are not suitable to use for inferring mutation rates. In fact, the inclusion of genes (sequence pairs) evolving under heterogeneous evolutionary patterns would produce distance estimates that are higher than that expected for the genes evolving with homogenous substitution patterns. Because different lineage comparisons show this heterogeneity to different extents (Fig. 2c), estimates will be biased to different extents, which is likely to lead to erroneous conclusions regarding large mutation-rate differences among species (25). Both these problems are clearly evident in Fig. 2c, which shows that the difference in evolutionary distances at fourfold-degenerate sites among the genes, which passed or failed the disparity index test, is as large as 46% (cow-pig comparison) and differs multifold among different species pairs. For this reason, all genes showing pattern heterogeneity in fourfold-degenerate sites should be and were removed from any further analyses. This removal reduces the number of genes considerably (Fig. 2a), but still the numbers of the fourfold-degenerate sites analyzed were quite large (682–543,962; see Fig. 5 legend).
Figure 5.
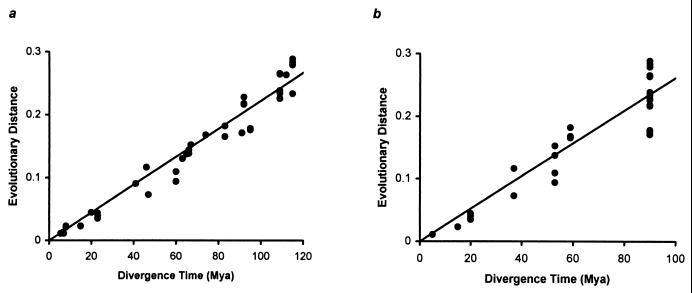
Accumulation of neutral substitutions over time (million years) in diverse mammalian species. The average distance per lineage is plotted for inter- and intraordinal comparisons by using, respectievely, molecular data-based (a) and fossil-based (b) time estimates reported previously. Linear regression produced a rate of 2.22 × 10⁻⁹ substitutions per site per year million years ago (r = 0.97, n = 43) for the molecular data and 2.61 × 10⁻⁹ substitutions per site per year (r = 0.92, n = 33) for the fossil data. The divergence time estimates (million years ago, Mya) from molecular data (30, 35, 40–43)/fossil records (44–46), and the number of fourfold sites/genes used were: human-chimpanzee (5.5/5.5, 6,302/33), human-gorilla (7/–, 3,605/23), human-orangutan (8/–, 4,329/30), chimpanzee-gorilla (7/–, 1,674/13), chimpanzee-orangutan (8/–, 1,497/10), gorilla-orangutan (8/–, 1,936/15), cercopithecidae-hylobatidae (23/20, 1,290/10), hominidae-hylobatidae (15/–, 2,321/19), cercopithecidae-hominidae (23/20, 38,128/231), catarrhini-platyrrhini (47/37, 8,194/54), cetacea-ruminantia (60/53, 955/8), cetacea-suina (60/53, 682/10), ruminantia-tylopoda (67/53, 736/5), ruminantia-suina (65/53, 30,063/204), bovinae-caprinae (20/20, 24,474/158), bovoidea-cervoidea (23/20, 1,765/16), canidae-felidae (46/37, 5,651/41), gerbillinae-cricetinae (66/–, 1,172/11), gerbillinae-murinae (66/–, 2,605/24), murinae-cricetinae (66/–, 52,043/264), mus-rattus (41/–, 486,306/2,139), primates-carnivora (95/–, 49,267/266), primates-cetartiodactyla (95/–, 179,032/985), primates-perissodactyla (95/–, 11,593/75), primates-lagomorpha (91/–, 54,670/260), primates-hystricognath rodents (109/–, 18,292/110), primates-sciurognath rodents (115/–, 543,962/2,708), cetartiodactyla-carnivora (83/–, 24,086/160), cetartiodactyla-perissodactyla (83/–, 9,188/75), cetartiodactyla-lagomorpha (92/–, 30,465/175), cetartiodactyla-hystricognath rodents (109/–, 10,227/72), cetartiodactyla-sciurognath rodents (115/–, 119,345/756), carnivora-perissodactyla (74/–, 5,364/44), carnivora-lagomorpha (92/–, 9,498/58), carnivora-hystricognath rodents (109/–, 4,986/31), carnivora-sciurognath rodents (115/–, 28,644/191), perissodactyla-lagomorpha (92/–, 4,131/34), perissodactyla-hystricognath rodents (109/–, 1,779/18), perissodactyla-sciurognath rodents (115/–, 7,843/60), hystricognath rodents-lagomorpha (109/–, 5,447/36), hystricognath-sciurognath rodents (115/–, 19,930/123), sciurognath rodents-lagomorpha (112/–, 36,672/219). In the above, a dash indicates the absence of information.
Distribution of Evolutionary Rates Among Genes in Human and Mouse.
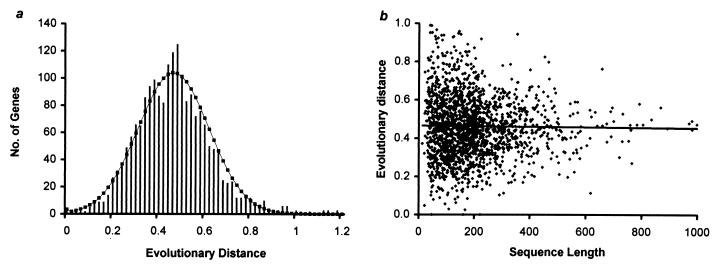
Fig. 3a shows the distribution of the neutral distance estimated by using the fourfold-degenerate sites (d4) from 2,019 human-mouse genes. This distribution of neutral distance is equivalent to the distribution of evolutionary rates, because the time of divergence is the same for each pair of orthologous sequences and thus is a constant factor in each comparison. This distribution is largely symmetrical and bell-shaped and has considerable dispersion (mean = 0.466, variance = 0.035). We find that genes with small sequence lengths mostly contribute to this variation, because long genes show distance estimates close to the overall average as compared with the short genes (Fig. 3b). Importantly, the averages for short and long genes are almost identical to the overall average. In fact, the expected variance of 0.029 (0.025 and 0.004 for estimation and stochastic variances, respectively; see Materials and Methods) of the multigene distribution under the null hypothesis of uniform mutation rate among genes is close to the observed variance (0.035). A normal curve drawn with expected variance around the mean appears to enclose the observed distribution well (Fig. 3a). Therefore, the observed variation in neutral distances among genes can arise even if the mutation rates are the same among genes.
Figure 3.
(a) A histogram of the neutral evolutionary distances estimated by using fourfold-degenerate sites of 2,019 human and mouse genes (mean = 0.466 and variance = 0.035; two outliers were removed from each tail). The normal distribution curve is drawn by using the observed mean and the expected variance under the null hypothesis of uniform neutral mutation rate among genes. (b) The distribution of evolutionary distances estimated from genes of varying sequence lengths.
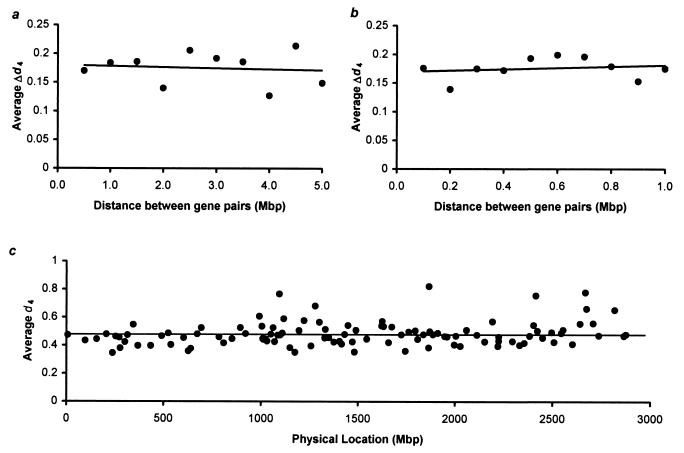
We directly tested the null hypothesis of mutation rate uniformity among genes by examining the relationship of gene proximity and evolutionary distance by using 1,901 genes, for which the exact location on human was available and the information about their relative position on a segment of conserved synteny with mouse was known. If the genes located closely evolve with similar rates as reported (8, 9), the difference in neutral evolutionary distance (Δd4) of closely located gene pairs would be smaller than that for distantly located gene pairs. To test this prediction, we computed the average Δd4 of gene pairs located in 1–5 million base-pair (Mbp) distance with an interval of 0.5 Mbp. Fig. 4a shows that the average Δd4 for closely located genes is not smaller than those located further apart. For example, the average Δd4 for genes located less than 0.5 Mbp apart and less than 5.0 Mbp (but more than 4.5 Mbp) apart is very similar (0.17 and 0.15, respectively; Fig. 4a). In fact there is no significant correlation between the gene proximity and evolutionary rate plotted in Fig. 4a. This holds true in the analyses using the genes located even closer (Fig. 4b). The average evolutionary distances in different conserved segments are close to the overall average distance estimated using all the homogeneously evolving human-mouse orthologous genes (Fig. 4c). However, apart from a few outliers, chromosome 19 does show significantly higher evolutionary distances compared with other chromosomes. As expected, the average distance for the human X chromosome was lower than the average mutation rate (0.37 as compared with 0.47).
Figure 4.
Average differences in neutral evolutionary distances using human-mouse comparison (Δd4) were plotted for gene pairs located within 0.5 (a) and 0.1 Mbp (b). (c) Average neutral evolutionary distances (d4) from the genes located within a human-mouse conserved segment were plotted corresponding to their position on the human chromosomes. The x axis refers to the starting location of the conserved segments in a super chromosome where all 22 autosomes were concatenated in order from head to tail. A total of 108 conserved segments, each containing a minimum of five genes, were used. The horizontal line indicates the average d4 computed by using all 1,901 genes.
Mutation Rates Among Mammalian Lineages.
We examined the temporal constancy of neutral evolutionary rate among diverse mammalian lineages. The divergence time and evolutionary distance for 43 mammalian pairs clearly show a linear relationship (correlation coefficient = 0.97) with the regression analysis indicating that the mammalian genomes accumulate mutations at an average rate of 2.22 × 10⁻⁹ substitutions per site per year (Fig. 5a). We also estimated the mutation rate by using only fossil-based divergence times for intraordinal splits and 90 million years for superordinal divergences (29–31). This yields an upper bound of 2.61 × 10⁻⁹ substitutions per site per year (Fig. 5b). We did not include the fossil-based estimates for the divergence within scuirognath rodents because of their highly controversial nature (14, 32–36). However, inclusion of 10–16 million years divergence for among murid rodent families did not change the slope of the regression line for the fossil-based estimates.
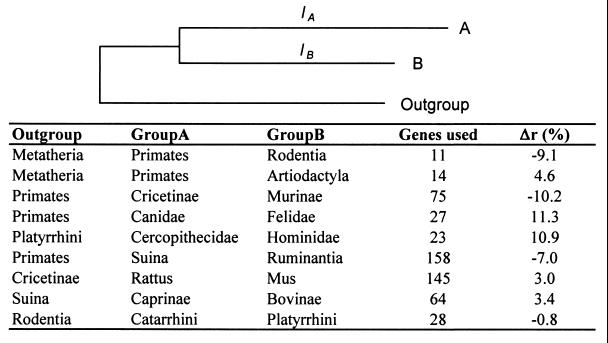
To obtain an assessment independent of the divergence times, we examined the similarity of rates among lineages by conducting relative rate tests using an outgroup species (Fig. 6). For primates and rodents (using marsupials as an outgroup), the average rate difference in multigene analysis was ≈9%. Interestingly, a similar magnitude of difference was found even in intraordinal comparisons. For instance, the average rate difference between canidae and felidae or between murinae and cricetinae using primates as outgroup is 10–11%. Therefore, small rate differences seem to exist among lineages, and clearly there are no systematic relationships between the evolutionary rate and generation length. This means that the generation length and physiological differences among diverse groups do not influence the neutral substitution rates significantly, and the evolutionary time is the principal factor dictating the accumulation of neutral mutations.
Figure 6.
Relative evolutionary rate among different mammalian lineages. The relative evolutionary rate differences (Δr) in a gene for two lineages (say, A and B) were computed as Δr = [lA − ½(lA + lB)]/½(lA + lB), where lA and lB are the least-squares estimates of the branch lengths leading to the two lineages using the average distances between species/groups A and B and their distances with the outgroup(s). Δr was computed for each gene, and the mean value taken over all genes for groups A and B. Negative values indicate that group B is evolving faster than group A. Only the genes passing the disparity index test were used in this analysis.
A much larger rate difference between mice and humans has been reported (3, 13). Such results seem to be caused by the inclusion of genes evolving with heterogeneous substitution patterns, because we find that these genes show a much larger relative rate difference (34%) between primates and rodents than those from genes that pass the disparity index test for homogeneity of substitution patterns (9%). Therefore, fixation of mutations under heterogeneous substitution pattern in the orthologous sequences rather than the difference in mutation rates is likely to be the cause for the results reported previously.
The absence of significant correlation between the mutation rate and generation time is likely to prompt a reassessment of the generation time effect hypothesis, in which errors in DNA replication in germ-line cells is considered to be the major source of mutation (11, 13). This hypothesis predicts a higher mutation rate in species with shorter generation time (e.g., mice as compared with humans). This is because, as is thought currently, species with the shorter generation length will undergo more germ-line cell divisions per year and thus accumulate a larger number of replication errors in unit time, which would lead to a larger mutation rate per unit time in those species. However, the relationship of the number of germ-line cell divisions and the mutation rate clearly is not linear as is indicated in the difference in the ratio of the male/female mutation rate in primates and rodents. Primates show a male/female mutation-rate ratio (37, 38) that is almost the same as seen in rodents even when the ratio of the number of germ-cell divisions in males and females is almost 3-fold higher in humans as compared with mice. Therefore, our results suggest that replication-independent mutational processes (e.g., DNA methylation, recombination, and repair mechanism) may play a greater role as a source of mutation than that anticipated earlier (4, 38, 39).
In conclusion, our results argue against the widely held notion about large differences in mutation rates among genes in a genome and among major mammalian lineages. This approximate similarity of mutation rates among genes and among lineages is likely to be important for estimating divergence time for closely related species, testing for selection by comparative sequence analysis, inferring coalescent times, and understanding the mutational processes that govern evolution of mammalian genomes.
Acknowledgments
We thank Sudhindra Gadagkar, Tom Dowling, Michael Rosenberg, Mark Miller, Shozo Yokoyama, Alan Filipski, and Rekha Iyer for discussions and Patrick Kolb and Graziela Valente for assistance with sequence data retrieval. This research was supported by research grants from the National Institutes of Health, National Science Foundation, and Burroughs–Wellcome Fund (to S.K.).
Abbreviation
- Mbp
million base pair(s)
References
- 1.Kimura M. The Neutral Theory of Molecular Evolution. Cambridge, U.K.: Cambridge Univ. Press; 1983. [Google Scholar]
- 2.Nei M, Kumar S. Molecular Evolution and Phylogenetics. New York: Oxford Univ. Press; 2000. [Google Scholar]
- 3.Li W-H, Tanimura M. Nature (London) 1987;326:93–96. doi: 10.1038/326093a0. [DOI] [PubMed] [Google Scholar]
- 4.Britten R J. Science. 1986;231:1393–1398. doi: 10.1126/science.3082006. [DOI] [PubMed] [Google Scholar]
- 5.Wolfe K H, Sharp P M, Li W-H. Nature (London) 1989;337:283–285. doi: 10.1038/337283a0. [DOI] [PubMed] [Google Scholar]
- 6.Easteal S, Collet C. Mol Biol Evol. 1994;11:643–647. doi: 10.1093/oxfordjournals.molbev.a040142. [DOI] [PubMed] [Google Scholar]
- 7.Mouchiroud D, Gautier C, Bernardi G. J Mol Evol. 1995;40:107–113. doi: 10.1007/BF00166602. [DOI] [PubMed] [Google Scholar]
- 8.Matassi G, Sharp P M, Gautier C. Curr Biol. 1999;9:786–791. doi: 10.1016/s0960-9822(99)80361-3. [DOI] [PubMed] [Google Scholar]
- 9.Williams E J, Hurst L D. Nature (London) 2000;407:900–903. doi: 10.1038/35038066. [DOI] [PubMed] [Google Scholar]
- 10.Laird C D, McConaughy B L, McCarthy B J. Nature (London) 1969;224:149–154. doi: 10.1038/224149a0. [DOI] [PubMed] [Google Scholar]
- 11.Wu C-I, Li W-H. Proc Natl Acad Sci USA. 1985;82:1741–1745. doi: 10.1073/pnas.82.6.1741. [DOI] [PMC free article] [PubMed] [Google Scholar]
- 12.Li W-H, Tanimura M, Sharp P M. J Mol Evol. 1987;25:330–342. doi: 10.1007/BF02603118. [DOI] [PubMed] [Google Scholar]
- 13.Li W-H, Ellsworth D L, Krushkal J, Chang B H-J, Hewett-Emmett D. Mol Phylogenet Evol. 1996;5:182–187. doi: 10.1006/mpev.1996.0012. [DOI] [PubMed] [Google Scholar]
- 14.Easteal S, Collet C, Betty D. The Mammalian Molecular Clock. Austin, TX: Landes; 1995. [Google Scholar]
- 15.Wolfe K H, Sharp P M. J Mol Evol. 1993;37:441–456. doi: 10.1007/BF00178874. [DOI] [PubMed] [Google Scholar]
- 16.Bulmer M, Wolfe K H, Sharp P M. Proc Natl Acad Sci USA. 1991;88:5974–5978. doi: 10.1073/pnas.88.14.5974. [DOI] [PMC free article] [PubMed] [Google Scholar]
- 17.Makalowski W, Boguski M S. Proc Natl Acad Sci USA. 1998;95:9407–9412. doi: 10.1073/pnas.95.16.9407. [DOI] [PMC free article] [PubMed] [Google Scholar]
- 18.Nachman M W, Crowell S L. Genetics. 2000;156:297–304. doi: 10.1093/genetics/156.1.297. [DOI] [PMC free article] [PubMed] [Google Scholar]
- 19.Keightley P D, Eyre-Walker A. Science. 2000;290:331–333. doi: 10.1126/science.290.5490.331. [DOI] [PubMed] [Google Scholar]
- 20.Duret L, Mouchiroud D, Gouy M. Nucleic Acids Res. 1994;22:2360–2365. doi: 10.1093/nar/22.12.2360. [DOI] [PMC free article] [PubMed] [Google Scholar]
- 21.Kumar, S., Tamura, K., Jakobsen, I. B. & Nei, M. (2001) Bioinformatics, in press. [DOI] [PubMed]
- 22.Tamura K, Nei M. Mol Biol Evol. 1993;10:512–526. doi: 10.1093/oxfordjournals.molbev.a040023. [DOI] [PubMed] [Google Scholar]
- 23.Kumar S, Gadagkar S R, Filipski A, Gu X. Genetics. 2001;157:1387–1395. doi: 10.1093/genetics/157.3.1387. [DOI] [PMC free article] [PubMed] [Google Scholar]
- 24.Lawrence J G, Ochman H. J Mol Evol. 1997;44:383–397. doi: 10.1007/pl00006158. [DOI] [PubMed] [Google Scholar]
- 25.Saccone C, Pesole G, Preparata G. J Mol Evol. 1989;29:407–411. doi: 10.1007/BF02602910. [DOI] [PubMed] [Google Scholar]
- 26.Kumar S, Gadagkar S R. Genetics. 2001;158:1321–1327. doi: 10.1093/genetics/158.3.1321. [DOI] [PMC free article] [PubMed] [Google Scholar]
- 27.Kumar S, Gadagkar S R. Genetics. 2001;159:913–914. [Google Scholar]
- 28.Sueoka N. Proc Natl Acad Sci USA. 1988;85:2653–2657. doi: 10.1073/pnas.85.8.2653. [DOI] [PMC free article] [PubMed] [Google Scholar]
- 29.Archibald J D. Science. 1996;272:1150–1153. doi: 10.1126/science.272.5265.1150. [DOI] [PubMed] [Google Scholar]
- 30.Hedges S B, Kumar S. Science. 1999;285:2031a. [Google Scholar]
- 31.Archibald J D, Averianov A O, Ekdale E G. Nature (London) 2001;414:62–65. doi: 10.1038/35102048. [DOI] [PubMed] [Google Scholar]
- 32.Jaeger J J, Tong H, Denys C. C R Acad Sci. 1986;302:917–922. [Google Scholar]
- 33.O'hUigin C, Li W-H. J Mol Evol. 1992;35:377–384. doi: 10.1007/BF00171816. [DOI] [PubMed] [Google Scholar]
- 34.Janke A, Feldmaierfuchs G, Thomas W K, Vonhaeseler A, Paabo S. Genetics. 1994;137:243–256. doi: 10.1093/genetics/137.1.243. [DOI] [PMC free article] [PubMed] [Google Scholar]
- 35.Kumar S, Hedges B. Nature (London) 1998;392:917–919. doi: 10.1038/31927. [DOI] [PubMed] [Google Scholar]
- 36.Nei M, Xu P, Glazko G. Proc Natl Acad Sci USA. 2001;98:2497–2502. doi: 10.1073/pnas.051611498. . (First Published February 20, 2001; 10.1073/pnas.051611498) [DOI] [PMC free article] [PubMed] [Google Scholar]
- 37.Bohossian H B, Skaletsky H, Page D C. Nature (London) 2000;406:622–625. doi: 10.1038/35020557. [DOI] [PubMed] [Google Scholar]
- 38.Huttley G A, Jakobsen I B, Wilson S R, Easteal S. Mol Biol Evol. 2000;17:929–937. doi: 10.1093/oxfordjournals.molbev.a026373. [DOI] [PubMed] [Google Scholar]
- 39.Drake J W, Charlesworth B, Charlesworth D, Crow J F. Genetics. 1998;148:1667–1686. doi: 10.1093/genetics/148.4.1667. [DOI] [PMC free article] [PubMed] [Google Scholar]
- 40.Arnason U, Gullberg A, Gretarsdottir S, Ursing B, Janke A. J Mol Evol. 2000;50:569–578. doi: 10.1007/s002390010060. [DOI] [PubMed] [Google Scholar]
- 41.Janke A, Xu X, Arnason U. Proc Natl Acad Sci USA. 1997;94:1276–1281. doi: 10.1073/pnas.94.4.1276. [DOI] [PMC free article] [PubMed] [Google Scholar]
- 42.Huchon D, Catzeflis F M, Douzery E J. Proc R Soc London Ser B. 2000;267:393–402. doi: 10.1098/rspb.2000.1014. [DOI] [PMC free article] [PubMed] [Google Scholar]
- 43.Mouchaty S K, Catzeflis F, Janke A, Arnason U. Mol Phylogenet Evol. 2001;18:127–135. doi: 10.1006/mpev.2000.0870. [DOI] [PubMed] [Google Scholar]
- 44.Benton M J. The Fossil Record 2. London: Chapman and Hall; 1993. [Google Scholar]
- 45.Carroll R L. Vertebrate Paleontology and Evolution. New York: Freeman; 1988. [Google Scholar]
- 46.Haile-Selassie Y. Nature (London) 2001;412:178–181. doi: 10.1038/35084063. [DOI] [PubMed] [Google Scholar]


