

Abstract
Background
Several studies evaluated peripheral and cerebrospinal fluid (CSF) mtDNA as a putative biomarker in neurodegenerative diseases, often yielding inconsistent findings. We systematically reviewed the current evidence assessing blood and CSF mtDNA levels and variant burden in Parkinson's disease (PD), Alzheimer's disease (AD) and amyotrophic lateral sclerosis (ALS). Multiple sclerosis (MS) was also included as a paradigm of chronic neuroinflammation‐driven neurodegeneration.
Methods
Medline, Embase, Scopus and Web of Science were searched for articles published from inception until October 2023. Studies focused on mtDNA haplogroups or hereditary pathogenic variants were excluded. Critical appraisal was performed using the Quality Assessment for Diagnostic Accuracy Studies criteria.
Results
Fifty‐nine original studies met our a priori‐defined inclusion criteria. The majority of CSF‐focused studies showed (i) decreased mtDNA levels in PD and AD; (ii) increased levels in MS compared to controls. No studies evaluated CSF mtDNA in ALS. Results focused on blood cell‐free and intracellular mtDNA were contradictory, even within studies evaluating the same disease. This poor reproducibility is likely due to the lack of consideration of the many factors known to affect mtDNA levels. mtDNA damage and methylation levels were increased and reduced in patients compared to controls, respectively. A few studies investigated the correlation between mtDNA and disease severity, with conflicting results.
Conclusions
Additional well‐designed studies are needed to evaluate CSF and blood mtDNA profiles as putative biomarkers in neurodegenerative diseases. The identification of “mitochondrial subtypes” of disease may enable novel precision medicine strategies to counteract neurodegeneration.
Keywords: Alzheimer's disease, amyotrophic lateral sclerosis, biomarker, blood, cerebrospinal fluid, mitochondrial DNA, neurodegeneration, Parkinson's disease
INTRODUCTION
In the last decades, mitochondrial dysfunction has emerged as a pathological hallmark of several neurodegenerative conditions, including Parkinson's disease (PD) [1], Alzheimer's disease (AD) [2] and amyotrophic lateral sclerosis (ALS) [3].
Several mechanisms of interaction between mitochondrial damage and neurodegeneration have been hypothesized. In PD, mitochondrial function can be affected by both genetic and environmental background, such as the presence of mutations in the PINK1/PRKN genes or exposure to neurotoxins (e.g. MPTP and rotenone). Evidence from PD experimental models showed that α‐synuclein aggregation is associated with inhibition of respiratory complex I, leading to impaired mitochondrial fusion and fission and, more generally, loss of mitochondrial quality control systems [1]. Conversely, altered mitophagy and increased oxidative stress induce lipid peroxidation and may increase γ‐secretase activity, leading to accelerated Aβ accumulation and the formation of hyperphosphorylated tau aggregates in AD [4]. Mitochondrial dysfunction, together with alterations in other cellular systems (e.g. nucleocytoplasmic and vesicular transport, DNA/RNA repair and metabolism, protein homeostasis) and non‐cell autonomous mechanisms (excitotoxicity, glial function) has emerged over the years as a possible player in the pathogenesis of ALS, also through the discovery of mutations in genes associated with each of these functions [5]. Beyond neurodegeneration, mitochondrial damage and subsequent mitochondrial DNA (mtDNA) leakage into the cytoplasm has been proposed as the main mediator of the neuroinflammatory profile which characterizes ALS [6]. In addition, defective mitochondrial bioenergetics is closely linked to the “cellular senescence” observed during ageing [7].
The defective production of ATP can induce loss of mitochondrial membrane integrity and permeabilization of the mitochondrial outer membrane. This leads to the release of mtDNA in the cytoplasm, which in turn can activate the cGAS–STING inflammatory pathway [8]. A fraction of mtDNA is instead released into the bloodstream as circulating cell‐free mtDNA (ccf‐mtDNA) or embedded in vesicles, where it acts as a pro‐inflammatory factor, thus spreading to other tissues an inflammatory‐degenerative vicious cycle [9]. This detrimental process has also been implicated in the pathogenesis of the progressive stage of multiple sclerosis (MS) [10], where neurodegeneration is the prominent pathological feature.
The key regulatory role of mtDNA in the neurodegenerative and neuroinflammatory scenarios paves the way for the development of mitochondria‐targeted therapeutic strategies with potential neuroprotective effects. Emerging evidence also suggests that neurodegenerative diseases are associated with mitochondrial dysfunction in peripheral cells, such as leukocytes and skin fibroblasts [11, 12]. Altered mtDNA abundance (mtDNA copy number, mtDNA‐CN), integrity (mtDNA heteroplasmy, somatic mutations and deletions, collectively referable as “mtDNA damage”) and epigenetic profile (methylation) in cerebrospinal fluid (CSF) and peripheral blood may thus discriminate patients from healthy controls (HC) and inform about the diagnosis and prognosis in several neurodegenerative diseases.
However, previous studies investigating mtDNA parameters in patients' biofluids showed inconsistent results. Some authors reported lower mtDNA‐CN and/or ccf‐mtDNA in patients affected by different neurodegenerative disorders than controls, while others found unchanged or even increased mtDNA levels in patients compared to healthy subjects. Here, we aim to address this issue by providing a clinician‐oriented, comprehensive overview of the current evidence assessing CSF and blood mtDNA signatures (copy number, damage and methylation) as diagnostic and prognostic biomarkers in PD, AD and ALS. MS was also included as a paradigm of chronic neuroinflammation leading to secondary neurodegeneration [13]. This is preceded by a concise guide describing the methodologies currently adopted to characterize mtDNA.
Amplification and sequencing of mtDNA: traditional methods and recent advances
The study of mtDNA involves multiple and complementary methodologies tailored for the analysis of different types of alterations, including single nucleotide variants (SNV), small insertions and deletions (INDELs) and large rearrangements. These mutations can either affect all mtDNA molecules in a cell (homoplasmy) or a proportion of them (heteroplasmy). Of note, the heteroplasmy percentage can vary between cells in the same tissue or from organ to organ [14]. mtDNA methylation profile can also be analyzed with specific assays (Table 1).
TABLE 1.
Methods of election for the analysis of the different types of mtDNA alterations and methylation profile investigated as putative biomarkers in neurodegenerative diseases.
| SNV and heteroplasmy | Small and multiple deletions | Complex rearrangements | Copy number (cellular mtDNA) and concentration (ccf‐mtDNA) | mtDNA methylation status | Advantages | Drawbacks | |
|---|---|---|---|---|---|---|---|
| Short‐read NGS | X | X |
‐ Detects SNV with low heteroplasmy (1%–2%) ‐ Deep‐coverage of mtDNA |
‐ Deletions overestimation ‐ Short‐read does not allow reconstruction of rearrangements ‐ Under or over‐estimation of mtDNA methylation status |
|||
| TGS | X | X | X |
‐ Detection of deletions and complex rearrangements ‐Detection of mtDNA methylation status |
‐ Low depth of coverage (only detects SNVs with heteroplasmy over 5%) | ||
| qPCR | X | X | ‐ Low cost |
‐Susceptible to PCR bias (inhibitors) ‐ Normalization issues (standard curve or reference gene) |
|||
| ddPCR | X | X |
‐ Absolute quantification ‐ High sensitivity and reproducibility ‐ Resistance to PCR bias (inhibitors) |
‐ High cost | |||
| MS‐HRM | X |
‐ Simplicity ‐ High reproducibility and low cost |
‐ Relative methylation estimates |
Note: “X” indicates that the method is suitable for evaluating the corresponding mtDNA parameter.
Abbreviations: ccf‐mtDNA, circulating cell‐free mtDNA; ddPCR, droplet digital polymerase chain reaction; MS‐HRM, methylation‐sensitive‐high resolution melting; NGS, next‐generation sequencing; qPCR, quantitative (real time) polymerase chain reaction; SNV, single nucleotide variants; TGS, third generation sequencing.
Currently, short‐read next‐generation sequencing (NGS) has substituted traditional sequencing methods and is now primarily employed for the detection of single point mutations, with robust confidence in the assessment of heteroplasmy degree [15]. However, its use for the detection of mtDNA rearrangements/deletions is limited by preparatory steps consisting of DNA fragmentation into small molecules (150‐300 bp reads) used as a template for sequencing, resulting in the loss of circular genomic contiguity and consequent difficulties in reconstructing structural changes [16]. Moreover, short‐read NGS techniques rely on mtDNA amplification via polymerase chain reaction (PCR) prior sequencing, which guarantees an extremely deep coverage (i.e. number of times that a given locus is sequenced with NGS data), but might introduce deletions overestimation because of preferential amplification of short amplicons [15].
Recent advancements in NGS technology, based on long‐read sequencing (also called third‐generation sequencing, TGS), hold the potential to address these limitations. Long‐read sequencing generates DNA molecules spanning several kilobases in length. As a result, the entire mitochondrial genome of ~16.6 kb can be sequenced in a single read. Two methodologies for long‐read sequencing are currently available, PacBio and Oxford Nanopore Technology (ONT) [17]. So far, only ONT has been employed in studies evaluating mtDNA as putative biomarkers in neurodegenerative diseases [18]. This approach is based on the passage of long DNA molecules through a “nanopore” embedded in an electric field, which causes a current perturbation once each nucleotide drives through [19]. TGS tools offer several advantages: (i) enhanced analysis of heteroplasmic deletions within a single read; (ii) detection of multiple deletions; (iii) identification of complex rearrangements, such as duplications [20]. However, drawbacks of this technology include lower sensitivity in detecting SNV and small INDELs, as well as heteroplasmy levels lower than 5%. Nevertheless, TGS is currently being implemented with innovative chemistries, sequencers and bioinformatic tools to boost accuracy of mtDNA variant calling [20]. TGS technologies have now been used also to directly measure mtDNA methylation status [21, 22, 23], thus overcoming the limitations associated with conventional methodologies [24, 25].
mtDNA may also undergo quantitative changes, both at cellular (mtDNA‐CN) and cell‐free (ccf‐mtDNA) levels. These alterations could be evaluated through innovative PCR methods. In the last decades, real‐time quantitative PCR (qPCR) has been the method of choice for the quantification of mtDNA‐CN. This technique allows the amplification of DNA molecules in real time with fluorescent intercalants or target‐specific probes, monitoring the fluorescence as DNA amplicons are generated. qPCR requires normalization to controls (either a reference gene or a standard curve), allowing only relative quantification [26]. Differently, the newest droplet digital PCR (ddPCR) is based on a water–oil emulsion droplet system. Each reaction is partitioned and carried out individually: at an end‐point threshold droplets will be scored as either positive (+ target molecule) or negative (− target molecule). ddPCR provides absolute quantification of the DNA templates, which correlates with higher sensitivity, precision and improved reproducibility [27]. Beyond the difference in sensitivity, both approaches quantify mtDNA levels with the same rationale, i.e. the ratio of specific mitochondrial genes (usually located in mtDNA minor arc where deletions are rare, e.g. MT‐ND1 or D‐loop region) to a nuclear single‐copy gene (e.g. B2M or BAX) [28, 29, 30, 31]. In addition, multiplex assay also allows parallel quantification of mtDNA‐CN and deletions [32].
METHODS
The study protocol was registered in PROSPERO (ID: CRD42023460473) and followed the PRISMA (Preferred Reporting Items for Systematic Reviews and Meta‐Analyses) guidelines [33].
Search strategy and inclusion/exclusion criteria
A search of MEDLINE (via PubMed), Embase, Scopus and Web of Science was conducted for original studies with no restriction on publication date (up to 1st October 2023‐date of database search). Specific search terms for each disease considered in the study (AD, PD, ALS) were used to isolate research in these three areas, excluding other neurodegenerative diseases that would have been included using general terms such as “neurodegeneration”. The same method was applied for MS. The complete search strategy is available in Table S1.
Details on inclusion and exclusion criteria were reported according to the Population, Intervention, Comparison, Outcomes and Study design (PICOS) framework (Table 2) [34]. Only studies reporting original data were included. Review articles were excluded but retained for general considerations.
TABLE 2.
A priori defined inclusion and exclusion criteria according to the Population (P), Intervention (I), Comparison (C), Outcomes (O) and Study design (S) (PICOS) framework.
| Inclusion criteria | P | Patients of any age |
| I | Measurement of mtDNA abundance (mtDNA‐CN, ccf‐mtDNA), variant burden (heteroplasmy, deletion ratio) and methylation in blood or cerebrospinal fluid | |
| C | Healthy subjects or neurological controls | |
| O |
Main outcome: Subjects with a diagnosis of a neurodegenerative disease, including PD, AD, ALS, MS Secondary outcome: Different clinical subtypes of each neurodegenerative disease |
|
| S |
Studies on human subjects Fully‐reported observational studies (prospective or retrospective) and cross‐sectional studies Studies written in English |
|
| Exclusion criteria | I |
Measurement of mtDNA abundance and variant burden in other tissues/biosamples and postmortem ventricular cerebrospinal fluid Assessment of mtDNA haplogroups or hereditary pathogenic mtDNA variants |
| S | Reviews, systematic reviews, meta‐analyses, conference abstracts, pre‐clinical studies, editorials, commentaries |
Abbreviations: AD, Alzheimer's disease; ALS, amyotrophic lateral sclerosis; ccf‐mtDNA, circulating cell‐free mtDNA; CN, copy number; mtDNA, mitochondrial DNA; MS, multiple sclerosis; PD, Parkinson's disease.
Study selection, data extraction and analysis
Titles and abstracts were screened by two independent reviewers (B.R. and A.I.) and selected for full‐text reading according to eligibility criteria. In case of disagreement on eligibility, a consensus was reached through discussion. The following data were extracted for eligible articles: first author name, year of publication, study design (cross‐sectional or longitudinal), number of subjects per group, exclusion criteria for subject enrolment, female percentage, mean age, disease duration, functional scale scores specific for each disease, biological source of analysis, technique of analysis, mtDNA parameter considered. Results were narratively exposed. Due to the heterogeneity of the included studies in terms of biological source and mtDNA parameters analysed, a meta‐analysis approach was not considered applicable.
Risk of bias assessment
The risk of bias and quality of each study was assessed through the Quality Assessment for Diagnostic Accuracy Studies (QUADAS‐2) criteria [35] by two independent reviewers (B.R. and A.I.). When at least one question per key domain received a negative answer, the final classification of that domain was “high risk of bias”; when at least one question per domain was considered unclearly answered, the final classification for that domain was “unclear”. When there was disagreement on a domain, a third reviewer (G.C.) was involved.
RESULTS
In total, 21,668 studies were retrieved from the database search. After deduplication, 14,636 studies were considered for title and abstract reading. Ninety‐five studies remained eligible for full‐text reading and 59 studies met the inclusion criteria (Figure 1).
FIGURE 1.
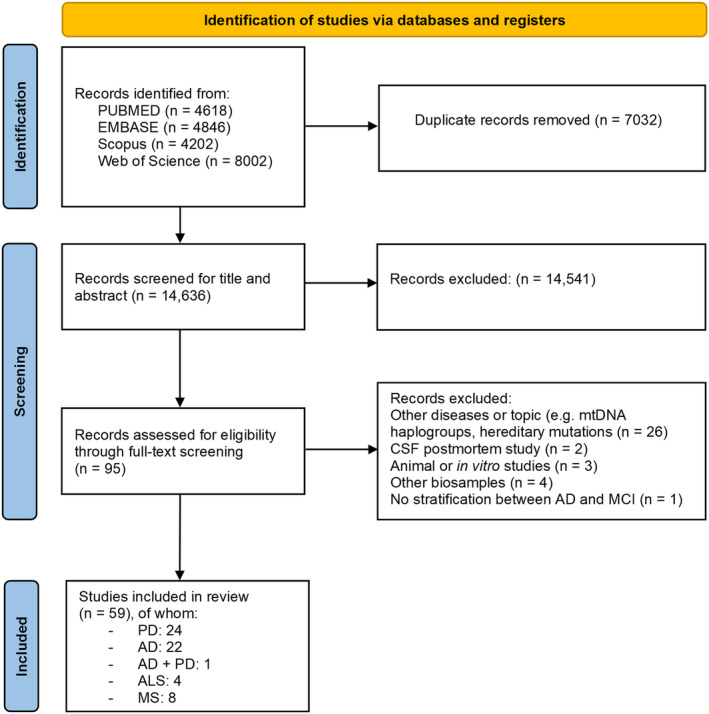
PRISMA flow diagram of the articles selection process [33].
The majority of the studies analysed were found to be of high quality (Tables S2 and S3). Nevertheless, there was a general absence of transparent reporting regarding the enrolment of participants, obscuring the ability to properly evaluate the risk of bias in patients' selection, which we deemed as unclear. Three studies were rated as high risk of bias due to case–control design [36, 37] and enrolment through nationally televised appeal [38].
PARKINSON'S DISEASE
We retrieved 25 records addressing blood or CSF mtDNA measures in PD. Of these, nine were mainly focused on ccf‐mtDNA, nine on whole blood or leukocytes‐derived mtDNA and seven on mtDNA damage or methylation (Table 3). One study included both PD and AD patients [39].
TABLE 3.
Demographic and clinical characteristics, methodology and main findings of included studies assessing mtDNA in patients with Parkinson's disease (PD).
| ccf‐mtDNA | ||||||||||||
|---|---|---|---|---|---|---|---|---|---|---|---|---|
| Study | Design | Sample size | Exclusion criteria | Female (%) | Mean age (years) | Disease duration (years) | UPDRS‐III | MMSE | MoCA | Source | Method | Main results |
| Pyle A et al. 2015 [40] | L (18 months) |
56 PD 10 HC |
NR |
PD: 33.9 HC: 40.0 |
64.6 ± 9.1 60.6 ± 5.1 |
5.4 ± 4.9 months ‐ |
NR ‐ |
NR ‐ |
NR ‐ |
CSF | qPCR |
↓ in PD than HC both at baseline and 18 months ‐ROC curves for PD vs. HC discrimination: MTND1 CN: AUC = 0.81 MTND4 CN: AUC = 0.84 No correlation with (i) age and sex; (ii) motor and cognitive scales |
| Podlesniy P et al. 2016 [41] | CS |
20 LRRK2‐PD 26 LRRK2‐NMC 31 iPD 21 HC b |
NR |
55.0 38.4 32.2 47.6 |
64 ± 3 52 ± 3 58 ± 2 54 ± 3 |
7.4 ± 1.1 ‐ 4.0 ± 0.6 ‐ |
29.8 ± 2.0 a ‐ NR ‐ |
NR ‐ NR |
NR ‐ NR |
CSF | ddPCR |
↑ in LRRK2‐PD vs. LRRK2‐NMC and iPD ↓ (non‐significant) in iPD vs. HC ROC curve for LRRK2‐PD vs. iPD discrimination: SE = 70%, SP = 71%, AUC = 0.75 |
| Chen YS et al. 2017 [44] | CS |
24 early onset PD 33 HC |
PD and HC: cancer, end‐stage renal disease, active infections, history of major trauma, autoimmune diseases, chronic inflammatory disorders |
62.5 54.5 |
48.4 ± 6.5 48.6 ± 7.8 |
3.2 ± 3.0 ‐ |
19.1 ± 13.6 ‐ |
27.3 ± 2.3 28.3 ± 1.8 |
NR | Plasma | qPCR | = between PD and HC |
| Chen MH et al. 2017 [46] | CS |
29 PD 26 HC |
PD: NR HC: history of brain trauma, substance abuse, neurological or psychiatric diseases |
31.0 26.9 |
61.5 ± 8.2 60.1 ± 7.7 |
NR ‐ |
27.0 ± 13.2 ‐ |
NR ‐ |
NR ‐ |
Plasma | qPCR | ↑ in PD vs. HC |
| Lowes H et al. 2020 [43] | L (36 months) |
Baseline: 291 PD (drug‐naïve) 132 HC |
NR |
Baseline: 34.0 38.0 |
Baseline: 61.2 (60.2‐62.3) 59.9 (58.0‐61.9) |
Baseline: 6.8 months (6.0‐7.5) ‐ |
Baseline: 21.3 (20.2‐22.4) ‐ |
NR |
Baseline: 27.1 (26.9‐27.4) ‐ |
CSF | qPCR |
= between PD and HC at baseline ↑ in PD with anxiety/depression and with insomnia at baseline ↓ (slightly) in PD vs. HC at FU ↓ in drug‐treated PD vs. drug‐naïve PD at FU |
|
36 months (FU): 176 PD (90% drug‐treated) 87 HC |
FU: 34.0 37.0 |
FU: 28.1 (26.2‐29.9) ‐ |
FU: 26.5 (26.1‐26.9) ‐ |
At baseline: elevated ccf‐mtDNA associated with cognitive impairment in PD (not confirmed at FU); no correlation with UPDRS (parts I‐III and total score) At FU: negative correlation with LEDD |
||||||||
| Borsche M et al. 2020 [28] | CS |
93 iPD 34 PRKN/PINK1 hom 24 PRKN/PINK1 het 26 PRKN/PINK1 unaffected carriers 156 HC |
PD and unaffected PRKN/PINK1 carriers: NR HC: presence of PRKN or PINK1 variants |
61.6 ± 11.9 51.3 ± 11.7 53.8 ± 13.0 50.7 ± 13.4 55.1 ± 10.9 |
8.4 ± 6.1 18.1 ± 8.8 8.9 ± 8.9 ‐ ‐ |
24.8 ± 14.7 a ‐ ‐ |
NR | NR | Serum | ddPCR | ↑ in PRKN/PINK1 hom and PRKN/PINK1 het vs. iPD, PRKN/PINK1 unaffected carriers and HC | |
| Chen HL et al. 2021 [45] | CS |
25 PD‐NC 25 PD‐MCI 38 PDD 47 HC |
NR |
40.0 68.0 71.0 68.0 |
60.0 ± 10.0 63.8 ± 8.7 65.7 ± 8.0 61.5 ± 4.7 |
2.4 ± 1.9 3.0 ± 2.6 3.6 ± 4.2 ‐ |
19.5 ± 13.1 24.7 ± 15.4 27.4 ± 14.4 ‐ |
27.9 ± 1.7 27.0 ± 1.3 20.0 ± 4.5 ‐ |
NR | Plasma | qPCR | = between all groups |
| Sharma A et al. 2021 [48] | CS |
Serum: 47 PD 40 HC CSF: 12 PD 21 HC |
NR |
Serum: 36.1 50.0 CSF: 8.0 52.0 |
NR | NR | NR | NR | NR |
Serum, CSF (mtDNA levels) PLTs (mtDNA methylation) |
qPCR bisulfite‐PCR pyrosequencing |
↑ serum mtDNA (D‐loop and ATPase 6) levels in PD females vs. HC females (but = levels between PD males and HC males) = CSF mtDNA levels between PD males and HC males (not evaluable in females due to low sample size) mtDNA methylation = between PD and HC |
| Puigròs M et al. 2022 [42] | CS |
Discovery cohort: 20 LRRK2‐PD 28 iPD 26 NMC 17 NMNC |
NR |
55.0 29.0 50.0 53.0 |
64.2 ± 11.0 59.5 ± 10.0 52.6 ± 14.0 53.4 ± 16.0 |
NR |
26.3 ± 11.0 a NR ‐ ‐ |
NR | NR | CSF | ddPCR |
Discovery cohort: ↑ in LRRK2‐PD vs. iPD and NMC ccf‐mtDNA discriminated between iPD and NMNC with SE = 75%, SP = 70%; between iPD and LRRK2‐PD with SE = 80%, SP = 75% |
|
Validation cohort: 21 iPD 12 HC |
29.0 33.0 |
69.2 ± 7.0 68.5 ± 5.0 |
2.5 ± 11.0 a ‐ |
↓ mtDNA ND5/ND1 deletion ratio (i.e. higher levels of deletions) in iPD vs. all other groups |
||||||||
|
Validation cohort: ↓ mtDNA ND5/ND1 deletion ratio in iPD vs. HC | ||||||||||||
| Whole blood/leukocytes‐derived mtDNA copy number | ||||||||||||
|---|---|---|---|---|---|---|---|---|---|---|---|---|
| Study | Design | Sample size | Exclusion criteria | Female (%) | Mean age (years) | Disease duration (years) | UPDRS‐III | MMSE | MoCA | Source | Method | Main results |
| Gui YX et al. 2015 [49] | CS |
414 PD 231 HC |
NR |
42.9 47.1 |
61.2 ± 7.3 59.1 ± 10.2 |
5 (SD NR) ‐ |
NR ‐ |
NR ‐ |
NR ‐ |
Whole blood |
qPCR |
↓ of 40% in PD vs. HC ↓ in late (>50 y) vs. early onset group ↓ in POLG1‐mutated PD (n = 8) vs. POLG1‐wt PD No correlation with motor symptoms. |
| Pyle A et al. 2015 [29] | CS |
363 PD 262 HC |
NR |
36.5 50.5 |
NR |
NR ‐ |
NR ‐ |
NR ‐ |
NR | Whole blood | qPCR |
↓ in PD vs. HC, independently from age and sex ↓ in PD smokers vs. PD non‐smokers No correlation with motor or cognitive function |
| Pyle A et al. 2016 [47] | CS |
Blood: 360 PD 261 HC CSF: 56 PD 10 HC |
NR |
Blood: 36.9 50.5 CSF: 33.9 40.0 |
Blood: 65.5 ± 9.7 67.8 ± 8.2 CSF: 64.6 ± 9.1 60.6 ± 5.1 |
Blood: NR ‐ CSF: 5.4 ± 4.9 months ‐ |
NR | NR | NR |
Whole‐blood cells, CSF |
qPCR | CSF and blood mtDNA‐CN not associated with depression in PD or HC |
| Gezen‐Ak D et al. 2020 [52] | CS |
107 PD 49 HC |
PD and HC: diabetes mellitus |
49 55 |
60.6 ± 9.6 57.4 ± 8.9 |
5.8 ± 4.2 ‐ |
NR | NR | NR | Blood leukocytes | qPCR |
= between PD (all) and HC = between early (<50 years) and late (>50 years) onset PD subgroups |
| Chen SH et al. 2020 [50] | L (range: 6‐64 months) |
725 PD 744 HC |
PD: secondary or atypical parkinsonism, focal lesions at brain CT or MRI HC: any neurological sign or cognitive impairment |
45.3 45.8 |
67.1 ± 11.1 66.2 ± 9.4 |
NR ‐ |
NR ‐ |
NR ‐ |
NR | Whole blood | qPCR |
↓ in PD vs. HC ↓ in PD with higher LEDD Negative correlation with age in HC (but not in PD) During follow‐up average mtDNA‐CN decreased faster in PD than HC (PD: 0.38%/month, HC: 0.25%/month). LEDD at follow‐up was not correlated with mtDNA change over time. |
| Davis RL et al. 2020 [36] | CS |
37 EOPD 84 LOPD 103 HC |
NR |
32 40 54 |
52.4 ± 1.2 68.5 ± 0.8 61.4 ± 1.2 |
NR ‐ |
NR ‐ |
NR ‐ |
NR ‐ |
Whole blood | qPCR |
= between total PD and HC or between EOPD and LOPD In total, PD group, mild correlation with age at onset (r = 0.220) |
| Yang SY et al. 2021 [39] | L (UK Biobank: median FU time≈10 year) |
Prevalent PD: 697 Incident PD: 965 |
NR | NR | NR | NR | NR | NR | NR | Whole blood | WES and genotyping data | Lower mtDNA‐CN associated with increased risk for prevalent PD (OR = 0.90, CI 0.83‐0.9) and incident PD (HR = 0.92, CI 0.86‐0.98) |
| Asghar M et al. 2022 [51] | CS |
100 PD 12 HC |
NR |
33 76 |
47‐97 (range) 54‐73 (range) |
NR ‐ |
NR ‐ |
NR ‐ |
NR ‐ |
Whole blood | qPCR |
↓ in PD vs. HC No correlation with LEDD, disease duration, MDS‐UPDRS‐III and H&Y stage |
| Müller‐Nedebock AC et al. 2022 [31] | CS |
72 PD 79 HC |
NR |
53 51 |
64 (IQR: 17) 77 (IQR: 11) |
3 ‐ |
NR ‐ |
NR ‐ |
NR ‐ |
Whole blood | ddPCR | ↑ in PD vs. HC (analysis not adjusted for age) |
| mtDNA heteroplasmy/damage/methylation | ||||||||||||
|---|---|---|---|---|---|---|---|---|---|---|---|---|
| Study | Design | Sample size | Exclusion criteria | Female (%) | Mean age (years) | Disease duration (years) | UPDRS‐III | MoCA | Source | Method | Parameter | Main results |
| Taravari A et al. 2014 [55] | CS |
18 PD 31 HC |
NR |
43.8 NR |
52.7 ± 10.3 NR |
NR ‐ |
NR ‐ |
NR ‐ |
Whole blood | PCR |
ΔmtDNA 4977 deletion |
Present (hetero/homoplasmic) in 62.5% of patients vs. 25.8% of HC |
| Casoli T et al. 2020 [56] | CS |
15 PD 15 HC |
PD: other neurological diseases, secondary or atypical parkinsonism HC: history of neurological disease, orthostatic hypotension, cognitive impairment |
53.3 60.0 |
78.8 ± 6.0 80.8 ± 5.1 |
NR ‐ |
NR ‐ |
NR ‐ |
Whole blood | MitoChip microarray |
Ratio of expected allele (REA) Heteroplasmy % |
58 nucleotide positions differ between PD and HC, with 81% of REA values higher in HC than PD (i.e. higher frequency of non‐reference alleles in PD) 10 out of 58 nucleotide positions showed higher heteroplasmy % in PD than HC |
| Zaia A et al. 2020 c [57] | CS |
15 PD 15 HC |
PD: other neurological diseases, secondary or atypical parkinsonism HC: history of neurological disease, orthostatic hypotension, cognitive impairment |
53.3 60.0 |
78.8 ± 6.0 80.8 ± 5.1 |
NR ‐ |
NR ‐ |
NR ‐ |
Whole blood | MitoChip microarray |
Fractal lacunarity analysis Heteroplasmy % |
GenBank np 5713‐9713: β parameter (representative of mtDNA alterations) higher in PD than HC No differences in heteroplasmy levels between PD and HC |
| Stoccoro A et al. 2021 [53] | CS | 30 PD | PD: atypical parkinsonism | 30.0 | 67.7 ± 10.4 | 52.8 ± 46.5 (months) | NR | NR | Whole blood |
qPCR, methylation‐sensitive‐high‐res. melting |
D‐loop methylation [DLM] | DLM and mtDNA‐CN = between PD and HC |
| 30 HC | HC: NR | 36.6 | 64.2 ± 14.0 | ‐ | ‐ | ‐ | Pyrosequencing | mtDNA‐CN | DLM is not correlated with dopaminergic treatment and disease duration | |||
| Lüth T et al. 2021 [58] | CS |
5 PRKN‐PD 3 HC |
NR |
60.0 33.3 |
49.6 43.6 |
15.8 ‐ |
NR ‐ |
NR ‐ |
Whole blood | Nanopore sequencing and DNA methylation analysis | mtDNA methylation | ↓ in PRKN‐PD vs. HC |
| Qi R et al. 2023 [54] | CS |
PBMCs: 53 iPD 10 HC |
PBMCs: Inflammatory or infectious diseases, drugs interfering with white blood cells; for HC only: participation in a clinical trial <6 months, cancer treatment <5 y, family history of PD |
PBMCs: 60.6 36.3 |
PBMCs: 65.3 (37‐84) 63.9 (43‐78) |
PBMCs: 5.9 (1‐19) ‐ |
PBMCs: 15.9 a ‐ |
PBMCs: NR |
PBMCs Buffy coat |
mtDNA damage assay (Mito DNADX) qPCR |
mtDNA damage mtDNA‐CN |
PBMCs and buffy coat cohorts: mtDNA damage ↑ in iPD PMBCs vs. HC (iPD vs. HC discrimination: AUC = 0.82 and 1.0, respectively) mtDNA‐CN = between iPD and HC |
|
Buffy c: 14 PD 6 HC |
Buffy c: Neurological or psychiatric conditions (other than PD), cardiovascular disease, hospitalization <3 months, MoCA <22, MRI contraindications, atypical parkinsonism, current participation in intervention trials |
Buffy c: 14.2 33.3 |
Buffy c: 65.1 (53‐80) 64.8 (57‐ 69) |
Buffy c: NR ‐ |
Buffy c: 27.1 a ‐ |
Buffy c: 26.1 27.8 |
FBN cohort: ↑ mtDNA damage in LRRK2‐PD, LRRK2‐NMC and iPD vs. HC mtDNA damage = between LRRK2‐PD, LRRK2‐NMC and iPD ↑ mtDNA damage in LRRK2‐NMC females vs. males |
|||||
|
FBN: 30 iPD 28 LRRK2‐PD 17 LRRK2‐NMC 22 HC |
FBN: NR |
FBN: NR |
FBN: NR |
FBN: NR |
FBN: NR |
mtDNA‐CN = between the four groups mtDNA damage correlated with iPD age at diagnosis (r = 0.34) |
||||||
|
AD: 10 AD 7 HC |
AD: Other neurological conditions, current smoker, cancer <5 years. |
AD: 60 57 |
AD: 70 (58‐85) 68 (50‐83) |
AD: NR ‐ |
AD: NR ‐ |
AD: NR ‐ |
AD cohort = mtDNA‐CN and mtDNA damage between AD and HC |
|||||
| Trinh J et al. 2023 [18] | CS | 59 PINK1‐PD | NR | 47 | 64.2 ± 15.2 | 25.4 | NR | NR | Whole blood | Short‐read sequencing | mtDNA heteroplasmy | ↑ of mtDNA heteroplasmic variants in monoallelic PINK1/PRKN‐PD (joint cohort) vs. PINK1/PRKN‐NMC (joint cohort) (AUC =0.83) |
| 47 PINK1 het asymp. | 47 | 62.1 ± 11.6 | ‐ | Nanopore sequencing | Large scale deletions (ND4/ND1 ratio) | ↑ of mtDNA heteroplasmic variants in PINK1/PRKN‐PD (joint cohort) vs. iPD | ||||||
| 54 PRKN‐PD | 46 | 59.7 ± 16.9 | 22.8 | mtDNA transcription/replication initiation (7S DNA/ND1 ratio) | ↑ of mtDNA heteroplasmic variants in biallelic PINK1/PRKN carriers vs. HC | |||||||
| 79 PRKN het asymp. | 52 | 47.9 ± 16.9 | ‐ | ↑ of mtDNA homoplasmic variants in PINK1/PRKN‐NMC (joint cohort) vs. iPD | ||||||||
| 67 iPD | 40 | 74.3 ± 10.2 | NR | = mtDNA hetero‐ and homoplasmic variants burden in iPD vs. HC | ||||||||
| 90 HC | 54 | 61.7 ± 18.3 | ‐ |
↑ large mtDNA deletions in biallelic PINK1/PRKN carriers vs. monoallelic carriers and iPD ↓7S DNA: ND1 ratio in biallelic PINK1/PRKN carriers vs. monoallelic carriers and HC ↓7S DNA: ND1 ratio in iPD vs. HC |
||||||||
Note: Continuous variables are reported as mean ± SD or median (IQR). In the study by Davis RL et al. 2020 [36], mean age was reported as mean ± standard error of the mean.
Abbreviations: AD, Alzheimer's disease; AUC, area under the curve; ccf‐mtDNA, circulating cell‐free mtDNA; CN, copy numer; CS, cross‐sectional; CSF, cerebrospinal fluid; ddPCR, droplet digital polymerase chain reaction; DLM, D‐loop methylation; DTI, diffusion tensor image; EOPD, early onset PD; FBN, Michael J. Fox Foundation Fox Bionet; FU, follow‐up; HC, healthy controls; hetero, heterozygous; homo, homozygous; H&Y, Hoehn and Yahr (scale); iPD, idiopathic PD; L, longitudinal; LOPD, late‐onset PD; LEDD, levodopa equivalent daily dose; LRRK2, carriers of G2019S mutation in LRRK2 gene; MDS‐UPDRS‐III, Movement Disorder Society‐Unified Parkinson's Disease Rating Scale–part III; MMSE, Mini‐Mental State Examination (scale); MoCA, Montreal Cognitive Assessment (scale); mtDNA, mitochondrial DNA; NMC, non‐manifesting carriers; NMNC, non‐manifesting non‐carriers; np, nucleotide position; NR, not reported; PBMC, peripheral blood mononuclear cell; PDD, PD with dementia; PD‐MCI, PD with mild cognitive impairment; PD‐NC, PD with normal cognition; PINK1 het asymp, asymptomatic carriers of monoallelic mutations in PINK1; PLTs, platelets; POLG‐wt, POLG gene wild type; PRKN het asymp, asymptomatic carriers of monoallelic mutations in PRKN; PRKN/PINK1 het, PD patients carrying a monoallelic mutation in PRKN or PINK1; PRKN/PINK1 hom, PD patients carrying biallelic mutations in PRKN or PINK1; p‐tau, phospho‐tau; qPCR, quantitative (real time) polymerase chain reaction; SD, standard deviation; WES, whole exome sequencing; y, years.
MDS‐UPDRS‐III score according to the 2008 release.
Healthy controls non‐carriers of LRRK2 G2019S mutations.
This study was performed on mtDNA sequences derived from Casoli T et al. 2020 [56].
ccf‐mtDNA
Studies evaluating ccf‐mtDNA levels in idiopathic PD (iPD) patients gave conflicting results. Pyle et al. showed lower CSF mtDNA in early stage iPD than HC [40]. Other authors found a similar decreasing trend for CSF mtDNA in iPD compared to HC, but the difference did not reach statistical significance [41, 42]. Additional studies showed similar CSF [43], plasma [44, 45] and serum [28] levels of ccf‐mtDNA between iPD and HC, while one study found higher plasma ccf‐mtDNA levels in iPD than HC [46]. Lowes et al. revealed a longitudinal decrease of CSF mtDNA in iPD patients, but not in HC, over a 36‐month follow‐up. Given that at baseline the iPD patients were drug‐naïve, the authors attributed this observation to the negative correlation observed between mtDNA levels and levodopa equivalent daily dose (LEDD) [43]. The same study found increased baseline CSF mtDNA concentrations in PD patients with cognitive impairment compared to patients with normal cognition, which was not confirmed at follow‐up [43]. Other authors found no association between CSF or blood ccf‐mtDNA levels and cognitive, psychiatric or motor symptoms in PD [40, 47]. Sharma et al. found a sex‐specific increase in serum ccf‐mtDNA levels in PD females compared to HC females [48]. However, another study found no effect of sex on CSF mtDNA levels [41].
Few studies evaluated ccf‐mtDNA levels in monogenic PD. Patients carrying the LRRK2 G2019S mutation (LRRK2‐PD) showed higher CSF mtDNA levels than LRRK2 G2019S non‐manifesting carriers (LRRK2‐NMC) and iPD [41, 42]. Analogue findings were observed in the serum of PD patients carrying pathogenic variants in PRKN or PINK1 genes (PRKN/PINK1‐PD) compared to monoallelic unaffected carriers (PINK1/PRKN‐NMC), iPD and HC [28].
While one study found no correlation between CSF mtDNA and CSF tau, phosphorylated tau (p‐tau) or α‐synuclein levels in iPD [40], other authors showed a positive correlation of CSF mtDNA with CSF α‐synuclein and tau levels [41].
Whole blood and leukocytes‐derived mtDNA copy number
Most of the studies showed decreased whole‐blood mtDNA‐CN in PD compared to controls [29, 49, 50, 51], independently of sex [29]. A UK Biobank‐based study found that lower mtDNA‐CN was associated with higher rates of prevalent and incident PD [39]. In contrast, some authors found unchanged [36, 52, 53, 54] or increased [31] mtDNA‐CN in PD compared to HC. Gui et al. reported lower mtDNA‐CN in late‐onset compared to early onset PD patients [49], but this association was not confirmed in two subsequent studies [36, 52]. One study found a negative correlation between LEDD and mtDNA‐CN [50], not confirmed in a later work [51]. There were no associations between mtDNA‐CN and PD motor or non‐motor phenotypes [29, 47, 49, 51].
Few studies investigated whole‐blood mtDNA in monogenic PD. Qi et al. showed similar mtDNA‐CN between LRRK2‐PD, LRRK2‐NMC, iPD and HC groups [54]. Another study reported lower mtDNA‐CN in PD patients carrying single nucleotide polymorphisms or pathogenic variants in POLG1 [49]. No studies investigated the relationship between whole‐blood mtDNA and other biomarkers of neurodegeneration in PD.
mtDNA heteroplasmy, damage and methylation
Some studies reported higher levels of heteroplasmic variants [55], heteroplasmy percentage [56] or damage [54, 57] in whole‐blood mtDNA of PD patients compared to HC. Stoccoro et al. found similar methylation levels in the mtDNA D‐loop region (a sequence involved in the regulation of mtDNA replication and transcription) between PD and HC, independently of sex [53]. One study showed reduced blood mtDNA CpG methylation in PRKN‐PD compared to controls [58].
Only few works investigated the relationship of mtDNA damage and methylation levels with PD clinical features. One study found no correlation between disease duration and LEDD with D‐loop methylation [53]. Qi et al. found no correlation between blood mtDNA damage and demographic or clinical data, except for a positive correlation with age at PD diagnosis [54].
Two studies evaluated the blood mtDNA damage levels in monogenic PD. LRRK2‐PD, LRRK2 NMC and iPD showed higher mtDNA damage levels compared to HC, while there were no differences among LRRK2‐PD, LRRK2‐NMC and iPD groups. Interestingly, mtDNA damage was higher in LRRK2‐NMC females than males [54]. Trinh et al. showed higher number of mtDNA heteroplasmic variants in (i) PD patients carrying PRKN or PINK1 monoallelic mutations compared to asymptomatic monoallelic carriers; (ii) PD patients carrying monoallelic or biallelic PRKN/PINK1 mutations compared to iPD [18]. PD patients carrying biallelic PRKN/PINK1 mutations had more mtDNA large deletions than patients with monoallelic PRKN/PINK1 mutations or iPD [18].
ALZHEIMER'S DISEASE
We retrieved 22 records addressing blood or CSF mtDNA measures in AD. Of these, six were mainly focused on ccf‐mtDNA, six on whole blood or leukocyte‐derived mtDNA and 10 on mtDNA variants burden or methylation (Table 4).
TABLE 4.
Demographic and clinical characteristics, methodology and main findings of included studies assessing mtDNA in patients with Alzheimer's disease (AD).
| ccf‐mtDNA | |||||||||||
|---|---|---|---|---|---|---|---|---|---|---|---|
| Study | Design | Sample size | Exclusion criteria | Female (%) | Mean age (years) | Disease duration (years) | MMSE | CDR | Source | Method | Main results |
| Podlesniy P et al. 2013 [30] | CS |
Discovery cohort: 13 AD 15 FTD 6 PSEN1‐NMC 7 LAβ 10 C1 7 C2 |
Age >75 years Signs of blood contamination, CSF total protein >0.7 mg/mL |
61 NR NR NR 60 NR |
64 ± 2 61 ± 2 35 ± 3 67 ± 3 62 ± 1 38 ± 3 |
NR | NR | NR | CSF |
qPCR ddPCR |
Discovery cohort: ↓ in AD and LAβ vs. C1 ↑ in FTD vs. AD and LAβ ↓ in PSEN1‐NMC vs. C2 ccf‐mtDNA discriminates (i) AD vs. C1 (AUC = 0.99) and (ii) AD vs. FTD (AUC = 0.98) |
|
Validation cohort: 17 AD 9 FTD 5 LAβ 19 C1 |
NR | NR |
66 ± 1 60 ± 2 67 ± 4 61 ± 1 |
Validation cohort: Analogue findings of discovery cohort APOE ε4 associated with low ccf‐mtDNA |
|||||||
| Podlesniy P et al. 2016 [59] | CS |
Study cohort 13 non‐AD dementia 9 possible AD 22 sCJD |
NR | NR |
63 ± 3 64 ± 3 62 ± 3 |
NR | NR | NR | CSF | ddPCR |
Study cohort: ↓ in possible AD vs. sCJD and non‐AD dementia |
|
Validation cohort 16 ND‐ctrl 29 sCJD 4 gCJD 19 AD |
NR |
70 ± 9 67 ± 7 64 ± 8 71 ± 9 |
Validation cohort: ↓ in AD vs. sCJD and ND‐ctrl |
||||||||
|
Combined cohort: ROC curve AD vs. ND‐ctrl and non‐AD dementia: AUC = 0.83 ROC curve AD vs. sCJD: AUC = 0.78 | |||||||||||
| Cervera‐Carles L et al. 2017 [62] | CS |
59 AD 20 pre‐clinical AD 43 MCI 140 HC |
NR |
52.5 60.0 67.4 60.7 |
72.5 ± 6.2 62.7 ± 6.1 71.7 ± 4.4 56.2 ± 4.6 |
NR ‐ |
22 ± 2.0 29 ± 1.0 27 ± 2.0 29 ± 1.0 |
NR ‐ |
CSF | ddPCR |
↑ in AD and MCI vs. HC = between pre‐clinical AD and HC mtDNA‐CN not affected by sex and age ROC curve AD vs. HC: 0.715 |
| Podlesniy P et al. 2020 [60] |
30 spAD 16 rpAD 49 ND‐ctrl |
NR |
46.6 56.2 53.0 |
67 (60‐74) 68 (60‐80) 69 (66‐72) |
NR | NR | NR | CSF | ddPCR |
↓ in spAD vs. ND‐ctrl = between rpAD and ND‐ctrl ROC curve for ccf‐mtDNA/p‐tau total AD vs. ND‐ctrl: AUC = 0.79 |
|
| Takousis P et al. 2022 [63] | CS |
12 AD 10 HC |
AD: NR HC: history of neurological/psychiatric disorders, SCD, abnormal MMSE or BDI score |
50.0 20.0 |
75.4 ± 5.2 57.8 ± 17.2 |
NR ‐ |
NR |
NR ‐ |
CSF |
ddPCR, qPCR |
= between AD and HC |
| Huang J et al. 2023 [61] | CS | 90 AD | All: ongoing infections, inflammatory states | 57.7 | 72.3 ± 5.9 | 19.2 ± 6.3 (months) | NR | NR | Plasma | qPCR (n° lesions/ 10 kb) | Plasma: ↓ ccf‐mtDNA in AD vs. HC |
| 90 HC | 53.3 | 73.3 ± 5.6 | ‐ | ‐ | PBMCs | qPCR | PBMCs: ↑ mtDNA damage in AD vs. HC | ||||
| Whole blood/leukocytes‐derived mtDNA copy number | |||||||||||
|---|---|---|---|---|---|---|---|---|---|---|---|
| Study | Design | Sample size | Exclusion criteria | Female (%) | Mean age (years) | Disease duration (years) | MMSE | CDR | Source | Method | Main results |
| Rodríguez‐Santiago B et al. 2001 [67] | CS | 17 AD | NR | NR | 59‐87 (range) | NR | NR | NR | Whole blood | qPCR | = between AD and HC |
| 11 HC | 61‐80 (range) | ‐ | ‐ | ||||||||
| Delbarba A et al. 2016 [64] | CS |
Spanish cohort 20 AD 24 MCI 30 HC |
Otherneurological/psychiatric diseases, drug/alcohol abuse history, acute comorbidities |
60.0 41.6 46.6 |
74 ± 7 73 ± 6 71 ± 8 |
26 ± 13 (months) 24 ± 14 (months) ‐ |
24 ± 3 27 ± 2 29 ± 1 |
1 0.5 0 |
Both cohorts: ↓ in AD and MCI vs. HC |
||
|
Italian cohort 276 AD 70 MCI 248 HC |
NR |
64.1 37.1 52.8 |
78 ± 7 71 ± 8 75 ± 9 |
43 ± 31 (months) 30 ± 12 (months) ‐ |
15 ± 6 25 ± 4 29 ± 1 |
2 ± 1 0.5 ± 0.1 0 |
PBMCs | qPCR | |||
| Lunnon K et al. 2017 [68] | CS |
28 AD 31 MCI 28 HC |
NR |
60.7 58.0 57.1 |
80.3 ± 4.6 77.0 ± 6.9 77.5 ± 7.7 |
NR ‐ |
20.1 ± 4.6 27.3 ± 1.8 29.1 ± 1.0 |
1.1 ± 0.5 0.5 ± 0.0 0.0 ± 0.1 |
Whole blood | qPCR | = between AD, MCI and HC |
| Lv X et al. 2019 [37] | CS |
82 AD 82 HC |
AD: non‐AD dementia, hepatic/renal failure, chronic respiratory insufficiency, BD, schizophrenia, history of drug/alcohol abuse, other neurological disorders, age <55 years HC: NR |
NR | NR |
NR ‐ |
16.9 ± 4.8 28.5 ± 1.1 |
NR ‐ |
Whole blood | qPCR |
↓ mtDNA‐CN in AD vs. HC ↑ mtDNA deletions in AD vs. HC |
| Yang SY et al. 2021 [39] | L (UK Biobank: median FU time≈10 years) |
705 incident AD 368,714 controls |
NR | NR | NR | NR | NR | NR | Whole blood | WES and genotyping data | mtDNA‐CN not associated with incident AD |
| Liou CW et al. 2021 [65] | CS |
600 AD 601 HC |
NR |
58.8 56.7 |
76.4 ± 9.2 75.6 ± 8.4 |
NR ‐ |
NR |
NR ‐ |
Whole blood | qPCR |
↓ in AD vs. HC ↑ in AchE‐treated AD vs. drug‐naïve AD |
| Chong M et al. 2022 [123] | CS (IGADC‐based study) |
17,008 AD 37,154 HC |
NR | NR | NR | NR | NR | NR | Blood | GWAS mtDNA‐CN estimate | 1 SD in ↓ mtDNA‐CN associated with increased AD risk (OR = 1.41) |
| mtDNA heteroplasmy/damage/methylation | ||||||||||||
|---|---|---|---|---|---|---|---|---|---|---|---|---|
| Study | Design | Sample size | Exclusion criteria | Female (%) | Mean age (years) | Disease duration (years) | MMSE | CDR | Source | Method | Parameter | Main results |
| Fahy E et al. 1997 [69] | CS |
65 AD 73 controls (43 HC, 2 CBD, 2 Pick's disease, 16 PD, 10 non‐insulin‐dependent diabetes) |
NR |
NR NR |
74.7 ± 1.1 67 ± 1 years |
NR | NR | NR | Whole blood | Multiplexed primer extension PCR | Heteroplasmy % |
↑ at 6 nucleotide sites in AD vs. controls = heteroplasmy between PD and HC |
| Coon KD et al. 2006 [72] | CS | 19 AD | NR | 36.8 | 77.7 ± 4.4 | NR | NR | NR | Blood‐derived PLTs | Array‐based mtDNA sequencing (MitoChip) | n° of heteroplasmic variants | = between AD and HC |
| 18 HC | 72.2 | 77.9 ± 4.4 | ‐ | ‐ | Heteroplasmy % | ↑ in HC (8.6%) vs. AD (7.9%) | ||||||
| REA | ↑ in AD (0.67) vs. HC (0.63) | |||||||||||
| Wang PN et al. 2009 [70] | CS |
71 AD 84 aMCI 41 aging HC 40 young HC |
All: renal insufficiency, abnormal liver function, major surgery in the previous year, infections in the past 3 months |
40.8 33.3 31.7 35.0 |
77.1 ± 7.1 76.6 ± 7.0 76.9 ± 7.0 41.5 ± 13.0 |
1.9 NR ‐ ‐ |
20.4 ± 3.1 26.5 ± 2.0 28.2 ± 1.3 28.9 ± 1.0 |
1 0.5 0 0 |
Whole blood | PCR + sequencing | D‐loop heteroplasmy |
↑ in AD and aMCI vs. control groups AchEi treatment did not affect D‐loop heteroplasmy |
| Casoli T et al. 2014 [71] | CS |
18 AD 18 HC |
NR |
83.3 77.7 |
76.0 ± 1.2 74.1 ± 1.4 |
NR ‐ |
18.2 ± 1.0 28.0 ± 0.2 |
NR ‐ |
Whole blood | mtDNA array (MitoChip) | REA |
↑ in HC vs. AD 270 nps discriminate between AD and HC REA‐based cluster analysis correctly classified 80% of cases |
| Zaia A et al. 2017 [73] | CS | 14 AD | NR | 85.7 | 75.4 ± 5.1 | NR | 17.3 ± 3.4 | NR | Whole blood | mtDNA array (MitoChip) | Fractal lacunarity analysis | β parameter lower in HC than AD (i.e. higher degree of mutations in HC) |
| 14 HC | 92.8 | 73.1 ± 5.1 | ‐ | 28.2 ± 0.8 | ‐ | n° heteroplasmic variants | = n° heteroplasmic variants between AD and HC | |||||
| Stoccoro A et al. 2017 [76] | CS |
133 AD 130 HC |
NR MMSE <26, demented relatives |
62.4 58.4 |
77.7 ± 7.0 78.9 ± 7.6 |
NR ‐ |
NR |
1 or 2 0 |
Whole blood |
Methylation‐sensitive‐high resolution melting |
D‐loop methylation [DLM] levels |
↓ in AD vs. HC No association between age and sex |
| Stoccoro A et al. 2022 [77] | CS |
18 esAD 70 asAD 14 MCI 105 HC |
All: taking drugs, supplements or substances known to interfere with DNA methylation HC: cognitive impairment, demented relatives |
77.7 68.5 42.8 58.0 |
70.6 ± 6.4 72.4 ± 4.5 70.1 ± 6.3 72.3 ± 6.3 |
NR ‐ |
18.1 ± 5.9 <20 26.2 ± 4.0 NR |
1 ≥2 0.5 0 |
Whole blood |
Methylation‐sensitive‐high resolution melting |
D‐loop methylation [DLM] levels |
Total cohort: = no effect of sex ↑ in MCI vs. esAD, asAD and HC ↑ in HC vs. asAD = between esAD and asAD ROC for MCI vs. other groups discrimination: AUC = 0.77 |
| Reid DM et al. 2022 [74] | CS |
NHW cohort: 64 AD 43 MCI 153 HC |
Hachinski Ischemic Score >4, previous stroke, current cancer, other neurological/psychiatric diseases, acute inflammatory disorders, urinary infections |
45.3 48.8 51.0 |
71.7 ± 1.0 71.3 ± 1.4 70.3 ± 1.1 |
NR |
21.5 ± 1.4 27.6 ± 0.6 29.1 ± 0.1 |
CDR‐SB 5.3 ± 0.8 1.1 ± 0.2 0.0 ± 0.0 |
Buffy coat | mtDNA amplification + NGS | 8oxoG variant count | ↑ trend in MAs AD (but not NHW) vs. MAs MCI and HC |
|
MAs cohort: 40 AD 84 MCI 175 HC |
60.0 47.6 56.6 |
73.3 ± 2.4 69.8 ± 1.6 67.6 ± 0.8 |
19.8 ± 1.8 24.9 ± 0.7 28.1 ± 0.2 |
5.7 ± 1.1 1.1 ± 0.1 0.0 ± 0.0 |
↑ in MAs females (all) vs. males (all) |
|||||||
| Ding B et al. 2023 [78] | CS | 31 AD | All: age <60 years, other causes of dementia or medical illnesses, psychosis, drug/alcohol abuse, medication use | 45.1 | 80.3 ± 6.6 | NR | NR | NR | Plasma | Whole‐genome bisulfite sequencing | mtDNA methylation: | |
| 26 HC | 50.0 | 77.3 ± 4.8 | ‐ | ‐ | ‐average levels |
↓ in AD vs. HC |
||||||
| ‐D‐loop region | ↓ in AD vs. HC | |||||||||||
| ‐coefficient of variation | ↑ in AD vs. HC | |||||||||||
| Reid DM et al. 2023 [75] | CS |
NHW cohort: 64 AD 43 MCI 153 HC |
Same as Reid et al. 2022 |
45.3 48.8 50.9 |
71.7 ± 1.0 71.3 ± 1.4 70.3 ± 1.1 |
NR |
21.5 ± 1.4 27.6 ± 0.6 29.1 ± 0.1 |
CDR‐SB 5.7 ± 1.1 1.1 ± 0.2 0.0 ± 0. 0 |
Buffy coat, plasma | mtDNA amplific. + NGS | 8oxoG variant count |
Buffy coat “AD” and “female sex” associated with ↑ 8oxoG in MAs but not in NHWs |
|
MAs cohort: 40 AD 84 MCI 175 HC |
60.0 47.6 56.5 |
73.3 ± 2.4 69.8 ± 1.6 67.6 ± 0.8 |
19.8 ± 1.8 24.9 ± 1.1 28.1 ± 0.2 |
5.7 ± 1.1 1.1 ± 0.2 0.0 ± 0.0 |
Plasma (ccf‐mtDNA) = 8oxoG levels between AD and HC in both cohorts No effect of sex on 8oxoG levels |
|||||||
Note: Continuous variables are reported as mean ± SD or median (IQR) or mean (range) (see the study by Podlesniy P et al. 2020 [55]).
Abbreviations: 8‐OHdG, 8‐hydroxy‐2′‐deoxyguanosine; 8oxoG, 8‐oxo‐guanine; AD, Alzheimer's disease; aMCI, amnestic mild cognitive impairment; asAD, clinical dementia rating scale (≥2); AUC, area under the curve; BD, bipolar disorder; BDI, Beck Depression Inventory; C1, age‐matched control group including healthy subjects without cognitive deficits and normal CSF bio‐markers; C2, age‐matched control group including subjects without clinical, genetic or biochemical AD‐related alterations as a control for the PSEN1 group; CBD, corticobasal degeneration; ccf‐mtDNA, circulating cell‐free mtDNA; CDR, clinical dementia rating scale; CDR‐SB, clinical dementia rating scale sum of boxes; CN, copy numer; CS, cross‐sectional; CSF, cerebrospinal fluid; ddPCR, droplet digital polymerase chain reaction; esAD, early stage AD (clinical dementia rating scale = 1); FTD, frontotemporal dementia; gCJD, subjects carrying the missense mutation E200K in the prion protein gene causing familial Creutzfeldt‐Jakob disease; GWAS, genome‐wide association study; HC, healthy controls; IGADC, International Genomics of Alzheimer's Disease Consortium; L, longitudinal; LAβ, asymptomatic subjects at risk to develop AD who do not have cognitive deficits and only have low CSF Aβ1–42; MAs, Mexican‐americans; mtDNA, mitochondrial DNA; ND‐ctrl, subjects diagnosed with a neurological disorder without dementia; NGS, next‐generation sequencing; NHW, non‐hispanic white; NMC, non‐manifesting carriers; np, nucleotide position; PBMC, peripheral blood mononuclear cell; PD, Parkinson's disease; PLTs, platelets; PSEN1‐NMC, non‐manifesting carriers of a dominant pathogenic presenilin 1 mutation; p‐tau, phospho‐tau; qPCR, quantitative (real time) polymerase chain reaction; REA, ratio of expected allele; rpAD, rapidly progressive AD (MMSE decline >6 points/year); SCD, subjective cognitive decline; sCJD, sporadic Creutzfeldt‐Jakob disease; SD, standard deviation; spAD, slowly progressive AD (MMSE decline <6 points/year); t‐tau, total tau; WES, whole exome sequencing.
ccf‐mtDNA
The majority of studies showed reduced CSF [30, 59, 60] or plasma [61] ccf‐mtDNA levels in AD compared to controls. Conversely, other authors found increased [62] or unchanged [63] CSF ccf‐mtDNA in AD patients compared to HC. One study reported higher CSF ccf‐mtDNA in subjects with mild cognitive impairment (MCI) compared to HC [62]. Podlesnyi et al. reported decreased CSF ccf‐mtDNA levels in asymptomatic subjects having low CSF Aβ1–42 levels and in presymptomatic patients carrying pathogenic PSEN1 mutations compared to age‐matched controls [30]. However, a subsequent study found no difference in CSF ccf‐mtDNA levels between pre‐clinical AD subjects and HC [62].
AD patients showed reduced CSF ccf‐mtDNA levels compared to patients affected by frontotemporal dementia [30] and Creutzfeldt‐Jakob disease [59]. These observations suggest that reduced CSF ccf‐mtDNA may be able to distinguish AD from other neurodegenerative dementias.
There were no sex‐specific differences in CSF ccf‐mtDNA levels within AD, MCI, pre‐clinical AD and control groups [30, 62]. One work reported decreased CSF ccf‐mtDNA levels in slowly progressive (MMSE decline <6 points/year) AD, but not in rapidly progressive AD, compared to controls [60]. Two studies observed no correlation of CSF ccf‐mtDNA with AD‐related CSF biomarkers [59, 62], while a single study showed positive and negative correlations of CSF ccf‐mtDNA with CSF Aβ1‐42 and p‐tau levels, respectively [60].
Whole blood and leukocytes‐derived mtDNA copy number
Most studies reported decreased cell‐derived mtDNA‐CN in AD compared to HC [37, 64, 65, 66], but in other works, blood mtDNA‐CN were unchanged between the two groups [39, 67, 68]. MCI patients showed reduced [64] or unaltered [68] mtDNA‐CN compared to HC.
Delbarba et al. reported a mild positive correlation between mtDNA‐CN and MMSE score in a joint cohort including AD, MCI and HC subjects [64]. Liou et al. showed (i) a decreasing trend of mtDNA‐CN with an increasing number of APOE4 alleles carried by AD patients; (ii) increased mtDNA‐CN in AD patients treated with acetylcholinesterase inhibitors compared to drug‐naïve patients [65].
mtDNA heteroplasmy, damage and methylation
The studies addressing mtDNA heteroplasmy in AD showed contrasting results. Some authors reported increased blood mtDNA heteroplasmy percentage or reduced ratio of expected allele (REA) (i.e. higher frequency of non‐reference alleles) in AD compared to controls [69, 70, 71]. However, other studies revealed an unchanged number of mtDNA heteroplasmic variants between AD and HC [72, 73], and a reduced heteroplasmy percentage in AD compared to HC [72]. Wang et al. showed an unaltered D‐loop heteroplasmy rate in amnestic MCI compared to HC [70].
Blood mtDNA deletions and oxidative damage levels have been consistently reported to be elevated in AD compared to controls [37, 61]. Two studies confirmed these findings in Mexican American (MAs) but not Non‐Hispanic White populations [74, 75]. MAs females showed increased mtDNA damage compared to MAs males [74, 75]. Interestingly, 8‐oxo‐guanine levels (an indicator of mtDNA oxidative stress) were increased in leukocytes‐derived mtDNA but not in plasma ccf‐mtDNA of MAs AD patients [75]. Two studies evaluating the relationship between APOE variants and mtDNA damage showed inconsistent results [74, 75].
Several studies reported reduced mtDNA methylation in AD compared to controls [76, 77, 78]. Stoccoro et al. showed higher mtDNA methylation levels in (i) MCI patients compared to AD patients and HC; (ii) HC compared to advanced stage AD, but not early stage AD [77]. These data suggest that mtDNA methylation may be abnormally increased in the prodromal (MCI) AD stages, and then decrease with the progression of the disease. D‐loop methylation correlated negatively with CSF p‐tau levels, but not with CSF total tau, Aβ1‐42 or MMSE score [77].
AMYOTROPHIC LATERAL SCLEROSIS (ALS)
We retrieved 4 records addressing whole‐blood mtDNA measures in ALS, of which 1 focused on mtDNA‐CN, 2 on mtDNA‐CN and methylation and 1 on mtDNA‐CN and heteroplasmy. No studies were focused on CSF or ccf‐mtDNA (Table 5).
TABLE 5.
Demographic and clinical characteristics, methodology and main findings of included studies assessing mtDNA in patients with amyotrophic lateral sclerosis (ALS).
| Study | Design | Sample size | Exclusion criteria | Female (%) | Mean age (years) | Disease duration (years) | ALSFRS‐R | Source | Method | Parameter | Main results |
|---|---|---|---|---|---|---|---|---|---|---|---|
| Ehinger JK et al. 2015 [79] | CS |
24 ALS 21 HC |
NR |
37.5 71.4 |
64.9 ± 12.3 64.6 ± 11.6 |
NR ‐ |
NR ‐ |
PLTs, PBMCs |
qPCR | mtDNA‐CN | ↑ in PLTs from ALS vs. HC |
| Stoccoro A et al. 2018 [80] | CS |
54 fALS 23 pre‐fALS 32 non‐carriers |
NR |
50 60.7 50 |
56.4 ± 12.3 45 ± 16.6 55.3 ± 13.6 |
NR ‐ |
NR ‐ |
Whole blood |
qPCR, MS‐HRM assay |
mtDNA‐CN, D‐loop methylation [DLM] |
Negative correlation between DLM and mtDNA‐CN (↑ mtDNA‐CN in subjects with de‐methylated vs. methylated D‐loop region) ↑ mtDNA‐CN in fALS (SOD1 and C9‐mutated) vs. non‐carriers ↓ DLM in SOD1‐mutated vs. non‐carriers |
| Stoccoro A et al. 2020 [81] | CS |
63 ALS (27 fALS) 51 HC |
NR |
47.6 47.1 |
64.2 ± 11.1 67.0 ± 13.5 |
NR ‐ |
NR ‐ |
WBCs | qPCR, bisulfite pyrosequencing |
mtDNA‐CN, D‐loop methylation [DLM] |
Negative correlation between D‐loop methylation and mtDNA‐CN In ALS vs. HC: ↓ DLM (sALS and SOD1‐ALS) ↑ mtDNA‐CN (SOD1‐ALS) vs. HC Only in HC: DLM influenced by age (neg.corr) and sex (↑ in M); mtDNA‐CN influenced by sex (↑ in F) |
| Brockmann SJ et al. 2023 [82] | CS |
Cohort 1: 23 m‐ALS 25 nm‐ALS 49 HC |
NR |
Cohort 1: 39.2 42.3 44.9 |
Cohort 1: 55.9 ± 11.1 58.1 ± 10.4 57.7 ± 11.2 |
Cohort 1: 3.5 (n = 26) ‐ |
Cohort 1: NR ‐ |
Whole blood, WBCs, PLTs |
qPCR Resequencing microarray |
mtDNA‐CN Homoplasmy and heteroplasmy levels |
= between ALS and HC ↑ in m‐ALS vs. nm‐ALS ↑ homoplasmic mutations in ND5 in whole blood from (bulbar) m‐ALS vs. nm‐ALS ↑ heteroplasmic mutations in PLTs from m‐ALS vs. nm‐ALS (and HC for D‐loop and ATP8) |
|
Cohort 2: 6 m‐ALS 16 nm‐ALS 22 HC |
Cohort 2: 33.4 43.7 40.9 |
Cohort 2: 61.8 ± 9.8 60.5 ± 10.4 61.4 ± 10.6 |
Cohort 2: 4.6 (n = 5) ‐ |
Cohort 2: NR ‐ |
Note: Continuous variables are reported as mean ± SD or median (IQR).
Abbreviations: ALS, amyotrophic lateral sclerosis; ALSFRS‐R, ALS functional rating scale revised; CN, copy number; CS, cross‐sectional; CSF, cerebrospinal fluid; ddPCR, droplet digital polymerase chain reaction; DLM, D‐loop methylation; fALS, familial ALS; HC, healthy controls; MS‐HRM, methylation‐sensitive‐high resolution melting; m‐ALS, maternally inherited ALS; MS‐HRM, methylation‐sensitive‐high resolution melting; mtDNA, mitochondrial DNA; nm‐ALS, non‐maternally inherited ALS; NR, not reported; PBMCs, peripheral blood mononuclear cells; PLTs, platelets; pre‐fALS, presymptomatic familial ALS; qPCR, quantitative (real time) polymerase chain reaction; sALS, sporadic ALS; T2DM, type 2 diabetes mellitus; WBCs, white blood cells.
mtDNA‐CN was increased in ALS patients compared to HC in three studies analysing platelets [79] and lymphocytes [80, 81] as cellular source. In another work, higher blood mtDNA‐CN has been found in familiar cases of ALS with presumed maternal origin compared to non‐maternal pedigrees [82]; however, no differences were found between ALS and controls. Brockmann et al. investigated the association between ALS and mtDNA point mutations. Maternal familiar ALS cases showed higher levels of (i) whole‐blood mtDNA homoplasmic mutations in the MT‐ND5 gene (specifically in patients with bulbar phenotype); (ii) heteroplasmic mutations in other mtDNA “mutational hotspots” in platelets than non‐maternal cases. No correlation was found between the number of ND5 mutations and ALS functional rating scale revised (ALSFRS‐Rdecline per month, age at onset or disease duration [82].
Lower levels of D‐loop methylation were found in sporadic and SOD1‐ALS patients (but not in patients carrying pathogenic variants in C9orf72, FUS or TARDBP) compared to controls [80, 81]. In controls, D‐loop methylation was influenced by age and sex whereas an inverse correlation between D‐loop methylation levels and mtDNA‐CN was observed in both controls and ALS patients [80, 81].
MULTIPLE SCLEROSIS (MS)
The focus of our work was neurodegeneration, which mainly characterises the progressive stages of MS (referred to as progressive Multiple Sclerosis, PMS) [13]. Nevertheless, we decided to also include articles addressing relapsing‐remitting MS (RRMS) for two reasons: (i) most manuscripts evaluated all phenotypes of MS, with only a few specifically dedicated to PMS; (ii) to have a complete overview, as the “immunological” and “neurodegenerative” processes overlap in a continuum since the early phases of the disease [13]. We retrieved a total of eight records (three on both RRMS and PMS, one on PMS only and four on RRMS only). Of these, three studies investigated CSF ccf‐mtDNA and five analysed whole blood or leukocytes mtDNA‐CN (Table 6).
TABLE 6.
Demographic and clinical characteristics, methodology and main findings of included studies assessing mtDNA in patients with multiple sclerosis (MS).
| Study | Design | Sample size | Exclusion criteria | Female (%) | Mean age (years) | Disease duration (years) | EDSS | Source | Method | Parameter | Main results |
|---|---|---|---|---|---|---|---|---|---|---|---|
| Souren N et al. 2016 [38] | CS | 49 MZ twins pairs | NR | 75.5 | 42.7 ± 11.1 | 13.6 ± 10.7 | NR | Whole blood, buccal swab | qPCR and LR‐PCR |
mtDNA‐CN Heteroplasmy |
= mtDNA‐CN in non‐affected and MS‐affected cotwins Similar levels of heteroplasmy in cotwins |
| Varhaug KN et al. 2017 [83] | CS |
21 RRMS 23 Controls |
MS: no previous/actual immunotherapy Controls: without inflammatory and neurodegenerative diseases, with normal CSF white cell count and normal MRI |
76 70 |
41.9 ± 14.1 42.1 ± 16.7 |
NR ‐ |
NR ‐ |
CSF | qPCR |
ccf‐mtDNA |
↑ in RRMS vs. other disease controls Negative correlation with disease duration |
| Leurs CE et al. 2018 [84] |
CS L (6‐12 months) for fingolimod‐treated patients |
Cohort 1: 50 RRMS 27 SPMS 13 PPMS |
Cohort 1: NA |
Cohort 1: 62 44.4 38.5 |
Cohort 1: 41.4 ± 9.6 49.6 ± 7.6 50.4 ± 5.3 |
Cohort 1: 6.5 (2.9‐13.7) 19.3 ± 8.7 10.2 (3.8‐19.7) |
Cohort 1: 3.0 (2.5‐4) 6.0 (4‐7) 4.0 (3.5‐6) |
CSF | ddPCR | ccf‐mtDNA |
Cohort 1: ↑ in progressive MS [PMS] vs. NIND ↑ (trend, not significant) in PMS vs. RRMS |
|
23 NIND 7 IND |
56.5 42.9 |
47.5 ± 15.1 43.3 ± 15.1 |
1.14 (0.3–2.8) 0.07 (0.0–2.8) |
‐ ‐ |
|||||||
|
Cohort 2: 42 RRMS (n = 23 treated with Fingolimod) |
Cohort 2: significant concomitant diseases (i.e. infections), corticosteroids within 3 months of sampling |
Cohort 2: 71.4 |
Cohort 2: 42.4 ± 8.1 (treated) 32.4 ± 8.1 (untreated) |
Cohort 2: 10.3 ± 6.1 (treated) 5.89 ± 4.3 (untreated) |
Cohort 2: 3.0 (2‐3.5) (treated) 2.0 (1.5‐3.0) (untreated) |
Cohort 2: ↓ in RRMS patients treated at follow‐up (6‐12 months) = between RRMS, OND and HC |
|||||
|
20 OND 5 HC |
65 40 |
34.15 ± 11 29.8 ± 2.9 |
‐ ‐ |
‐ ‐ |
|||||||
| Fissolo N et al. 2019 [85] | L |
51 RRMS 38 SPMS 36 PPMS 31 CIS |
NR |
62.7 57.9 61.1 78.7 [all 60.8] |
36.3 ± 9.8 51.3 ± 10.1 49.3 ± 10.43 6.9 ± 11.5 [all 4.7 ± 12.2] |
5.3 ± 6.3 15.4 ± 10.9 5.0 ± 4.4 ‐ [all 8.3 ± 8.9] |
2.0 (1.5‐3) 5.5 (4‐6.5) 3.0 (4.8‐6) ‐ [all 3.0 (2‐5.7)] |
CSF | ddPCR |
ccf‐mtDNA |
↑ in all diseases vs. HC = between RRMS, SPMS and PPMS = between CIS who remained so and those who converted to MS |
|
41 HC 20 NIND 20 IND |
48.8 45 35 |
53.3 ± 13.7 68 ± 9.5 49.7 ± 17.5 |
‐ ‐ ‐ |
‐ ‐ ‐ |
|||||||
| Nasi M et al. 2020 [88] | CS |
38 SPMS 35 PPMS 42 HC |
MS: concomitant infections, immunosuppr. or corticosteroid therapy HC: autoimmune diseases, immunosuppr. or corticosteroid therapy |
65.8 65.7 57.1 |
58.5 ± 1.1 58.7 ± 1.1 53 ± 1.6 |
24.3 ± 1.5 17.1 ± 1.6 ‐ |
6.5 ± 0.2 5.4 ± 0.3 ‐ |
Whole blood | qPCR |
mtDNA‐CN |
↑ in SPMS vs. PPMS |
| Al‐Kafaji G et al. 2020 [86] | CS |
60 RRMS 64 HC |
MS: NR HC: inflammatory and neurological disorders or active infections |
76.7 73.4 |
30.4 ± 8.9 36.7 ± 12.2 |
6.3 ± 4.5 ‐ |
4.8 ± 7.1 ‐ |
Whole blood | qPCR | mtDNA‐CN |
↓ in RRMS vs. HC ↓ in patients with longer (>10 y) disease duration |
| López‐Armas GDC et al. 2023 [89] | CS |
50 mild/mod 25 severe RRMS 10 HC |
MS: cancer, diabetes, hypertension, immunological diseases HC: NR |
66 68 NR |
37.7 ± 11.4 43 ± 11.1 40.6 ± 8.7 |
7.8 ± 5.1 10.2 ± 6.9 ‐ |
1.9 ± 0.9 4.9 ± 1.1 ‐ |
WBCs | qPCR |
mtDNA‐CN LTL |
Positive correlation with LTL in patients with mild–moderate RRMS |
| Sedky RM et al. 2023 [87] | CS/L | 25 RRMS (during remission and relapse) | MS: autoimmune/neurodegenerative diseases, malignancy, T2DM | 52 | 33 (26‐41) | NR |
3.5 (3–5.2) in disease dur. <6 years 4 (2–5) in disease dur. >6 years |
Whole blood | qPCR | mtDNA‐CN |
↓ in remission vs. relapse ↓ in RRMS during remission vs. HC = between RRMS during relapse and HC |
| 25 HC | HC: inflammatory and neurological disorders or active infections | 44 | 30 (24‐35) | ‐ | ‐ |
Note: Continuous variables are reported as mean ± SD or median (IQR).
Abbreviations: ccf‐mtDNA, circulating cell‐free mtDNA; CIS, clinically isolated syndrome; CN, mitochondrial DNA copy number; CS, cross‐sectional; CSF, cerebrospinal fluid; ddPCR, digital droplet polymerase chain reaction; EDSS, Expanded Disability Status Scale; HC, healthy controls; IND, inflammatory neurological diseases; indels, insertions/deletions; L, longitudinal; LR‐PCR, long‐range polymerase chain reaction; LTL, leukocyte telomere length; mtDNA, mitochondrial DNA; MZ, monozygotic; NR, not reported; NF‐L, neurofilament light chain; NIND, non‐inflammatory neurological diseases; OND, other neurological diseases; qPCR, quantitative (real time) polymerase chain reaction; RRMS, relapsing‐remitting multiple sclerosis; SPMS, secondary progressive multiple sclerosis; PPMS, primary progressive multiple sclerosis; T2DM, type 2 diabetes mellitus; WBCs, white blood cells; y, years.
ccf‐mtDNA appeared to be higher in (i) patients with RRMS compared to other non‐inflammatory/non‐neurodegenerative conditions [83]; (ii) PMS than other non‐inflammatory diseases and, to a lesser extent, RRMS [84]; (iii) several neurological disorders (RRMS, PMS, clinically isolated syndrome, inflammatory and non‐inflammatory diseases) compared to HC, without differences among pathologies [85]. While one study showed a negative correlation of ccf‐mtDNA with the disease duration [83], another found a positive correlation with T2‐lesions load on MRI and brain atrophy, indicative of a long‐standing disease [84].
Studies focused on whole‐blood mtDNA‐CN showed (i) reduced levels in RRMS patients compared to HC [86]; (ii) lower levels in RRMS patients during the remission phase compared to the same patients during relapse [87]; (iii) higher levels in secondary progressive (SP) compared to primary progressive (PP) MS [88]; (iv) similar levels in monozygotic twins clinically discordant for MS [38].
Al‐Kafaji et al. showed that whole‐blood mtDNA‐CN was negatively correlated with disease duration.
Lastly, a recent paper [89] revealed that mtDNA‐CN correlates with leukocytes telomere length (considered to be an independent factor for conversion to PMS) in RRMS patients with mild–moderate disease, proposing its use as a biomarker of disease‐related disability.
DISCUSSION
The reciprocal relationship between mitochondrial dysfunction and mitochondrial genome integrity in several neurodegenerative diseases has been extensively characterized in the last decades. This has prompted the need to clarify the role of mtDNA as an indicator of the pathogenic mechanisms underlying neurodegeneration. In this review, we systematically collected the evidence on the use of mtDNA as diagnostic and prognostic biomarker in three major neurodegenerative diseases: AD, PD and ALS. Including MS in our research gave us the opportunity to observe the different mtDNA profiles in a condition where neuroinflammation is predominant above neurodegeneration, differently from the other considered diseases [90].
Specifically, we focused our attention on changes in mtDNA (i) abundance (both as circulating form, ccf‐mtDNA, and as intracellular copy number), (ii) damage/heteroplasmy and (iii) methylation levels. Our aim was to investigate somatic mtDNA changes associated with neurodegenerative processes, rather than the possible causal relationship of each disease with inherited pathogenic mutations.
A recent narrative review summarized the findings of studies investigating whole‐blood mtDNA‐CN in AD, PD, ALS and Huntington's disease [91]. Another review analysed ccf‐mtDNA in both CSF and blood of patients with various neurological‐nonpsychiatric diseases and found lower values in cases than controls [92]. Our systematic review has further enriched this landscape since, unlike the previous works, we also considered other mtDNA parameters which are emerging as promising biomarkers of neurodegeneration, such as mtDNA damage, heteroplasmy and methylation in both CSF and blood.
Almost all studies evaluating CSF ccf‐mtDNA found (i) decreased levels in patients with neurodegenerative diseases such as PD and AD, where neurodegeneration prevails over inflammation; (ii) increased levels in MS, where neuroinflammation is predominant. Of note, CSF ccf‐mtDNA data in ALS are currently lacking. On the contrary, the results focused on blood ccf‐mtDNA and intracellular mtDNA‐CN were more contradictory. This discrepancy may be due, at least in part, to differences in the cellular source of mtDNA. Despite the origins of CSF ccf‐mtDNA are still debated, it is conceivable that it is released upon neuro‐axonal injury, glial cell damage or by leukocytes recruited via the choroid plexus [43, 84, 93]. In contrast, the major determinants of blood mtDNA levels are the heterogeneous cell type composition of leukocytes and platelet abundance, which can change with time of day, ageing and disease [94]. Most of the authors found reduced or unaltered whole‐blood mtDNA levels in PD and AD, increased levels in ALS and increased levels in MS during relapses versus remissions [87]. This evidence provides proof‐of‐concept that peripheral intracellular mtDNA‐CN (i) is differentially affected across distinct neurodegenerative conditions; (ii) mirrors the activity of pro‐inflammatory pathways.
The general reduction in ccf‐mtDNA and cellular mtDNA levels observed in PD and AD may be secondary to the impaired mitochondrial biogenesis and bioenergetics which characterize both the diseases [1, 95]. Reduced mtDNA‐CN were indeed found in nigral dopaminergic neurons isolated from postmortem iPD patients' brain [96] and in the frontal cortex of AD patients [97]: these findings suggest that the low CSF ccf‐mtDNA concentration observed in PD and AD may mirror the amount of mtDNA per cell in the brain.
A separate discussion is warranted for monogenic PD, which reflects different underlying biological entities. The higher serum ccf‐mtDNA levels observed in PRKN/PINK1‐PD compared to iPD and HC is likely due to an abnormally increased release of mtDNA by peripheral cells consequent to the impaired mitophagy caused by Parkin or Pink1 loss‐of‐function [28]. Similarly, the increased CSF ccf‐mtDNA levels found in LRRK2‐PD may be secondary to the altered mtDNA replication, transcription and release associated with LRRK2 mutations [98]. Overall, these results support the hypothesis that the mechanisms causing mtDNA dysfunction differ between iPD and monogenic PD.
The injection of damaged mtDNA into the brain caused PD dementia (PDD)‐like pathology and led to motor and cognitive dysfunctions in wild‐type mice [99]. This evidence suggests that mtDNA damage may have a primary role in inducing neurodegeneration awnd cognitive decline in PD. However, two works investigating the correlation between CSF ccf‐mtDNA levels and cognitive function in PD patients found inconclusive [43] or negative [40] results. Moreover, blood mtDNA levels [29, 45, 51] and damage [54] did not correlate with cognitive measures in sporadic PD. Two studies reporting increased serum ccf‐mtDNA levels [28] and whole‐blood mtDNA damage [18] in PRKN/PINK1‐PD compared to iPD and HC did not evaluate the association between mtDNA measures and cognitive profile. Considering that cognitive decline is relatively uncommon in PRKN/PINK1‐PD compared to iPD [100] further research in sporadic and genetic PD populations is needed to elucidate this relevant issue.
Abnormal mitochondrial morphology and dynamics, respiratory chain dysfunction and increased production of reactive oxygen species (ROS) have been described in ALS and variably associated with most of the genes commonly implicated in ALS pathogenesis (SOD1, TARDBP, FUS, C9ORF72, VCP, SQSTM1, OPTN) [101]. In addition, TDP‐43 aggregation, the common pathological feature shared by almost all sporadic and familial ALS cases, has been shown to directly damage mitochondria: TDP‐43 invades mitochondria and leads to increased ROS production and opening of the permeability transition pore, with subsequent leakage of mtDNA into the cytoplasm [6]. Despite the mechanisms by which intracellular mtDNA is released into the extracellular milieu are still under investigation, this evidence provides the rationale for future research evaluating CSF and blood ccf‐mtDNA levels as putative biomarkers in ALS.
The generally higher CSF ccf‐mtDNA levels found in MS patients compared to controls [83, 84, 85] could reflect the neuronal damage induced by immune‐mediated mechanisms, with consequent release of mtDNA in the extracellular space. Here, mtDNA acts as a damage‐associated molecular pattern (DAMP), which can bind to glial Toll‐like receptor‐9 and trigger a further inflammatory response, in a vicious cycle where mitochondrial dysfunction is both a consequence and a promoter of immune dysregulation [10]. These findings suggest that while reduced CSF ccf‐mtDNA levels may mirror the chronic undergoing neurodegenerative process underlying PD and AD, high CSF ccf‐mtDNA concentrations may represent a potential biomarker of the acute cellular and mitochondrial stress that characterizes MS.
An interesting parallel is offered by the heterogeneous field of primary mitochondrial diseases (PMDs). Specifically, diseases caused by mtDNA genetic defects (such as mitochondrial encephalopathy, lactic acidosis and stroke‐like episodes, MELAS; Leber's hereditary optic neuropathy, LHON; myoclonic epilepsy with ragged red fibres, MERRF), where the primary dysfunction is related to energy production and mitochondrial protein synthesis, are associated with higher whole‐blood mtDNA‐CN and plasma ccf‐mtDNA levels than HC. Conversely, PMDs caused by nuclear DNA defects are associated with similar or lower levels of the same blood mtDNA measures compared to HC [102, 103]. In MELAS and LHON, the increased mtDNA‐CN showed an inverse correlation with disease manifestation and severity [104, 105, 106] and may thus act as a compensatory response triggered by the presence of mutant mtDNA. Moreover, CSF ccf‐mtDNA levels were higher in patients with mitochondrial deletion and depletion syndromes (MDD) compared to those with point mutations in both mitochondrial and nuclear genes involved in energy metabolism, possibly due to different levels of heteroplasmy in CSF‐generating cells or active secretion of dysfunctional mitochondria [107]. Since ccf‐mtDNA acts as a DAMP, it is not surprising that POLG1‐related disease, a cause of MDD, is characterized by chronic central nervous system (CNS) inflammation [108]. Similarly to what happens during MS relapses [87], blood ccf‐mtDNA levels increase during the occurrence of “stroke‐like episodes” and status epilepticus in MELAS [103].
Importantly, the few studies investigating the relationship between disease‐specific treatment and mtDNA levels suggested that (i) dopaminergic drugs downregulate CSF [43] and whole‐blood [50] mtDNA levels in PD; (ii) acetylcholinesterase inhibitors upregulate whole‐blood mtDNA‐CN in AD [65]; fingolimod decreases CSF ccf‐mtDNA levels in MS patients [84]. Overall, these observations mean that pharmacological treatment may directly affect the CNS and peripheral mtDNA profiles, and should thus be carefully considered in future studies evaluating mtDNA as a potential biomarker in neurodegenerative disorders.
More homogeneous results have been obtained in studies addressing mtDNA variant burden (i.e. deletions, oxidative damage and heteroplasmy levels), which were generally increased in PD and AD compared to HC [37, 54, 57, 74, 75]. This observation implies that mtDNA damage may be adopted as a proxy of mitochondrial health independently from the specific biological substrate underpinning mitochondrial dysfunction and neurodegeneration. Furthermore, evidence that mtDNA damage (i) is dependent on ethnicity and sex [54, 74, 75] and (ii) is increased in LRRK2 G2019S asymptomatic carriers compared to healthy non‐carriers [54], provides proof‐of‐concept for the evaluation of novel tailored mitochondria‐targeted neuroprotective strategies. Only two studies evaluated mtDNA heteroplasmy levels in ALS [82] and MS [38], with none specifically aimed at investigating mtDNA damage. Further research is thus required to evaluate whether mtDNA variant burden may serve as a biomarker in these two diseases.
Finally, mtDNA methylation levels were generally reduced in the three neurodegenerative diseases considered compared to controls, while we found no studies evaluating this parameter in MS. In PD and ALS, reduced methylation levels were only observed in specific groups of patients with monogenic forms of the disease [53, 80, 81], whereas in AD initial hypermethylation at the disease onset seems to be followed by decreasing levels during disease progression [76, 77]. Apart from the known involvement of the D‐loop region methylation in the regulation of mtDNA transcription and replication [80], the biological function and regulation of mtDNA methylation are not well‐characterized. Some studies hypothesized that methylation protects mtDNA against oxidative stress during embryogenesis [109] and modulates the crosstalk between the nuclear and mitochondrial genomes to allow a coordinated gene expression [110]. However, the link between mtDNA methylation and mitochondrial homeostasis in the field of neurodegenerative diseases remains to be elucidated.
Given the heterogeneity of the studies considered, we cannot draw any definitive conclusion on the diagnostic power of mtDNA in the diseases analysed. However, some studies reported a moderate‐to‐high discriminatory power against healthy subjects in both PD (AUC 0.81 for ccf‐mtDNA [29], AUC 0.82 for mtDNA damage [54]) and AD (AUC 0.99 and 0.71 for ccf‐mtDNA [30, 62]). Similar considerations apply to its value as a prognostic marker, as most studies found no associations with cognitive or motor features, nor with other markers of neurodegeneration.
Several confounding factors may have contributed to the inconsistency of results among different works. First, only a few studies appropriately selected patients without comorbidities which are known to affect peripheral mtDNA‐CN and/or methylation, such as psychiatric disorders [111], infections [112], chronic inflammatory and immune‐mediated diseases [113, 114], obesity [115], cancer [116], diabetes [117] and cardiovascular diseases [118, 119]. The evidence for altered blood mtDNA profiles in these non‐neurological chronic disorders suggests that the peripheral mtDNA changes summarized in this review are not specific to neurodegeneration, but may instead mirror a common dysregulation of immune and redox homeostasis across different chronic and age‐related diseases [120]. Second, disease‐specific treatments (e.g. dopaminergic agents [43], acetylcholinesterase inhibitors [65] and fingolimod [84]) could affect mtDNA levels, and this was considered in only a minority of the studies.
Third, age, sex and ancestry may influence mtDNA measurements in both pathological [48, 54, 74, 75] and physiological [121] conditions, but few of the included studies stratified participants according to demographic characteristics. Of note, Mengel‐From et al. showed that blood cells‐derived mtDNA‐CN declines during ageing in healthy individuals [121], but this trend was not observed in PD patients [50]. One study found higher CSF ccf‐mtDNA levels in older than younger healthy controls [30], which were not confirmed in subsequent reports [41, 62]. However, the observed changes in CSF [43] and blood [29, 50] mtDNA profiles in patients with neurodegenerative diseases compared to controls appeared to be independent of age. While Gui et al. showed lower whole‐blood mtDNA‐CN in late‐onset than early onset PD [49], other authors found no association between mtDNA‐CN and age at PD onset [36, 52]. Asghar et al. showed no correlation between disease duration and whole‐blood mtDNA‐CN in PD, but other studies suggest that blood [86] and CSF [83] mtDNA abundance may decline during disease progression in MS. Fourth, the different techniques used for mtDNA analysis, ranging from the traditional qPCR and NGS to the newer ddPCR and TGS, may have contributed to the heterogeneity of results. Owing to their high reliability, sensitivity and constantly reducing costs [20], ddPCR and TGS will likely be at the forefront of mtDNA research in the future. Lastly, the large majority of studies evaluating blood mtDNA levels did not adjust the analyses for platelet count and leukocyte composition, which represent major determinants of blood mtDNA abundance [94]. The key relevance of this last factor has been further highlighted by a recently published study evaluating whole‐blood mtDNA‐CN in two distinct large PD cohorts [122]. This work showed indeed that the association of low whole genome sequencing‐derived mtDNA‐CN with increased PD risk and severity can be predominantly attributed to the different blood cell composition observed between PD and HC populations. These findings suggest that whole‐blood mtDNA‐CN may not be a biomarker of mitochondrial dysfunction in PD, but rather could mirror the altered peripheral immune profile which characterizes PD [123]. To improve reproducibility, future works evaluating CSF or blood mtDNA profiles should consider all these issues by carefully selecting the study population and considering potential analytical bias (Table 7).
TABLE 7.
Potential bias and confounding factors in the included studies.
| Limitation | Potential bias introduced in the study |
|---|---|
| Psychiatric and systemic comorbidities not evaluated | Possible confounding effect on central and peripheral mtDNA levels and methylation |
| Effect of disease‐related and unrelated pharmacological treatments not evaluated | Possible confounding effect on central and peripheral mtDNA levels |
| Statistical analyses not adjusted for demographic data (e.g. age, sex, disease duration) | Possible confounding effect on central and peripheral mtDNA levels |
| Different analytical techniques used across studies | Potentially limiting reproducibility among studies (see also Table 1) |
| Platelet and leukocyte differential count not evaluated | Possible confounding effect on peripheral mtDNA levels |
Another unmet research need is the analysis of the correlation between CSF and blood ccf‐mtDNA levels. Indeed, we found only one work comparing blood and CSF mtDNA profiles in the same cohort [48]. This study found similar mtDNA‐CN between PD males and HC males in both CSF and serum. Conversely, PD females showed higher serum mtDNA levels than control females, but statistical analysis was not conducted for CSF due to the lack of available samples in female subgroups. An in‐depth investigation of this issue would allow (i) a valuable insight into the physiopathological meaning of altered peripheral ccf‐mtDNA levels observed by some authors [28, 46, 48, 61]; (ii) to assess the reliability of blood ccf‐mtDNA as proxy of CNS mitochondrial dysfunction.
Despite these limitations, CSF and blood mtDNA represent promising biomarkers for stratifying patients and subjects at high risk of conversion to manifest neurodegeneration according to a “mitochondrial risk profile”. This would allow the identification of patients with higher probability to benefit from putative mitochondria‐targeted neuroprotective therapies, which are currently undergoing evaluation in clinical trials (Figure 2) [124].
FIGURE 2.

mtDNA sources and measures currently adopted for biomarker discovery in patients with neurodegenerative diseases. Fragments of mtDNA released outside the cell can be detected as ccf‐mtDNA in the CSF, plasma or serum and then quantified as mtDNA concentration (copies/μl). mtDNA isolated from peripheral blood cells is a source of several potential biomarkers for neurodegenerative diseases, including copy number (i.e. the number of mitochondrial genomes per cell), heteroplasmy, damage and methylation levels. By addressing the potential selection and analytical biases which are currently hampering the advancement of mtDNA‐focused research, future studies may enable the use of mtDNA measures as novel diagnostic and prognostic biomarkers. Moreover, the identification of patient clusters characterized by different “mitochondrial risk” profiles may enable a proper selection of patients candidate to receive experimental mitochondria‐targeted treatments (light blue box). Ccf‐mtDNA, circulating cell‐free mitochondrial DNA; CSF, cerebrospinal fluid. Created in BioRender. Valente, E. (2024) BioRender.com/y62h953.
In conclusion, the value of CSF and blood mtDNA as diagnostic and prognostic biomarkers in the most common neurodegenerative diseases remains to be established through high‐quality studies. A thorough appraisal of the several factors potentially biasing mtDNA profiles and the harmonization of analytical protocols between research laboratories will be crucial to determine if the evaluation of mtDNA may be included in the framework of novel precision medicine strategies in neurodegenerative disorders.
AUTHOR CONTRIBUTIONS
Barbara Risi: Conceptualization; investigation; data curation; visualization; writing – original draft; writing – review and editing. Alberto Imarisio: Conceptualization; investigation; writing – original draft; writing – review and editing; visualization; data curation. Giada Cuconato: Writing – original draft; writing – review and editing. Alessandro Padovani: Writing – review and editing. Enza Maria Valente: Supervision; writing – review and editing. Massimiliano Filosto: Supervision; writing – review and editing.
CONFLICT OF INTEREST STATEMENT
The authors declare no conflict of interest related to this manuscript.
Supporting information
Tables S1‐S3.
ACKNOWLEDGEMENTS
No funding was received to assist with the preparation of this manuscript. We thank the Alessandra Bono Foundation for its support to our scientific activity. We are grateful to Prof. Alessandra Valerio for her valuable technical and scientific insights. Barbara Risi, Alessandro Padovani and Massimiliano Filosto are part of the ERN Euro NMD, HCP ASST Spedali Civili, Brescia, Italy.
Risi B, Imarisio A, Cuconato G, Padovani A, Valente EM, Filosto M. Mitochondrial DNA (mtDNA) as fluid biomarker in neurodegenerative disorders: A systematic review. Eur J Neurol. 2025;32:e70014. doi: 10.1111/ene.70014
Barbara Risi and Alberto Imarisio contributed equally and share first co‐authorship.
Enza Maria Valente and Massimiliano Filosto share senior authorship.
DATA AVAILABILITY STATEMENT
The data that support the findings of this study are available from the corresponding author upon reasonable request.
REFERENCES
- 1. Henrich MT, Oertel WH, Surmeier DJ, Geibl FF. Mitochondrial dysfunction in Parkinson's disease–a key disease hallmark with therapeutic potential. Mol Neurodegener. 2023;18(1):83. doi: 10.1186/s13024-023-00676-7 [DOI] [PMC free article] [PubMed] [Google Scholar]
- 2. Wang W, Zhao F, Ma X, Perry G, Zhu X. Mitochondria dysfunction in the pathogenesis of Alzheimer's disease: recent advances. Mol Neurodegener. 2020;15(1):30. doi: 10.1186/s13024-020-00376-6 [DOI] [PMC free article] [PubMed] [Google Scholar]
- 3. Singh T, Jiao Y, Ferrando LM, et al. Neuronal mitochondrial dysfunction in sporadic amyotrophic lateral sclerosis is developmentally regulated. Sci Rep. 2021;11(1):18916. doi: 10.1038/s41598-021-97928-7 [DOI] [PMC free article] [PubMed] [Google Scholar]
- 4. Ashleigh T, Swerdlow RH, Beal MF. The role of mitochondrial dysfunction in Alzheimer's disease pathogenesis. Alzheimers Dement. 2023;19(1):333‐342. doi: 10.1002/alz.12683 [DOI] [PubMed] [Google Scholar]
- 5. Mead RJ, Shan N, Reiser HJ, Marshall F, Shaw PJ. Amyotrophic lateral sclerosis: a neurodegenerative disorder poised for successful therapeutic translation. Nat Rev Drug Discov. 2023;22(3):185‐212. doi: 10.1038/s41573-022-00612-2 [DOI] [PMC free article] [PubMed] [Google Scholar]
- 6. Yu CH, Davidson S, Harapas CR, et al. TDP‐43 triggers mitochondrial DNA release via mPTP to activate cGAS/STING in ALS. Cell. 2020;183(3):636‐649. doi: 10.1016/j.cell.2020.09.020 [DOI] [PMC free article] [PubMed] [Google Scholar]
- 7. Victorelli S, Salmonowicz H, Chapman J, et al. Apoptotic stress causes mtDNA release during senescence and drives the SASP. Nature. 2023;622(7983):627‐636. doi: 10.1038/s41586-023-06621-4 [DOI] [PMC free article] [PubMed] [Google Scholar]
- 8. Kim J, Kim HS, Chung JH. Molecular mechanisms of mitochondrial DNA release and activation of the cGAS‐STING pathway. Exp Mol Med. 2023;55(3):510‐519. doi: 10.1038/s12276-023-00965-7 [DOI] [PMC free article] [PubMed] [Google Scholar]
- 9. Moya GE, Rivera PD, Dittenhafer‐reed KE. Evidence for the role of mitochondrial dna release in the inflammatory response in neurological disorders. Int J Mol Sci. 2021;22(13):7030. doi: 10.3390/ijms22137030 [DOI] [PMC free article] [PubMed] [Google Scholar]
- 10. Witte ME, Mahad DJ, Lassmann H, van Horssen J. Mitochondrial dysfunction contributes to neurodegeneration in multiple sclerosis. Trends Mol Med. 2014;20(3):179‐187. doi: 10.1016/j.molmed.2013.11.007 [DOI] [PubMed] [Google Scholar]
- 11. Sultana M, Hia R, Akinsiku O, Hegde V. Peripheral mitochondrial dysfunction: a potential contributor to the development of metabolic disorders and Alzheimer's disease. Biology (Basel). 2023;12(7):1019. doi: 10.3390/biology12071019 [DOI] [PMC free article] [PubMed] [Google Scholar]
- 12. Ongari G, Ghezzi C, Di Martino D, et al. Impaired mitochondrial respiration in REM‐sleep behavior disorder: a biomarker of Parkinson's disease? Mov Disord. 2024;39(2):294‐304. doi: 10.1002/mds.29643 [DOI] [PubMed] [Google Scholar]
- 13. Kawachi I, Lassmann H. Neurodegeneration in multiple sclerosis and neuromyelitis optica. J Neurol Neurosurg Psychiatry. 2017;88(2):137‐145. doi: 10.1136/jnnp-2016-313300 [DOI] [PubMed] [Google Scholar]
- 14. Jain MR, Vishnu PV. Mitochondrial DNA analysis. Int J Pharm Sci Rev Res. 2012;32(2):405‐456. doi: 10.1016/B978-0-12-374513-2.00014-2 [DOI] [Google Scholar]
- 15. Legati A, Zanetti N, Nasca A, et al. Current and new next‐generation sequencing approaches to study mitochondrial DNA. J Mol Diagn. 2021;23(6):732‐741. doi: 10.1016/j.jmoldx.2021.03.002 [DOI] [PubMed] [Google Scholar]
- 16. Greer SU, Nadauld LD, Lau BT, et al. Linked read sequencing resolves complex genomic rearrangements in gastric cancer metastases. Genome Med. 2017;9(1):57. doi: 10.1186/s13073-017-0447-8 [DOI] [PMC free article] [PubMed] [Google Scholar]
- 17. van Dijk EL, Jaszczyszyn Y, Naquin D, Thermes C. The third revolution in sequencing technology. Trends Genet. 2018;34(9):666‐681. doi: 10.1016/j.tig.2018.05.008 [DOI] [PubMed] [Google Scholar]
- 18. Trinh J, Hicks AA, König IR, et al. Mitochondrial DNA heteroplasmy distinguishes disease manifestation in PINK1/PRKN‐linked Parkinson's disease. Brain. 2023;146(7):2753‐2765. doi: 10.1093/brain/awac464 [DOI] [PMC free article] [PubMed] [Google Scholar]
- 19. Jain M, Olsen HE, Paten B, Akeson M. The Oxford Nanopore MinION: delivery of nanopore sequencing to the genomics community. Genome Biol. 2016;17(1):239. doi: 10.1186/s13059-016-1103-0 [DOI] [PMC free article] [PubMed] [Google Scholar]
- 20. Macken WL, Falabella M, Pizzamiglio C, et al. Enhanced mitochondrial genome analysis: bioinformatic and long‐read sequencing advances and their diagnostic implications. Expert Rev Mol Diagn. 2023;23(9):797‐814. doi: 10.1080/14737159.2023.2241365 [DOI] [PubMed] [Google Scholar]
- 21. Xu L, Seki M. Recent advances in the detection of base modifications using the Nanopore sequencer. J Hum Genet. 2020;65(1):25‐33. doi: 10.1038/s10038-019-0679-0 [DOI] [PMC free article] [PubMed] [Google Scholar]
- 22. Goldsmith C, Rodríguez‐Aguilera JR, El‐Rifai I, et al. Low biological fluctuation of mitochondrial CpG and non‐CpG methylation at the single‐molecule level. Sci Rep. 2021;11(1):8032. doi: 10.1038/s41598-021-87457-8 [DOI] [PMC free article] [PubMed] [Google Scholar]
- 23. Aminuddin A, Ng PY, Leong CO, Chua EW. Mitochondrial DNA alterations may influence the cisplatin responsiveness of oral squamous cell carcinoma. Sci Rep. 2020;10(1):7885. doi: 10.1038/s41598-020-64664-3 [DOI] [PMC free article] [PubMed] [Google Scholar]
- 24. Owa C, Poulin M, Yan L, Shioda T. Technical adequacy of bisulfite sequencing and pyrosequencing for detection of mitochondrial DNA methylation: sources and avoidance of false‐positive detection. PLoS One. 2018;13(2):e0192722. doi: 10.1371/journal.pone.0192722 [DOI] [PMC free article] [PubMed] [Google Scholar]
- 25. Mechta M, Ingerslev LR, Fabre O, Picard M, Barrès R. Evidence suggesting absence of mitochondrial DNA methylation. Front Genet. 2017;8:166. doi: 10.3389/fgene.2017.00166 [DOI] [PMC free article] [PubMed] [Google Scholar]
- 26. Taylor SC, Nadeau K, Abbasi M, Lachance C, Nguyen M, Fenrich J. The ultimate qPCR experiment: producing publication quality, reproducible data the first time. Trends Biotechnol. 2019;37(7):761‐774. doi: 10.1016/j.tibtech.2018.12.002 [DOI] [PubMed] [Google Scholar]
- 27. Hindson CM, Chevillet JR, Briggs HA, et al. Absolute quantification by droplet digital PCR versus analog real‐time PCR. Nat Methods. 2013;10(10):1003‐1005. doi: 10.1038/nmeth.2633 [DOI] [PMC free article] [PubMed] [Google Scholar]
- 28. Borsche M, König IR, Delcambre S, et al. Mitochondrial damage‐associated inflammation highlights biomarkers in PRKN/PINK1 parkinsonism. Brain. 2020;143(10):3041‐3051. doi: 10.1093/brain/awaa246 [DOI] [PMC free article] [PubMed] [Google Scholar]
- 29. Pyle A, Anugrha H, Kurzawa‐Akanbi M, Yarnall A, Burn D, Hudson G. Reduced mitochondrial DNA copy number is a biomarker of Parkinson's disease. Neurobiol Aging. 2015;38:216e7‐216e10. doi: 10.1016/j.neurobiolaging.2015.10.033 [DOI] [PMC free article] [PubMed] [Google Scholar]
- 30. Podlesniy P, Figueiro‐Silva J, Llado A, et al. Low cerebrospinal fluid concentration of mitochondrial DNA in preclinical Alzheimer disease. Ann Neurol. 2013;74(5):655‐668. doi: 10.1002/ana.23955 [DOI] [PubMed] [Google Scholar]
- 31. Müller‐Nedebock AC, Meldau S, Lombard C, Abrahams S, van der Westhuizen FH, Bardien S. Increased blood‐derived mitochondrial DNA copy number in African ancestry individuals with Parkinson's disease. Parkinsonism Relat Disord. 2022;101:1‐5. doi: 10.1016/j.parkreldis.2022.06.003 [DOI] [PubMed] [Google Scholar]
- 32. Phillips NR, Sprouse ML, Roby RK. Simultaneous quantification of mitochondrial DNA copy number and deletion ratio: a multiplex real‐time PCR assay. Sci Rep. 2014;4(1):3887. doi: 10.1038/srep03887 [DOI] [PMC free article] [PubMed] [Google Scholar]
- 33. Page MJ, McKenzie JE, Bossuyt PM, et al. The PRISMA 2020 statement: an updated guideline for reporting systematic reviews. BMJ. 2021;372:n71. doi: 10.1136/bmj.n71 [DOI] [PMC free article] [PubMed] [Google Scholar]
- 34. Higgins JPT, Thomas J, Chandler J, et al. Cochrane Handbook for Systematic Reviews of Interventions. 2nd ed. John Wiley & Sons; 2019. doi: 10.1002/9781119536604 [DOI] [Google Scholar]
- 35. Whiting PF. QUADAS‐2: a revised tool for the quality assessment of diagnostic accuracy studies. Ann Intern Med. 2011;155(8):529. doi: 10.7326/0003-4819-155-8-201110180-00009 [DOI] [PubMed] [Google Scholar]
- 36. Davis RL, Wong SL, Carling PJ, Payne T, Sue CM, Bandmann O. Serum FGF‐21, GDF‐15, and blood mtDNA copy number are not biomarkers of Parkinson disease. Neurol Clin Pract. 2020;10(1):40‐46. doi: 10.1212/CPJ.0000000000000702 [DOI] [PMC free article] [PubMed] [Google Scholar]
- 37. Lv X, Zhou D, Ge B, et al. Association of Folate Metabolites and Mitochondrial Function in peripheral blood cells in Alzheimer's disease: a matched case‐control study. J Alzheimers Dis. 2019;70(4):1133‐1142. doi: 10.3233/JAD-190477 [DOI] [PubMed] [Google Scholar]
- 38. Souren NYP, Gerdes LA, Kümpfel T, et al. Mitochondrial DNA variation and Heteroplasmy in monozygotic twins clinically discordant for multiple sclerosis. Hum Mutat. 2016;37(8):765‐775. doi: 10.1002/humu.23003 [DOI] [PubMed] [Google Scholar]
- 39. Yang SY, Castellani CA, Longchamps RJ, et al. Blood‐derived mitochondrial DNA copy number is associated with gene expression across multiple tissues and is predictive for incident neurodegenerative disease. Genome Res. 2021;31(3):349‐358. doi: 10.1101/GR.269381.120 [DOI] [PMC free article] [PubMed] [Google Scholar]
- 40. Pyle A, Brennan R, Kurzawa‐Akanbi M, et al. Reduced cerebrospinal fluid mitochondrial DNA is a biomarker for early‐stage Parkinson's disease. Ann Neurol. 2015;78(6):1000‐1004. doi: 10.1002/ana.24515 [DOI] [PMC free article] [PubMed] [Google Scholar]
- 41. Podlesniy P, Vilas D, Taylor P, Shaw LM, Tolosa E, Trullas R. Mitochondrial DNA in CSF distinguishes LRRK2 from idiopathic Parkinson's disease. Neurobiol Dis. 2016;94:10‐17. doi: 10.1016/j.nbd.2016.05.019 [DOI] [PubMed] [Google Scholar]
- 42. Puigròs M, Calderon A, Pérez‐Soriano A, et al. Cell‐free mitochondrial DNA deletions in idiopathic, but not LRRK2, Parkinson's disease. Neurobiol Dis. 2022;174:105885. doi: 10.1016/j.nbd.2022.105885 [DOI] [PubMed] [Google Scholar]
- 43. Lowes H, Pyle A, Santibanez‐Koref M, Hudson G. Circulating cell‐free mitochondrial DNA levels in Parkinson's disease are influenced by treatment. Mol Neurodegener. 2020;15(1):1‐8. doi: 10.1186/s13024-020-00362-y [DOI] [PMC free article] [PubMed] [Google Scholar]
- 44. Chen YS, Chen MH, Lu CH, et al. Associations among cognitive functions, plasma DNA, and white matter integrity in patients with early‐onset Parkinson's disease. Front Neurosci. 2017;11:1‐10. doi: 10.3389/fnins.2017.00009 [DOI] [PMC free article] [PubMed] [Google Scholar]
- 45. Chen HL, Chen PC, Lu CH, et al. Associations among cognitive functions, plasma DNA, and diffusion tensor image along the perivascular space (DTI‐ALPS) in patients with Parkinson's disease. Oxid Med Cell Longev. 2021;2021:4034509. doi: 10.1155/2021/4034509 [DOI] [PMC free article] [PubMed] [Google Scholar]
- 46. Chen MH, Chen PC, Lu CH, et al. Plasma DNA mediate autonomic dysfunctions and white matter injuries in patients with Parkinson's disease. Oxid Med Cell Longev. 2017;2017:7371403. doi: 10.1155/2017/7371403 [DOI] [PMC free article] [PubMed] [Google Scholar]
- 47. Pyle A, Lowes H, Brennan R, et al. Reduced mitochondrial DNA is not a biomarker of depression in Parkinson's disease. Mov Disord. 2016;31(12):1923‐1924. doi: 10.1002/mds.26825 [DOI] [PubMed] [Google Scholar]
- 48. Sharma A, Schaefer ST, Sae‐Lee C, Byun HM, Wüllner U. Elevated serum mitochondrial DNA in females and lack of altered platelet mitochondrial methylation in patients with Parkinson's disease. Int J Neurosci. 2021;131(3):279‐282. doi: 10.1080/00207454.2020.1738433 [DOI] [PubMed] [Google Scholar]
- 49. Gui YX, Xu ZP, Lv W, Zhao JJ, Hu XY. Evidence for polymerase gamma, POLG1 variation in reduced mitochondrial DNA copy number in Parkinson's disease. Parkinsonism Relat Disord. 2015;21(3):282‐286. doi: 10.1016/j.parkreldis.2014.12.030 [DOI] [PubMed] [Google Scholar]
- 50. Chen SH, Kuo CW, Lin TK, Tsai MH, Liou CW. Dopamine therapy and the regulation of oxidative stress and mitochondrial dna copy number in patients with parkinson's disease. Antioxidants. 2020;9(11):1‐12. doi: 10.3390/antiox9111159 [DOI] [PMC free article] [PubMed] [Google Scholar]
- 51. Asghar M, Odeh A, Fattahi AJ, et al. Mitochondrial biogenesis, telomere length and cellular senescence in Parkinson's disease and Lewy body dementia. Sci Rep. 2022;12(1):1‐11. doi: 10.1038/s41598-022-22400-z [DOI] [PMC free article] [PubMed] [Google Scholar]
- 52. Gezen‐Ak D, Alaylioǧlu M, Genç G, et al. Altered transcriptional profile of mitochondrial DNA‐encoded OXPHOS subunits, mitochondria quality control genes, and intracellular ATP levels in blood samples of patients with Parkinson's disease. J Alzheimers Dis. 2020;74(1):287‐307. doi: 10.3233/JAD-191164 [DOI] [PubMed] [Google Scholar]
- 53. Stoccoro A, Smith AR, Baldacci F, et al. Mitochondrial d‐loop region methylation and copy number in peripheral blood dna of parkinson's disease patients. Genes (Basel). 2021;12(5):720. doi: 10.3390/genes12050720 [DOI] [PMC free article] [PubMed] [Google Scholar]
- 54. Qi R, Sammler E, Gonzalez‐Hunt CP, et al. A blood‐based marker of mitochondrial DNA damage in Parkinson's disease. Sci Transl Med. 2023;15(711):1‐17. doi: 10.1126/SCITRANSLMED.ABO1557 [DOI] [PMC free article] [PubMed] [Google Scholar]
- 55. Taravari A, Panov S, Petrov I, Petrova V, Medziti F, Haliti G. Delta deletion 4977 in mitochondrial DNA in patients with idiopathic Parkinson's disease. Bratisl Med J. 2014;115(1):7‐13. doi: 10.4149/BLL_2014_002 [DOI] [PubMed] [Google Scholar]
- 56. Casoli T, Lisa R, Fabbietti P, Conti F. Analysis of mitochondrial DNA allelic changes in Parkinson's disease: a preliminary study. Aging Clin Exp Res. 2020;32(2):345‐349. doi: 10.1007/s40520-019-01197-4 [DOI] [PubMed] [Google Scholar]
- 57. Zaia A, Maponi P, Zannotti M, Casoli T. Biocomplexity and fractality in the search of biomarkers of aging and pathology: mitochondrial DNA profiling of parkinson's disease. Int J Mol Sci. 2020;21(5):44‐56. doi: 10.3390/ijms21051758 [DOI] [PMC free article] [PubMed] [Google Scholar]
- 58. Lüth T, Wasner K, Klein C, et al. Nanopore single‐molecule sequencing for mitochondrial DNA methylation analysis: investigating Parkin‐associated parkinsonism as a proof of concept. Front Aging Neurosci. 2021;13:1‐14. doi: 10.3389/fnagi.2021.713084 [DOI] [PMC free article] [PubMed] [Google Scholar]
- 59. Podlesniy P, Llorens F, Golanska E, et al. Mitochondrial DNA differentiates Alzheimer's disease from Creutzfeldt‐Jakob disease. Alzheimers Dement. 2016;12(5):546‐555. doi: 10.1016/j.jalz.2015.12.011 [DOI] [PubMed] [Google Scholar]
- 60. Podlesniy P, Llorens F, Puigròs M, et al. Cerebrospinal fluid mitochondrial DNA in rapid and slow progressive forms of Alzheimer's disease. Int J Mol Sci. 2020;21(17):1‐14. doi: 10.3390/ijms21176298 [DOI] [PMC free article] [PubMed] [Google Scholar]
- 61. Huang J, Song Z, Wei B, et al. Immunological evaluation of patients with Alzheimer's disease based on mitogen‐stimulated cytokine productions and mitochondrial DNA indicators. BMC Psychiatry. 2023;23(1):4‐11. doi: 10.1186/s12888-023-04634-x [DOI] [PMC free article] [PubMed] [Google Scholar]
- 62. Cervera‐Carles L, Alcolea D, Estanga A, et al. Cerebrospinal fluid mitochondrial DNA in the Alzheimer's disease continuum. Neurobiol Aging. 2017;53:192e1‐192e4. doi: 10.1016/j.neurobiolaging.2016.12.009 [DOI] [PubMed] [Google Scholar]
- 63. Takousis P, Devonshire AS, Redshaw N, et al. A standardised methodology for the extraction and quantification of cell‐free DNA in cerebrospinal fluid and application to evaluation of Alzheimer's disease and brain cancers. N Biotechnol. 2022;72:97‐106. doi: 10.1016/j.nbt.2022.10.001 [DOI] [PubMed] [Google Scholar]
- 64. Delbarba A, Abate G, Prandelli C, et al. Mitochondrial alterations in peripheral mononuclear blood cells from Alzheimer's disease and mild cognitive impairment patients. Oxid Med Cell Longev. 2016;2016:5923938. doi: 10.1155/2016/5923938 [DOI] [PMC free article] [PubMed] [Google Scholar]
- 65. Liou CW, Chen SH, Lin TK, Tsai MH, Chang CC. Oxidative stress biomarkers and mitochondrial DNA copy number associated with APOE4 allele and cholinesterase inhibitor therapy in patients with alzheimer's disease. Antioxidants. 2021;10(12):1971. doi: 10.3390/antiox10121971 [DOI] [PMC free article] [PubMed] [Google Scholar]
- 66. Chong M, Mohammadi‐Shemirani P, Perrot N, et al. GWAS and ExWAS of blood mitochondrial DNA copy number identifies 71 loci and highlights a potential causal role in dementia. Elife. 2022;11:1‐27. doi: 10.7554/eLife.70382 [DOI] [PMC free article] [PubMed] [Google Scholar]
- 67. Rodríguez‐Santiago B, Casademont J, Nunes V. Is mitochondrial DNA depletion involved in Alzheimer's disease? Eur J Hum Genet. 2001;9(4):279‐285. doi: 10.1038/sj.ejhg.5200629 [DOI] [PubMed] [Google Scholar]
- 68. Lunnon K, Keohane A, Pidsley R, et al. Mitochondrial genes are altered in blood early in Alzheimer's disease. Neurobiol Aging. 2017;53:36‐47. doi: 10.1016/j.neurobiolaging.2016.12.029 [DOI] [PubMed] [Google Scholar]
- 69. Fahy E, Nazarbaghi R, Zomorrodi M, et al. Multiplex fluorescence‐based primer extension method for quantitative mutation analysis of mitochondrial DNA and its diagnostic application for Alzheimer's disease. Nucleic Acids Res. 1997;25(15):3102‐3109. doi: 10.1093/nar/25.15.3102 [DOI] [PMC free article] [PubMed] [Google Scholar]
- 70. Wang PN, Lee HC, Wang CH, et al. Heteroplasmy of mitochondrial d310 mononucleotide repeat region in the blood of patients with alzheimer's disease. J Alzheimers Dis. 2009;18(2):345‐353. doi: 10.3233/JAD-2009-1156 [DOI] [PubMed] [Google Scholar]
- 71. Casoli T, Di Stefano G, Spazzafumo L, et al. Contribution of non‐reference alleles in mtDNA of Alzheimer's disease patients. Ann Clin Transl Neurol. 2014;1(4):284‐289. doi: 10.1002/acn3.42 [DOI] [PMC free article] [PubMed] [Google Scholar]
- 72. Coon KD, Valla J, Szelinger S, et al. Quantitation of heteroplasmy of mtDNA sequence variants identified in a population of AD patients and controls by array‐based resequencing. Mitochondrion. 2006;6(4):194‐210. doi: 10.1016/j.mito.2006.07.002 [DOI] [PubMed] [Google Scholar]
- 73. Zaia A, Maponi P, Di Stefano G, Casoli T. Biocomplexity and Fractality in the search of biomarkers of aging and pathology: focus on mitochondrial DNA and Alzheimer's disease. Aging Dis. 2017;8(1):44. doi: 10.14336/AD.2016.0629 [DOI] [PMC free article] [PubMed] [Google Scholar]
- 74. Reid DM, Barber RC, Thorpe RJ, Sun J, Zhou Z, Phillips NR. Mitochondrial DNA oxidative mutations are elevated in Mexican American women potentially implicating Alzheimer's disease. NPJ Aging. 2022;8(1):1‐12. doi: 10.1038/s41514-022-00082-1 [DOI] [PMC free article] [PubMed] [Google Scholar]
- 75. Reid DM, Barber RC, Jones HP, et al. Integrative blood‐based characterization of oxidative mitochondrial DNA damage variants implicates Mexican American's metabolic risk for developing Alzheimer's disease. Sci Rep. 2023;13(1):1‐15. doi: 10.1038/s41598-023-41190-6 [DOI] [PMC free article] [PubMed] [Google Scholar]
- 76. Stoccoro A, Siciliano G, Migliore L, Coppedè F. Decreased methylation of the mitochondrial D‐loop region in late‐onset Alzheimer's disease. J Alzheimers Dis. 2017;59(2):559‐564. doi: 10.3233/JAD-170139 [DOI] [PubMed] [Google Scholar]
- 77. Stoccoro A, Baldacci F, Ceravolo R, et al. Increase in mitochondrial D‐loop region methylation levels in mild cognitive impairment individuals. Int J Mol Sci. 2022;23(10):5393. doi: 10.3390/ijms23105393 [DOI] [PMC free article] [PubMed] [Google Scholar]
- 78. Ding B, Zhang X, Wan Z, et al. Characterization of mitochondrial DNA methylation of Alzheimer's disease in plasma cell‐free DNA. Diagnostics. 2023;13(14):1‐17. doi: 10.3390/diagnostics13142351 [DOI] [PMC free article] [PubMed] [Google Scholar]
- 79. Ehinger JK, Morota S, Hansson MJ, Paul G, Elmér E. Mitochondrial dysfunction in blood cells from amyotrophic lateral sclerosis patients. J Neurol. 2015;262(6):1493‐1503. doi: 10.1007/s00415-015-7737-0 [DOI] [PubMed] [Google Scholar]
- 80. Stoccoro A, Mosca L, Carnicelli V, et al. Mitochondrial DNA copy number and D‐loop region methylation in carriers of amyotrophic lateral sclerosis gene mutations. Epigenomics. 2018;10(11):1431‐1443. doi: 10.2217/epi-2018-0072 [DOI] [PubMed] [Google Scholar]
- 81. Stoccoro A, Smith AR, Mosca L, et al. Reduced mitochondrial D‐loop methylation levels in sporadic amyotrophic lateral sclerosis. Clin Epigenetics. 2020;12(1):137. doi: 10.1186/s13148-020-00933-2 [DOI] [PMC free article] [PubMed] [Google Scholar]
- 82. Brockmann SJ, Buck E, Casoli T, et al. Mitochondrial genome study in blood of maternally inherited ALS cases. Hum Genomics. 2023;17(1):70. doi: 10.1186/s40246-023-00516-1 [DOI] [PMC free article] [PubMed] [Google Scholar]
- 83. Varhaug KN, Vedeler CA, Myhr KM, Aarseth JH, Tzoulis C, Bindoff LA. Increased levels of cell‐free mitochondrial DNA in the cerebrospinal fluid of patients with multiple sclerosis. Mitochondrion. 2017;34:32‐35. doi: 10.1016/j.mito.2016.12.003 [DOI] [PubMed] [Google Scholar]
- 84. Leurs CE, Podlesniy P, Trullas R, et al. Cerebrospinal fluid mtDNA concentration is elevated in multiple sclerosis disease and responds to treatment. Mult Scler. 2018;24(4):472‐480. doi: 10.1177/1352458517699874 [DOI] [PMC free article] [PubMed] [Google Scholar]
- 85. Fissolo N, Cervera‐Carles L, Villar Guimerans LM, et al. Cerebrospinal fluid mitochondrial DNA levels in patients with multiple sclerosis. Mult Scler J. 2019;25(11):1535‐1538. doi: 10.1177/1352458518786055 [DOI] [PubMed] [Google Scholar]
- 86. Al‐Kafaji G, Bakheit HF, Alharbi MA, et al. Mitochondrial DNA copy number in peripheral blood as a potential non‐invasive biomarker for multiple sclerosis. Neuromolecular Med. 2020;22(2):304‐313. doi: 10.1007/s12017-019-08588-w [DOI] [PubMed] [Google Scholar]
- 87. Sedky RM, Zaki MM, Mahmoud ME, Hassan SH, Khater SS, Abou Zaghla HMA. Mitochondrial DNA copy number as a biomarker of multiple sclerosis. Egypt J Immunol. 2023;30(4):121‐133. http://www.ncbi.nlm.nih.gov/pubmed/37801031 [PubMed] [Google Scholar]
- 88. Nasi M, Bianchini E, De Biasi S, et al. Increased plasma levels of mitochondrial DNA and pro‐inflammatory cytokines in patients with progressive multiple sclerosis. J Neuroimmunol. 2020;338:577107. doi: 10.1016/j.jneuroim.2019.577107 [DOI] [PubMed] [Google Scholar]
- 89. López‐Armas GDC, Ramos‐Márquez ME, Navarro‐Meza M, et al. Leukocyte telomere length predicts severe disability in relapsing‐remitting multiple sclerosis and correlates with mitochondrial DNA copy number. Int J Mol Sci. 2023;24(2):916. doi: 10.3390/ijms24020916 [DOI] [PMC free article] [PubMed] [Google Scholar]
- 90. Kwon HS, Koh SH. Neuroinflammation in neurodegenerative disorders: the roles of microglia and astrocytes. Transl Neurodegener. 2020;9(1):42. doi: 10.1186/s40035-020-00221-2 [DOI] [PMC free article] [PubMed] [Google Scholar]
- 91. Cerantonio A, Citrigno L, Greco BM, et al. The role of mitochondrial copy number in neurodegenerative diseases: present insights and future directions. Int J Mol Sci. 2024;25(11):6062. doi: 10.3390/ijms25116062 [DOI] [PMC free article] [PubMed] [Google Scholar]
- 92. Park SS, Jeong H, Andreazza AC. Circulating cell‐free mitochondrial DNA in brain health and disease: a systematic review and meta‐analysis. World J Biol Psychiatry. 2022;23(2):87‐102. doi: 10.1080/15622975.2021.1938214 [DOI] [PubMed] [Google Scholar]
- 93. Schwartz M, Baruch K. The resolution of neuroinflammation in neurodegeneration: leukocyte recruitment via the choroid plexus. EMBO J. 2014;33(1):7‐22. doi: 10.1002/embj.201386609 [DOI] [PMC free article] [PubMed] [Google Scholar]
- 94. Picard M. Blood mitochondrial DNA copy number: what are we counting? Mitochondrion. 2021;60:1‐11. doi: 10.1016/j.mito.2021.06.010 [DOI] [PMC free article] [PubMed] [Google Scholar]
- 95. Sheng B, Wang X, Su B, et al. Impaired mitochondrial biogenesis contributes to mitochondrial dysfunction in Alzheimer's disease. J Neurochem. 2012;120(3):419‐429. doi: 10.1111/j.1471-4159.2011.07581.x [DOI] [PMC free article] [PubMed] [Google Scholar]
- 96. Grünewald A, Rygiel KA, Hepplewhite PD, Morris CM, Picard M, Turnbull DM. Mitochondrial DNA depletion in respiratory chain‐deficient Parkinson disease neurons. Ann Neurol. 2016;79(3):366‐378. doi: 10.1002/ana.24571 [DOI] [PMC free article] [PubMed] [Google Scholar]
- 97. Coskun PE, Wyrembak J, Derbereva O, et al. Systemic mitochondrial dysfunction and the etiology of Alzheimer's disease and down syndrome dementia. J Alzheimers Dis. 2010;20(Suppl 2):S293‐S310. doi: 10.3233/JAD-2010-100351 [DOI] [PMC free article] [PubMed] [Google Scholar]
- 98. Podlesniy P, Puigròs M, Serra N, et al. Accumulation of mitochondrial 7S DNA in idiopathic and LRRK2 associated Parkinson's disease. EBioMedicine. 2019;48:554‐567. doi: 10.1016/j.ebiom.2019.09.015 [DOI] [PMC free article] [PubMed] [Google Scholar]
- 99. Tresse E, Marturia‐Navarro J, Sew WQG, et al. Mitochondrial DNA damage triggers spread of Parkinson's disease‐like pathology. Mol Psychiatry. 2023;28(11):4902‐4914. doi: 10.1038/s41380-023-02251-4 [DOI] [PMC free article] [PubMed] [Google Scholar]
- 100. Kasten M, Hartmann C, Hampf J, et al. Genotype‐phenotype relations for the Parkinson's disease genes Parkin, PINK1, DJ1: MDSGene systematic review. Mov Disord. 2018;33(5):730‐741. doi: 10.1002/mds.27352 [DOI] [PubMed] [Google Scholar]
- 101. Genin EC, Abou‐Ali M, Paquis‐Flucklinger V. Mitochondria, a key target in amyotrophic lateral sclerosis pathogenesis. Genes (Basel). 2023;14(11):1981. doi: 10.3390/genes14111981 [DOI] [PMC free article] [PubMed] [Google Scholar]
- 102. Xia CY, Liu Y, Yang HR, et al. Reference intervals of mitochondrial DNA copy number in peripheral blood for Chinese minors and adults. Chin Med J (Engl). 2017;130(20):2435‐2440. doi: 10.4103/0366-6999.216395 [DOI] [PMC free article] [PubMed] [Google Scholar]
- 103. Maresca A, Del Dotto V, Romagnoli M, et al. Expanding and validating the biomarkers for mitochondrial diseases. J Mol Med. 2020;98(10):1467‐1478. doi: 10.1007/s00109-020-01967-y [DOI] [PMC free article] [PubMed] [Google Scholar]
- 104. Giordano C, Iommarini L, Giordano L, et al. Efficient mitochondrial biogenesis drives incomplete penetrance in Leber's hereditary optic neuropathy. Brain. 2014;137(2):335‐353. doi: 10.1093/brain/awt343 [DOI] [PMC free article] [PubMed] [Google Scholar]
- 105. Bianco A, Valletti A, Longo G, et al. Mitochondrial DNA copy number in affected and unaffected LHON mutation carriers. BMC Res Notes. 2018;11(1):911. doi: 10.1186/s13104-018-4025-y [DOI] [PMC free article] [PubMed] [Google Scholar]
- 106. Grady JP, Pickett SJ, Ng YS, et al. mtDNA heteroplasmy level and copy number indicate disease burden in m.3243A>G mitochondrial disease. EMBO Mol Med. 2018;10(6):e8262. doi: 10.15252/emmm.201708262 [DOI] [PMC free article] [PubMed] [Google Scholar]
- 107. Trifunov S, Paredes‐Fuentes AJ, Badosa C, et al. Circulating cell‐free mitochondrial DNA in cerebrospinal fluid as a biomarker for mitochondrial diseases. Clin Chem. 2021;67(8):1113‐1121. doi: 10.1093/clinchem/hvab091 [DOI] [PubMed] [Google Scholar]
- 108. Hanaford A, Johnson SC. The immune system as a driver of mitochondrial disease pathogenesis: a review of evidence. Orphanet J Rare Dis. 2022;17(1):335. doi: 10.1186/s13023-022-02495-3 [DOI] [PMC free article] [PubMed] [Google Scholar]
- 109. Yue Y, Ren L, Zhang C, et al. Mitochondrial genome undergoes de novo DNA methylation that protects mtDNA against oxidative damage during the peri‐implantation window. Proc Natl Acad Sci. 2022;119(30):e2201168119. doi: 10.1073/pnas.2201168119 [DOI] [PMC free article] [PubMed] [Google Scholar]
- 110. Stoccoro A, Coppedè F. Mitochondrial DNA methylation and human diseases. Int J Mol Sci. 2021;22(9):4594. doi: 10.3390/ijms22094594 [DOI] [PMC free article] [PubMed] [Google Scholar]
- 111. Angrand L, Boukouaci W, Lajnef M, et al. Low peripheral mitochondrial DNA copy number during manic episodes of bipolar disorders is associated with disease severity and inflammation. Brain Behav Immun. 2021;98:349‐356. doi: 10.1016/j.bbi.2021.09.003 [DOI] [PubMed] [Google Scholar]
- 112. Scozzi D, Cano M, Ma L, et al. Circulating mitochondrial DNA is an early indicator of severe illness and mortality from COVID‐19. JCI Insight. 2021;6(4):e143299. doi: 10.1172/jci.insight.143299 [DOI] [PMC free article] [PubMed] [Google Scholar]
- 113. Cai X, Li X, Liang C, et al. Mitochondrial DNA copy number is associated with Crohn's disease: a comprehensive Mendelian randomization analysis. Sci Rep. 2023;13(1):21016. doi: 10.1038/s41598-023-48175-5 [DOI] [PMC free article] [PubMed] [Google Scholar]
- 114. Giaglis S, Daoudlarian D, Voll RE, Kyburz D, Venhoff N, Walker UA. Circulating mitochondrial DNA copy numbers represent a sensitive marker for diagnosis and monitoring of disease activity in systemic lupus erythematosus. RMD Open. 2021;7(3):e002010. doi: 10.1136/rmdopen-2021-002010 [DOI] [PMC free article] [PubMed] [Google Scholar]
- 115. Crujeiras AB, Diaz‐Lagares A. DNA methylation in obesity and associated diseases. Epigenetic Biomarkers and Diagnostics. Elsevier; 2016:313‐329. doi: 10.1016/B978-0-12-801899-6.00016-4 [DOI] [Google Scholar]
- 116. Borah S, Mishra R, Dey S, et al. Prognostic value of circulating mitochondrial DNA in prostate cancer and underlying mechanism. Mitochondrion. 2023;71:40‐49. doi: 10.1016/j.mito.2023.05.005 [DOI] [PubMed] [Google Scholar]
- 117. Al‐Kafaji G, Aljadaan A, Kamal A, Bakhiet M. Peripheral blood mitochondrial DNA copy number as a novel potential biomarker for diabetic nephropathy in type 2 diabetes patients. Exp Ther Med. 2018;16(2):1483‐1492. doi: 10.3892/etm.2018.6319 [DOI] [PMC free article] [PubMed] [Google Scholar]
- 118. Ashar FN, Zhang Y, Longchamps RJ, et al. Association of Mitochondrial DNA copy number with cardiovascular disease. JAMA Cardiol. 2017;2(11):1247‐1255. doi: 10.1001/jamacardio.2017.3683 [DOI] [PMC free article] [PubMed] [Google Scholar]
- 119. Corsi S, Iodice S, Vigna L, et al. Platelet mitochondrial DNA methylation predicts future cardiovascular outcome in adults with overweight and obesity. Clin Epigenetics. 2020;12(1):29. doi: 10.1186/s13148-020-00825-5 [DOI] [PMC free article] [PubMed] [Google Scholar]
- 120. Gambardella S, Limanaqi F, Ferese R, et al. CCF‐mtDNA as a potential link between the brain and immune system in neuro‐immunological disorders. Front Immunol. 2019;10:1‐9. doi: 10.3389/fimmu.2019.01064 [DOI] [PMC free article] [PubMed] [Google Scholar]
- 121. Mengel‐From J, Thinggaard M, Dalgård C, Kyvik KO, Christensen K, Christiansen L. Mitochondrial DNA copy number in peripheral blood cells declines with age and is associated with general health among elderly. Hum Genet. 2014;133(9):1149‐1159. doi: 10.1007/s00439-014-1458-9 [DOI] [PMC free article] [PubMed] [Google Scholar]
- 122. Wang L, Han J, Fearnley LG, et al. Peripheral immune cell abundance differences link blood mitochondrial DNA copy number and Parkinson's disease. NPJ Parkinsons Dis. 2024;10(1):219. doi: 10.1038/s41531-024-00831-x [DOI] [PMC free article] [PubMed] [Google Scholar]
- 123. Lauritsen J, Romero‐Ramos M. The systemic immune response in Parkinson's disease: focus on the peripheral immune component. Trends Neurosci. 2023;46(10):863‐878. doi: 10.1016/j.tins.2023.07.005 [DOI] [PubMed] [Google Scholar]
- 124. Plascencia‐Villa G, Perry G. Exploring molecular targets for mitochondrial therapies in neurodegenerative diseases. Int J Mol Sci. 2023;24(15):12486. doi: 10.3390/ijms241512486 [DOI] [PMC free article] [PubMed] [Google Scholar]
Associated Data
This section collects any data citations, data availability statements, or supplementary materials included in this article.
Supplementary Materials
Tables S1‐S3.
Data Availability Statement
The data that support the findings of this study are available from the corresponding author upon reasonable request.