

ABSTRACT
Arginase plays a crucial role in the urea cycle; it also has immunosuppressive and pro‐tumor effects. The present study aimed to assess the effects of arginase inhibition by thymoquinone (2‐Isopropyl‐5‐methyl‐1,4‐benzoquinone), an active compound of Nigella sativa, on cell death in the MDA‐MB‐231 triple‐negative breast tumor cell line. Cell viability assays, Western blot analysis, and flow cytometry analysis were used to characterize oxidative stress and cell death. Our results showed that inhibition of arginase activity with thymoquinone significantly increased intracellular nitric oxide levels and resulted in overproduction of cellular and mitochondrial reactive oxygen species. Reductions in cell viability, cycle arrest, and increased cell death were also observed. Loss of transmembrane mitochondrial potential, activation of caspase‐3, ‐7, and ‐9, cleavage of PARP, condensation and/or fragmentation of the nuclei, suggest that this cell death involved apoptosis. Furthermore, a cytoplasm vacuole formation and an increase in the ratio of [LC3‐II/LC3‐I] suggests a concomitant activation of autophagy with apoptosis. Altogether, the present study highlighted that arginase inhibition with thymoquinone induces a hybrid type of cell death defined as oxiapoptophagy. Thus, arginase inhibition with thymoquinone in the MDA‐MB‐231 cell line could be, in part, involved in the anticancer effect of thymoquinone.
Keywords: apoptosis, arginase, autophagy, oxidative stress, thymoquinone
Arginase activity inhibition with thymoquinone causes an increase in intracellular nitric oxide levels as well as an overproduction of cellular and mitochondrial reactive oxygen species. These effects result in triggering cell death, which is characterized by both apoptotic and autophagic criteria, suggesting that arginase inhibition with thymoquinone induces a hybrid type of cell death defined as oxiapoptophagy.

1. Introduction
Human arginase is a trimeric protein, containing a binuclear manganese metalloenzyme that catalyzes the hydrolysis of l‐arginine into urea and l‐ornithine (PubChem CID: 6322; Supplementary Figure S1) [1]. In mammals, arginase exists as two isoforms: arginase‐1 (PubChem: P05089) and arginase‐2 (PubChem: P78540) (Supplementary Figure S1). The two isoforms are encoded by distinct genes on separate chromosomes, but they share more than 50% amino acid identity, employ similar catalytic mechanisms, and produce the same metabolites [2]. Arginase‐1 is a cytosolic isoform involved in the urea cycle, predominantly present in the live but also expressed in the bone marrow and in human epithelial cells [3]. Arginase‐2 is a ubiquitous mitochondrial isoform that is expressed in extrahepatic tissues. It is involved in the production of l‐ornithine, proline, polyamines, and glutamate. Proline is used for collagen synthesis, whereas polyamines enhance cell proliferation [4, 5]. Arginase shares its substrate, l‐arginine, with nitric oxide synthase (NOS), which converts it into l‐citrulline and nitric oxide (NO). An imbalance between l‐arginine consumption by arginase and NOS could underlie several physiological dysfunctions and pathologies [6]. Recent studies have highlighted the involvement of arginase activity and/or expression in the progression and promotion of cancers. It is involved in tumorigenesis either through the excessive production of polyamines needed for the growth and development of cancer cells or through its immunosuppressive effects via the depletion of extracellular arginine, which modulates T‐cell functions [7, 8, 9]. Moreover, arginase inhibition results in the inhibition of the proliferation, adhesion, migration, and metastasis of cancer cells [7, 10, 11]. Arginase involvement in breast cancer has been highlighted in the literature. Few studies have investigated arginase activity or changes in protein expression level in breast cancer patients and tumor cell lines [12, 13, 14].
Triple negative‐breast cancer (TNBC), is characterized by the lack of expression of three receptors: estrogen (ER), progesterone (PR), and the human epidermal growth factor receptor 2 (Her‐2) [15]. Despite significant advancements in breast cancer treatment, especially strategies targeting these receptors, patients with TNBC lack efficient therapies and continue to have the worst prognosis compared with other breast cancers. Presently, there are no standardized treatment strategies for TNBC, but chemotherapy, radiation, and surgery are therapeutic options [16]. To enhance therapeutic efficacy in TNBC treatment, various studies have focused on immuno‐therapies and targeted‐therapies [17]. Nowadays, various therapeutic approaches aim to block immunosuppressive enzymes such as arginase, NOS, and indoleamine 2,3 dioxygenase as complementary cancer therapies [18, 19]. Numerous clinical trials have targeted arginase with arginase inhibitors in combination with other therapies such as chemotherapy or radiation therapy and immune checkpoint inhibitors [20, 21]. The current study investigates the effects of arginase inhibition using thymoquinone (TQ), a naturally arginase inhibitor, on viability, cytotoxicity, cell growth, and cell death using the widely studied in vitro model of TNBC, the MDA‐MB‐231 cell line, known for its highly tumorigenic and invasive properties [22, 23].
2. Materials and Methods
2.1. Cell Culture and Treatments
MDA‐MB‐231 (RRID: CVCL_0062) and ARPE‐19 cells, a human retinal pigment epithelial cell line (RRID: CVCL_0145) were purchased from American Type Culture Collection Manassas, VA, USA. The ARPE‐19 cells were used as control cells to evaluate the cytotoxic effect of thymoquinone in normal cell line control. The cells were cultured in Dulbecco's modified Eagle medium (DMEM, Gibco, France), with 10% (v/v) of heat‐inactivated fetal bovine serum (FBS) (Pan Biotech, Germany) and 1% (v/v) of penicillin (100 U/mL)/streptomycin (100 mg/mL) (Gibco). The cells were incubated at 37°C in a humidified atmosphere (5% CO2, 95% air). For subcultures, cells were trypsinized (0.05% trypsin–0.02% EDTA solution) and passaged twice a week. After reaching 80% confluence, the cells were seeded onto 10 cm petri dishes (1 × 10⁶ cells/dish), 6‐well plates (4 × 10⁵ cells/well), or 24‐well plates (4 × 10⁴ cells/well). Thymoquinone was purchased from Sigma‐Aldrich (purity≧98%, catalogue number: 274666) (Saint‐Quentin Fallavier, France). Thymoquinone (2‐isopropyl‐5‐methyl‐1,4‐benzoquinone, PubChem CID: 1028) is a 10 carbon compound (C10H12O2) with a basic quinone ring moiety of 6 carbons, a 7th methyl group carbon at position C2 and 8th, 9th and 10th propyl group carbons at position C5 (Supplementary Figure S1) [24]. The stock solution of TQ was reconstituted in pure dimethyl sulfoxide (DMSO, Sigma‐Aldrich) and stored in the dark at 4°C. The cells were treated with the TQ concentrations (25, 50, 65, and 75 µM) chosen according to the concentration‐response effect measured in FDA and SR101 assays. The cells were tested with an equivalent concentration (0.03, 0.06, 0.08, and 0.09%) of DMSO as a negative vehicle control.
2.2. Measurement of Cell Viability With the Fluorescein Diacetate Assay
Fluorescein diacetate (FDA) was used to assess the cell viability through the measurement of the transformation of FDA to fluorescein by the intracellular esterase activity of living cells [25]. Before the experiment, the cells were seeded in 24 well‐flat‐bottom plates and incubated for 24 h. Next, they were treated with different dilutions of TQ (highest concentration, 1/1, of 100 µM) or DMSO (highest concentration, 1/1, of 0.13%) for 24 h. Next, the cell layer was rinsed with 1X phosphate‐buffered saline (1X PBS) and incubated with 35 µM of FDA solution (Cat#F1303, Invitrogen) for 5 min at 37°C. Then, the fluorescence was evaluated at λex. max 485 nm/λem. max 528 nm using a fluorescence microplate reader (Tecan, Sunrise, Tecan Lyon, France). Data are expressed as percentages of control: (Fluorescence (assay) × 100)/Fluorescence (control)).
2.3. Quantification of Adherent Cells With Sulforhodamine 101 Assay
Quantification of adherent cells was performed with the Sulforhodamine 101 assay (SR101), which binds electrostatically to cellular proteins and emits fluorescence [26]. MDA‐MB‐231 and ARPE‐19 cells were seeded into 24‐well flat‐bottom plates for 24 h and then treated with different dilutions of TQ (highest concentration, 1/1, of 100 µM) or DMSO (highest concentration, 1/1, of 0.13%). At the end of the 24‐h treatment, adherent cells were fixed with ice‐cold 70% ethanol for 20 min at 4°C, then rinsed twice with 1X PBS and incubated for 30 min at 4°C with 1.5 µM of SR101 solution (Cat#S7635, Sigma‐Aldrich). After two washes with 1X PBS, fluorescence was measured at λex. max 535 nm/λem. max 610 nm using a fluorescence microplate reader (Tecan, Sunrise, Tecan Lyon, France). Data are expressed as percentages of control: (Fluorescence (assay) × 100)/Fluorescence (control)).
2.4. Measurement of Arginase Activity
The cellular arginase activity was evaluated using the micro‐method described by Corraliza et al. [27]. This requires measurement of urea generated through the hydrolysis of l‐arginine. Cells were cultivated for 24 h on 6‐well plates, next, they were treated with different concentrations of TQ (25, 50, 65, and 75 µM) or different concentrations of DMSO. After a 24‐hour treatment, samples of 106 cells were suspended in 100 µL of lysis solution (10% protease inhibitor; 0.1% Triton X100). The mixture was centrifuged for 20 min at 4°C at 16000 g. After cell lysis, 50 µL of cell lysate was incubated with 50 µL of the activation solution (10 mM MnCl2 and 50 mM Tris‐HCl, pH 7.4) for 10 min at 56°C to activate the enzyme. Next, 100 µL of l‐arginine solution (0.5 M; pH 9.7) (Cat#A5006, Sigma Aldrich) was added to the activated lysate and incubated for 1 h at 37°C. The reaction was stopped by adding 400 µL of the stop solution (H2SO4, H3PO4, and H2O; 1/3/7, v/v/v). Twenty‐five microliters of 9% α‐isonitrosopropiophenone (α‐ISPF, Cat#I3502, Sigma Aldrich) dissolved in absolute ethanol, was added to quantify the urea formed, followed by incubation at 95°C for 45 min. After 10 min of incubation in the dark at room temperature, the optical density was measured at a wavelength of 540 nm in an absorbance microplate reader. A urea calibration curve was used to determine urea concentration. Arginase activity was expressed in µmoles of urea/minute/106cells.
2.5. Arginase mRNA Expression
To evaluate arginase gene expression, cells were treated for 24 h with different TQ concentrations (25, 50, 65, and 75 µM) or different DMSO concentrations. Cells were collected and the total RNA was isolated from untreated and treated cells using the RNAeasy Kit (Qiagen) according to the manufacturer's instructions. A NanoDrop 2000 spectrophotometer (ThermoFisher Scientific, MA, USA) was used to determine the concentration and purity of the extracted RNA. For each sample, cDNA was prepared from 100 µg of total RNA by reverse transcription using the PrimeScript RT Reagent Kit (Cat#RR036, Takara). Quantitative real‐time PCR (qRT‐PCR) was performed using PromegaBryt Green dye Gotaq qPCR Master Mix. The sequences of primers used to amplify human ARG1, ARG2, and β‐actin genes are listed in Supplemental Table S1 [28, 29]. The iQ5 Real‐Time PCR Detection System (BioRad Laboratories, CA) was used to carry out the qRT‐PCR assays in a final volume of 20 µL. The amplification conditions were as described previously [8]. For each experiment non–template (cDNA‐free) controls were performed. All samples were analyzed in duplicate. ARG1 and ARG2 expression levels were normalized to the housekeeping gene β‐actin and determined using the 2−ΔCT method [30].
2.6. Measurement of Intracellular NO Levels
Diaminofluorescein‐FM diacetate (DAF‐FM DA) is a sensitive cell‐permeable fluorescent probe reagent for the quantification of low concentrations of intracellular nitric oxide. Cells that had been cultured in 6‐well plates and treated with TQ (25, 50, 65, and 75 µM) or different DMSO concentrations for 24 h, were washed with 1X PBS and then stained with 10 µM DAF‐FM DA solution (Cat#D2321, Sigma Aldrich) for 15 min at 37°C. The fluorescence signal was collected using a 580 ± 20 nm band pass filter on an LSR II flow cytometer (BD Bioscience), acquiring 10,000 cells per sample. FlowJo v10.8.1 software (RRID:SCR_008520) (Tree Star Inc., Carrboro, NC, USA) was used for data analysis.
2.7. Measurement of Intracellular Reactive Oxygen Species Production With Dihydroethidium
The production of reactive oxygen species (ROS), mainly superoxide anions, was measured using dihydroethidium (DHE) as previously described [31]. It is a nonfluorescent fluorochrome, which is rapidly absorbed by living cells and oxidized to ethidium in the presence of ROS. Then it intercalates with the cellular nucleic acids and emits orange/red fluorescence. After 24 h of treatment with TQ (25, 50, 65, and 75 µM) or different DMSO concentrations, adherent and non‐adherent cells were washed with 1X PBS and then stained with a 2 µM DHE solution (Cat#37291, Sigma‐Aldrich) at 37°C for 15 min. Next, the fluorescence of DHE‐stained cells was collected using a 580 ± 20 nm band pass filter on an LSR II flow cytometer (BD Bioscience), acquiring 10,000 cells per sample. FlowJo v10.8.1 software (RRID:SCR_008520) (Tree Star Inc., Carrboro, NC, USA) was used for data analysis.
2.8. Measurement of Mitochondrial Reactive Oxygen Species Production With Mitosox‐Red
The MitoSox Red was used to evaluate mitochondrial ROS (mtROS) production, including the generation of the superoxide anion (O2 .−) [32, 33]. In the mitochondria, the probe can be oxidized and then exhibits an orange/red fluorescence (λEx Max = 510 nm; λEm Max = 580 nm). After 24 h of treatment with TQ (25, 50, 65, and 75 µM) or different DMSO concentrations, the adherent and non‐adherent cells were collected, rinsed with 1X PBS, and then incubated with 5 µM MitoSox solution (Cat#M36008, Invitrogen) for 15 min at 37°C. Next, the fluorescent signal of MitoSox‐stained cells was collected using a 580 ± 20 nm band pass filter on an LSR II flow cytometer (BD Bioscience), acquiring 10,000 cells per sample. FlowJo v10.8.1 software (RRID:SCR_008520) (Tree Star Inc., Carrboro, NC, USA) was used for data analysis.
2.9. Measurement of Plasma Membrane Permeability With Propidium Iodide
The plasma membrane permeability and cell death were evaluated using propidium iodide (PI). This is a fluorescent agent which is able to penetrate cells with a damaged cytoplasmic membrane, considered to be dead [34]. The percentage of positive PI cells is proportional to the percentage of dead cells. MDA‐MB‐231 cells were seeded in 6‐well culture plates and then were exposed to different concentrations of TQ (25, 50, 65, and 75 µM) or different DMSO concentrations for 24 h. Adherent and non‐adherent cells were collected and washed with 1X PBS, then were stained with a PI solution (1 µg/mL) for 5 min at 37°C. Next, the cells were analyzed on LSR II flow cytometer (BD Bioscience) and red fluorescence was measured using a 590 ± 20 nm bandpass filter on an LSR II flow cytometer (BD Bioscience), with 10,000 cells per sample. FlowJo v10.8.1 software (RRID:SCR_008520) (Tree Star Inc., Carrboro, NC, USA) was used for data analysis.
2.10. Visualization of Cell Morphology by Phase Contrast Microscopy
MDA‐MB‐231 cells were cultured with or without TQ (25, 50, 65, and 75 µM) for 24 h. After 24 h of incubation, the morphology and density of cells were observed at 10× and 40× magnification using a phase contrast microscope (Axiovert 40 CFL, Zeiss). Images were taken using an Axiocam camera (Zeiss).
2.11. Nuclei Staining With Hoechst 33342: Morphological Characterization of Apoptotic Cells
The nuclear morphology of cells treated with TQ (25, 50, 65, and 75 µM) or vehicle for 24 h was characterized using fluorescence microscopy. The cells were stained with 2 µg/mL of Hoechst 33342 solution (Sigma‐Aldrich) [35, 36]. Cell deposits of about 40,000 cells were applied to glass slides by cytocentrifugation for 5 min at 250 g with a cytospin 2 (Shandon, Cheshire, UK). Cells were then stored in a fluorescent mounting medium (Dako, Copenhagen, Denmark) in the dark at 4°C until observation. The morphological aspect of the cell nuclei was observed with an Axioskop fluorescence microscope under ultraviolet light at 40× magnification (Zeiss). Apoptotic cells are characterized by condensed and/or fragmented nuclei [35, 36].
2.12. Flow Cytometric Evaluation of Transmembrane Mitochondrial Potential by Staining With Dihexyloxacarbocyanine Iodide (DiOC6(3))
3,3'‐Dihexyloxacarbocyanine iodide (DiOC6(3)) was used to evaluate variations in transmembrane mitochondrial potential (∆Ψm). Accumulation of this fluorochrome in the mitochondria reflects the ΔΨm value [37]. Cells were plated for 24 h in 6‐well plates, then were exposed to different TQ concentrations (25, 50, 65, and 75 µM) or different DMSO concentrations. After 24‐h of treatment, cells were collected after trypsinization, washed with 1X PBS, and stained for 15 min at 37°C with 40 nM DiOC6(3) solution (Cat#D273, Invitrogen/Thermo Fisher Scientific, France). Cells were analyzed on LSR II flow cytometer (BD Bioscience) using a 520 ± 10 nm bandpass filter for 10,000 cells per sample. FlowJo v10.8.1 software (RRID:SCR_008520) (Tree Star Inc., Carrboro, NC, USA) was used for data analysis. The loss of ΔΨm was indicated by a decrease in the intensity of the green fluorescence.
2.13. Evaluation of Caspase 3/7 Activity
The caspase 3/7 activity was detected using Cell MeterTM caspase 3/7 activity assay kit (Cat#22823, AAT Bioquest) according to the manufacturer's instructions. MDA‐MB‐231 cells were exposed to different TQ concentrations (25, 50, 65, and 75 µM) or different DMSO concentrations for 24 h. The adherent and non‐adherent cells were then collected and washed with PBS. The pellet was incubated with TF2‐DEVD‐FMK, as a fluorogenic indicator for caspase 3/7 activity, in cell culture medium for 3 h at 37°C. Then, cells were pelleted and suspended in the assay buffer. The fluorescence intensity was detected using LSR II flow cytometry with a 530 ± 30 nm filter, and for each sample, 10,000 cells were acquired. FlowJo v10.8.1 software (RRID:SCR_008520) (Tree Star Inc., Carrboro, NC, USA) was used for data analysis.
2.14. Western Blot
Total cellular proteins were isolated from control and TQ treated cells using RIPA buffer (10 mM Tris–HCl pH 7.2, 150 mM NaCl, 0.5% Nonidet P‐40, 0.5% sodium deoxycholate, 0.1% SDS, 50 mM NaF, 2 mM EDTA) containing a complete protease inhibitor cocktail for 30 min on ice. The whole cell lysate was recovered by centrifugation at 20,000 g for 20 min at 4°C to remove insoluble material. The total protein concentration was determined using bicinchoninic acid (BCA) reagent as a standard (Sigma‐Aldrich). Subsequently, 80 µg of protein was boiled in the Laemmli loading buffer, separated on 8%, 12%, or 14% SDS‐PAGE gels, and then transferred to PVDF membranes (Bio‐Rad). After blocking nonspecific binding sites with 5% milk in PBS‐Tween (Tris‐buffered saline/1% Tween‐20), the membranes were probed with primary antibodies overnight at 4°C: anti‐PARP (Cat#9532, Cell Signaling Technology, RRID:AB_659884); anti‐caspase‐3 (Cat#9662, Cell Signaling Technology, RRID:AB_331439); anti‐caspase‐7 (Cat#9492, Cell Signaling Technology, RRID:AB_2228313); anti‐caspase‐9 (Cat#9508, Cell Signaling Technology, RRID:AB_2068620), and anti‐LC‐3 (Cat#L8918, Sigma‐Aldrich, RRID:AB_1079382). Additional details on these antibodies are shown in Supplemental Table S2. The membrane was then washed three times for 5 min with the PBS‐Tween followed by incubation with appropriate secondary antibodies. After 1 h of incubation, the membrane was washed and the bands were revealed using a chemiluminescent kit (Cat#34096, SuperSignal West Femto Maximum Sensitivity Substrate (Fisher Scientific). The Chemidoc Touch System (Bio‐Rad) was used for image acquisition. ImageLab software (RRID:SCR_014210) was used for densitometric analysis of the blots.
2.15. Flow Cytometric Analysis of Cell Cycle
To study the cell cycle, the cells were exposed to different concentrations of TQ (25, 50, 65, and 75 µM) or different DMSO concentrations for 24 h. Then, the adherent and non‐adherent cells were harvested separately. The pellet was washed with 1X PBS, and fixed with ice‐cold 70% ethanol for 12 h at −20°C. Next, cells were washed with 1X PBS and stained with PI‐RNase solution (80 µg/ml PI and 200 µg/ml RNase in PBS) in the dark for 1 h at 37°C. Data acquisition was performed using an LSRII flow cytometer (BD Bioscience). The ModFit LT 6.0 software (RRID:SCR_016106) (Verity software house Inc., Topsham, ME, USA) was used for data analysis.
2.16. Statistical Analysis
Statistical analyses were performed using the GraphPad Prism 10.2 software (RRID:SCR_002798) (GraphPad Software, San Diego, CA, USA). The IC50 values were calculated by the nonlinear regression model of inhibitor versus normalized response variable slope. The data were represented as the mean ± standard deviation (SD) and compared either with a student's t‐test or by one‐way or two‐way analysis of variance (ANOVA) test followed by a Tukey's posttest. The data were considered statistically significant at a threshold of p < 0.05.
3. Results
3.1. Thymoquinone Modulates Arginase Activity and Gene Expression
The effect of the TQ on arginase activity and gene expression in MDA‐MB‐231 was evaluated through a colorimetric enzyme assay and qRT‐PCR, respectively (Figure 1). Cells were treated with different TQ concentrations (25, 50, 65, and 75 µM) including the IC50, as determined by FDA and SR101 assays (Supplementary Figure S2). The cytotoxicity of TQ was also evaluated for normal cell line control, ARPE‐19 cells, and the only significant effect was observed at the highest concentration of 100 µM (Supplementary Figure S3). Arginase activity assays showed that exposure of MDA‐MB‐231 cells to different TQ concentrations resulted in a significant reduction in urea production, which dropped from 0.24 µmol of urea/min/106 cells in control cells to 0.17 (p < 0.05), 0.15 (p < 0.05), and 0.1 (p < 0.001) µmol of urea/min/106 cells in treated cells with TQ at 50, 65, and 75 µM, respectively (Figure 1a). This reduction reflects an inhibition of arginase activity by TQ. The arginase activity was significantly decreased by 1.7‐fold (p < 0.05) and 2.2‐fold (p < 0.01) in cells treated with TQ at 65 and 75 µM, respectively, compared to controls. However, no significant effect was shown after treatment with DMSO.
Figure 1.

Effect of TQ on arginase activity and gene expression on MDA‐MB‐231 cells treated with various TQ concentrations (25, 50, 65, and 75 µM) or with the DMSO at 0.09%. (a) Arginase activity was evaluated by measuring urea production by cell lysates. (b) ARG2 mRNA expression evaluation with qRT‐PCR. Data are expressed as mean ± SD, and procedures were carried out in triplicate. Comparison of the data was performed with an ANOVA followed by a Tukey post‐test. Statistically significant differences were observed for each condition vs control cells with *p < 0.05, ***p < 0.0001.
Next, we examined the arginase isoform gene expression in TQ‐treated and untreated cells. At first, we observed that only the ARG2 isoform mRNA expression was detected in the untreated MDA‐MB‐231 cells while ARG1 was not detected. Secondly, the qRT‐PCR results showed that TQ treatment increased ARG2 mRNA expression in the treated cells (Figure 1b). Compared to the controls, cells treated with 75 µM of TQ showed a significant increase in ARG2 mRNA expression of approximately 3.6‐fold (p < 0.05). However, no significant effect was shown with DMSO.
According to these results, we suggest that arginase‐2 is the isoform responsible for the detected arginase activity in MDA‐MB‐231 cells. The results also revealed that TQ modulated enzymatic activity and gene expression by inhibiting the enzymatic activity of the arginase, which may have indirectly led to the upregulation of ARG2 gene expression.
3.2. Arginase Activity Inhibition Promotes Intracellular NO and Induces Oxidative Stress
Given that arginase and NOS share the same substrate, l‐arginine, we investigated the effect of inhibition of arginase activity using TQ on the intracellular NO level. Arginase activity inhibition was found to be related to an increase in intracellular NO level in MDA‐MB‐231 cells (Figure 2a). We noted a remarkable elevation of the percentage of DAF‐positive cells to 7, 10, and 14% after treatment with 50, 65, and 75 µM of TQ for 24 h (p < 0.001–p < 0.0001). However, no significant effect on intracellular NO level was observed with DMSO.
Figure 2.

Effects of inhibition of arginase activity with TQ on the production of intracellular NO, cellular and mitochondrial ROS, in MDA‐MB‐231 cells treated with various TQ concentrations (25, 50, 65, and 75 µM) or with the DMSO at 0.09%. (a) The intracellular NO level was assessed by flow cytometry after staining with DAF‐FM DA and expressed as the percentage of DAF positive cells. (b) The production of cellular ROS was assessed by flow cytometry after staining with DHE and expressed as the percentage of DHE positive cells. (c) The production of mitochondrial ROS was assessed using MitoSox Red and expressed as the percentage of MitoSOX positive cells. The data are expressed as mean ± SD of three independent experiments performed in triplicate. Statistically significant differences were observed for each condition vs control cells with ***p < 0.001, ****p < 0.0001.
This data suggests that the arginase activity inhibition with TQ may enhance the bioavailability of l‐arginine in the medium intended for NO production.
Given the role NO in inducing oxidative stress and in ROS formation, we evaluated the effect of inhibiting arginase activity on cellular and mitochondrial ROS production by flow cytometry, through staining with DHE and MitoSOX‐Red, respectively. As shown in Figure 2b, 24‐h treatment with TQ increased the percentage of DHE‐positive cells compared to control cells. Cellular ROS production was significantly increased to 25, 28, and 35% after treatment with 50, 65, and 75 µM of TQ compared to control cells, respectively (p < 0.0001), reflecting a ROS overproduction. However, no effect was observed on cellular ROS production after treatment with DMSO.
We noted a significant elevation in mtROS formation after the inhibition of arginase activity with TQ (Figure 2c). The results showed an elevation of the percentage of MitoSOX positive cells to 40, 75, 87, and 87% at TQ used concentrations of 25, 50, 65, and 75 µM, respectively (p < 0.0001). However, no effect was observed on mtROS production after treatment with DMSO.
These results suggest that, in MDA‐MB‐231 cells, inhibiting arginase induces the overexpression of cellular and mtROS through the induction of intracellular NO production.
3.3. Arginase Activity Inhibition Induces Cell Death
To define whether arginase activity inhibition could disrupt MDA‐MB‐231 plasma membrane permeability and promote cell death, cells were exposed to various concentrations of TQ for 24 h, and then were either stained with PI or observed with phase‐contrast microscopy. We noted a significant alteration of plasma membrane permeability leading to cell death induction (Figure 3a). The result showed that TQ treatment at concentrations of 25, 50, 65, and 75 µM significantly increased the percentage of PI‐positive cells to 16, 41, 69, and 83%, respectively (p < 0.0001). However, no effect was observed on DMSO.
Figure 3.
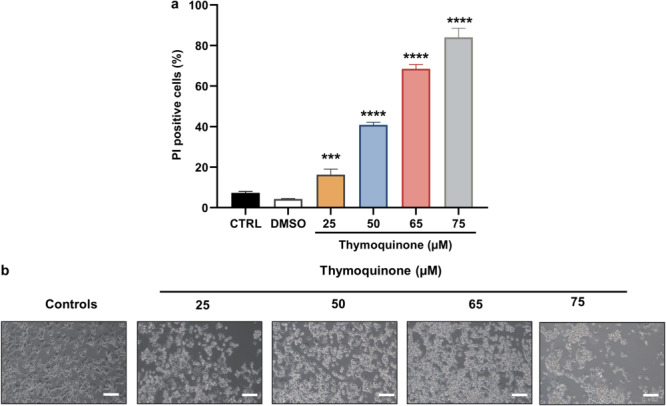
Effects of arginase activity inhibition with TQ on cell death and cell morphology on MDA‐MB‐231 cells treated with various TQ concentrations (25, 50, 65, and 75 µM) or with the DMSO at 0.09%. (a) Cell death was assessed by flow cytometry after staining with propidium iodide (PI). Data are expressed as mean ± SD, and procedures were carried out in triplicate. The comparison of the data was performed with an ANOVA test followed by a Tukey test. Statistically significant differences were observed for each condition vs control cells with ***p < 0.001, ****p < 0.0001. (b) Analysis of morphological changes in TQ‐treated and untreated MDA‐MB‐231 cells using phase contrast microscopy.
Phase‐contrast microscopy was applied to examine morphological changes in MDA‐MB‐231 cells treated with various TQ concentrations compared to untreated cells. After 24 h of TQ treatment, the morphology of the MDA‐MB‐231 cell line changed compared to the control group. An increased number of rounded cells suspended in the culture medium were observed, reflecting a loss of cell adhesion (Figure 3b).
These results showed that arginase activity inhibition with TQ induces the alteration of the plasma membrane, cell morphology, and loss of cell adhesion in MDA‐MB‐231 cells.
3.4. Characterization of Apoptosis Cell Death
Our initial approach to characterize cell death induced by TQ was by examining apoptosis. Therefore, we performed different complementary assays: Hoechst 33342 staining (evaluation of nuclear condensation and/or fragmentation), measurement of the ∆Ψm, evaluation of the induction caspase 3/7 activation, and assaying PARP fragmentation (Figure 4). The results showed that in Hoechst 33342‐stained MDA‐MB‐231 cells, nuclear fluorescence intensity, which directly corresponds to apoptotic chromatin changes, was increased with TQ concentrations after 24 h of treatment (Figure 4a). In control cells, nuclei were mainly round and regular (viable cells), however several cells with condensed nuclei and fragmented nuclei, characteristic of apoptosis [36], were observed following treatment with TQ (25–75 µM). The ∆Ψm is a key indicator of mitochondrial activity. Its loss and the disruption of mitochondrial function may result in the release of apoptotic factors, leading to cell death. The measurement of the ∆Ψm in TQ‐treated or untreated MDA‐MB‐231 cells was performed using DiOC6(3) staining. The results showed that treatment with TQ marked an increase in the percentage of DiOC6(3) negative cells compared to untreated cells, which reflected cells with depolarized mitochondria (Figure 4b). We noted a significant decrease in ∆Ψm after a 24‐ hour treatment with 50, 65, and 75 µM TQ with 24, 49, and 55% DiOC6(3) negative cells, respectively (p < 0.0001). No effect was observed in the cells treated with DMSO.
Figure 4.

Characterization of apoptotic cell death induced by arginase inhibition on MDA‐MB‐231 cells treated with various TQ concentrations (25, 50, 65, and 75 µM) or with the DMSO at 0.09%. (a) Cellular apoptosis observed with Hoechst 33342 staining for untreated and treated cells (25, 50, 65, and 75 µM TQ); cells with condensed nuclei (cn; red arrows) and fragmented nuclei (fn; white arrows).(b) The evaluation of ∆Ψm by staining with DiOC6(3) by flow cytometer. (c) The expression of several markers that reflect the mitochondrial apoptotic pathways (Caspase‐3, ‐7, ‐9 and PARP) was examined using Western blot analysis. (d) The quantification of apoptotic cells was measured through the quantification of activity caspase‐3/7 by flow cytometry. The comparison of the data was performed with ANOVA followed by a Tukey test. Statistically significant differences were observed for each condition vs control cells with ****p < 0.0001.
Alterations in ∆Ψm are known to induce apoptosis which is mediated by the activation of caspases, the central effectors of mitochondrial apoptosis. Therefore, in this study, the activation of caspase enzymes was assayed by Western blot analysis and flow cytometry to identify the underlying mechanism of apoptotic activity. At first, we proceeded with immunoblots to evaluate the expression and activation of several apoptotic markers: caspase‐3, caspase‐7, caspase‐9, and PARP (Figure 4c). Activation of caspases and PARP protein requires their cleavage to proteolytically functional products. Immunoblots indicated the presence of the active products of caspases ‐3, ‐7, and ‐9 after a 24‐h treatment with TQ at concentrations of 50, 65, and 75 µM. Also, for the PARP, active fragments were identified with all the concentrations of TQ used. Next, to confirm the immunoblot results, the enzymatic activity of caspase‐3/7 was investigated with flow cytometry (Figure 4d). Measurement of caspase‐3/‐7 activity validated the activation of caspases‐3 and ‐7. The results showed that the percentage of activecaspase‐3/‐7 positive cells increased significantly to 33% and 47% with TQ treatment for 24 h at concentrations of 65 and 75 µM, respectively (p < 0.0001). No effect was observed on the cells treated with DMSO.
Altogether, these present findings suggest that arginase inhibition could induce mitochondrial apoptosis in MDA‐MB‐231 cells, which is characterized by nuclear changes, the loss of ∆Ψm and caspase activation.
3.5. Characterization of Autophagy
We then proceeded to study the induction of autophagy through the observation of morphological changes using phase contrast microscopy and the evaluation of the levels of LC3‐I and LC3‐II proteins, autophagy markers (Figure 5). Microscopic observation of TQ‐ treated and untreated MDA‐MB‐231 cells revealed the presence of several cytoplasmic vacuoles only in cells treated with different concentrations of TQ (Figure 5a). This cytoplasmic vacuolation could represent autophagic vacuoles which suggest that TQ‐induced cell death may be associated with autophagy. To further confirm the induction of autophagy, we measured the conversion of LC3‐I (cytosolic form) to LC3‐II (autophagosome membrane‐bound form). As shown in Figure 5b, at different concentrations TQ induced an accumulation of LC3‐II. The ratio of LC3‐II/LC3‐I was increased 1.2‐fold, 1.4‐fold, and 1.5‐fold (p < 0.05), at TQ concentrations of 50, 65, and 75 µM respectively, compared to control cells (Figure 5c). The increase of this ratio reflects the conversion of LC3‐I to LC3‐II, suggesting an upregulation of autophagy. These results propose that arginase inhibition may induce the conversion of LC3‐I to LC3‐II, which is a key event in autophagy.
Figure 5.

Characterization of autophagy on MDA‐MB‐231 cells treated with various TQ concentrations (25, 50, 65, and 75 µM) or with the DMSO at 0.09%. (a) Analysis of morphological changes using phase contrast microscopy for untreated and treated cells (25, 50, 65, and 75 µM TQ) (yellow arrows: autophagic vacuoles; blue arrows: apoptotic bodies). (b) The expression of markers that reflect the autophagy (LC3I‐LC3II) was examined using Western blot analysis. (c) The ratio LC3‐II/LC3‐I. The comparison of the data was performed by ANOVA followed by a Tukey test. Statistically significant differences were observed for each condition vs control cells with *p < 0.05.
3.6. Cell Cycle Analysis
Inhibition of arginase activity with TQ inhibits the proliferation of MDA‐MB‐231 via ROS overproduction and induction of cell death. Therefore, cell cycle analysis was performed to understand the basis of this inhibition of proliferation (Figure 6). The results showed a disturbance in the cell cycle distribution of MDA‐MB‐231 cells (Figure 6b). The cell cycle phases were significantly affected at 50, 65, and 75 µM of TQ for the G0‐G1 and S phases, as well as at 50 and 65 µM for the G2‐M phase. A significant decrease was found in the G0‐G1 phase, with an important increase in the S‐phase and G2‐M phase compared to control cells (p < 0.01–p < 0.0001). According to this data, an increase in the percentage of cells in S‐phase, resulting in S‐phase arrest, was observed in the TQ‐treated cell group compared to the control group. In addition, as shown in Figure 6a, the significant decrease in G0‐G1 was accompanied by an increase in the subG1 peak with 50, 65, and 75 µM of TQ, reflecting an increase in the percentage of apoptotic cells.
Figure 6.
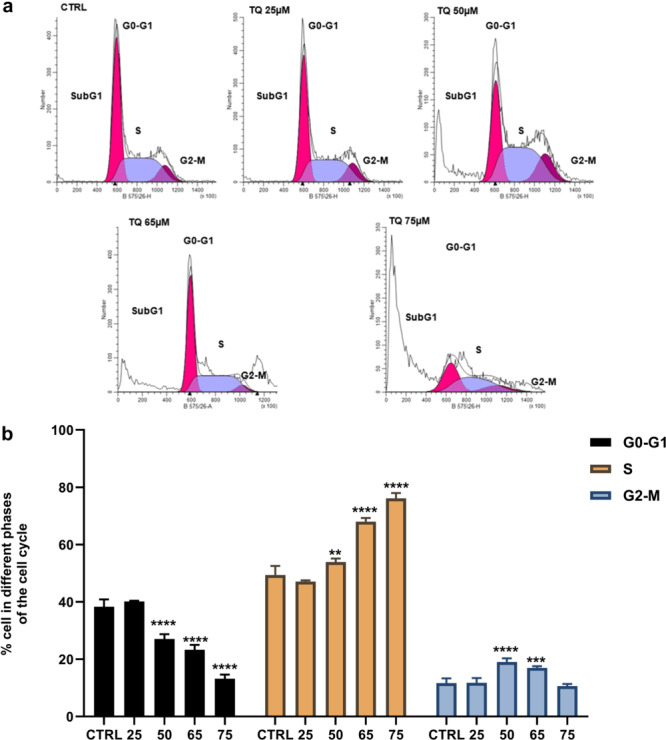
MDA‐MB‐231 cell cycle analysis. Cells were incubated for 24 h with TQ at concentrations of 25, 50, 65, and 75 µM. (a) Flow cytometric analysis of the distribution of the cells in the different phases of the cell cycle. (b) The quantification of the cells in the different phases, data are the mean ± SD of three independent experiments performed in triplicate. Comparisons of the data were performed using Two‐way ANOVA test followed by Tukey's post‐test. Statistically significant differences were observed for each condition vs control cells with **p < 0.01, ****p < 0.0001.
4. Discussion
Arginase activity and/or gene expression have been reported in tumor cells and plasma of several cancers. Upregulation of arginase has been associated with tumor development and progression in breast, cervical, ovarian, liver, melanoma, and pancreatic cancer [7, 8, 9]. In the current study, we used the thymoquinone, a natural compound, as an arginase inhibitor to evaluate the effect of arginase inhibition in a model of TNBC, the MDA‐MB‐231 cell line.
Under normal conditions, the MDA‐MB‐231 cells exhibit measurable basal arginase activity with mRNA expression of ARG2, but not ARG1 [14]. This implied that arginase‐2, the mitochondrial isoform, may be responsible for the arginase activity detected. It was reported that in breast cancer, arginase‐2 is the main isoform detected [38, 39]. Under TQ treatment, arginase activity was significantly inhibited in MDA‐MB‐231 cells, while the mRNA expression of ARG2 was increased. These results confirmed that TQ may be considered a natural inhibitor of arginase activity. However, the mechanism behind this inhibition remained unclear. Since arginase‐2 is involved in cancerous cell proliferation and growth, we investigated the effect of arginase inhibition with TQ on MDA‐MB‐231 cells. In our study, we reported that arginase activity inhibition with TQ was accompanied by an increased level of intracellular NO, which could be the origin of cellular and mitochondrial ROS overproduction, which are potent promoters of oxidative stress. The induced stress may compromise the plasma membrane and result in cell death. To identify the type of cell death induced, different cell‐based bioassays were performed. We noted the induction of the mitochondrial‐apoptotic pathway with the loss of ∆Ψm and the activation of caspases‐3, ‐7, and ‐9; and autophagy via the formation of cytoplasmic vacuoles and conversion of LC3‐I to LC3‐II. S‐phase arrest in the treated cells was observed, with the increase of the subG1 peak supporting the induction of apoptosis. Various studies have shown that arginase inhibition using other inhibitors affects the proliferation, adhesion, migration, and metastasis of cancer cells and induces cell death in different cell lines [7, 10, 11, 40].
Arginase shares the same intracellular pool of l‐arginine with the NOS for the synthesis of NO and l‐citrulline. NO plays a dual role in tumor growth, depending on its concentration. At low concentrations, NO exerts cytoprotective effects and triggers carcinogenesis through the activation of oncogenic pathways. However, at high concentrations, NO has been shown to produce cytotoxic effects in cancer cells and induces apoptosis [41]. The NO production can occur either by endothelial NOS (eNOS), inducible NOS (iNOS) or mitochondrial NOS in the cellular space as well as in the mitochondria. In addition, mitochondrial NO can have various effects on cellular respiration, ATP production, oxidative stress, apoptosis, and signaling [42]. A study has shown that in endothelial cells, eNOS can compete with arginase‐2 for l‐arginine, and arginase‐2 inhibition allows l‐arginine to accumulate and be more accessible to eNOS [43]. As the detected arginase activity originates from the mitochondrial isoform, arginase‐2, its inhibition by TQ may raise the bioavailability of l‐arginine which probably allows the excessive generation of NO by eNOS, iNOS and mitochondrial NOS.
Extensive research has revealed that an increase in NO levels results in the induction of oxidative stress by increasing the generation of ROS. NO can induce the production of mtROS by activating NADPH oxidases [44]. This could explain the observed overproduction of cellular and mtROS, which may be the result of the excess production of intracellular NO and the cause of oxidative stress induction. Furthermore, arginase expression may be elevated under conditions of oxidative stress. It has been shown that ROS such as ONOO‐ and H2O2 can increase arginase 2 expression [45, 46], which could explain the increase of ARG2 mRNA expression induced by TQ treatment. Production of ROS via the NADPH oxidase family occurs in a range of cellular localizations, such as the cytoplasm, cell membrane, mitochondria, endoplasmic reticulum, and peroxisome. An excess of ROS can cause oxidative stress and damage DNA, proteins, and lipids [47]. There is a strong correlation between oxidative stress and apoptosis as it has been shown that several physiological processes, including those that induce apoptosis, result in oxidative stress through ROS production [48]. In the current study, we reported a higher loss of ΔΨm in MDA‐MB‐231 cells, indicating the activation of the mitochondrial pathway. The alteration of the ΔΨm results in the alteration of mitochondrial permeabilization as well as mtROS production. The direct contribution of mtROS production in the promotion of mitochondria‐dependent apoptosis was demonstrated in various cell lines [49]. High levels of mtROS have been shown to induce mitochondrial DNA damage, leading to the alteration of mitochondrial RNA transcription, thus causing respiratory chain dysfunction and increased ROS generation, which in turn leads to a loss of ΔΨm followed by the release of proapoptotic factors [50]. These factors contribute to the activation of initiating caspases such as caspase‐2, ‐8, ‐9, and ‐10, which signals downstream cleavage/activation of effector caspases‐3, ‐6, and ‐7, causing the degradation of cell components and DNA fragmentation, as well as the formation of apoptotic bodies [48]. Inhibition arginase activity with TQ induces caspase‐9, ‐3, and ‐7 activation and PARP cleavage through the important loss of ΔΨm caused by the overproduction of cellular and mtROS, as well as an increase of cells in the S‐phase cell cycle. Consequently, the mitochondrial‐apoptotic pathway was induced via the activation of caspase‐9, ‐3, and ‐7 promoted by arginase activity inhibition with TQ. In addition to its role in the induction of apoptosis, it has been shown that ROS is also involved in the autophagy mechanism [47]. ROS, especially mtROS, are involved in induced autophagy, either cytoprotective autophagy under starvation to promote cell survival or cytotoxic autophagic cell death when survival is not possible [51]. In our study, inhibition of arginase activity with TQ induced the autophagic vacuole formation and the activation of LC3‐II from LC3‐I, leading to the initiation of autophagy. This may be ROS‐induced autophagy, which may be either cytoprotective or cytotoxic. Related to the cell cycle, our data show that arginase inhibition affected the cell cycle with the induction of the S‐phase cell cycle, as reported [14]. Interestingly, it has been demonstrated that arginase‐2 is upregulated in the S and G2‐M phases of several cancer cell lines, and its knockdown evidently reduces cancer cell growth and causes G2‐M arrest. These findings strongly suggest that arginase‐2 is an active enzyme in the committed S‐G2‐M phase of cancer cell lines, but not in normal cells [39].
The simultaneous induction of oxidative stress, apoptosis, and autophagy suggests that inhibition of arginase activity with TQ may induce a complex and hybrid mode of cell death defined as oxiapoptophagy [52, 53]. This mode of cell death was firstly reported in 2003 [52] and it was described in different cell types, including cancer cells [54, 55]. A hybrid type of cell death does not perfectly fit with defined modes, and includes several characteristics associated with different well‐known types of cell death [53]. A hybrid type of cell death induced by TQ is therefore not surprising, since some connections can exist between several signaling pathways associated with well recognized types of cell death [53]. At the moment oxiapoptophagy (OXIdative stress + APOPTOsis + autoPHAGY) is a well characterized hybrid type of cell death [55, 56]. Originally, oxiapoptophagy was found to be caused by oxysterols (oxidized forms of cholesterol generated from cholesterol by auto‐oxidation); this type of cell death can be classified both as conservative group of conditional cell death and apoptotic group of definite cell death. Based on these considerations, it is suggested that TQ can trigger a hybrid type of cell death in MDA‐MB‐231 cells since it induces oxidative stress, as well as with apoptotic (Figure 5a, blue arrow) and autophagic criteria (Figure 5a, yellow arrow). The involvement of arginase, especially arginase‐2, in cancer cell proliferation and survival is mediated by the production of polyamine and/or by the activation of different signaling pathways such as PI3K/AKT, mTORC1/2, MAPK, and STAT3 [7]. Aberrant activation of these pathways inhibits proapoptotic factors and autophagy processes and promotes antiapoptotic factors, causing a strong defect in cell proliferation and survival control, eventually promoting tumorigenesis, metastasis, and resistance to therapy [57, 58, 59]. Recently, it has been demonstrated that arginase‐2 induces melanoma cell proliferation through polyamine‐dependent enzymatic activity and promotes metastasis‐related processes through the mitochondrial H2O2‐STAT3 pathway, independently of its enzymatic activity [9].
Recent studies showed that TQ exerts anti‐cancerous effects on the MDA‐MB‐231 cells via the inhibition of cell proliferation and migration, the generation of ROS, and the promotion of cell death and cell cycle arrest [60, 61, 62]. It was demonstrated that TQ controls the expression of pro‐ and antiapoptotic genes, as well as the regulation of signaling pathways involved in the induction of apoptosis, such as PI3K/AKT, mTORC1/2, MAPK, and STAT3 [60, 63]. Taken together, our hypotheses suggest that the anticancer effects of TQ could be in part caused by the inhibition of arginase in TNBC cells. We hypothesize that the inhibition of arginase, which positively regulates the PI3K/AKT, mTORC1/2, MAPK, and STAT3 signaling pathways, could be responsible for the downregulation of signaling pathways under TQ treatment.
5. Conclusion
Under normal conditions, arginase plays a key role in cell proliferation and tissue repair via its involvement in the production of polyamine and proline; in cancer, arginase activity is upregulated, leading to the increase of the cell proliferation and growth. Our study demonstrates that TQ inhibits arginase activity in MDA‐MB‐231 cells. In breast cancer triple‐negative MDA‐MB‐231 cells, inhibition of arginase activity by TQ triggers apoptosis and autophagy, which are associated with an increase in intracellular NO levels as well as ROS generation, which results in caspase‐3, ‐7, and ‐9 activation, PARP cleavage, morphological nuclear changes, and conversion of LC3‐I to LC3‐II. Our data support that arginase activity inhibition in the presence of TQ triggers cell death in cancer cells and favors oxidative stress, leading to the induction of a complex mode of cell death described as oxiapoptophagy, characterized by both apoptotic and autophagic criteria. Taken together, our data support that TQ could have antitumor activities through inhibition of arginase activity for the treatment of triple‐negative breast cancer. Future research focusing on the signaling pathways involved in the induction of cell death might help to identify and discover the mechanisms underlying arginase inhibition‐induced cell death.
Author Contributions
Jaweher Bday: formal analysis; investigation; software; methodology; writing–original draft. Moufida Souid: formal analysis; methodology. Vivien Pires: investigation; methodology. Sallouha Gabbouj: methodology. Anne Véjux: methodology; writing–review and editing. Gérard Lizard: conceptualization; investigation; methodology; project administration; supervision; writing–review and editing. Elham Hassen: conceptualization; methodology; formal analysis; investigation; project administration; supervision; writing–review and editing.
Conflicts of Interest
The authors declare no conflicts of interest.
Supporting information
Supporting information.
Acknowledgements
The authors would like to thank Mr. Adel Rdissi for proofreading this article. The revised version of the manuscript has been submitted to Dr John Mackrill, University College of Cork, Cork, Ireland, to evaluate its scientific quality and to realize English corrections. Open Access funding enabled and organized by CNUDST.
Data Availability Statement
The data that support the findings of this study are available from the corresponding author upon reasonable request.
References
- 1. Wu G. and Morris S. M., “Arginine Metabolism: Nitric Oxide and Beyond,” Biochemical Journal 336, no. 1 (1998): 1–17. [DOI] [PMC free article] [PubMed] [Google Scholar]
- 2. Morris S. M., Bhamidipati D., and Kepka‐Lenhart D., “Human Type Ii Arginase: Sequence Analysis and Tissue‐Specific Expression,” Gene 193, no. 2 (1997): 157–161. [DOI] [PubMed] [Google Scholar]
- 3. Jenkinson C. P., Grody W. W., and Cederbaum S. D., “Comparative Properties of Arginases,” Comparative Biochemistry and Physiology Part B: Biochemistry and Molecular Biology 114, no. 1 (1996): 107–132. [DOI] [PubMed] [Google Scholar]
- 4. Morris S. M. Jr., “Recent Advances in Arginine Metabolism: Roles and Regulation of the Arginases,” British Journal of Pharmacology 157, no. 6 (2009): 922–930. [DOI] [PMC free article] [PubMed] [Google Scholar]
- 5. Pegg A. E., “The Function of Spermine,” IUBMB Life 66, no. 1 (2014): 8–18. [DOI] [PubMed] [Google Scholar]
- 6. Caldwell R. B., Toque H. A., Narayanan S. P., and Caldwell R. W., “Arginase: An Old Enzyme With New Tricks,” Trends In Pharmacological Sciences 36, no. 6 (2015): 395–405. [DOI] [PMC free article] [PubMed] [Google Scholar]
- 7. Niu F., Yu Y., Li Z., et al., “Arginase: An Emerging and Promising Therapeutic Target for Cancer Treatment,” Biomedicine & Pharmacotherapy Biomedecine & Pharmacotherapie 149 (2022): 112840. [DOI] [PubMed] [Google Scholar]
- 8. Souid M., Ghedira R., and Souissi S., et al, “Arginase Is Involved in Cervical Lesions Progression and Severity,” Immunobiology 2 (2022): 152189. [DOI] [PubMed] [Google Scholar]
- 9. Yu Y., Ladeiras D., Xiong Y., et al., “Arginase‐Ii Promotes Melanoma Migration and Adhesion Through Enhancing Hydrogen Peroxide Production and STAT3 Signaling,” Journal of Cellular Physiology 235, no. 12 (2020): 9997–10011. [DOI] [PubMed] [Google Scholar]
- 10. Pham T. N., Liagre B., Girard‐Thernier C., and Demougeot C., “Research of Novel Anticancer Agents Targeting Arginase Inhibition,” Drug Discovery Today 23, no. 4 (2018): 871–878. [DOI] [PubMed] [Google Scholar]
- 11. Wang X., Xiang H., Toyoshima Y., et al., “Arginase‐1 Inhibition Reduces Migration Ability and Metastatic Colonization of Colon Cancer Cells,” Cancer & Metabolism 11, no. 1 (2023): 1. [DOI] [PMC free article] [PubMed] [Google Scholar]
- 12. Giannoudis A., Varešlija D., Sharma V., et al., “Characterisation of the Immune Microenvironment of Primary Breast Cancer and Brain Metastasis Reveals Depleted T‐Cell Response Associated to ARG2 Expression,” ESMO Open 7, no. 6 (2022): 100636. [DOI] [PMC free article] [PubMed] [Google Scholar]
- 13. Porembska Z., Luboiński G., Chrzanowska A., Mielczarek M., Magnuska J., and Barańczyk‐Kuźma A., “Arginase in Patients With Breast Cancer,” Clinica Chimica Acta 328, no. 1 (2003): 105–111. [DOI] [PubMed] [Google Scholar]
- 14. Singh R., Pervin S., Karimi A., Cederbaum S., and Chaudhuri G., Arginase Activity in Human Breast Cancer Cell Lines: N(omega)‐Hydroxy‐L‐arginine Selectively Inhibits Cell Proliferation and Induces Apoptosis in MDA‐MB‐468 Cells. Published online 2000:9. [PubMed]
- 15. Hammerl D., Smid M., Timmermans A. M., Sleijfer S., Martens J. W. M., and Debets R., “Breast Cancer Genomics and Immuno‐Oncological Markers to Guide Immune Therapies,” Seminars in Cancer Biology 52 (2018): 178–188. [DOI] [PubMed] [Google Scholar]
- 16. Obidiro O., Battogtokh G., and Akala E. O., “Triple Negative Breast Cancer Treatment Options and Limitations: Future Outlook,” Pharmaceutics 15, no. 7 (2023): 1796. [DOI] [PMC free article] [PubMed] [Google Scholar]
- 17. Won K. A. and Spruck C., “Triple‐Negative Breast Cancer Therapy: Current and Future Perspectives (Review),” International Journal of Oncology 57, no. 6 (2020): 1245–1261. [DOI] [PMC free article] [PubMed] [Google Scholar]
- 18. Steggerda S. M., Bennett M. K., Chen J., et al., “Inhibition of Arginase By CB‐1158 Blocks Myeloid Cell‐Mediated Immune Suppression in the Tumor Microenvironment,” Journal for Immunotherapy of Cancer 5, no. 1 (2017): 101. [DOI] [PMC free article] [PubMed] [Google Scholar]
- 19. Grzywa T. M., Sosnowska A., Matryba P., et al., “Myeloid Cell‐Derived Arginase in Cancer Immune Response,” Frontiers in Immunology 11 (2020): 938. [DOI] [PMC free article] [PubMed] [Google Scholar]
- 20. Naing A., Papadopoulos K. P., Pishvaian M. J., et al., “First‐In‐Human Phase 1 Study of the Arginase Inhibitor INCB001158 Alone or Combined With Pembrolizumab in Patients With Advanced or Metastatic Solid Tumours,” BMJ Oncology 3, no. 1 (2024): e000249. [Google Scholar]
- 21. Javle M. M., Bridgewater J. A., Gbolahan O. B., et al., “A Phase I/Ii Study of Safety and Efficacy of the Arginase Inhibitor INCB001158 Plus Chemotherapy in Patients (Pts) With Advanced Biliary Tract Cancers,” Journal of Clinical Oncology 39, no. 3_suppl (2021): 311. [Google Scholar]
- 22. Chavez K. J., Garimella S. V., and Lipkowitz S., “Triple Negative Breast Cancer Cell Lines: One Tool in the Search for Better Treatment of Triple Negative Breast Cancer,” Breast Disease 32, no. 1–2 (2010): 35–48. [DOI] [PMC free article] [PubMed] [Google Scholar]
- 23. Welsh J., “Animal Models for Studying Prevention and Treatment of Breast Cancer.” Animal Models for the Study of Human Disease (Elsevier, 2013), 997–1018. [Google Scholar]
- 24. Ahmad A., Mishra R. K., Vyawahare A., et al., “Thymoquinone (2‐Isopropyl‐5‐methyl‐1, 4‐benzoquinone) As a Chemopreventive/Anticancer Agent: Chemistry and Biological Effects,” Saudi Pharmaceutical Journal 27, no. 8 (2019): 1113–1126. [DOI] [PMC free article] [PubMed] [Google Scholar]
- 25. Jones K. H. and Senft J. A., “An Improved Method to Determine Cell Viability by Simultaneous Staining With Fluorescein Diacetate‐Propidium Iodide,” Journal of Histochemistry & Cytochemistry 33, no. 1 (1985): 77–79. [DOI] [PubMed] [Google Scholar]
- 26. Namsi A., Nury T., Khan A. S., et al., “Octadecaneuropeptide (ODN) Induces N2a Cells Differentiation through a PKA/PLC/PKC/MEK/ERK‐Dependent Pathway: Incidence on Peroxisome, Mitochondria, and Lipid Profiles,” Molecules 24, no. 18 (2019): 3310. [DOI] [PMC free article] [PubMed] [Google Scholar]
- 27. Corraliza I. M., Campo M. L., Soler G., and Modolell M., “Determination of Arginase Activity in Macrophages: A Micromethod,” Journal of Immunological Methods 174, no. 1–2 (1994): 231–235. [DOI] [PubMed] [Google Scholar]
- 28. Jung K., Sabri S., Hanson J., et al., “Elevated ARG1 Expression in Primary Monocytes‐Derived Macrophages as a Predictor of Radiation‐Induced Acute Skin Toxicities in Early Breast Cancer Patients,” Cancer Biology & Therapy 16, no. 9 (2015): 1281–1288. [DOI] [PMC free article] [PubMed] [Google Scholar]
- 29. Koo B. H., Yi B. G., Jeong M. S., et al., “Arginase Ii Inhibition Prevents interleukin‐8 Production through Regulation of p38 MAPK Phosphorylation Activated by Loss of Mitochondrial Membrane Potential in nLDL‐Stimulated hAoSMCs,” Experimental & Molecular Medicine 50, no. 2 (2018): 438. [DOI] [PMC free article] [PubMed] [Google Scholar]
- 30. Livak K. J. and Schmittgen T. D., “Analysis of Relative Gene Expression Data Using Real‐Time Quantitative PCR and the 2−ΔΔCT Method,” Methods 25, no. 4 (2001): 402–408. [DOI] [PubMed] [Google Scholar]
- 31. Rothe G. and Valet G., “Flow Cytometric Analysis of Respiratory Burst Activity in Phagocytes With Hydroethidine and 2',7'‐Dichlorofluorescin,” Journal of Leukocyte Biology 47, no. 5 (1990): 440–448. [PubMed] [Google Scholar]
- 32. Sghaier R., Nury T., Leoni V., et al., “Dimethyl Fumarate and Monomethyl Fumarate Attenuate Oxidative Stress and Mitochondrial Alterations Leading to Oxiapoptophagy in 158N Murine Oligodendrocytes Treated With 7Β‐Hydroxycholesterol,” Journal of Steroid Biochemistry and Molecular Biology 194 (2019): 105432. [DOI] [PubMed] [Google Scholar]
- 33. Zarrouk A., Vejux A., Nury T., et al., “Induction of Mitochondrial Changes Associated With Oxidative Stress on Very Long Chain Fatty Acids (C22:0, C24:0, or C26:0)‐Treated Human Neuronal Cells (SK‐NB‐E),” Oxidative Medicine and Cellular Longevity 2012 (2012): 1–15. [DOI] [PMC free article] [PubMed] [Google Scholar]
- 34. Yeh C. J. G., Hsi B. L., and Page Faulk W., “Propidium Iodide as a Nuclear Marker in Immunofluorescence. II. Use With Cellular Identification and Viability Studies,” Journal of Immunological Methods 43, no. 3 (1981): 269–275. [DOI] [PubMed] [Google Scholar]
- 35. Zarrouk A., Nury T., Karym E. M., et al., “Attenuation of 7‐ketocholesterol‐induced Overproduction of Reactive Oxygen Species, Apoptosis, and Autophagy by Dimethyl Fumarate on 158N Murine Oligodendrocytes,” Journal of Steroid Biochemistry and Molecular Biology 169 (2017): 29–38. [DOI] [PubMed] [Google Scholar]
- 36. Lizard G., Fournel S., Genestier L., et al., “Kinetics of Plasma Membrane and Mitochondrial Alterations in Cells Undergoing Apoptosis,” Cytometry 21, no. 3 (1995): 275–283. [DOI] [PubMed] [Google Scholar]
- 37. Ragot K., Mackrill J. J., Zarrouk A., et al., “Absence of Correlation between Oxysterol Accumulation in Lipid Raft Microdomains, Calcium Increase, and Apoptosis Induction on 158N Murine Oligodendrocytes,” Biochemical Pharmacology 86, no. 1 (2013): 67–79. [DOI] [PubMed] [Google Scholar]
- 38. Singh R., Avliyakulov N. K., Braga M., et al. “Proteomic Identification of Mitochondrial Targets of Arginase in Human Breast Cancer,” PLoS ONE 8, no. 11 (2013): e79242. [DOI] [PMC free article] [PubMed] [Google Scholar]
- 39. Roci I., Watrous J. D., Lagerborg K. A., et al., “Mapping Metabolic Events in the Cancer Cell Cycle Reveals Arginine Catabolism in the Committed SG2M Phase,” Cell Reports 26, no. 7 (2019): 1691–1700.e5. [DOI] [PMC free article] [PubMed] [Google Scholar]
- 40. Shatanawi A. and Qasrawi H., “Arginase Inhibition Suppresses Breast Cancer Cell Proliferation,” FASEB Journal 31, no. S1 (2017): lb529‐lb529. [Google Scholar]
- 41. Vannini F., Kashfi K., and Nath N., “The Dual Role of iNOS in Cancer,” Redox Biology 6 (2015): 334–343. [DOI] [PMC free article] [PubMed] [Google Scholar]
- 42. Lacza Z., “Mitochondrial Nitric Oxide Synthase: Current Concepts and Controversies,” Frontiers in Bioscience 14 (2009): 4436–4443. [DOI] [PMC free article] [PubMed] [Google Scholar]
- 43. Topal G., Brunet A., Walch L., Boucher J. L., and David‐Dufilho M., “Mitochondrial Arginase II Modulates Nitric‐Oxide Synthesis through Nonfreely Exchangeable L‐Arginine Pools in Human Endothelial Cells,” Journal of Pharmacology and Experimental Therapeutics 318, no. 3 (2006): 1368–1374. [DOI] [PubMed] [Google Scholar]
- 44. Mintz J., Vedenko A., Rosete O., et al., “Current Advances of Nitric Oxide in Cancer and Anticancer Therapeutics,” Vaccines 9, no. 2 (2021): 94. [DOI] [PMC free article] [PubMed] [Google Scholar]
- 45. Sankaralingam S., Xu H., and Davidge S. T., “Arginase Contributes to Endothelial Cell Oxidative Stress in Response to Plasma From Women With Preeclampsia,” Cardiovascular Research 85, no. 1 (2010): 194–203. [DOI] [PubMed] [Google Scholar]
- 46. Yang Z. and Ming X. F., “Arginase: The Emerging Therapeutic Target for Vascular Oxidative Stress and Inflammation,” Frontiers in Immunology 4 (2013): 149. [DOI] [PMC free article] [PubMed] [Google Scholar]
- 47. Galadari S., Rahman A., Pallichankandy S., and Thayyullathil F., “Reactive Oxygen Species and Cancer Paradox: To Promote or to Suppress?,” Free Radical Biology and Medicine 104 (2017): 144–164. [DOI] [PubMed] [Google Scholar]
- 48. Redza‐Dutordoir M. and Averill‐Bates D. A., “Activation of Apoptosis Signalling Pathways by Reactive Oxygen Species,” Biochimica et Biophysica Acta (BBA) ‐ Molecular Cell Research 1863, no. 12 (2016): 2977–2992. [DOI] [PubMed] [Google Scholar]
- 49. El‐Osta H. and Circu M. L., “Mitochondrial ROS and Apoptosis,” in Mitochondrial Mechanisms of Degeneration and Repair in Parkinson's Disease, eds. Buhlman L. M.. Springer International Publishing, 2016, 1–23. [Google Scholar]
- 50. Circu M. L. and Aw T. Y., “Reactive Oxygen Species, Cellular Redox Systems, and Apoptosis,” Free Radical Biology and Medicine 48, no. 6 (2010): 749–762. [DOI] [PMC free article] [PubMed] [Google Scholar]
- 51. Marchi S., Giorgi C., Suski J. M., et al., “Mitochondria‐Ros Crosstalk in the Control of Cell Death and Aging,” Journal of Signal Transduction 2012 (2012): e329635. [DOI] [PMC free article] [PubMed] [Google Scholar]
- 52. Monier S., Samadi M., Prunet C., et al., “Impairment of the Cytotoxic and Oxidative Activities of 7β‐hydroxycholesterol and 7‐ketocholesterol by Esterification With Oleate,” Biochemical and Biophysical Research Communications 303, no. 3 (2003): 814–824. [DOI] [PubMed] [Google Scholar]
- 53. Dehghan S., Kheshtchin N., Hassannezhad S., and Soleimani M., “Cell Death Classification: A New Insight Based on Molecular Mechanisms,” Experimental Cell Research 433, no. 2 (2023): 113860. [DOI] [PubMed] [Google Scholar]
- 54. Jaouadi O., Limam I., Abdelkarim M., et al., “5,6‐Epoxycholesterol Isomers Induce Oxiapoptophagy in Myeloma Cells,” Cancers 13, no. 15 (2021): 3747. [DOI] [PMC free article] [PubMed] [Google Scholar]
- 55. Nury T., Zarrouk A., Yammine A., Mackrill J. J., Vejux A., and Lizard G., “Oxiapoptophagy: A Type of Cell Death Induced by Some Oxysterols,” British Journal of Pharmacology 178, no. 16 (2021): 3115–3123. [DOI] [PubMed] [Google Scholar]
- 56. Klionsky D. J., Abdel‐Aziz A. K., Abdelfatah S., et al., “Guidelines for the Use and Interpretation of Assays for Monitoring Autophagy (4th Edition),” Autophagy 17, no. 1 (2021): 1–382. [DOI] [PMC free article] [PubMed] [Google Scholar]
- 57. Porta C., Paglino C., and Mosca A., “Targeting PI3K/Akt/mTOR Signaling in Cancer,” Frontiers in Oncology 4 (2014): 64. [DOI] [PMC free article] [PubMed] [Google Scholar]
- 58. Lee H., Jeong A. J., and Ye S. K., “Highlighted STAT3 As a Potential Drug Target for Cancer Therapy,” BMB Reports 52, no. 7 (2019): 415–423. [DOI] [PMC free article] [PubMed] [Google Scholar]
- 59. Yue J. and López J. M., “Understanding MAPK Signaling Pathways in Apoptosis,” International Journal of Molecular Sciences 21, no. 7 (2020): 2346. [DOI] [PMC free article] [PubMed] [Google Scholar]
- 60. Adinew G. M., Messeha S. S., Taka E., Badisa R. B., Antonie L. M., and Soliman K. F. A., “Thymoquinone Alterations of the Apoptotic Gene Expressions and Cell Cycle Arrest in Genetically Distinct Triple‐Negative Breast Cancer Cells,” Nutrients 14, no. 10 (2022): 2120. [DOI] [PMC free article] [PubMed] [Google Scholar]
- 61. Adinew G., Messeha S. S., Badisa R., Taka E., and Soliman K. F. A., “Thymoquinone Anticancer Effects Through the Upregulation of NRF2 and the Downregulation of PD‐L1 in MDA‐MB‐231 Triple‐Negative Breast Cancer Cells,” FASEB Journal 36, no. S1 (2022): R2586. [DOI] [PubMed] [Google Scholar]
- 62. Ünal T. D., Hamurcu Z., Delibaşı N., et al., “Thymoquinone Inhibits Proliferation and Migration of MDA‐MB‐231 Triple Negative Breast Cancer Cells by Suppressing Autophagy, Beclin‐1 and LC3,” Anti‐Cancer Agents in Medicinal Chemistry 21, no. 3 (2021): 355–364. [DOI] [PubMed] [Google Scholar]
- 63. Adinew G. M., Taka E., Mochona B., et al., “Therapeutic Potential of Thymoquinone in Triple‐Negative Breast Cancer Prevention and Progression Through the Modulation of the Tumor Microenvironment,” Nutrients 14, no. 1 (2021): 79. [DOI] [PMC free article] [PubMed] [Google Scholar]
Associated Data
This section collects any data citations, data availability statements, or supplementary materials included in this article.
Supplementary Materials
Supporting information.
Data Availability Statement
The data that support the findings of this study are available from the corresponding author upon reasonable request.