

ABSTRACT
Background
Disorders of gut–brain interaction (DGBI) predominate in women, but little is known about sex differences in menses‐related or menopause symptoms.
Methods
Using data from the Rome Foundation Global Epidemiology Survey, we assessed Rome IV DGBI symptoms in individuals in 26 countries who met criteria for ≥ 1 of 5 DGBI: irritable bowel syndrome (IBS), functional dyspepsia (FD), functional constipation (FC), functional diarrhea (FDr), or functional bloating (FB). Participants included pre‐ and post‐menopausal women with DGBI and age‐matched men. Odds ratios estimated sex and age differences for symptom by sex or pre‐ vs. post‐menopause in logistic regression; standardized mean difference (SMD) provided effect sizes.
Key Results
14,570 participants met criteria for ≥ 1 of the 5 DGBI. Women exceeded men in most symptoms. In FD, women stopped eating due to early satiety more than men (11.1 vs. 8.9 days/month, SMD 0.21). Symptoms were generally increased in premenopausal women and younger men compared to older counterparts; however, only premenopausal IBS, FD, and FC women reported increased constipation‐associated symptoms. Compared to premenopausal women, postmenopausal women had increased accidental stool leakage in IBS and FDr, and increased digital manual maneuvers in FC (18% vs. 25% frequency, SMD −0.25). IBS and FD had the most menses‐associated symptoms.
Conclusions and Inferences
Women had higher symptom frequency across the 5 DGBI compared to men. Our findings suggest that premenopausal women have greater visceral perception than postmenopausal women, although increased outlet symptoms in postmenopausal women indicate greater anorectal/pelvic dysfunction. While age alone has some influence on symptoms, female sex hormones may also increase visceral perception.
Keywords: Bloating, Chronic constipation, Disorders of gut–brain interaction, Functional dyspepsia, Gonadal Steroid Hormones, Irritable bowel syndrome, Postmenopause, Premenopause, Sex Characteristics, Visceral Hypersensitivity
Our global epidemiology study shows symptom differences within the five most common DGBI based on sex, menopause, age, and menses. Sex hormone‐mediated effects may contribute to greater symptom burden in women than men with DGBI.

Summary.
Our global epidemiological study showed sex differences in individual disorders of gut–brain interaction (DGBI) symptoms, where women experienced higher prevalence in the vast majority of symptoms.
This may indicate sex‐specific abnormal regulation in women that increases symptoms compared to men.
We found that both premenopausal women and comparably aged younger men tended to have greater symptom burden compared to their older counterparts, which supports that there is an age effect on DGBI symptoms that is possibly independent of sex.
Some indicators of visceral perception were increased in premenopausal women compared to postmenopausal women, and others of outlet dysfunction were increased in postmenopausal compared to premenopausal women, both of which differences were not shared by men.
This, together with our finding that menses‐related symptoms tend to be most bothersome and most comorbid in pain‐predominant DGBI (irritable bowel syndrome and functional dyspepsia), suggests that sex hormone‐mediated effects on visceral perception and GI function may contribute to a greater symptom burden in women than men with DGBI.
1. Introduction
Disorders of gut–brain interaction (DGBI) are conditions characterized by gastrointestinal (GI) symptoms related to alterations in motility, visceral sensitivity, microbiome, mucosal and immune function, and central nervous system processing [1]. Female sex has been well established as a risk factor for most DGBI, including irritable bowel syndrome (IBS), functional constipation (FC), and postprandial distress syndrome [2, 3, 4]. However, we do not yet have a comprehensive understanding of how sex is related to individual diagnoses and symptom patterns.
Sex hormones have modulatory influences on gut motility, gut microbiome, visceral perception, and stress responsiveness [5], but their role in the pathophysiology and symptom presentation in DGBI is not well understood. Furthermore, there is limited data on the effects of menstrual cycle phase and menopausal status on these mechanisms and symptoms of DGBI. In IBS, menopause is associated with increased overall IBS symptom severity compared to premenopause, and no similar effect was seen between comparably aged men with IBS [6]. However, most DGBI symptoms decrease in individuals 65 and older [7, 8]; although sex and menopause differences in these changes have not been assessed. Menses has been associated with increased visceral sensitivity in women with IBS but not healthy women [9], and increased GI symptoms in patients with IBS [10] and functional dyspepsia (FD) [11]. However, the association of menses‐related symptoms and individual DGBI diagnoses in the global population has not been well studied. There is a clear gap in the literature regarding sex‐, menopause‐, and menses‐related symptom differences among DGBI.
The Rome Foundation Global Epidemiology Study (RFGES) has examined a host of epidemiological factors associated with DGBI on a global scale [12], yet the analyses have not specifically quantified sex differences in individual symptoms, nor have they examined differences in pre‐ and post‐menopausal women. The rigorous and comprehensive database of the RFGES facilitates the assessment of these sex and menopausal state differences across the global DGBI population. Studying sex‐ and menopause‐related differences in DGBI across the globe will help increase our understanding of the epidemiology and potential risk factors for these common disorders which significantly impact health‐related quality of life [13, 14, 15, 16]. This information can also have applicability to the clinical management of DGBI across a patient's lifetime.
The primary aims of the study were to: (1) assess sex differences in the frequency of individual DGBI symptoms, specifically within the five most common DGBI [12], i.e., IBS, FD, FC, functional diarrhea (FDr), and functional abdominal bloating and distention (FB); (2) compare the frequencies of individual DGBI symptoms in pre‐ and postmenopausal women within the aforementioned DGBI, with similarly aged men serving as comparisons; and (3) evaluate the prevalence of menses‐related symptoms across these DGBI. Our hypotheses included that the DGBI symptoms would differ by sex, where women would experience more pain, bloating, and constipation‐associated symptoms compared to men, while men would have more urgency and diarrhea‐associated symptoms compared to women. We hypothesized that postmenopausal women would have increased DGBI symptoms compared to premenopausal women without the same difference in men, and that menses‐associated symptoms would be worst in abdominal pain‐related DGBI, that is, IBS and FD.
Some results described in this study have been published previously in RFGES papers, especially the initial study by Sperber et al. [12]. However, those results were general and descriptive only, whereas in this study, we present in‐depth analyses relating to the specific issue of sex differences and menses‐ and menopause‐related symptoms in DGBI. This assessment can inform future studies of pathophysiology as well as approaches to communication with patients and their treatment.
2. Materials and Methods
2.1. Online Survey
The methodology of the RFGES has been described in prior literature [12]. In brief, the study recruited 54,127 participants from 26 countries who completed an Internet survey over a 1‐year period in 2017 and 2018. Participants were invited to partake using quota‐based sampling with a minimum of 2000 participants per country, with equal numbers of men and women, and distributed 40% among ages 18–39, 40% among ages 40–64, and 20% for ages ≥ 65. To minimize selection bias, participants were invited to a “health survey” without mention of any gastrointestinal context. The survey had multiple quality checks embedded into the questionnaire resulting in high‐quality and reliable data [17, 18, 19]. The participants were recruited by a global market survey company (Qualtrics LLC), as described in prior articles [12, 20]. Although no monetary compensation was provided, they received points from Qualtrics Inc. that they could use as shopping credits. All procedures performed were in keeping with the ethical standards of the institutional or national research committees and with the 1964 Declaration of Helsinki or comparable ethical standards.
The participants included in the analyses could have multiple, “overlapping” DGBI, meaning more than one DGBI diagnosis. The reason for this was that excluding these “overlap” participants may have led to bias towards patients with less severe disease [21]; and neglect of a large proportion (roughly one‐third) of individuals with DGBI that have overlapping diagnoses [17, 22]. Individuals who reported having been diagnosed with structural GI disorders, such as inflammatory bowel disease, celiac disease, etc. were included in the denominator for prevalence calculations but excluded from the numerator even if they met diagnostic criteria for a DGBI.
The survey included the Rome IV Diagnostic Questionnaire for Adults, which examines the presence and frequency of GI symptoms that are required to define the Rome IV DGBI [23]. The participants who asserted that they had certain chronic GI and other diseases that might contribute to symptoms seen in DGBI (including celiac disease, peptic ulcer disease, inflammatory bowel disease, diverticulitis, cancer anywhere in the GI tract, or bowel resection) were excluded. The survey also included sociodemographic variables, the Patient Health Questionnaire (PHQ)‐15 and PHQ‐12 without the three GI symptoms [24, 25] measuring overall non‐GI somatic symptom severity, measures of anxiety/depression (PHQ‐4, scale of 0–12) [26], the Patient‐Reported Outcomes Measurement Information System Global‐10 questionnaire (PROMIS Global‐10), a quality of life metric that produces a mental and physical quality of life domain each with values from 4 to 20 [27], the IBS Severity Scoring System (IBS‐SSS) [28],, and questions about health concerns, medications, and surgical history [17, 18].
2.2. Data and Statistical Analysis
We compared women and men who met criteria for the five DGBI for our general sex differences analyses. For each DGBI, we included all participants with the diagnosis, including those with coexistent (overlapping) DGBI; separately, we accounted for individuals with only one DGBI (no overlap). For the menopause analyses, we divided the DGBI women into pre‐ and post‐menopausal groups, where the latter were defined as women ≥ 50 years old or women < 50 who reported they had been through menopause, and the rest of the women were defined as pre‐menopausal. We compared men ≥ 50 and < 50 with the five DGBI. The prevalence of the five DGBI, symptom frequency of all items from the Rome IV questionnaire that comprised criteria for all DGBI diagnoses that had answers in Likert scales of days per month or % of time, and demographic information, were compared between the sexes and between the age groups. Differences were estimated by odds ratios (OR) and 95% confidence intervals (95% CI) with each DGBI symptom as the independent variable and sex or pre‐ vs. post‐menopause as the dependent variable in logistic regression models. Psychological metrics, somatic symptom severity measures, health concerns, and quality of life, were compared between the sexes and between the age groups (see Appendix S1). In terms of interpreting OR for continuous independent variables in logistic regression models, the odds of having the outcome increase by the reported OR for each unit in the dependent variable. For example, in a logistic regression model with abdominal pain on a 8‐point Likert scale as the independent variable, which has an OR of 1.09, the odds of having the outcome (e.g., female sex) will increase by 1.09 for each unit in the abdominal pain variable. Standardized mean difference (SMD) was calculated to provide a standardized effect size of differences; for all comparisons, all Rome IV criteria questions for the specified DGBI were included in our results. In the pre‐ vs. post‐menopause and age‐matched men analyses, beyond these Rome IV criteria questions, any comparison between pre‐ and post‐menopausal women that yielded a SMD ≥ 0.2 (where SMD values of < 0.5 are considered small, 0.5–0.8 are considered medium, and > 0.8 are considered large differences [29]) was also reported. Within the premenopausal women group, we reported the proportions of women who experienced varying levels of bothersomeness of menses‐associated symptoms.
3. Results
3.1. Participants and Demographics
Participant characteristics are summarized in Table 1. There were 14,570 individuals who met criteria for one or more of the five main DGBI (IBS, FD, FC, FDr, and FB). Individuals with IBS (73%) and FD (73%) had higher rates of overlapping DGBI compared to FC (34%), FDr (40%), and FB (28%). Sixty percent of participants were women. Women were more prevalent across the five DGBI than men except for FDr. Younger women and men had a higher prevalence of the five DGBI compared to their older counterparts. FC was the most prevalent of the five DGBI across sex and age groups.
TABLE 1.
Distribution of Gender, menopausal status, and age‐matched men in five selected major DGBI.
| Women, n (%) | Pre‐menopausal women, n (%) | Post‐menopausal women, n (%) | Men, n (%) | Men < 50, n (%) | Men ≥ 50, n (%) | Total, n (%) | ||
|---|---|---|---|---|---|---|---|---|
| Age, mean (95% CI) | 45.7 (45.5, 45.9) | 33.2 (33.1, 33.4) | 61.0 (60.9, 61.2) | 42.9 (42.7, 43.1) | 34.23 (34.1, 34.4) | 62.8 (62.6, 62.9) | N/A | |
| IBS | All | 1390 (63) | 1065 (48.5) | 325 (14.8) | 805 (37) | 604 (27.5) | 201 (9.2) | 2195 |
| Proportion with overlap | 1011 (73) | 766 (72) | 245 (75) | 640 (80) | 477 (79) | 163 (81) | 1651 (75) | |
| FD | All | 2320 (59.3) | 1693 (43.3) | 627 (16.0) | 1580 (40.8) | 1171 (29.9) | 419 (10.7) | 3910 |
| Proportion with overlap | 1688 (73) | 1226 (72) | 462 (74) | 1141 (72) | 826 (71) | 315 (75) | 2829 (72) | |
| FC | All | 4049 (63.9) | 2833 (44.7) | 1216 (19.2) | 2284 (36.1) | 1439 (22.7) | 845 (13.3) | 6333 |
| Proportion with overlap | 1380 (34) | 951 (34) | 429 (35) | 780 (34) | 521 (36) | 259 (31) | 2160 (34) | |
| FDr | All | 1082 (42.5) | 674 (26.5) | 408 (16.0) | 1465 (57.5) | 939 (36.9) | 526 (20.7) | 2547 |
| Proportion with overlap | 435 (40) | 266 (39) | 169 (41) | 493 (34) | 326 (35) | 167 (32) | 928 (36) | |
| FB | All | 1080 (65.1) | 737 (44.5) | 343 (20.7) | 578 (34.9) | 360 (21.7) | 218 (13.1) | 1658 |
| Proportion with overlap | 298 (28) | 193 (26) | 105 (31) | 167 (29) | 112 (31) | 55 (25) | 465 (28) | |
Note: Each row represents the individuals within the specified gender‐age group for each DGBI, and the percentage (%) of the overall DGBI group comprised by that group. In the Age row, 95% confidence interval ranges are provided in parentheses. “Proportion with overlap” represents the individuals who have additional overlapping DGBI, as a percentage (%) of that group.
Abbreviations: DGBI = disorder of gut‐brain interaction; IBS = irritable bowel syndrome; FD = functional dyspepsia; FC = functional constipation; FDr = functional diarrhea; FB = functional bloating and distension.
3.2. Diagnostic DGBI Symptoms
3.2.1. Sex Differences
DGBI symptoms comprising the diagnostic criteria for each of the five DGBI were compared between women and men (Table 2, Figure 1). In IBS, women had increased stool change with pain compared to men (65% vs. 62%, SMD 0.13 [95% CI 0.04, 0.21], Figure 1A) though these differences were small. In FD, days per month with early satiety (inability to finish a normal‐size meal) were higher in women compared to men (11.1 vs. 8.9, SMD 0.21 [95% CI 0.15, 0.27], Figure 1B). Women had higher symptom frequency for all FC symptoms compared to men, with the most prominent difference being percent of bowel movements with “hard stools,” (42% vs. 34%, SMD 0.30 [95% CI 0.24, 0.35], Figure 1C). Women had a slightly higher proportion of loose or watery stools in FDr than men (59% vs. 56%, SMD 0.12 [95% CI 0.04, 0.20], Figure 1D). In FB, women had more days per month of bloating compared to men (14.8 vs. 11.9, SMD 0.27 [95% CI 0.17, 0.37], Figure 1E). Women had increased anxiety, somatic symptoms, and worse mental and physical quality of life compared to men in the five DGBI (Table S1A). In IBS participants, IBS‐SSS scores were higher in women compared to men (254.5 vs. 237.3, SMD 0.17 [95% CI 0.08, 0.25], Table S1A). Sex differences were similar in the non‐overlapping analysis (Table S2).
TABLE 2.
Sex differences in diagnostic symptoms in the five main DGBI.
| DGBI | DGBI Symptom | Gender | SMD (95% CI) | OR (95% CI) | |
|---|---|---|---|---|---|
| IBS | Women (N = 1390) | Men (N = 805) | |||
| Pain anywhere in abdomen (days/month) | 12.9 (12.3, 13.5) | 12.0 (11.3, 12.8) | 0.08 (0.00, 0.17) | 1.01 (1, 1.02) | |
| Pain close to BM (% of time) | 59% (58, 60) | 57% (55, 59) | 0.08 (−0.01, 0.16) | 1.03 (1, 1.07) | |
| Stool change w/ pain (% of time) | 65% (64, 66) | 62% (60, 64) | 0.13 (0.04, 0.21) | 1.06 (1.02, 1.1) | |
| BM frequency change w/ pain (% of time) | 59% (58. 60) | 58% (56, 60) | 0.05 (−0.04, 0.13) | 1.02 (0.98, 1.05) | |
| FD | Women (N = 2320) | Men (N = 1590) | |||
| Early satiety activity interference (days/month) | 11.9 (11.4, 12.3) | 12.0 (11.5, 12.6) | −0.01 (−0.08, 0.05) | 1 (0.99, 1) | |
| Early satiety can't finish meal (days/month) | 11.1 (10.7, 11.6) | 8.9 (8.4, 9.4) | 0.21 (0.15, 0.27) | 1.02 (1.01, 1.03) | |
| Pain/burning in mid/upper abdomen (days/month) | 4.6 (4.3, 4.9) | 4.7 (4.3, 5.1) | −0.01 (−0.08, 0.05) | 1 (0.99, 1.01) | |
| FC | Women (N = 4049) | Men (N = 2284) | |||
| Hard stools (% of time) | 42% (41, 43) | 34% (33, 35) | 0.30 (0.24, 0.35) | 1.11 (1.09, 1.13) | |
| < 3 BM per week (% of time) | 39% (38, 40) | 31% (30, 33) | 0.23 (0.18, 0.28) | 1.07 (1.05, 1.08) | |
| Straining (% of time) | 55% (54. 55) | 50% (49. 51) | 0.19 (0.14, 0.24) | 1.08 (1.06, 1.1) | |
| Incomplete emptying (% of time) | 51% (50, 52) | 47% (46, 48) | 0.16 (0.11, 0.21) | 1.06 (1.04, 1.08) | |
| Blocked stool (% of time) | 47% (46, 47) | 41% (40, 42) | 0.22 (0.17, 0.27) | 1.09 (1.07, 1.11) | |
| Manual maneuvers (% of time) | 20% (19, 21) | 16% (15, 17) | 0.15 (0.10, 0.20) | 1.06 (1.04, 1.08) | |
| FDr | Women (N = 1082) | Men (N = 1465) | |||
| Loose stools (% of time) | 59% (57. 60) | 56% (55. 57) | 0.12 (0.04, 0.20) | 1.05 (1.02, 1.09) | |
| FB | Women (N = 1080) | Men (N = 578) | |||
| Bloating frequency (days/month) | 14.8 (14.1. 15.4) | 11.9 (11.1. 12.7) | 0.27 (0.17, 0.37) | 1.03 (1.02, 1.04) | |
Note: Percentage of time or days per month with the specified DGBI symptoms. Women and men were compared. 95% confidence interval ranges are provided in parentheses. Bold denotes confidence intervals for SMD that do not cross zero, and for OR that do not cross 1.
Abbreviations: BM = bowel movements; CI = confidence interval; DGBI = disorder of gut‐brain interaction; FB = functional bloating and distension; FD = functional dyspepsia; FC = functional constipation; FDr = functional diarrhea; IBS = irritable bowel syndrome; OR = odds ratio; SMD = standardized mean difference, where > 0.2 was considered prominent difference.
FIGURE 1.
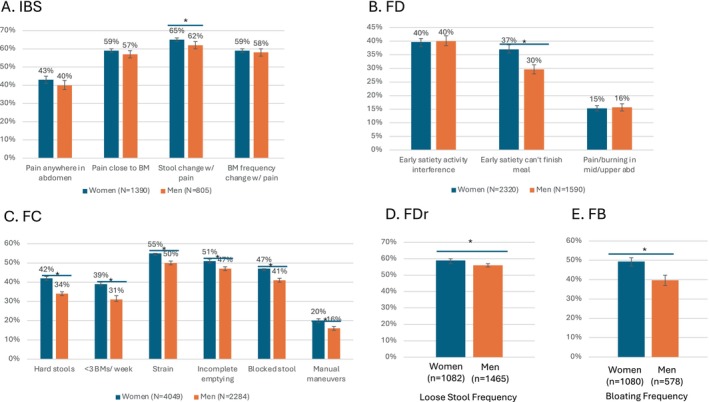
Prominent Symptom Differences Between Women and Men across 5 Main DGBI. (A) IBS, (B) FD, (C) FC, (D) FDr, (E) FB. Percentage of time with the specified DGBI symptoms, where days per month (where applicable) were divided by 30 to approximate percentage of time to standardize units for graphing purposes. “*” denotes non‐overlapping 95% confidence interval bars between the groups thereunder. BM = bowel movement. (A) IBS, (B) FD, (C) FC, (D) FDr, and (E) FB.
3.2.2. Menopausal Status
DGBI symptom differences for each of the five DGBI between pre‐ and postmenopausal women and similarly aged men are represented in Table 3 and Figure 2. There were no differences in the criteria symptoms for the five DGBI except for FC, in which hard stools, infrequent stools (< 3 bowel movements (BMs) per week) and sensation of blocked stool were more frequent in pre‐ compared to postmenopausal women but not in younger vs. older men (Figure 2C). Constipation‐associated “outlet” symptom differences were also increased in pre‐ vs. postmenopausal women with IBS (straining, incomplete emptying, and blocked stool) and FD (straining and blocked stool) but not in the age‐matched men. Similar constipation‐associated symptoms were more frequent in both younger women and younger men with FDr (straining and blocked stool) or FB (hard stools, straining, incomplete emptying, and blocked stool), though the frequencies of these symptoms were lower than in IBS, FD, and FC. Across the five DGBI, most non‐criteria GI symptoms at least trended towards higher levels in the younger age groups (for both women and men). However, there were notable exceptions. Manual maneuvers for defecation, accidental stool leakage, and heartburn symptoms were increased in post‐ compared to premenopausal women with FC, IBS, and FDr and FD, respectively, but this difference was not seen among men (Figure 2A–D). IBS symptom severity did not differ between age‐gender groups (Table S1B). Across the five DGBI, anxiety and depression tended to be more frequent in the younger women and men compared to the older age groups (Table S1B,C). Mental quality of life scores were similar between the older and the younger age groups, but tended to be worse in the younger age groups in non‐pain predominant DGBI (FC, FDr, and FB) although differences were small. However, physical quality of life was better in the younger age groups than older groups across the DGBI (Table S1B,C).
TABLE 3.
Symptom differences in DGBI between pre‐ and post‐menopausal women and age‐matched men.
| A. IBS | DGBI Symptom | Pre‐menopausal women (N = 1065) | Post‐menopausal women (N = 325) | SMD | OR | Men < 50 (N = 604) | Men ≥ 50 (N = 201) | SMD | OR |
|---|---|---|---|---|---|---|---|---|---|
| Pain anywhere in abdomen (% of time) | 13.0 (12.3, 13.7) | 12.6 (11.6, 13.6) | 0.04 (−0.09, 0.16) | 1 (0.99, 1.02) | 12.1 (11.2, 13.0) | 11.8 (10.5, 13.2) | 0.03 (−0.13, 0.18) | 1 (0.99, 1.02) | |
| Pain close to BM (% of time) | 59 (58, 61) | 58 (55, 61) | 0.04 (−0.08, 0.17) | 1.02 (0.97, 1.07) | 57 (55, 59) | 57 (53, 60) | 0.01 (−0.15, 0.17) | 1.01 (0.94, 1.07) | |
| Stool change w/ pain (% of time) | 65 (64, 67) | 64 (61, 66) | 0.08 (−0.04, 0.20) | 1.03 (0.98, 1.09) | 62 (61, 64) | 61 (58, 64) | 0.08 (−0.07, 0.24) | 1.04 (0.97, 1.12) | |
| BM frequency change w/ pain (% of time) | 59 (58, 61) | 59 (56, 61) | 0.02 (−0.10, 0.14) | 1.01 (0.96, 1.06) | 59 (57, 61) | 56 (53, 60) | 0.10 (−0.06, 0.26) | 1.04 (0.97, 1.11) | |
| Strain (% of time) | 52 (50, 54) | 45 (41, 48) | 0.23 (0.10, 0.35) | 1.08 (1.03, 1.12) | 48 (46, 50) | 47 (42. 51) | 0.04 (−0.12, 0.20) | 1.01 (0.96, 1.07) | |
| Incomplete emptying (% of time) | 57 (55, 59) | 51 (48, 54) | 0.20 (0.07, 0.32) | 1.07 (1.02, 1.12) | 55 (53, 57) | 51 (47, 56) | 0.13 (−0.03, 0.29) | 1.05 (0.99, 1.11) | |
| Blocked stool (% of time) | 48 (46, 50) | 40 (36, 43) | 0.26 (0.14, 0.39) | 1.09 (1.05, 1.13) | 44 (42, 47) | 41 (37, 45) | 0.11 (−0.05, 0.27) | 1.04 (0.98, 1.09) | |
| Accidental leakage (days per month) | 0.6 (0.4, 0.8) | 1.4 (0.9, 1.8) | −0.24 (−0.36, −0.11) | 0.94 (0.9, 0.97) | 2.8 (2.1, 3.5) | 1.8 (0.9, 2.6) | 0.13 (−0.03, 0.29) | 1.02 (1, 1.05) |
| B. FD | DGBI Symptom | Pre‐menopausal women (N = 1693) | Post‐menopausal Women (N = 627) | SMD (95% CI) | OR (95% CI) | Men < 50 (N = 1171) | Men ≥ 50 (N = 419) | SMD | OR |
|---|---|---|---|---|---|---|---|---|---|
| Early satiety activity interference (days per month) | 11.9 (11.4, 12.5) | 11.7 (10.8, 12.6) | 0.02 (−0.07, 0.11) | 1 (0.99, 1.01) | 12.3 (11.7, 13.0) | 11.2 (10.2, 12.2) | 0.10 (−0.01, 0.21) | 1.01 (1, 1.02) | |
| Early satiety can't finish meal (days per month) | 11 (10.5, 11.5) | 11.6 (10.7, 12.4) | −0.05 (−0.14, 0.04) | 1 (0.99, 1) | 9.2 (8.6, 9.8) | 8.2 (7.2, 9.1) | 0.10 (−0.01, 0.21) | 1.01 (1, 1.02) | |
| Pain/burning in mid/upper abdomen (days per month) | 4.5 (4.1, 4.9) | 4.9 (4.2, 5.5) | −0.05 (−0.14, 0.04) | 0.99 (0.98, 1.01) | 5 (4.5, 5.5) | 3.8 (3.2, 4.4) | 0.15 (0.04, 0.26) | 1.02 (1.01, 1.04) | |
| Nausea interference (days per month) | 3.8 (3.5, 4.2) | 3.1 (2.6, 3.7) | 0.09 (0.00, 0.18) | 1.01 (1, 1.03) | 3.5 (3.0, 3.9) | 1.9 (1.5, 2.4) | 0.21 (0.10, 0.33) | 1.04 (1.02, 1.07) | |
| Vomit (days per month) | 1.7 (1.4, 1.9) | 1.3 (1.0, 1.6) | 0.07 (−0.02, 0.17) | 1.02 (1, 1.04) | 2.1 (1.7, 2.5) | 0.9 (0.6, 1.2) | 0.19 (0.08, 0.30) | 1.06 (1.02, 1.1) | |
| Strain (% of time) | 44 (43, 46) | 37 (35, 40) | 0.22 (0.13, 0.31) | 1.07 (1.04, 1.1) | 37 (35, 38) | 37 (34, 40) | −0.01 (−0.12, 0.10) | 1 (0.96, 1.03) | |
| Blocked stool (% of time) | 41 (40, 43) | 34 (31, 36) | 0.24 (0.15, 0.34) | 1.08 (1.05, 1.12) | 34 (33, 36) | 32 (29, 35) | 0.08 (−0.03, 0.19) | 1.03 (0.99, 1.07) |
| C. FC | DGBI Symptom | Pre‐menopausal women (N = 2833) | Post‐menopausal women (N = 1216) | SMD | OR | Men < 50 (N = 1439) | Men ≥ 50 (N = 845) | SMD | OR |
|---|---|---|---|---|---|---|---|---|---|
| Hard stools (% of time) | 43 (42, 44) | 40 (39, 42) | 0.09 (0.02, 0.16) | 1.03 (1.01, 1.06) | 34 (32, 35) | 34 (32, 36) | −0.02 (−0.10, 0.07) | 0.99 (0.96, 1.03) | |
| < 3 BM per week (% of time) | 41 (39, 42) | 36 (34, 38) | 0.13 (0.06, 0.20) | 1.04 (1.02, 1.06) | 31 (30, 33) | 31 (29, 33) | 0.01 (−0.07, 0.10) | 1 (0.98, 1.03) | |
| Strain (% of time) | 55 (54, 56) | 54 (53, 56) | 0.01 (−0.06, 0.08) | 1 (0.98, 1.03) | 47 (46, 49) | 54 (52, 55) | −0.24 (−0.33, −0.16) | 0.91 (0.88, 0.94) | |
| Incomplete emptying (% of time) | 52 (51, 53) | 49 (47, 50) | 0.12 (0.05, 0.19) | 1.05 (1.02, 1.07) | 49 (47, 50) | 44 (42, 46) | 0.18 (0.10, 0.27) | 1.08 (1.04, 1.11) | |
| Blocked stool (% of time) | 47 (46, 48) | 45 (43, 46) | 0.09 (0.02, 0.16) | 1.03 (1.01, 1.06) | 41 (40, 43) | 40 (39, 42) | 0.04 (−0.04, 0.13) | 1.02 (0.98, 1.05) | |
| Manual maneuvers (% of time) | 18 (17, 19) | 25 (23, 26) | −0.25 (−0.32, −0.18) | 0.92 (0.9, 0.94) | 16 (14, 17) | 16 (15, 18) | −0.03 (−0.11, 0.06) | 0.99 (0.96, 1.02) |
| D. FDr | DGBI Symptom | Pre‐menopausal women (N = 674) | Post‐menopausal women (N = 408) | SMD | OR | Men < 50 (N = 939) | Men ≥ 50 (N = 526) | SMD | OR |
|---|---|---|---|---|---|---|---|---|---|
| Loose stools (% of time) | 58 (56, 60) | 59 (57, 61) | −0.06 (−0.18, 0.06) | 0.97 (0.92, 1.03) | 55 (54, 56) | 58 (56, 60) | −0.11 (−0.22, −0.01) | 0.95 (0.9, 1) | |
| Accidental leakage (days/month) | 0.5 (0.3, 0.7) | 1.3 (0.9, 1.7) | −0.26 (−0.38, −0.14) | 0.9 (0.85, 0.95) | 0.4 (0.3, 0.6) | 0.7 (0.5, 0.9) | −0.11 (−0.21, 0.00) | 0.95 (0.9, 1) | |
| Heartburn (days/month) | 2.2 (1.8, 2.5) | 3.6 (2.9, 4.3) | −0.25 (−0.37, −0.13) | 0.96 (0.94, 0.98) | 2.6 (2.3, 3.0) | 2.3 (1.9, 2.7) | 0.07 (−0.04, 0.17) | 1.01 (0.99, 1.04) | |
| Strain (% of time) | 24 (22, 26) | 17 (15, 19) | 0.30 (0.18, 0.43) | 1.15 (1.08, 1.21) | 22 (21, 24) | 15 (14, 17) | 0.31 (0.20, 0.41) | 1.16 (1.1, 1.22) | |
| Blocked stool (% of time) | 20 (19, 22) | 14 (12, 16) | 0.27 (0.15, 0.40) | 1.14 (1.07, 1.21) | 18 (17, 20) | 12 (10, 13) | 0.31 (0.21, 0.42) | 1.18 (1.11, 1.25) |
| E. FB | DGBI Symptom | Pre‐menopausal women (N = 737) | Post‐menopausal women (N = 343) | SMD | OR | Men < 50 (N = 360) | Men ≥ 50 (N = 218) | SMD | OR |
|---|---|---|---|---|---|---|---|---|---|
| Bloating frequency (days/month) | 14.8 (14.0, 15.6) | 14.7 (13.4, 15.9) | 0.01 (−0.12, 0.14) | 1 (0.99, 1.01) | 11.6 (10.6, 12.6) | 12.4 (11.1, 13.7) | −0.08 (−0.25, 0.09) | 0.99 (0.97, 1.01) | |
| Hard stools (% of time) | 21 (19, 22) | 14 (12, 16) | 0.32 (0.19, 0.44) | 1.18 (1.1, 1.26) | 19 (17, 21) | 12 (10, 15) | 0.33 (0.16, 0.49) | 1.19 (1.09, 1.32) | |
| Strain (% of time) | 25 (23, 26) | 19 (16, 21) | 0.25 (0.13, 0.38) | 1.13 (1.06, 1.2) | 25 (22, 27) | 17 (14, 20) | 0.33 (0.16, 0.50) | 1.17 (1.08, 1.27) | |
| Incomplete emptying (% of time) | 31 (29, 33) | 24 (21, 26) | 0.26 (0.13, 0.39) | 1.11 (1.05, 1.17) | 32 (29, 34) | 20 (17, 23) | 0.48 (0.31, 0.65) | 1.23 (1.14, 1.34) | |
| Blocked stool (% of time) | 23 (21, 24) | 15 (13, 17) | 0.31 (0.18, 0.44) | 1.16 (1.09, 1.24) | 19 (16, 21) | 12 (10, 15) | 0.29 (0.12, 0.46) | 1.17 (1.07, 1.28) | |
| Loose stools (% of time) | 25 (23, 27) | 19 (17, 22) | 0.22 (0.09, 0.35) | 1.1 (1.04, 1.16 | 23 (21, 26) | 19 (16, 22) | 0.19 (0.02, 0.36) | 1.09 (1.01, 1.17) |
Note: Percentage of time or days per month with the specified DGBI symptoms. Pre‐ and post‐menopausal women were compared, with differences between similarly‐aged men as a comparison. 95% confidence interval ranges are provided in parentheses. Bold denotes statistically significant difference between the groups. DGBI = disorder of gut‐brain interaction. Bold denotes confidence intervals for SMD that do not cross zero, and for OR that do not cross 1.
Abbreviations: BM = bowel movements; CI = confidence interval; FB = functional bloating; FC = functional constipation; FD = functional dyspepsia; FDr = functional diarrhea; IBS = irritable bowel syndrome; OR = odds ratio; SMD = standardized mean difference, where > 0.2 was considered prominent difference.
FIGURE 2.
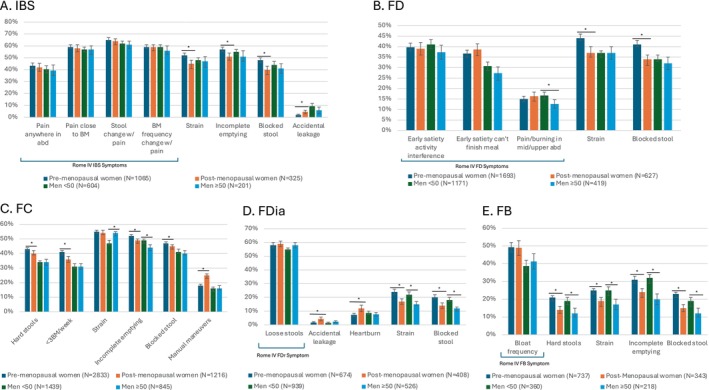
Prominent Symptom Differences Between Pre‐ and Post‐Menopausal Women with Age‐Matched Men as a Comparison Group across 5 Main DGBI. (A) IBS, (B) FD, (C) FC, (D) FDr, (E) FB. Percentage of time with the specified DGBI symptoms, where days per month (where applicable) were divided by 30 to approximate percentage of time to standardize units for graphing purposes. Pre‐ and post‐menopausal women were compared, with differences between similarly‐aged men as a comparison. “*” denotes non‐overlapping confidence interval bars between the groups thereunder. Outside of Rome IV symptoms, any symptom where the pre‐ vs. post‐menopausal groups had SMD ≥ 0.2 was reported. Rome IV symptoms are contained in a bracket if additional non‐Rome symptoms were reported. BM = bowel movement.
3.2.3. Menses‐Related Symptoms
Menses‐related symptoms in premenopausal women across the five DGBI are described in Table 4 and Figure 3, which show that participants with IBS and FD had the highest burden of menses‐associated symptoms. IBS and FD women reported abdominal pain getting worse with menses (65% and 46% of the time, respectively), that they were bothered a lot by menstrual cramps (46% and 40%, respectively), and that they were “bothered a lot” by dyspareunia (7.7% and 7.9%, respectively), at higher frequencies than in FC, FDr, and FB (Table 4, Figure 3A). Increasing levels of bothersomeness of menstrual cramps and dyspareunia increased the odds of being diagnosed with more than one (overlapping) DGBI, with an odds ratio of 2.38 with "bothered a lot" by menstrual cramps, and an odds ratio of 2.47 with “bothered a lot” by dyspareunia (Table S3, Figure 3B).
TABLE 4.
Comparison of menses‐associated symptoms across DGBI.
| Characteristic | IBS (N = 1065) | FD (N = 1693) | FC (N = 2833) | FDr (N = 674) | FB (N = 737) |
|---|---|---|---|---|---|
| DGBI pain worse with menses, % of time | 65% (63, 67) | 57% (55, 59) | 47% (45, 49) | 46% (43, 49) | 45% (42, 48) |
| “Bothered a lot” by menstrual cramps | 46% (43, 49) | 40% (38, 43) | 28% (26, 29) | 25% (22, 28) | 23% (20, 27) |
| “Bothered a lot” by Dyspareunia | 7.7% (6.2, 9.5) | 7.9% (6.7, 9.3) | 4.3% (3.6, 5.2) | 3.6% (2.3, 5.3) | 3.3% (2.1, 4.9) |
Note: “DGBI pain worse with menses” signifies % of menses time with pain over the last 3 months. The menstrual cramp and dyspareunia characteristics signify the % of the DGBI group who reported they were bothered a lot by these symptoms over the past 4 weeks. 95% confidence interval ranges are provided in parentheses.
Abbreviations: DGBI = disorder of gut‐brain interaction; FB = functional bloating and distension; FC = functional constipation; FD = functional dyspepsia; FDr = functional diarrhea; IBS = irritable bowel syndrome.
FIGURE 3.
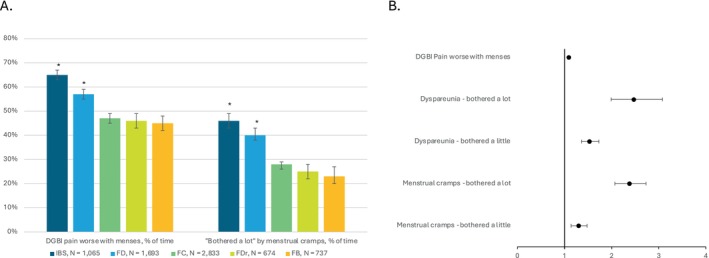
Menses‐Associated Symptoms in Pre‐Menopausal Women. (A) Menses‐associated symptoms are increased in IBS and FD compared to the other DGBI. A “*” above a bar signifies that the 95% confidence interval bars do not overlap with any others in the figure. (B) Presence of mrenses‐elated symptoms increases odds of having > 1 DGBI diagnosis. Forest plot of odds ratios for greater than 1 DGBI diagnosis given specified variables. Dyspareunia and bothersomeness of menstrual cramps increased odds of > 1 DGBI.
4. Discussion
In this global survey examining GI symptoms across five main DGBI, we found differences in specific DGBI symptoms based on sex, menopausal status, and menses‐related symptoms. However, the effect sizes are small. The largest sex difference was the higher prevalence of hard stools in women compared to men with FC (42% vs. 34%). Regardless, the greater frequency of diagnostic DGBI symptoms across the five DGBI in women compared to men suggests increased visceral perception in women with DGBI. Higher symptom frequency across all FC and FB criteria in women compared to men has been shown in prior studies [4]. Interestingly, while FDr is more common in men compared to women, women with FDr reported a greater prevalence of loose stool than men in our study. These findings may underscore a sex‐specific dysregulation that produces increased symptom burden in women with DGBI. Another intriguing finding was the more prevalent early satiety with inability to finish a meal in FD women compared to men, but no sex difference in early satiety interfering with activities; this suggests greater impairment of fundic accommodation, which is associated with early satiety [30], in women compared to men, increased bothersomeness of early satiety in women, and/or different symptom‐coping behaviors between the sexes. Increased perception in women extends outside of the GI tract as demonstrated by higher somatic symptom severity, anxiety and depression (trend) in women compared to men across the DGBI, which is supported by prior literature [4, 31]. Indeed, previous research has shown a strong association between poor quality of life in individuals with DGBI and worse mental health, where depression, anxiety, and somatic symptom severity scores are predictors for poorer quality of life [32]. A shared pathophysiology for the development of DGBI and extraintestinal symptoms or disorders has been also supported by studies [33], and female sex may mediate or exacerbate this effect.
Our analyses of menopause and menses‐associated symptoms can help clarify whether the aforementioned sex differences might in part be explained by effects of hormonal changes. Younger women and men generally reported more symptoms than their older counterparts, which supports prior work that has shown that older age confers decreased prevalence of most DGBI [7]. However, for some DGBI symptoms, we found age‐related (pre‐ vs. postmenopausal) differences among women, particularly in outlet symptoms, which were not shared by men, in IBS, FD, and FC. Premenopausal women with these DGBI experienced higher rates of constipation‐related outlet symptoms compared to postmenopausal women, while postmenopausal women reported more accidental stool leakage (in IBS) and manual maneuvers (in FC) than their premenopausal counterparts, neither of which difference was seen when comparing younger vs. older men. This suggests that these symptom differences were influenced more by sex hormonal and/or pelvic floor effects rather than by age. The accidental stool leakage finding in postmenopausal women (seen in our IBS and FDr groups) echoes that of Busby‐Whitehead et al. [7] who showed that fecal incontinence prevalence was higher in older (≥ 65) compared to younger individuals among women but not men, though the age cut‐offs were different from ours and they evaluated the prevalence of the DGBI of fecal incontinence rather than symptom frequency.
In light of these menopause‐specific differences in IBS, FD, and FC, it is important to note that many of the constipation symptom frequencies in these syndromes were quite high (nearing 50%). In contrast, in FDr and FB, which had lower constipation symptoms, constipation‐predominant outlet differences were seen in both younger women and men compared to their older counterparts. This suggests that age may influence a lower frequency or bothersomeness of symptoms, but when these symptoms reach a certain threshold (i.e., meet criteria for constipation‐predominant DGBI), the menopause‐specific differences emerge. Finally, the frequency of IBS diagnostic symptoms did not differ between pre‐ and postmenopausal women nor age‐matched men. This finding is similar to a previous study conducted in women with IBS [34]. However, these results differ somewhat from our previous single‐center study which found that postmenopausal IBS women have a greater overall severity of symptoms than premenopausal IBS women, although there were no differences in the severity of individual symptoms [6]. Overall symptom severity is a multicomponent factor and the difference between pre‐ and postmenopausal women with IBS could have been more related to quality of life or bothersomeness of symptoms rather than frequency alone, although further study is needed [35]. Our finding of worse physical quality of life in older men and women across DGBI reflects the aforementioned study, and the trend towards better mental quality of life in older women and men reflects prior work by the RFGES [32]. Taken together with the lower levels of anxiety and depression in the older age groups of both genders, these findings suggest that better psychological health and mental quality of life in older age may play a role in improvement of DGBI symptoms to a degree, rather than sex hormone effect alone. In addition, it has been suggested that there may be a large age‐related effect on pain thresholds with diminished visceral pain sensitivity.
Estrogen exerts effects on the peripheral, central, and enteric nervous systems that may be involved in sex‐related differences in DGBI. A dysregulation in estrogen signaling may play a sex‐specific role in DGBI pathophysiology [36]. Estradiol has been shown to have both pronociceptive and antinociceptive effects on pain sensitivity [37, 38] and delay intestinal motility [5] (while androgens accelerate transit) [39], which may in part explain the preponderance of pain‐ and constipation‐predominant DGBI in women, especially in the premenopausal state. Centrally, estrogen levels affect the stress response, including the hypothalamic–pituitary–adrenal axis and the autonomic nervous system [5]. Estradiol mediates an increase in central noradrenergic signaling to the brain which increases arousal [40], potentially amplifying symptom perception in women. The enhanced visceral perception in women compared to men with IBS [41] may also be partly due to other pathophysiologic mechanisms, such as lower serum testosterone levels in healthy and IBS women, which is associated with increased IBS symptom severity [39]. In addition, while estrogen inhibits GI smooth muscle contractility, testosterone decreases GI transit time [5, 39], which likely contributes to greater constipation symptoms in women. Finally, by altering intestinal adaptive immune responses and bacterial function in the intestine [42] as well as serving as epigenetic modulators [43], estrogens may demonstrate myriad other effects on the brain–gut–microbiome system which may contribute to sex differences in DGBI symptoms.
Menses‐related symptoms were most pronounced in women with IBS and FD, which unlike the others, are characterized by pain‐related symptoms and may indicate a linkage between cyclical hormonal influences and pain symptoms in DGBI, as well as increased DGBI comorbidity. It is known that menses‐related cramps or pain (dysmenorrhea) are associated with an increased risk for IBS diagnosis [44], and have been shown to increase gut pain and hypersensitivity in the sigmoid colon and rectum [9, 10, 45]. Studies have demonstrated increased GI symptoms and rectal hypersensitivity [9] in premenses and menses [46]. There is also evidence for “cross‐sensitization” of pain between pelvic organs and the intestinal tract [47], or alternatively, central sensitization effects of dysmenorrhea, which may play a role in DGBI symptom generation [48]. However, it is the rise and fall of sex hormones in the menstrual cycle and in perimenopause—and particularly of estrogen—that may play a sex‐specific mechanistic role in DGBI symptomatology. When estrogen levels are low during the late luteal phase of the menstrual cycle or during surgical/natural menopause, the nervous system shifts towards sympathetic hyperactivity [49] and away from parasympathetic activity [50]. In IBS, women have elevated sympathetic signaling with inhibition of parasympathetic activity compared to women without IBS at the same phase of the menstrual cycle [51]. When estrogen is supplemented with hormonal replacement therapy, sympathetic signaling decreases and parasympathetic activity increases in postmenopausal women [52, 53, 54]. While estradiol has stimulatory effects on central noradrenergic activity, it also has a stimulatory effect on the function of the endogenous opioid system [55] and corticolimbic inhibitory pathways that attenuate emotional arousal and salience networks [37, 55]. Fluctuating estrogen levels during the menstrual cycle and perimenopause may precipitate an imbalance of stimulatory and inhibitory effects in women, but once stabilized in a chronic low estrogen state (such as in menopause), it is conceivable that these effects attenuate, which would be consistent with the lower DGBI symptom frequency in post‐menopausal women, but this needs further study.
Our study has some notable limitations. This is a cross‐sectional, observational epidemiologic study which cannot address causality or mechanism. Future mechanistic studies are needed to elucidate the relationship between age, menopause, sex hormones, and DGBI symptoms in individuals suffering from these chronic GI conditions. The sex differences in DGBI symptoms that we detected were overall very small. This may be in part due to the fact that the participants were community‐based adults meeting criteria for DGBI via survey input, rather than clinical patients diagnosed by a practitioner. About 46% of individuals with DGBI in our study group had sought medical care because of their GI symptoms, but it is unknown what proportion of these received a clinical diagnosis with a DGBI. Finally, there is a risk, due to the very large sample sizes in our study, of detecting some small but practically insignificant differences. For this reason, the SMD values presented in our tables should be considered when interpreting the practical meaningfulness of our various findings.
As discussed, our study did not evaluate menstrual cycle regularity or symptoms at specific times in the menstrual cycle for premenopausal women. This might have led to recency bias for those who were on their period or recently completed it, or the opposite for those who were far from their period, and consequently altered their responses to questions about their DGBI symptoms (it is known that DGBI symptoms increase during menses [56, 57, 58]). Further, endometriosis, a common gynecologic disease that is known to cause bothersome menses‐related symptoms and has significant comorbidity with DGBI [59], was not assessed by our survey. For a number of respondents, this may have been a confounding factor for the menses‐related GI symptoms we assessed. Our study did not evaluate age brackets within the postmenopausal and premenopausal groups, which could lead to attenuation of differences that are most stark in the menopausal transition. For instance, since it is known that perimenopause is associated with increased GI symptoms [10], some of our premenopausal women could have been perimenopausal, as they may not have reported that they were postmenopausal. However, younger men generally had more frequent DGBI symptoms than older men, so there is probably a true age effect. The survey did not record information about participant gender identity, only sex. Thus, we did not capture information about the transgender/gender‐non‐conforming individuals in the cohort; this population is likely small (though we have no worldwide estimates for prevalence, U.S. transgender prevalence is ~1% [60]) and unlikely to skew our results, but would be important to include for future studies. Neither information about exogenous hormone use in the participants (e.g., oral contraceptive pills and hormone replacement therapy), nor history of childbirth (excluding c‐sections), were included in the survey, and this could have confounded the findings. Our study is a global cohort, which may contain outliers due to biopsychosocial differences in particular countries; future studies should examine geographic differences in DGBI symptoms based on sex and menopausal status. Finally, focusing on overlapping DGBI rather than single DGBI with others excluded is supported for aforementioned reasons, but may lead to over‐emphasis on symptom differences that are in fact part of a separate DGBI not analyzed in this study.
Taken together, our findings suggest that while age alone has some influence on symptoms, female sex hormones may also increase visceral perception in DGBI, particularly in women with menses‐related pain.
5. Conclusion
This study demonstrated differences in DGBI symptoms based on sex, menopausal status, and menses‐related symptoms. Women's increased propensity to experience Rome IV DGBI symptoms across the five main DGBI may signify sex‐specific dysregulation that produces increased symptoms compared to men. Both premenopausal women and age‐matched men tend to have greater symptom burden compared to their older counterparts, which supports an age effect that is possibly independent of sex. Nonetheless, our menopausal status‐specific findings suggest sex hormone‐mediated effects on visceral perception and GI function may contribute to a greater symptom burden in women than men with DGBI. These findings support further exploration of sex hormone role in symptom generation or symptom modulation and brain–gut pathways relevant to DGBI across the lifespan.
Author Contributions
R.P.S. and L.C. reviewed the literature and were involved with conceptualization, study design, data interpretation, and drafted the manuscript. J.P.H. performed statistical analysis, data interpretation, and reviewed the manuscript. J.K. was involved in data interpretation and helped draft and review the manuscript. A.M.D., O.S.P., and S.I.B. were involved with the original data collection for the RFGES, reviewed and approved the study design, and revised the manuscript.
Conflicts of Interest
The authors declare no conflicts of interest.
Supporting information
Appendix S1.
Acknowledgments
The authors have nothing to report.
Funding: The study was funded, in part, by the Rome Foundation. Drs. Chang and Sarnoff are supported by the NIH U54 DK123755 (LC).
Data Availability Statement
The data that support the findings of this study are available on request from the corresponding author. The data are not publicly available due to privacy or ethical restrictions.
References
- 1. Drossman D. A., “Functional Gastrointestinal Disorders: History, Pathophysiology, Clinical Features and Rome IV,” Gastroenterology S0016–5085, no. 16 (2016): 223–227. [DOI] [PubMed] [Google Scholar]
- 2. Zia J. K., Lenhart A., Yang P. L., et al., “Risk Factors for Abdominal Pain‐Related Disorders of Gut‐Brain Interaction in Adults and Children: A Systematic Review,” Gastroenterology 163, no. 4 (2022): 995–1023 e1023. [DOI] [PMC free article] [PubMed] [Google Scholar]
- 3. Kim Y. S. and Kim N., “Sex‐Gender Differences in Irritable Bowel Syndrome,” Journal of Neurogastroenterology and Motility 24, no. 4 (2018): 544–558. [DOI] [PMC free article] [PubMed] [Google Scholar]
- 4. Narayanan S. P., Anderson B., and Bharucha A. E., “Sex‐ and Gender‐Related Differences in Common Functional Gastroenterologic Disorders,” Mayo Clinic Proceedings 96, no. 4 (2021): 1071–1089. [DOI] [PMC free article] [PubMed] [Google Scholar]
- 5. So S. Y. and Savidge T. C., “Sex‐Bias in Irritable Bowel Syndrome: Linking Steroids to the Gut‐Brain Axis,” Frontiers in Endocrinology 12 (2021): 684096. [DOI] [PMC free article] [PubMed] [Google Scholar]
- 6. Lenhart A., Naliboff B., Shih W., et al., “Postmenopausal Women With Irritable Bowel Syndrome (IBS) Have More Severe Symptoms Than Premenopausal Women With IBS,” Neurogastroenterology and Motility 32, no. 10 (2020): e13913. [DOI] [PMC free article] [PubMed] [Google Scholar]
- 7. Busby‐Whitehead J., Whitehead W. E., Sperber A. D., Palsson O. S., and Simren M., “The Aging Gut: Symptoms Compatible With Disorders of Gut‐Brain Interaction (DGBI) in Older Adults in the General Population,” Journal of the American Geriatrics Society 72, no. 2 (2024): 479–489. [DOI] [PubMed] [Google Scholar]
- 8. Sperber A. D., Freud T., Palsson O. S., Bangdiwala S. I., and Simren M., “The Aging Gastrointestinal Tract: Epidemiology and Clinical Significance of Disorders of Gut‐Brain Interaction in the Older General Population,” Alimentary Pharmacology & Therapeutics 60, no. 4 (2024): 446–456. [DOI] [PubMed] [Google Scholar]
- 9. Houghton L. A., Lea R., Jackson N., and Whorwell P. J., “The Menstrual Cycle Affects Rectal Sensitivity in Patients With Irritable Bowel Syndrome but Not Healthy Volunteers,” Gut 50, no. 4 (2002): 471–474. [DOI] [PMC free article] [PubMed] [Google Scholar]
- 10. Heitkemper M. M. and Chang L., “Do Fluctuations in Ovarian Hormones Affect Gastrointestinal Symptoms in Women With Irritable Bowel Syndrome?,” Gender Medicine 6 Suppl 2, no. Suppl 2 (2009): 152–167. [DOI] [PMC free article] [PubMed] [Google Scholar]
- 11. Yamamoto Y., Furukawa S., Watanabe J., et al., “Association Between Menstrual Pain and Functional Dyspepsia in a Japanese Young Population,” Neurogastroenterology and Motility 34, no. 8 (2022): e14324. [DOI] [PubMed] [Google Scholar]
- 12. Sperber A. D., Bangdiwala S. I., Drossman D. A., et al., “Worldwide Prevalence and Burden of Functional Gastrointestinal Disorders, Results of Rome Foundation Global Study,” Gastroenterology 160, no. 1 (2021): 99–114. [DOI] [PubMed] [Google Scholar]
- 13. Wong R. K. and Drossman D. A., “Quality of Life Measures in Irritable Bowel Syndrome,” Expert Review of Gastroenterology & Hepatology 4, no. 3 (2010): 277–284. [DOI] [PubMed] [Google Scholar]
- 14. Enck P., Aziz Q., Barbara G., et al., “Irritable Bowel Syndrome,” Nature Reviews. Disease Primers 2 (2016): 16014. [DOI] [PMC free article] [PubMed] [Google Scholar]
- 15. Gralnek I. M., Hays R. D., Kilbourne A., Naliboff B., and Mayer E. A., “The Impact of Irritable Bowel Syndrome on Health‐Related Quality of Life,” Gastroenterology 119, no. 3 (2000): 654–660. [DOI] [PubMed] [Google Scholar]
- 16. Halder S. L., G. R. Locke, 3rd , Talley N. J., Fett S. L., Zinsmeister A. R., and L. J. Melton, 3rd. , “Impact of Functional Gastrointestinal Disorders on Health‐Related Quality of Life: A Population‐Based Case—Control Study,” Alimentary Pharmacology & Therapeutics 19, no. 2 (2004): 233–242. [DOI] [PubMed] [Google Scholar]
- 17. Aziz I., Palsson O. S., Tornblom H., Sperber A. D., Whitehead W. E., and Simren M., “The Prevalence and Impact of Overlapping Rome IV‐Diagnosed Functional Gastrointestinal Disorders on Somatization, Quality of Life, and Healthcare Utilization: A Cross‐Sectional General Population Study in Three Countries,” American Journal of Gastroenterology 113, no. 1 (2018): 86–96. [DOI] [PubMed] [Google Scholar]
- 18. Aziz I., Palsson O. S., Tornblom H., Sperber A. D., Whitehead W. E., and Simren M., “Epidemiology, Clinical Characteristics, and Associations for Symptom‐Based Rome IV Functional Dyspepsia in Adults in the USA, Canada, and the UK: A Cross‐Sectional Population‐Based Study,” Lancet Gastroenterology & Hepatology 3, no. 4 (2018): 252–262. [DOI] [PubMed] [Google Scholar]
- 19. Palsson O. S., Whitehead W., Tornblom H., Sperber A. D., and Simren M., “Prevalence of Rome IV Functional Bowel Disorders Among Adults in the United States, Canada, and the United Kingdom,” Gastroenterology 158, no. 5 (2020): 1262–1273. [DOI] [PubMed] [Google Scholar]
- 20. Sperber A. D., Freud T., Abu‐Freha N., et al., “Epidemiology of Disorders of Gut‐Brain Interaction in Israel: Results From the Rome Foundation Global Epidemiology Study,” Neurogastroenterology and Motility 34, no. 8 (2022): e14323. [DOI] [PubMed] [Google Scholar]
- 21. von M., Talley N. J., Hammer J., et al., “Overlap of Irritable Bowel Syndrome and Functional Dyspepsia in the Clinical Setting: Prevalence and Risk Factors,” Digestive Diseases and Sciences 64, no. 2 (2019): 480–486. [DOI] [PubMed] [Google Scholar]
- 22. Fairlie T., Shah A., Talley N. J., et al., “Overlap of Disorders of Gut‐Brain Interaction: A Systematic Review and Meta‐Analysis,” Lancet Gastroenterology & Hepatology 8, no. 7 (2023): 646–659. [DOI] [PubMed] [Google Scholar]
- 23. Palsson O. S., Whitehead W. E., van M., et al., “Rome IV Diagnostic Questionnaires and Tables for Investigators and Clinicians,” Gastroenterology 150 (2016): 1481–1491. [DOI] [PubMed] [Google Scholar]
- 24. Spiller R. C., Humes D. J., Campbell E., et al., “The Patient Health Questionnaire 12 Somatic Symptom Scale as a Predictor of Symptom Severity and Consulting Behaviour in Patients With Irritable Bowel Syndrome and Symptomatic Diverticular Disease,” Alimentary Pharmacology & Therapeutics 32, no. 6 (2010): 811–820. [DOI] [PubMed] [Google Scholar]
- 25. Kroenke K., Spitzer R. L., and Williams J. B., “The PHQ‐15: Validity of a New Measure for Evaluating the Severity of Somatic Symptoms,” Psychosomatic Medicine 64, no. 2 (2002): 258–266. [DOI] [PubMed] [Google Scholar]
- 26. Kroenke K., Spitzer R. L., Williams J. B., and Lowe B., “An Ultra‐Brief Screening Scale for Anxiety and Depression: The PHQ‐4,” Psychosomatics 50, no. 6 (2009): 613–621. [DOI] [PubMed] [Google Scholar]
- 27. Hays R. D., Bjorner J. B., Revicki D. A., Spritzer K. L., and Cella D., “Development of Physical and Mental Health Summary Scores From the Patient‐Reported Outcomes Measurement Information System (PROMIS) Global Items,” Quality of Life Research 18, no. 7 (2009): 873–880. [DOI] [PMC free article] [PubMed] [Google Scholar]
- 28. Francis C. Y., Morris J., and Whorwell P. J., “The Irritable Bowel Severity Scoring System: A Simple Method of Monitoring Irritable Bowel Syndrome and Its Progress,” Alimentary Pharmacology & Therapeutics 11, no. 2 (1997): 395–402. [DOI] [PubMed] [Google Scholar]
- 29. Cohen J., Statistical Power Analysis for the Behavioral Sciences, 2nd ed. (Hillsdale, NJ: Erlbaum, 1988). [Google Scholar]
- 30. Tack J. and Lee K. J., “Pathophysiology and Treatment of Functional Dyspepsia,” Journal of Clinical Gastroenterology 39, no. 5 Suppl 3 (2005): S211–S216. [DOI] [PubMed] [Google Scholar]
- 31. Choi Y. J., Park Y. S., Kim N., et al., “Gender Differences in Ghrelin, Nociception Genes, Psychological Factors and Quality of Life in Functional Dyspepsia,” World Journal of Gastroenterology 23, no. 45 (2017): 8053–8061. [DOI] [PMC free article] [PubMed] [Google Scholar]
- 32. Knowles S. R., Skvarc D., Ford A. C., et al., “Negative Impact of Disorders of Gut‐Brain Interaction on Health‐Related Quality of Life: Results From the Rome Foundation Global Epidemiology Survey,” Gastroenterology 164, no. 4 (2023): 655–668. [DOI] [PubMed] [Google Scholar]
- 33. Trindade I. A., Hreinsson J. P., Melchior C., et al., “Global Prevalence of Psychological Distress and Comorbidity With Disorders of Gut‐Brain Interactions,” American Journal of Gastroenterology 119, no. 1 (2024): 165–175. [DOI] [PubMed] [Google Scholar]
- 34. Cain K. C., Jarrett M. E., Burr R. L., Rosen S., Hertig V. L., and Heitkemper M. M., “Gender Differences in Gastrointestinal, Psychological, and Somatic Symptoms in Irritable Bowel Syndrome,” Digestive Diseases and Sciences 54, no. 7 (2009): 1542–1549. [DOI] [PMC free article] [PubMed] [Google Scholar]
- 35. Coitinho Y., Naude C., Marchese S. H., et al., “Symptom Bothersomeness and Life Interference Support Rome Clinical Criteria as Clinically Relevant Indicators of DGBI,” Neurogastroenterology and Motility 36 (2024): e14936. [DOI] [PubMed] [Google Scholar]
- 36. Tillisch K., Mayer E. A., Labus J. S., Stains J., Chang L., and Naliboff B. D., “Sex Specific Alterations in Autonomic Function Among Patients With Irritable Bowel Syndrome,” Gut 54, no. 10 (2005): 1396–1401. [DOI] [PMC free article] [PubMed] [Google Scholar]
- 37. Wallace D. M., Magnuson D. J., and Gray T. S., “Organization of Amygdaloid Projections to Brainstem Dopaminergic, Noradrenergic, and Adrenergic Cell Groups in the Rat,” Brain Research Bulletin 28, no. 3 (1992): 447–454. [DOI] [PubMed] [Google Scholar]
- 38. Sun L. H., Zhang W. X., Xu Q., Wu H., Jiao C. C., and Chen X. Z., “Estrogen Modulation of Visceral Pain,” Journal of Zhejiang University. Science. B 20, no. 8 (2019): 628–636. [DOI] [PMC free article] [PubMed] [Google Scholar]
- 39. Rastelli D., Robinson A., Lagomarsino V. N., et al., “Diminished Androgen Levels Are Linked to Irritable Bowel Syndrome and Cause Bowel Dysfunction in Mice,” Journal of Clinical Investigation 132, no. 2 (2022): e150789. [DOI] [PMC free article] [PubMed] [Google Scholar]
- 40. Jones B. E. and Yang T. Z., “The Efferent Projections From the Reticular Formation and the Locus Coeruleus Studied by Anterograde and Retrograde Axonal Transport in the Rat,” Journal of Comparative Neurology 242, no. 1 (1985): 56–92. [DOI] [PubMed] [Google Scholar]
- 41. Chang L., Mayer E. A., Labus J. S., et al., “Effect of Sex on Perception of Rectosigmoid Stimuli in Irritable Bowel Syndrome,” American Journal of Physiology. Regulatory, Integrative and Comparative Physiology 291, no. 2 (2006): R277–R284. [DOI] [PubMed] [Google Scholar]
- 42. Diebel M. E., Diebel L. N., and Liberati D. M., “Gender Dimorphism in the Gut: Mucosal Protection by Estrogen Stimulation of IgA Transcytosis,” Journal of Trauma 71, no. 2 (2011): 474–479. [DOI] [PubMed] [Google Scholar]
- 43. Yang Y. M., Sun D., Kandhi S., et al., “Estrogen‐Dependent Epigenetic Regulation of Soluble Epoxide Hydrolase via DNA Methylation,” Proceedings of the National Academy of Sciences of the United States of America 115, no. 3 (2018): 613–618. [DOI] [PMC free article] [PubMed] [Google Scholar]
- 44. Olafsdottir L. B., Gudjonsson H., Jonsdottir H. H., Bjornsson E., and Thjodleifsson B., “Natural History of Irritable Bowel Syndrome in Women and Dysmenorrhea: A 10‐Year Follow‐Up Study,” Gastroenterology Research and Practice 2012 (2012): 534204. [DOI] [PMC free article] [PubMed] [Google Scholar]
- 45. Brinkert W., Dimcevski G., Arendt‐Nielsen L., Drewes A. M., and Wilder‐Smith O. H. G., “Dysmenorrhoea Is Associated With Hypersensitivity in the Sigmoid Colon and Rectum,” Pain 132, no. Suppl 1 (2007): S46–S51. [DOI] [PubMed] [Google Scholar]
- 46. Heitkemper M. M., Cain K. C., Jarrett M. E., Burr R. L., Hertig V., and Bond E. F., “Symptoms Across the Menstrual Cycle in Women With Irritable Bowel Syndrome,” American Journal of Gastroenterology 98, no. 2 (2003): 420–430. [DOI] [PubMed] [Google Scholar]
- 47. Shlobin A. E., Tu F. F., Sain C. R., et al., “Bladder Pain Sensitivity Is a Potential Risk Factor for Irritable Bowel Syndrome,” Digestive Diseases and Sciences 68, no. 7 (2023): 3092–3102. [DOI] [PMC free article] [PubMed] [Google Scholar]
- 48. Costantini R., Affaitati G., Wesselmann U., Czakanski P., and Giamberardino M. A., “Visceral Pain as a Triggering Factor for Fibromyalgia Symptoms in Comorbid Patients,” Pain 158, no. 10 (2017): 1925–1937. [DOI] [PubMed] [Google Scholar]
- 49. Yildirir A., Kabakci G., Akgul E., Tokgozoglu L., and Oto A., “Effects of Menstrual Cycle on Cardiac Autonomic Innervation as Assessed by Heart Rate Variability,” Annals of Noninvasive Electrocardiology 7, no. 1 (2002): 60–63. [DOI] [PMC free article] [PubMed] [Google Scholar]
- 50. Mercuro G., Podda A., Pitzalis L., et al., “Evidence of a Role of Endogenous Estrogen in the Modulation of Autonomic Nervous System,” American Journal of Cardiology 85, no. 6 (2000): 787–789. [DOI] [PubMed] [Google Scholar]
- 51. Burr R. L., Heitkemper M., Jarrett M., and Cain K. C., “Comparison of Autonomic Nervous System Indices Based on Abdominal Pain Reports in Women With Irritable Bowel Syndrome,” Biological Research for Nursing 2, no. 2 (2000): 97–106. [DOI] [PubMed] [Google Scholar]
- 52. Liu C. C., Kuo T. B., and Yang C. C., “Effects of Estrogen on Gender‐Related Autonomic Differences in Humans,” American Journal of Physiology. Heart and Circulatory Physiology 285, no. 5 (2003): H2188–H2193. [DOI] [PubMed] [Google Scholar]
- 53. Rosano G. M., Patrizi R., Leonardo F., et al., “Effect of Estrogen Replacement Therapy on Heart Rate Variability and Heart Rate in Healthy Postmenopausal Women,” American Journal of Cardiology 80, no. 6 (1997): 815–817. [DOI] [PubMed] [Google Scholar]
- 54. Rosa O., Posadas‐Romero C., Hermosillo A. G., et al., “Estrogen Effect on Heart Rate Variability in Hypertensive Postmenopausal Women,” Maturitas 44, no. 1 (2003): 39–48. [DOI] [PubMed] [Google Scholar]
- 55. Tanaka M., Yoshida M., Emoto H., and Ishii H., “Noradrenaline Systems in the Hypothalamus, Amygdala and Locus Coeruleus Are Involved in the Provocation of Anxiety: Basic Studies,” European Journal of Pharmacology 405, no. 1–3 (2000): 397–406. [DOI] [PubMed] [Google Scholar]
- 56. Adeyemo M. A., Spiegel B. M., and Chang L., “Meta‐Analysis: Do Irritable Bowel Syndrome Symptoms Vary Between Men and Women?,” Alimentary Pharmacology & Therapeutics 32, no. 6 (2010): 738–755. [DOI] [PMC free article] [PubMed] [Google Scholar]
- 57. Pati G. K., Kar C., Narayan J., et al., “Irritable Bowel Syndrome and the Menstrual Cycle,” Cureus 13, no. 1 (2021): e12692. [DOI] [PMC free article] [PubMed] [Google Scholar]
- 58. Mendelson S., Anbukkarasu P., Cassisi J. E., and Zaman W., “Gastrointestinal Functioning and Menstrual Cycle Phase in Emerging Young Adult Women: A Cross‐Sectional Study,” BMC Gastroenterology 23, no. 1 (2023): 406. [DOI] [PMC free article] [PubMed] [Google Scholar]
- 59. Simons M., Cline M., Gubbels A., King C., Lembo A., and Lupe S., “Endometriosis Is Associated With Higher Healthcare Utilization and Upper Gastrointestinal Symptoms,” Clinical Gastroenterology and Hepatology 22, no. 10 (2024): 2143–2146 e2141. [DOI] [PubMed] [Google Scholar]
- 60. The GenIUSS Group , Best Practices for Asking Questions to Identify Transgender and Other Gender Minority Respondents on Population‐Based Surveys (Los Angeles, CA: Williams Institute, 2014), https://escholarship.org/content/qt3qk7s1g6/qt3qk7s1g6.pdf#page=27. [Google Scholar]
Associated Data
This section collects any data citations, data availability statements, or supplementary materials included in this article.
Supplementary Materials
Appendix S1.
Data Availability Statement
The data that support the findings of this study are available on request from the corresponding author. The data are not publicly available due to privacy or ethical restrictions.