

Summary
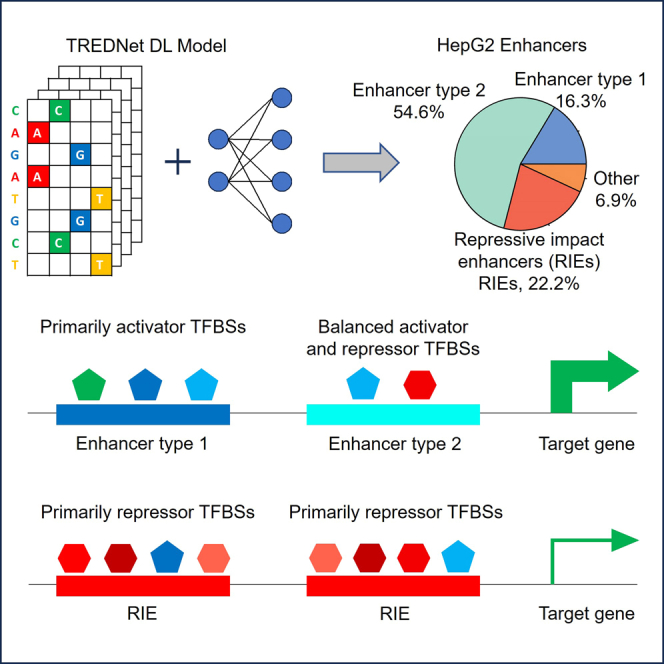
The regulation of gene expression relies on the coordinated action of transcription factors (TFs) at enhancers, including both activator and repressor TFs. We employed deep learning (DL) to dissect HepG2 enhancers into positive (PAR), negative (NAR), and neutral activity regions. Sharpr-MPRA and STARR-seq highlight the dichotomy impact of NARs and PARs on modulating and catalyzing the activity of enhancers, respectively. Approximately 22% of HepG2 enhancers, termed "repressive impact enhancers" (RIEs), are predominantly populated by NARs and transcriptional repression motifs. Genes flanking RIEs exhibit a stage-specific decline in expression during late development, suggesting RIEs' role in trimming enhancer activities. About 16.7% of human NARs emerge from neutral rhesus macaque DNA. This gain of repressor binding sites in RIEs is associated with a 30% decrease in the average expression of flanking genes in humans compared to rhesus macaque. Our work reveals modulated enhancer activity and adaptable gene regulation through the evolutionary dynamics of TF binding sites.
Subject areas: Molecular mechanism of gene regulation, Biocomputational method, In silico biology
Graphical abstract
Highlights
-
•
Enhancer activator and repressor TF binding sites can be distinguished by deep learning
-
•
The density of repressor binding sites in RIEs fine-tunes gene expression
-
•
RIEs modulate the upregulation of developmental genes with preserved functions
-
•
About 16% of repressor binding sites in RIEs have been gained in the human lineage
Molecular mechanism of gene regulation; Biocomputational method; In silico biology
Introduction
Enhancers recruit a combination of TFs and co-factors to regulate the transcriptional activity of their target genes.1,2,3 TFs can be broadly categorized as repressors or activators based on their impact on gene expression. Some TFs possess both activating and repressing functions.4,5 Precise gene regulation requires both transcriptional activation and repression.6,7 Disrupted TF binding in enhancers is frequently linked to various phenotypic changes and diseases.8,9,10 For example, single-nucleotide changes which subtly increase binding affinity may drive gain-of-function expression and lead to organismal phenotypes in the mouse and human limb.11
Experimental approaches, such as massively parallel reporter assays (MPRA) and self-transcribing active regulatory region sequencing (STARR-seq) identify DNA segments with regulatory activities. Sharpr-MPRA recognizes functional regulatory nucleotides and distinguishes activating and repressive nucleotides based on their inferred contribution to reporter gene expression.12 ATAC-STARR-seq experiments revealed that silent regions occur at similar frequencies to active regions, and they cluster by distinct TF footprint combinations for immune cell function.13 Apart from experimental methods, computational predictions have been widely used to identify the TF binding sites (TFBSs) and the regulatory effects of TFs.14,15,16,17,18,19 For example, BPNet uses DNA sequence to predict base-resolution binding profiles of pluripotency TFs and identifies soft syntax rules for cooperative TF binding interactions.15 scBasset predicts activating and repressive TFs according to expression-activity correlation at single-cell resolution.16 Transformers-based models such as DNABERT-TF effectively distinguish very similar TFBSs based on the distinct context windows.19
Previous research has also delved into the regulatory mechanisms associated with activator and repressor TFs. For instance, activator binding sites may not have a linear contribution to gene expression due to potential competition between neighboring binding sites.20 Enhancers can exhibit sensitivity or resistance to repressive activity based on the specific combination of co-repressors.21 Earlier studies have also aimed to unravel the evolutionary dynamics of TF binding, crucial for comprehending the evolution of gene regulation. One study employed comparative genomics approaches, assuming that binding events in conserved noncoding elements indicate functionality.22 Conversely, another study, focusing on ChIP-identified binding events for CEBPA and HNF4A in the liver tissue, showed that aligned binding events across five vertebrate species are rare.23 A recent study on the design of synthetic enhancers in fruit flies showed that repressor binding sites are associated with repressed enhancer activities.24 While these previous studies have provided intricate insights into transcriptional regulation by activators and repressors, the genomic features of active enhancers enriched with repressor TFBSs, including their regulatory role during development and their evolutionary origins, remain largely unexplored.
In this study, we employed a DL approach to model both typical enhancers and enhancers enriched for repressor binding sites in HepG2 cells, unraveling intricate details of enhancers and their impact on TF binding. Our systematic analysis allowed us to discern activator and repressor binding sites within enhancers and revealed a positive correlation between enhancer activity and activator binding, while repressor binding displayed a negative correlation with enhancer activity. Notably, we demonstrated that enhancers enriched with repressor binding sites feature diminished regulatory impact and often coordinate with nearby typical enhancers for gene regulation. By examining gene expression profiles across prenatal and postnatal stages in liver tissue, we demonstrate the influence of these enhancers on differential gene expression during development. Moreover, the evolution of the regulatory architecture, characterized by gaining of repressor binding sites in these enhancers, signifies a significant adaptation of biochemical processes in the liver between macaque and human species.
Results
Systematic exploration of positive activity regions and negative activity regions within HepG2 enhancers
In our study, we used TREDNet, a DL algorithm,25 to explore the impact of mutations on enhancer activity within human HepG2 cells. The TREDNet model has three phases. Phase one uses six convolutional layers (∼143 million parameters) to predict 1,924 genomic and epigenomic features for a 2kb region, including DHSs, TF ChIP-seq peaks, and histone marks from ENCODE and NIH Roadmap studies. The model predicts probabilities of these features in target DNA segments. Phase two trains a deep learning model based on the output of phase one to predict tissue-specific enhancers, providing an enhancer score for each DNA segment. Delta scores measure changes in enhancer activity between mutant and wildtype sequences, creating an in-silico mutagenesis profile (Figure S1A). Phase three, trained on delta scores from phase two, predicts TFBSs by identifying consecutive nucleotides with significant effects on enhancer scores (Figure 1A). All phases show strong accuracy in independent cross-validation (Figure S2).
Figure 1.

Systematic exploration of PARs and NARs within HepG2 enhancers
(A) The schematic pipeline of our methodology, which involves the initial identification of enhancer regions by overlaying DNase hypersensitive sites (DHSs), H3K27ac, and H3K4me1 marks. Subsequently, the TREDNet enhancer model is employed to assess the mutational effects on wild-type enhancers, quantifying these effects at the nucleotide level through normalized delta scores. Regions featuring consecutive positive delta scores signify activating effects, designated as PARs. Conversely, regions with consecutive negative delta scores denote repressive effects, identified as NARs. The associated transcription factor binding sites (TFBSs) within PARs and NARs are further annotated using available ChIP-seq data or computationally predicted TFBSs.
(B) Fraction of HepG2 enhancers categorized as containing PAR only, NAR only, PAR+NAR, or other.
(C) The average number of TF ChIP-seq peaks (from HepG2) observed within various enhancer categories.
(D) Fold enrichment of raQTLs within the PAR, NAR and neutral (neither PAR nor NAR) regions inside enhancers (∗ p-value <0.05, ∗∗ p-value <0.001, ∗∗∗ p-value <10−6, the binomial test).
Using ChIP-seq signals for open chromatin (marked by DNase hypersensitivity sites, or DHS) as well as H3K27ac and H3K4me1 histone modifications, we first trained a HepG2-specific enhancer model using TREDNet (auROC = 0.91). An exhaustive all-nucleotide in silico mutagenesis was performed next to quantify the impact of mutations on enhancer activity (see STAR Methods). Based on the predicted mutational impact on enhancer activity, we binned enhancer sequences into three types of activity regions. 1) negative activity regions (NARs; NAR mutations increase predicted enhancer activity), 2) positive activity regions (PARs; PAR mutations decrease predicted enhancer activity), and 3) other regions. To be classified as a NAR or PAR, a region from enhancer was required to have a contiguous stretch of several nucleotides with a generally similar impact on enhancer activity if mutated (see STAR Methods and Figure 1A for details). In Figure 1A for example, the PAR/NAR analysis of a HepG2 enhancer delineates the binding of proteins from two HepG2 expressed TF genes, FOXA1 to a PAR region and TCF12 to a NAR region, indicating an opposite impact of these two TFs on the enhancer activity.
Our study encompasses 41,254 HepG2 enhancers, each 400 bp long centered at open chromatin regions, and features the presence of the active histone mark H3K27ac and enhancer mark H3K4me1 (see STAR Methods). We identified a total of 63,643 NARs and 71,965 PARs in HepG2 enhancers. These regions exhibited an average length of 11.6 bp and 12.5 bp, respectively (see STAR Methods). We binned these enhancers into four distinct groups based on the composition of their activity regions (Figure 1B). We observed that 22.2% of these enhancers host NARs and no PARs (referred to as “NAR only”), 16.3% host PARs and no NARs (referred to as “PAR only”), 54.6% of enhancers exhibit a combination of both PARs and NARs (referred to as “PAR+NAR”), and 6.9% of enhancers lack both PARs and NARs (named “other”). A substantial portion of the total enhancers--93.1%--contain at least one NAR or PAR. These calculations underscore the prevalence of NARs and PARs as critical components in the constitution of active enhancers. This is consistent with our previous study on pancreatic islet enhancers, which has demonstrated that PARs and NARs are enriched for TFBSs and functional variants, and significantly improve the fine mapping of disease causal variants in Type II diabetes.25
To investigate whether PARs and NARs impact enhancer activity in relationship to TF binding, we evaluated HepG2 TF ChIP-seq peak densities within distinct enhancer regions (Figure 1C). Our results revealed a statistically significant TFBS enrichment within all categories of enhancers in comparison to control regions (p-value≤1 × 10⁻¹⁰, the binomial test). Enhancers harboring PARs, both in isolation and in conjunction with NARs (PAR only and PAR+NAR), exhibited substantially higher enrichment levels for TF binding events (fold-enrichment > 9.0) than those exclusively containing NARs (fold-enrichment > 2.0). The comparatively lower enrichment observed in enhancers featuring solely NARs might be partially attributed to the absence of repressor TF ChIP-seq data for HepG2 within our computational framework, which includes 43 activator TFs, only 9 repressor TFs, and 34 dual-function TFs. However, this low density of ChIP-seq peaks in elements enriched for repressor binding sites was also observed previously with a larger cohort of TFs26 and is consistent with a “hit and run” model of transcriptional repression.27 To further demonstrate the regulatory effects of our predicted active regions, we computed the enrichment of reporter assay QTLs (raQTLs) in these active regions, which alter the activity of putative regulatory elements in HepG2 cells28 (Figure 1D). Inside HepG2 enhancers, the fold enrichment of raQTLs in PARs (17.0) and NARs (2.8) are both larger than that in the neutral regions (2.2, neither PARs nor NARs), which are all significantly larger than the background DHS regions (p-value <10−6, the Wilcoxon rank-sum test). TREDNet predictions of raQTLs, including both magnitude and direction, correlate positively (R = 0.38) with experimental measurements (Figure S1B). The log2FC values from experiments and delta scores from TREDNet are similar, with median values of 0.56 and 0.45, respectively (Figure S1D). TREDNet accurately predicted the direction of regulatory effects for 66% of raQTLs, confirming the validity of our predictions for this experimental subset (Figure S1E). raQTLs are significantly enriched in PAR and NAR regions compared to neutral HepG2 enhancer regions and random non-HepG2 open chromatin regions. Enrichment analysis of PAR and NAR regions, ranked by prediction scores (top 50%, 25%, 10%, and 5%), shows a positive correlation with the density of raQTLs, indicating a higher likelihood of causative variants with higher delta scores (Figure S1C). These observations affirm the close association between our predicted activity regions with the experimentally identified functional variants that alter the activity of putative regulatory elements.
Experimental evidence of repressive activity of negative activity regions and enhancing activity of positive activity regions
To investigate the association of predicted activity regions with specific TFBSs, we conducted a motif enrichment analysis utilizing FIMO29 and only included TF genes expressed in the HepG2 cell line. This analysis shows distinct motifs enriched in PARs and NARs (Figure 2A). Among the top enriched motifs in NARs, many are linked to transcriptional repression. For example, one motif maps to ZEB1, which mediates transcriptional repression in breast cancer cells.30 TCF4 acts as a transcriptional repressor in the central nervous system via HDAC,31 while SNAI1 blocks E-cadherin expression and is necessary for early phases of embryonic development32,33 but also actively participates in gene transcription by binding to mesenchymal promoters.34,35
Figure 2.

PARs and NARs display distinct associations with TFBSs and regulatory activity
(A) Illustration of the most significantly enriched predicted TFBSs within PARs and NARs originating from HepG2 enhancers. Only TFs with corresponding genes being expressed in HepG2 are shown (RPKM >1.0). The x axis differentiates between PARs and NARs and those enhancers containing a cluster of PARs or NARs, including those with a single region (1PAR and 1NAR), dual regions (2PAR and 2NAR), or more than two regions (3+PAR and 3+NAR).
(B) Distribution of activating/repressive activity scores from Sharpr-MPRA for enhancers with varying degrees of NAR and PAR enrichment.
(C) The correlation between enhancer activities determined by STARR-Seq and the number of PARs or NARs present within enhancers.
(D) The overall enhancer activities associated with at least one PAR (1+PAR) and at least one NAR (1+NAR).
(E) The distribution of expression level in adult liver tissue for genes proximal to enhancers with varying degrees of NAR and PAR enrichment. The number of genes included in this analysis is 542, 519, 582, 353, 336 and 668 for 3+NAR, 2NAR, 1NAR, 1PAR, 2PAR and 3+PAR, respectively.
(F) Expression of flanking genes for PAR or NAR enriched enhancers, silencers, and all genes as a background. The number of genes included in this analysis is 1133, 1280, 2413 and 18100 for 1+PAR, 1+NAR, silencer, and background, respectively. (∗ p-value <0.05, ∗∗ p-value <0.001, ∗∗∗ p-value <10−6, the Wilcoxon rank-sum test).
In contrast, the motifs enriched within PARs exhibit a different profile. For example, JUNB, JUND, and CFOS from the activator protein-1 (AP-1) family may function as pioneer factors, potentially collaborating with the chromatin remodeling complex SWI/SNF.36 Similarly, members of the FOXA family of TFs specialize in binding to and facilitating the opening of densely packed chromatin regions and their significant role as pioneer factors in liver development is well-established.37 Other TFs, such as GATA6, are necessary for the expansion of the liver bud and commitment of the endoderm to hepatic cell fate,38 while FOXK2 can promote AP-1-dependent transcriptional regulation.39 The top enriched TFBSs also exhibit a concordance in their fold-enrichment values across enhancers with a cluster of activity regions, regardless of the density of either NARs or PARs, suggesting a propensity for the clustering of repressor or activator TFBSs within enhancers. Taken together, these findings demonstrate that the predicted PARs and NARs are indeed enriched for activator (15.9-fold on average) and repressor (3.4-fold on average) TFBSs, respectively, aligning with their anticipated roles in either facilitating or suppressing enhancer activities.
To validate the functional significance of PARs and NARs, we conducted an overlap analysis with experimentally verified activating and repressive regions identified using Sharpr-MPRA experiments in HepG2 cells.12 Our findings revealed that Sharpr-MPRA scores for NAR enhancers are significantly lower (p-value < 2.2 × 10⁻¹⁶) and negative, compared to positive scores for PAR enhancers, indicating strong repressive and activating effects for NAR and PAR enhancers, respectively (Figure 2B). Additionally, there is a positive correlation between the number of NARs and the negative Sharpr-MPRA scores, suggesting that clustering more NARs leads to stronger repressive effects. These results experimentally validate the positive and negative impact of PARs and NARs, respectively, on enhancer activity.
To evaluate the relationship between regulatory activity and the degree of enrichment of PARs and NARs within enhancers, we selectively overlapped PAR-only and NAR-only enhancers with putative regulatory elements whose activities had been quantified via STARR-seq experiments conducted in HepG2 cells.40 Our observations reveal a clear dichotomy: enhancer activity exhibits a negative correlation with the enrichment of NARs but a positive correlation with the enrichment of PARs (Figure 2C), which underscores the cumulative impact of NARs on repressive activity and PARs on activating activity within the context of enhancer regulation. Furthermore, the overall activity levels of enhancers containing at least one NAR are significantly lower than those containing at least one PAR (Figure 2D).
This impact of PARs and NARs on enhancer activity can be directly correlated with the expression of adjacent genes in the liver. We computed the expression levels of genes in HepG2 cells that have only a single PAR or NAR enhancer within their loci. Genes flanking NAR enhancers exhibit lower expression compared to those flanking PAR enhancers (p-value < 0.08, Wilcoxon rank-sum test), suggesting that NAR enhancers have repressive effects on gene expression, whereas PAR enhancers have activating effects (Figure S3A). In adult liver tissue, enhancers with three or more NARs are associated with significantly lower gene expression compared to enhancers with two NARs (p-value < 0.05, Wilcoxon rank-sum test) or a single NAR (p-value < 0.05). Conversely, enhancers with three or more PARs are linked to significantly higher gene expression than those with just one PAR (p-value < 0.05) (Figure 2E). These findings suggest a close relationship between PARs/NARs and the alteration in the activating/repressive activities of enhancers, as well as the expression level of genes located nearby. This implies a potential mechanism in fine-tuning the expression of target genes through the modulation of activator or repressor TFBS density. Based on these observations, we classify enhancers enriched in NARs, which exert a repressive impact on gene regulation, as “repressive impact enhancers” or “RIEs.” Our subsequent analysis will focus on unraveling their regulatory characteristics.
Silencers, as a noteworthy class of regulatory elements, play a pivotal role in gene repression. To gain deeper insights into the distinctions between RIEs and silencers, we performed an examination of the co-localization of these two sets of elements. What we observed was a notably diminished density of the H3K27me3 histone mark, a characteristic of silencers, within the same gene locus containing RIEs, which is less than half the density in background regions (Figure S3B). Additionally, we found that the density of the active mark H3K27ac is significantly higher (>2.0-fold) in loci containing RIEs when compared to loci containing silencers. This implies a significantly larger number of active typical enhancers surrounding RIEs, while silencers appear to operate with fewer active enhancers in their neighborhood (Figure S3C). We also found that about 11.5% of HepG2 RIEs are the result of a functional transformation of H1 hESC cell silencers, which is significantly higher than the 10.4% of all HepG2 enhancers (p-value < 0.0003, the binomial test). The dichotomy of regulatory function and abundant silencer-enhancer transitions has been documented in the past41,42,43 and is not surprising. However, the elevated rate of silencer-enhancer transitions into RIEs is likely reflective of the repressor TFBSs embedded into these regulatory elements, and those TFBSs could be instrumental in establishing silencing activity when acting as silencers during early development.
To further explore the disparity in regulatory programs established by silencers and RIE enhancers, we shifted our focus to the expression levels of genes flanking these two types of elements. We observed that the gene expression in proximity to RIEs is 2.8-fold higher than that associated with silencers (median value, p-value < 10−6, the Wilcoxon rank-sum test). Furthermore, the overall gene expression linked to RIEs surpasses the background expression of all genes, while the gene expression associated with silencers falls below the background level thus depicting RIE and silencers as positive and negative regulators of gene expression, respectively (Figure 2F). In summary, these observations underscore that RIEs exert subtle regulatory impact and fine-tune target gene expression, upregulating gene expression in a modulated manner. In contrast, silencers repress target genes while being surrounded by a limited number of typical enhancers.
Developmental gene regulation by repressive impact enhancers
In previous sections, we established a compelling link between NARs and their repressive influence on enhancer activity. These regulatory elements appear to play a pivotal role in fine-tuning the expression of target genes. Our hypothesis posits that these target genes primarily pertain to developmental processes that have remained well conserved throughout vertebrate evolution. The perturbation of such genes through knockout experiments frequently resulted in deleterious effects on species phenotypes and embryonic viability.44,45 Consequently, the evolutionary trajectory of these genes' regulatory architecture, characterized by the modulation via RIE activity, represents a pathway through which vertebrate species have adapted by calibrating crucial cellular mechanisms.
To test this hypothesis, we examined the expression levels of genes flanking RIEs in liver tissue across a spectrum of developmental and adulthood stages46 (Figure 3A). We noted a substantial reduction in gene expression levels during the 12–20 weeks post-conception (wpc) prenatal stage compared to both earlier prenatal (4–11 wpc) and postnatal stages. This stage-specific decline in expression suggests a potential involvement of RIEs in trimming enhancer activities and modulation of the regulation of associated genes during late development. Conversely, genes flanking enhancers enriched for PARs displayed the highest expression levels during postnatal stages, highlighting the activating function of these enhancers after development (Figure 3B). To further confirm the regulatory effects of RIEs during development, we investigated the coordination between RIEs and typical enhancers within the same gene loci active in endoderm, fetal liver,47 and adult liver by overlapping them with the H3K27ac mark specific to the corresponding cell types and tissues (Figure 3C). Interestingly, we observed a significantly higher ratio of active RIEs over typical enhancers in the fetal liver compared to endoderm and adult liver, which aligns with the lowest gene expression levels observed during the 12–20 wpc stages, possibly due to the intensified repressive activities of RIEs. The increasing ratio of the total number of RIEs divided by the total number of typical enhancers from early development (4–11 wpc) to late development (12–20 wpc) suggests a gradual shift from overall activating effects to predominantly suppressive effects between these two stages coordinated by all enhancers in the loci (Figures 3A and 3C). In addition, we also observed a significant increase of nearby gene expression between late development and postnatal stages, suggesting that the RIE neighboring genes also play crucial roles in adult liver function. For example, RIE-neighboring genes HNF4A48,49,50,51 and FOXA2,52,53 which play essential roles in liver development and hepatocyte differentiation, show significantly higher expression levels during the postnatal stage compared to the 12–20 wpc stage. This implies combinatory effects of the upregulation of these genes by coordinated enhancers (Figure 3D). In concordance, gene ontology analysis confirmed a close correlation between RIEs and key biological processes in the liver, such as liver development, as well as alcohol and lipid metabolism (Figure 3E). The biological processes associated with PAR enhancers include liver-related functions such as lipid biosynthesis and insulin response (Figure S3D).
Figure 3.

Developmental gene regulation by RIEs and their evolutionarily gained repressor binding sites
(A) The distribution of median fold values for gene expression proximal to RIEs, observed across different developmental stages and mature phases in the human system. The fold value for each gene is calculated as the expression of that gene divided by the average expression of all genes in a specific stage. In this analysis, the number of NAR and PAR enhancers included is 9149 and 6733, respectively. The number of genes included is 207 and 260, respectively.
(B) The distribution of median fold values for gene expression proximal to enhancers enriched for PARs.
(C) Ratio calculated as the total number of RIEs overlapping H3K27ac marks in a specific cell type and tissue divided by the total number of other H3K27ac in the same gene loci in that corresponding tissue.
(D) Expression level of RIE-flanking genes FOXA2 and HNF4A in 12–20 wpc and postnatal stages as examples.
(E) Selected biological processes enriched for RIEs using GREAT for distinct categories of HepG2 enhancers.
(F) Inferred direction of selection for each category of HepG2 enhancers.
(G) Mapping of PARs and NARs within human HepG2 enhancers to orthologous sequences in rhesus macaques. Permutation test. HepG2 model annotations delineate identical human and rhesus macaque orthologous sequences (“identical PAR” and “identical NAR”), sequence mutated but functional conserved active regions (“PAR” and “NAR”) and regions not PAR or NAR in rhesus orthologous (“neutral”).
(H) Fold change of average expression between human and rhesus macaque for genes flanking the RIEs with their NARs mapped to neutral, functional conserved NARs and sequence identical NARs in rhesus macaque orthologous sequences (∗ p-value <0.05, ∗∗ p-value <0.001, ∗∗∗ p-value <10−6, the Wilcoxon rank-sum test).
Fetal liver and adult liver cells may utilize different sets of non-coding regulatory elements marked by H3K27ac peaks, leading to divergent biological functions. Our motif enrichment analysis in H3K27ac regions revealed that, in fetal liver, the top enriched TFBSs, including TET and DNMT1, are associated with HSC numbers and epigenetic regulation in postnatal liver growth and regeneration, unlike in adult liver.54,55 This is consistent with previous studies highlighting the interactions between HSCs and fetal liver cells during liver development.56
Evolutionarily gained repressor binding sites in repressive impact enhancers
Next, we explored the evolutionary origin of repressor binding sites within RIEs. First, we observed that enhancers enriched for PARs undergo robust negative selection according to the Direction of Selection (DoS) metric (Figure 3F, the McDonald-Kreitman test, see STAR Methods). In contrast, RIEs exhibit the signature of a marginal negative selection pressure (Figure 3F). This suggests a weak selective constraint on RIEs, potentially permitting gradual loss and gain of repressive TFBSs during evolution and active fine-tuning of gene expression. To probe whether this diminished constraint is linked to gene regulation specific to humans, we extracted orthologous sequences of PARs and NARs in HepG2 enhancers from the rhesus macaque genome marked by H3K27ac in rhesus macaque liver tissue and predicted PARs and NARs within these orthologous regions in rhesus (see STAR Methods).
Most PARs (58.7%, p-value < 0.001, permutation test) and NARs (54.2%, p-value < 0.001) have identical DNA sequences between human and rhesus macaque orthologous, consistent with the high similarity of the genomes between human and rhesus macaque (Figure 3G). Notably, a substantial proportion of NARs found in humans (28.4%, p < 0.08), of which the sequences are not identical to their rhesus macaque counterparts due to sequence changes, were also identified as NARs in rhesus macaques, implying functional conservation with partial sequence conservation among this group of repressor binding sites. Interestingly, a large fraction of NARs in humans (16.7%, p-value < 0.001) were mapped to the neutral regions (neither PAR nor NAR) in rhesus macaque sequence counterparts. This indicates that this subset of NARs in human enhancers likely emerged from either neutral sequences or non-liver-specific binding sites present in the rhesus macaque genome via evolutionary changes. This observation aligns with our earlier findings of marginal negative selection in RIEs. Only a small fraction of human NARs (0.7%, p-value = 0.38) overlapped with the PARs identified in rhesus macaque enhancers, suggesting that the direct transition from activator to repressor TFBSs is a rare event. A similar trend is also observed in the gain of PARs in human enhancers, with a larger fraction of PARs being conserved (30.8%, p-value < 0.12) and a lower fraction being neutrally derived (9.6%, p-value < 0.003) when compared to their rhesus macaque counterparts.
To further investigate the evolutionary pattern of these NARs derived from neutral rhesus macaque sequences, we assessed their conservation in primates and placentals, categorizing them as conserved or non-conserved (Figure S4A). We found that approximately 53% of these NARs are human-specific, with no conservation in primates or placentals. About 14% are conserved only in primates, and 19% are conserved in both primates and placentals (Figure S4B).
We speculate that these emerged NARs in human enhancers are associated with acquired repressed enhancer activities and expression-modulating effects on nearby genes. To test this, we focused on gene expression profiles in human prenatal stages (12–20 wpc) and the compatible rhesus macaque gestation stages (e93-e130) using published experimental data.46,57 We computed the fold-change value as the average gene expression in humans divided by the average expression of the same set of genes in rhesus macaque flanking RIEs, binning them into NARs derived from neutral sequences, NARs with diverged sequences but functionally conserved and NARs with identical sequence in rhesus macaque. This fold-change value indicates the change of gene expression between the two species, which partially reflects the change in the regulatory activity of nearby enhancers. Our result shows that the fold change associated with the emerged NARs in humans but neutral sequences in rhesus macaque is about 30% lower (0.68, p-value < 10−20, the Wilcoxon rank-sum test) than the functionally conserved NARs (1.01), identical sequence NARs (1.09) and all genes flanking mappable RIEs as control level (1.04), suggesting the acquisition of repressive effects in human enhancers associated with these newly derived NARs (Figure 3H). These findings provide insight into the potential origins of newly gained repressor binding sites within human enhancers during evolution, implying an evolutionary path that vertebrate species have traversed.
Instances of positive activity region and negative activity regions influenced by experimentally identified causal variants
In agreement with the role of activator and repressor binding sites in the regulation of gene expression, we observed a substantial concurrence between experimentally validated causal variants and predicted PAR and NAR regions within liver enhancers. We collected 10 causal variants validated by experiments from previous studies, including rs17293632,58 rs1967017,59 rs10889352,60 rs11603334,61 rs2291702,62 rs6712203,63 rs1421085,8 rs12740374,64 rs2266788,65 and rs9987289.66 Our model correctly predicted the directional effects on enhancer activity for all 10 variants (Figure 4A). Here we focused on two examples of causal variants with available experimental validation data. The variant rs17293632 has been shown to have a damaging effect on enhancer activity,58,67,68 while the rs9987289 has a protective effect,66,69,70,71 which showed the largest effects on enhancer activities in our predictions. To elucidate these findings further, we present epigenomic profiles and TF binding events obtained from ChIP-seq experiments.
Figure 4.

Instances of PAR and NAR influenced by experimentally identified causal variants
(A) Comparison between computational predicted effect (PARs and NARs) and experimentally identified effects on enhancer activities for a list of 10 published causal variants. Blue color: enhancer activity decreases after mutation. Red color: enhancer activity increases after mutation.
(B) Selected ChIP-seq profiles depicting epigenetic marks and TF binding patterns in the vicinity of the causal variant rs17293632 in the HepG2 cell line. This SNP coincides with a binding site for the AP-1 family of TFs.
(C) Epigenetic and TF binding ChIP-seq profiles for the causal variant rs9987289 in the HepG2 cell line. Notably, this SNP aligns with a binding site for HNF4A.
The rs17293632 variant, identified as an eQTL for SMAD3 expression in human thyroid tissue, exerts a pronounced influence on enhancer activity.67,72 GTEx portal (v8) shows that rs17293632 is an eQTL in thyroid (SMAD3, PIAS1), esophagus-mucosa (SMAD3, AAGAB), and whole blood (AAGAB), suggesting that the enhancer containing this variant is potentially active across multiple cell types, including HepG2, as evidenced by active enhancer marks and TF ChIP-seq signals in HepG2. Its (T) allele markedly disrupts enhancer functionality by obstructing the transcriptional activity of AP-1 TFs.58,67 The rs17293632 variant resides within regions delineated by HepG2-specific ChIP-seq peaks, including the open chromatin domain of DHS and histone marks of H3K27ac and H3K4me1. This variant is situated squarely within a predicted PAR region, in concordance with its disruptive impact on enhancer activity upon mutations. Furthermore, it is located within the ChIP-seq peaks of FOSL2 and JUND TFs in the HepG2 cell line, aligning precisely with prior observations of interference in AP-1 family TFBSs (Figure 4B).
The opposite regulatory effect can be attributed to rs9987289, a liver-specific eQTL linked to a spectrum of liver-related phenotypes, including effects on low-density lipoprotein (LDL) cholesterol levels and high-density lipoprotein (HDL) cholesterol levels.66,69,70 This variant exhibits an allelic bias in binding affinity for Hepatocyte Nuclear Factor 4 Alpha (HNF4A), with the (A) allele being associated with aberrated HNF4A binding and, notably, substantially reduced expression of the TNKS gene.66 While HNF4A is conventionally acknowledged as a transcriptional activator, it has also been observed to play a role in transcriptional repression, as substantiated in previous studies.73,74,75 Our investigation has disclosed that rs9987289 resides within a computationally predicted NAR region and an HNF4A binding site, suggesting a potential strengthening of enhancer activity in response to mutations. This inference harmonizes with the empirical observation of repressive effects and the corresponding ChIP-seq signal of HNF4A within this genetic locus (Figure 4C).
These instances serve to underscore the agreement between the predicted regulatory effects of PARs and NARs and their experimentally verified mutational effects within human liver enhancers. They provide additional support of robustness to our methodology, affirming its proficiency in pinpointing activity regions within regulatory elements.
Discussion
The functional consequences and evolutionary transformations associated with enhancers enriched for repressor binding sites remain unclear. In our study, we used deep learning to systematically delineate positive and negative activity regions within HepG2 enhancers, aiming to elucidate their intricate interplay and regulatory roles. Our investigation reveals that PARs, characterized by their capacity to strengthen enhancer activity, exhibit an enrichment of activator TFBSs, including those associated with pioneer factors. In contrast, NARs, characterized by their negative influence on enhancer scores, are notably enriched in transcriptional repressor binding sites. The enhancer activity and nearby gene expression are in pronounced positive correlation with the increased abundance of PARs, whereas a corresponding negative correlation is observed with the accumulation of NARs.
Of particular interest is the discernible change in gene expression within the vicinity of RIEs during later stages of liver development. This observation suggests a modulating role of RIEs in the regulatory activity of enhancers associated with the expression of genes critical to developmental processes. Our study reveals the adaptation of those genes subject to this modulated regulation toward achieving moderate rather than drastic changes in expression levels, thereby ensuring the preservation of function while simultaneously facilitating adaptive evolution. We also observed differences in the evolutionary dynamics of NARs and PARs within human liver enhancers when compared to their counterparts in the rhesus macaque genome. While most PARs and NARs are preserved between the two species, more than 16% of NARs in human RIEs are derived from neutral DNA in the rhesus macaque genome, leading to diminished enhancer-based gene upregulation and subsequent decline in gene expression in humans. The accumulation of both activator and repressor binding sites within human enhancers potentially implies an increased diversity of TFs and more complex TF-TF combinations, which in turn, enhances the capacity for intricate and multifaceted gene regulation in the human genome.
Our investigation has established that enhancers enriched with NARs play a pivotal role in the fine-tuning of gene regulation. RIEs do not act in isolation—the genetic loci housing RIEs also exhibit a concurrent enrichment of typical enhancers. In contrast, loci harboring silencers exhibit a marked depletion of active enhancers (Figure S3C). Furthermore, we observe that the expression level of nearby genes associated with RIEs is significantly higher compared to genes associated with silencers. This observation leads us to postulate that RIEs provide an additional layer of fine-tuned modulation of gene expression that complements the regulatory orchestration conducted by neighboring typical enhancers within the same locus and is an alternative to robust and stringent repressive mechanisms established by silencers.
In conclusion, we systematically explored HepG2 enhancers and profiled enhancers enriched for repressor binding sites. We showed that the activities of these enhancers are trimmed, and their nearby gene expression is modulated during late development. Repressor binding sites in these enhancers appear to have undergone evolutionary expansion, indicating the refined and intricately orchestrated nature of gene regulation in humans.
Limitations of the study
This work demonstrates an interplay of activator and repressor TFs in enhancer regions. Other regulatory elements such as silencers and insulators are not the focus of this study, though they may coordinate with enhancers for gene regulation. In addition, the TREDNet DL model is trained on an empirically established enhancer set, defined as open chromatin regions (DHS) marked by H3K27ac and H3K4me1 histone modifications. This highly confident but not the most comprehensive set may limit the ability of the model to detect potential enhancer elements without these histone modifications.
Resource availability
Lead contact
Further information and requests for resources should be directed to and will be fulfilled by the lead contact, Ivan Ovcharenko (ovcharen@nih.gov).
Materials availability
This study did not generate new unique reagents.
Data and code availability
-
•
The files of the HepG2 enhancers, RIE enhancers, positive and negative activity regions used in this study are deposited to Zenodo (https://zenodo.org/records/14502340).
-
•
The study utilized TREDNet, which is a multi-phase DL framework composed of three consecutive convolutional neural networks (CNNs). This model is developed by our research group for the accurate prediction of enhancer regions and mutational effects in base-pair resolution.25 The TREDNet DL model can be found in Zenodo (https://doi.org/10.5281/zenodo.8161621).
-
•
All experimental datasets used in this study are publicly available and listed in the key resources table and supplemental file “Table S1.”
Acknowledgments
This work utilized the computational resources of the NIH High Performance Computing (HPC) Biowulf cluster (http://hpc.nih.gov). This work was supported by the Intramural Research Program (IRP) of the National Library of Medicine (NLM), National Institutes of Health (NIH).
Author contributions
I.O. conceived and designed the study. W.S. established the computational framework and analyzed the data. W.S. and I.O. wrote the article. All authors read and approved the final article.
Declaration of interests
The authors declare no competing interests.
STAR★Methods
Key resources table
| REAGENT or RESOURCE | SOURCE | IDENTIFIER |
|---|---|---|
| Deposited data | ||
| HepG2 enhancers, RIE enhancers, positive and negative activity regions | Zenodo | https://zenodo.org/records/14502340 |
| Experimental models: Cell lines | ||
| HepG2 (K3K27ac, H3K4me1, H3K27me3 and DNase) | Roadmap project | https://egg2.wustl.edu/roadmap/data/byFileType/peaks/consolidated/narrowPeak/ |
| TFs ChIP-seq experiments in HepG2 | ENCODE project | https://hgdownload.soe.ucsc.edu/goldenPath/hg19/encodeDCC/ |
| Reporter assay QTLs (raQTLs) in HepG2 | Database: GSE128325 | https://www.nature.com/articles/s41588-019-0455-2 |
| STARR-seq data in HepG2 | ENCODE project ENCSR135NXN |
https://genomebiology.biomedcentral.com/articles/10.1186/s13059-020-02194-x |
| Sharpr-MPRA data in HepG2 | Database: GSE71279 | https://www.nature.com/articles/nbt.3678 |
| H3K27ac ChIP-seq peaks in rhesus liver tissues | ArrayExpress accession number E-MTAB-2633 | https://www.sciencedirect.com/science/article/pii/S0092867415000070 |
| Gene expression profile for developmental and adulthood stages in the human liver | ArrayExpress accession number E-MTAB-6814 | https://www.nature.com/articles/s41586-019-1338-5 |
| Files of HepG2 enhancers, RIE enhancers, PAR and NAR identified in this study are deposited in Zenodo | Zenodo | https://zenodo.org/records/14502340 |
| Software and algorithms | ||
| TREDNet deep learning model | https://www.pnas.org/doi/10.1073/pnas.2206612120 | https://zenodo.org/records/8161621 |
| FIMO | https://meme-suite.org/meme/doc/fimo.html | MEME Suite |
Experimental model and study participant details
Not applicable to this study. This work is a computational study, and all experimental data used for analysis are retrieved from previous publications which are publicly available.
Method details
TREDNet DL model and calculation of delta score
The study utilized TREDNet, a DL model developed by our research group for accurate prediction of enhancer regions and mutational effects in base-pair resolution.25 TREDNet is a multi-phase DL framework composed of three consecutive convolutional neural networks (CNNs). These CNNs serve different purposes: the first CNN predicts epigenomic signals across the genome, the second predicts enhancers, and the third predicts activity regions. The enhancer prediction score generated by TREDNet serves as a measure of the regulatory activity of the target DNA sequence.
To evaluate the effects of point mutations on enhancer activity, we performed in-silico saturated mutagenesis of enhancer regions. For each 400-base pair enhancer region, we calculated a delta score for each nucleotide position in comparison to the GRCh37/hg19 reference sequence. This calculation involved iteratively mutating each nucleotide to all possible alternatives while keeping the remaining 399 nucleotides the same as the reference sequence. The delta score was computed using the formula:
| (Equation 1) |
Where:
“e” represents the probability that the 400-base pair sequence is an enhancer.
“reference” indicates the GRCh37 reference nucleotide.
“alternate” indicates a non-reference nucleotide.
The delta score, calculated for each nucleotide position within the 400-base pair enhancer region, provides insights into the effects of mutations at specific bases on the overall enhancer probability of the region. A positive delta score indicates that a reference nucleotide at that position has an activating effect on the enhancer, while a negative delta score suggests a repressive effect of the reference nucleotide on the enhancer.
Detection of positive and negative activity regions (PARs and NARs)
For HepG2 enhancers, we employed two separate DL models (part of the TREDNet model’s third phase) to predict positive activity regions (PARs) and negative activity regions (NARs). The PAR classifier assigned a label of 1 (positive) to nucleotides within enhancers that overlapped with a ChIP-seq TFBS and 0 (control) otherwise. We excluded certain regions from the control set, specifically: (i) regions between any two TFBSs within an enhancer, (ii) regions within 10bp of a TFBS, (iii) regions within 20bp of an enhancer boundary, and (iv) regions in enhancers less than 50bp in length. We utilized TFBSs identified in ChIP-seq peaks from 86 HepG2 TFs using FIMO.29
To predict TFBS locations within enhancer sequences, we derived features from delta score predictions across various window sizes. For each nucleotide, we examined the delta profiles of windows ranging from 10bp to 1bp in length that overlaps the target nucleotide. For windows longer than 7bp, we defined a core region as the central 6bp. For each nucleotide, we calculated the following delta profiles metrics across all window sizes: (i) the average delta score of nucleotides within the window, (ii) the maximum delta score within the window, (iii) the fraction of nucleotides with a positive delta score within the window, and (iv) the fraction of nucleotides with a positive delta score within the core region.
The same procedure was repeated for NAR models. We then identified regions with a minimum of 5 consecutive predicted activating (positive delta) and repressive (negative delta) nucleotides (false positive rate < 0.01) as PARs and NARs, respectively. For a more detailed model description, please refer to the TREDNet paper.25
Quantification and statistical analysis
Statistical tests
The Statistical tests used in this study include the binomial test, the Wilcoxon rank-sum test and the permutation test, with ∗ p-value < 0.05, ∗∗ p-value < 0.001, ∗∗∗ p-value < 10-6. Also indicated in figure legends.
Datasets used and definition of enhancers
Genome-wide ChIP-seq datasets for histone marks, DNase I-hypersensitive sites (DHSs), and TFBSs were obtained from the Encyclopedia of DNA Elements (ENCODE) project.76 To comprehend the regulatory impact of active regions in enhancers, we retrieved the liver-specific raQTL dataset.28 This dataset captures genetic variants associated with the activity of putative regulatory elements in HepG2 cells. Additionally, we acquired the activity scores of HepG2 segments from STARR-seq experiments conducted as part of this study.40 These scores provide valuable insights into the functional activity of enhancer regions in the HepG2 cell line. Promoters, which represent regions crucial for gene transcription initiation, were defined as sequences spanning 1,500 bp upstream and 500 bp downstream from the transcription start site (TSS) of UCSC-annotated 'known genes'.77
Enhancers in HepG2 were rigorously defined based on a set of criteria. Specifically, HepG2 enhancers were designated as 400 base pair (bp) segments, with their centers aligned to the centers of DHS regions. These DHS regions were further required to exhibit overlapping signals in both H3K27ac and H3K4me1 histone marks, indicating their active enhancer status. Any segments found to overlap with promoter regions or exonic sequences were excluded from the enhancer set, ensuring that only distal regulatory elements were considered. Silencers in HepG2 were defined similarly as the DHS regions overlapping H3K27me3 but not H3K27ac marks.
TFBS enrichment
To calculate the enrichment of TF ChIP-seq peaks in enhancers containing PAR and NAR, we compute the fold value. This value is determined as dividing the density of ChIP-seq peaks for a specific TF within enhancers by the density of the same TF in a control set. The control set comprises one-fold DHS (DNase I hypersensitivity) regions randomly selected from non-liver tissues, each truncated to a length of 400 bp from the center position.
For the enrichment of computationally predicted TFBSs in PAR and NAR within HepG2 enhancers, we employ the FIMO tool with position weight matrices (PWMs) sourced from a combined database, including PWMs from ENCODE76 and JASPAR.78 We only included the predicted TFBSs of which the center positions situated inside the PARs or NARs. The fold enrichment value is computed following the same procedure as previously described.
Gene expression and the number of PARs and NARs in enhancers
The gene expression profile, spanning multiple developmental and adulthood stages in the liver, is sourced from this study.46 For each enhancer, we collect the expression levels of their flanking genes. To calculate the correlation between the number of PARs and NARs and their associated gene expression, we consider only genes uniquely associated with either the “PAR only” or “NAR only” subsets, excluding genes shared by both subsets. The Gene expression profile for HepG2 is approximated by merging the profiles from “teenager” to “senior” stages and used for analysis in Figures 2E and 2F. RNA-Seq data from HepG2 is download from Roadmap project (https://egg2.wustl.edu/roadmap/data/byDataType/rna/expression/57epigenomes.RPKM.pc.gz).
Activating and repressive activity for PAR and NAR
The activating and repressive bins in the HepG2 cell line are obtained from the Sharpr-MPRA paper.12 For enhancers enriched in NARs, we calculate both the number of Sharpr identified activating and repressive nucleotides located within NARs. The fold value is then determined by dividing the number of overlapped repressive nucleotides by the number of overlapped activating nucleotides for each subset of enhancers. A similar procedure is applied to PAR enriched enhancers.
Direction of selection
The Direction of Selection (DoS) test, a refinement of the McDonald-Kreitman test,79 is employed to assess the direction and extent of deviation from neutral selection. In this context, we utilize fourfold degenerate sites with mutations as the reference to gauge selection on mutations within enhancers containing PARs and NARs:
| (Equation 2) |
Where:
“n” represents “nonsynonymous” sites, denoting mutations within enhancers containing exclusively PARs or exclusively NARs.
“s” signifies “synonymous” sites, referring to the mutated fourfold degenerate sites.
“D” stands for “diverged” sites, which are mutations (or substitutions) fixed in human populations.
“P” denotes “polymorphic” sites, where both the ancestral allele and the mutations are retained in human populations.
Evolutionary gain of NARs in human enhancers
To identify orthologous sequences in rhesus macaques, we employed the pairwise sequence alignment dataset downloaded from UCSC genome browser to map active regions in human HepG2 enhancers to the rhesus genome. We only retained orthologous sequences that overlap with H3K27ac ChIP-seq peaks in rhesus liver tissues.80
To provide the justification of applying human HepG2 enhancer model to rhesus liver enhancers, we performed the cross-species prediction using DL. The HepG2 model distinguished rhesus liver enhancers from background DHS regions with a lower but reasonable accuracy (auROC=0.82) compared with human HepG2 enhancers (auROC=0.91) and it can hardly distinguish between human HepG2 and rhesus liver enhancers (auROC=0.64), which suggests the high similarity between the two sets of enhancers. To exclude the potential influence of diverged flanking context of the enhancers between human and rhesus, we embedded the rhesus orthologous sequences into the human context sequences by replacing only one of their counterpart PAR or NAR sequences at a time and keep the rest human context sequences unchanged, to form a group of mixed enhancer sequences with only one PAR or NAR sequence replaced. In-silico mutagenesis was then conducted on these mixed regions to generate delta scores and annotate PARs and NARs using the human HepG2 TREDNet model.
We calculated p-values by randomly shuffling labels for four categories—from PAR, NAR, neutral, and identical in rhesus—across either NAR or PAR regions, performing this permutation 1000 times. For each permutation, we computed the fraction of regions classified as ‘NAR from neutral’ by dividing the number of correctly labeled ‘NAR from neutral’ regions by the total number of original ‘NAR from neutral’ regions. The results indicate that the most significant conversions occur from identical and neutral sequences to PAR/NAR (p < 0.003). Conversions within the same type of regions (NAR from NAR, p = 0.08; PAR from PAR, p = 0.12) are evident but not statistically significant. Conversions between different types of regions are not significant, likely due to low occurrence (p = 0.37).
Published: December 20, 2024
Footnotes
Supplemental information can be found online at https://doi.org/10.1016/j.isci.2024.111658.
Supplemental information
References
- 1.Mitchell P.J., Tjian R. Transcriptional regulation in mammalian cells by sequence-specific DNA binding proteins. Science. 1989;245:371–378. doi: 10.1126/science.2667136. [DOI] [PubMed] [Google Scholar]
- 2.Lee T.I., Young R.A. Transcriptional regulation and its misregulation in disease. Cell. 2013;152:1237–1251. doi: 10.1016/j.cell.2013.02.014. [DOI] [PMC free article] [PubMed] [Google Scholar]
- 3.Lambert S.A., Jolma A., Campitelli L.F., Das P.K., Yin Y., Albu M., Chen X., Taipale J., Hughes T.R., Weirauch M.T. The Human Transcription Factors. Cell. 2018;172:650–665. doi: 10.1016/j.cell.2018.01.029. [DOI] [PubMed] [Google Scholar]
- 4.Bernadt C.T., Nowling T., Wiebe M.S., Rizzino A. NF-Y behaves as a bifunctional transcription factor that can stimulate or repress the FGF-4 promoter in an enhancer-dependent manner. Gene Expr. 2005;12:193–212. doi: 10.3727/000000005783992052. [DOI] [PMC free article] [PubMed] [Google Scholar]
- 5.Adkins N.L., Hagerman T.A., Georgel P. GAGA protein: a multi-faceted transcription factor. Biochem. Cell. Biol. 2006;84:559–567. doi: 10.1139/o06-062. [DOI] [PubMed] [Google Scholar]
- 6.Parker D.S., White M.A., Ramos A.I., Cohen B.A., Barolo S. The cis-regulatory logic of Hedgehog gradient responses: key roles for gli binding affinity, competition, and cooperativity. Sci. Signal. 2011;4 doi: 10.1126/scisignal.2002077. [DOI] [PMC free article] [PubMed] [Google Scholar]
- 7.Zeitlinger J. Seven myths of how transcription factors read the cis-regulatory code. Curr. Opin. Syst. Biol. 2020;23:22–31. doi: 10.1016/j.coisb.2020.08.002. [DOI] [PMC free article] [PubMed] [Google Scholar]
- 8.Claussnitzer M., Dankel S.N., Kim K.H., Quon G., Meuleman W., Haugen C., Glunk V., Sousa I.S., Beaudry J.L., Puviindran V., et al. FTO Obesity Variant Circuitry and Adipocyte Browning in Humans. N. Engl. J. Med. 2015;373:895–907. doi: 10.1056/NEJMoa1502214. [DOI] [PMC free article] [PubMed] [Google Scholar]
- 9.Jiang Z., Huang Y., Zhang P., Han C., Lu Y., Mo Z., Zhang Z., Li X., Zhao S., Cai F., et al. Characterization of a pathogenic variant in GBA for Parkinson's disease with mild cognitive impairment patients. Mol. Brain. 2020;13:102. doi: 10.1186/s13041-020-00637-x. [DOI] [PMC free article] [PubMed] [Google Scholar]
- 10.Cooper Y.A., Teyssier N., Dräger N.M., Guo Q., Davis J.E., Sattler S.M., Yang Z., Patel A., Wu S., Kosuri S., et al. Functional regulatory variants implicate distinct transcriptional networks in dementia. Science. 2022;377 doi: 10.1126/science.abi8654. [DOI] [PubMed] [Google Scholar]
- 11.Lim F., Solvason J.J., Ryan G.E., Le S.H., Jindal G.A., Steffen P., Jandu S.K., Farley E.K. Affinity-optimizing enhancer variants disrupt development. Nature. 2024;626:151–159. doi: 10.1038/s41586-023-06922-8. [DOI] [PMC free article] [PubMed] [Google Scholar]
- 12.Ernst J., Melnikov A., Zhang X., Wang L., Rogov P., Mikkelsen T.S., Kellis M. Genome-scale high-resolution mapping of activating and repressive nucleotides in regulatory regions. Nat. Biotechnol. 2016;34:1180–1190. doi: 10.1038/nbt.3678. [DOI] [PMC free article] [PubMed] [Google Scholar]
- 13.Hansen T.J., Hodges E. ATAC-STARR-seq reveals transcription factor--bound activators and silencers within chromatin-accessible regions of the human genome. Genome Res. 2022;32:1529–1541. doi: 10.1101/gr.276766.122. [DOI] [PMC free article] [PubMed] [Google Scholar]
- 14.Zhou J., Troyanskaya O.G. Predicting effects of noncoding variants with deep learning-based sequence model. Nat. Methods. 2015;12:931–934. doi: 10.1038/nmeth.3547. [DOI] [PMC free article] [PubMed] [Google Scholar]
- 15.Avsec Ž., Weilert M., Shrikumar A., Krueger S., Alexandari A., Dalal K., Fropf R., McAnany C., Gagneur J., Kundaje A., Zeitlinger J. Base-resolution models of transcription-factor binding reveal soft motif syntax. Nat. Genet. 2021;53:354–366. doi: 10.1038/s41588-021-00782-6. [DOI] [PMC free article] [PubMed] [Google Scholar]
- 16.Yuan H., Kelley D.R. scBasset: sequence-based modeling of single-cell ATAC-seq using convolutional neural networks. Nat. Methods. 2022;19:1088–1096. doi: 10.1038/s41592-022-01562-8. [DOI] [PubMed] [Google Scholar]
- 17.Khamis A.M., Motwalli O., Oliva R., Jankovic B.R., Medvedeva Y.A., Ashoor H., Essack M., Gao X., Bajic V.B. A novel method for improved accuracy of transcription factor binding site prediction. Nucleic Acids Res. 2018;46:e72. doi: 10.1093/nar/gky237. [DOI] [PMC free article] [PubMed] [Google Scholar]
- 18.Alipanahi B., Delong A., Weirauch M.T., Frey B.J. Predicting the sequence specificities of DNA- and RNA-binding proteins by deep learning. Nat. Biotechnol. 2015;33:831–838. doi: 10.1038/nbt.3300. [DOI] [PubMed] [Google Scholar]
- 19.Ji Y., Zhou Z., Liu H., Davuluri R.V. DNABERT: pre-trained Bidirectional Encoder Representations from Transformers model for DNA-language in genome. Bioinformatics. 2021;37:2112–2120. doi: 10.1093/bioinformatics/btab083. [DOI] [PMC free article] [PubMed] [Google Scholar]
- 20.van Dijk D., Sharon E., Lotan-Pompan M., Weinberger A., Segal E., Carey L.B. Large-scale mapping of gene regulatory logic reveals context-dependent repression by transcriptional activators. Genome Res. 2017;27:87–94. doi: 10.1101/gr.212316.116. [DOI] [PMC free article] [PubMed] [Google Scholar]
- 21.Jacobs J., Pagani M., Wenzl C., Stark A. Widespread regulatory specificities between transcriptional co-repressors and enhancers in Drosophila. Science. 2023;381:198–204. doi: 10.1126/science.adf6149. [DOI] [PubMed] [Google Scholar]
- 22.Xie X., Mikkelsen T.S., Gnirke A., Lindblad-Toh K., Kellis M., Lander E.S. Systematic discovery of regulatory motifs in conserved regions of the human genome, including thousands of CTCF insulator sites. Proc. Natl. Acad. Sci. USA. 2007;104:7145–7150. doi: 10.1073/pnas.0701811104. [DOI] [PMC free article] [PubMed] [Google Scholar]
- 23.Schmidt D., Wilson M.D., Ballester B., Schwalie P.C., Brown G.D., Marshall A., Kutter C., Watt S., Martinez-Jimenez C.P., Mackay S., et al. Five-vertebrate ChIP-seq reveals the evolutionary dynamics of transcription factor binding. Science. 2010;328:1036–1040. doi: 10.1126/science.1186176. [DOI] [PMC free article] [PubMed] [Google Scholar]
- 24.Taskiran I.I., Spanier K.I., Dickmänken H., Kempynck N., Pancikova A., Eksi E.C., Hulselmans G., Ismail J.N., Theunis K., Vandepoel R., et al. Cell type directed design of synthetic enhancers. Nature. 2023;626:212–220. doi: 10.1038/s41586-023-06936-2. [DOI] [PMC free article] [PubMed] [Google Scholar]
- 25.Hudaiberdiev S., Taylor D.L., Song W., Narisu N., Bhuiyan R.M., Taylor H.J., Tang X., Yan T., Swift A.J., Bonnycastle L.L., et al. Modeling islet enhancers using deep learning identifies candidate causal variants at loci associated with T2D and glycemic traits. Proc. Natl. Acad. Sci. USA. 2023;120 doi: 10.1073/pnas.2206612120. [DOI] [PMC free article] [PubMed] [Google Scholar]
- 26.Moyers B.A., Partridge E.C., Mackiewicz M., Betti M.J., Darji R., Meadows S.K., Newberry K.M., Brandsmeier L.A., Wold B.J., Mendenhall E.M., Myers R.M. Characterization of human transcription factor function and patterns of gene regulation in HepG2 cells. Genome Res. 2023;33:1879–1892. doi: 10.1101/gr.278205.123. [DOI] [PMC free article] [PubMed] [Google Scholar]
- 27.Shah M., Funnell A.P.W., Quinlan K.G.R., Crossley M. Hit and Run Transcriptional Repressors Are Difficult to Catch in the Act. Bioessays. 2019;41 doi: 10.1002/bies.201900041. [DOI] [PubMed] [Google Scholar]
- 28.van Arensbergen J., Pagie L., FitzPatrick V.D., de Haas M., Baltissen M.P., Comoglio F., van der Weide R.H., Teunissen H., Võsa U., Franke L., et al. High-throughput identification of human SNPs affecting regulatory element activity. Nat. Genet. 2019;51:1160–1169. doi: 10.1038/s41588-019-0455-2. [DOI] [PMC free article] [PubMed] [Google Scholar]
- 29.Grant C.E., Bailey T.L., Noble W.S. FIMO: scanning for occurrences of a given motif. Bioinformatics. 2011;27:1017–1018. doi: 10.1093/bioinformatics/btr064. [DOI] [PMC free article] [PubMed] [Google Scholar]
- 30.Yu J.M., Sun W., Hua F., Xie J., Lin H., Zhou D.D., Hu Z.W. BCL6 induces EMT by promoting the ZEB1-mediated transcription repression of E-cadherin in breast cancer cells. Cancer Lett. 2015;365:190–200. doi: 10.1016/j.canlet.2015.05.029. [DOI] [PubMed] [Google Scholar]
- 31.Wang H., Matise M.P. Tcf7l2/Tcf4 Transcriptional Repressor Function Requires HDAC Activity in the Developing Vertebrate CNS. PLoS One. 2016;11 doi: 10.1371/journal.pone.0163267. [DOI] [PMC free article] [PubMed] [Google Scholar]
- 32.Batlle E., Sancho E., Francí C., Domínguez D., Monfar M., Baulida J., García De Herreros A. The transcription factor snail is a repressor of E-cadherin gene expression in epithelial tumour cells. Nat. Cell Biol. 2000;2:84–89. doi: 10.1038/35000034. [DOI] [PubMed] [Google Scholar]
- 33.Carver E.A., Jiang R., Lan Y., Oram K.F., Gridley T. The mouse snail gene encodes a key regulator of the epithelial-mesenchymal transition. Mol. Cell Biol. 2001;21:8184–8188. doi: 10.1128/MCB.21.23.8184-8188.2001. [DOI] [PMC free article] [PubMed] [Google Scholar]
- 34.Hsu D.S.S., Wang H.J., Tai S.K., Chou C.H., Hsieh C.H., Chiu P.H., Chen N.J., Yang M.H. Acetylation of snail modulates the cytokinome of cancer cells to enhance the recruitment of macrophages. Cancer Cell. 2014;26:534–548. doi: 10.1016/j.ccell.2014.09.002. [DOI] [PubMed] [Google Scholar]
- 35.Stanisavljevic J., Porta-de-la-Riva M., Batlle R., de Herreros A.G., Baulida J. The p65 subunit of NF-κB and PARP1 assist Snail1 in activating fibronectin transcription. J. Cell Sci. 2011;124:4161–4171. doi: 10.1242/jcs.078824. [DOI] [PubMed] [Google Scholar]
- 36.Wolf B.K., Zhao Y., McCray A., Hawk W.H., Deary L.T., Sugiarto N.W., LaCroix I.S., Gerber S.A., Cheng C., Wang X. Cooperation of chromatin remodeling SWI/SNF complex and pioneer factor AP-1 shapes 3D enhancer landscapes. Nat. Struct. Mol. Biol. 2023;30:10–21. doi: 10.1038/s41594-022-00880-x. [DOI] [PMC free article] [PubMed] [Google Scholar]
- 37.Horisawa K., Udono M., Ueno K., Ohkawa Y., Nagasaki M., Sekiya S., Suzuki A. The Dynamics of Transcriptional Activation by Hepatic Reprogramming Factors. Mol. Cell. 2020;79:660–676.e8. doi: 10.1016/j.molcel.2020.07.012. [DOI] [PubMed] [Google Scholar]
- 38.Zhao R., Watt A.J., Li J., Luebke-Wheeler J., Morrisey E.E., Duncan S.A. GATA6 is essential for embryonic development of the liver but dispensable for early heart formation. Mol. Cell Biol. 2005;25:2622–2631. doi: 10.1128/MCB.25.7.2622-2631.2005. [DOI] [PMC free article] [PubMed] [Google Scholar]
- 39.Ji Z., Donaldson I.J., Liu J., Hayes A., Zeef L.A.H., Sharrocks A.D. The forkhead transcription factor FOXK2 promotes AP-1-mediated transcriptional regulation. Mol. Cell Biol. 2012;32:385–398. doi: 10.1128/MCB.05504-11. [DOI] [PMC free article] [PubMed] [Google Scholar]
- 40.Lee D., Shi M., Moran J., Wall M., Zhang J., Liu J., Fitzgerald D., Kyono Y., Ma L., White K.P., Gerstein M. STARRPeaker: uniform processing and accurate identification of STARR-seq active regions. Genome Biol. 2020;21:298. doi: 10.1186/s13059-020-02194-x. [DOI] [PMC free article] [PubMed] [Google Scholar]
- 41.Erceg J., Pakozdi T., Marco-Ferreres R., Ghavi-Helm Y., Girardot C., Bracken A.P., Furlong E.E.M. Dual functionality of cis-regulatory elements as developmental enhancers and Polycomb response elements. Genes Dev. 2017;31:590–602. doi: 10.1101/gad.292870.116. [DOI] [PMC free article] [PubMed] [Google Scholar]
- 42.Gisselbrecht S.S., Palagi A., Kurland J.V., Rogers J.M., Ozadam H., Zhan Y., Dekker J., Bulyk M.L. Transcriptional Silencers in Drosophila Serve a Dual Role as Transcriptional Enhancers in Alternate Cellular Contexts. Curr. Opin. Struct. Biol. 2020;77:324–337.e8. doi: 10.1016/j.molcel.2019.10.004. [DOI] [PMC free article] [PubMed] [Google Scholar]
- 43.Huang D., Ovcharenko I. Enhancer-silencer transitions in the human genome. Genome Res. 2022;32:437–448. doi: 10.1101/gr.275992.121. [DOI] [PMC free article] [PubMed] [Google Scholar]
- 44.Dickinson M.E., Flenniken A.M., Ji X., Teboul L., Wong M.D., White J.K., Meehan T.F., Weninger W.J., Westerberg H., Adissu H., et al. High-throughput discovery of novel developmental phenotypes. Nature. 2016;537:508–514. doi: 10.1038/nature19356. [DOI] [PMC free article] [PubMed] [Google Scholar]
- 45.White J.K., Gerdin A.K., Karp N.A., Ryder E., Buljan M., Bussell J.N., Salisbury J., Clare S., Ingham N.J., Podrini C., et al. Genome-wide generation and systematic phenotyping of knockout mice reveals new roles for many genes. Cell. 2013;154:452–464. doi: 10.1016/j.cell.2013.06.022. [DOI] [PMC free article] [PubMed] [Google Scholar]
- 46.Cardoso-Moreira M., Halbert J., Valloton D., Velten B., Chen C., Shao Y., Liechti A., Ascenção K., Rummel C., Ovchinnikova S., et al. Gene expression across mammalian organ development. Nature. 2019;571:505–509. doi: 10.1038/s41586-019-1338-5. [DOI] [PMC free article] [PubMed] [Google Scholar]
- 47.Yan L., Guo H., Hu B., Li R., Yong J., Zhao Y., Zhi X., Fan X., Guo F., Wang X., et al. Epigenomic Landscape of Human Fetal Brain, Heart, and Liver. J. Biol. Chem. 2016;291:4386–4398. doi: 10.1074/jbc.M115.672931. [DOI] [PMC free article] [PubMed] [Google Scholar]
- 48.DeLaForest A., Nagaoka M., Si-Tayeb K., Noto F.K., Konopka G., Battle M.A., Duncan S.A. HNF4A is essential for specification of hepatic progenitors from human pluripotent stem cells. Development. 2011;138:4143–4153. doi: 10.1242/dev.062547. [DOI] [PMC free article] [PubMed] [Google Scholar]
- 49.Parviz F., Matullo C., Garrison W.D., Savatski L., Adamson J.W., Ning G., Kaestner K.H., Rossi J.M., Zaret K.S., Duncan S.A. Hepatocyte nuclear factor 4alpha controls the development of a hepatic epithelium and liver morphogenesis. Nat. Genet. 2003;34:292–296. doi: 10.1038/ng1175. [DOI] [PubMed] [Google Scholar]
- 50.Hayhurst G.P., Lee Y.H., Lambert G., Ward J.M., Gonzalez F.J. Hepatocyte nuclear factor 4alpha (nuclear receptor 2A1) is essential for maintenance of hepatic gene expression and lipid homeostasis. Mol. Cell Biol. 2001;21:1393–1403. doi: 10.1128/MCB.21.4.1393-1403.2001. [DOI] [PMC free article] [PubMed] [Google Scholar]
- 51.Battle M.A., Konopka G., Parviz F., Gaggl A.L., Yang C., Sladek F.M., Duncan S.A. Hepatocyte nuclear factor 4alpha orchestrates expression of cell adhesion proteins during the epithelial transformation of the developing liver. Proc. Natl. Acad. Sci. USA. 2006;103:8419–8424. doi: 10.1073/pnas.0600246103. [DOI] [PMC free article] [PubMed] [Google Scholar]
- 52.Alder O., Cullum R., Lee S., Kan A.C., Wei W., Yi Y., Garside V.C., Bilenky M., Griffith M., Morrissy A.S., et al. Hippo signaling influences HNF4A and FOXA2 enhancer switching during hepatocyte differentiation. Cell Rep. 2014;9:261–271. doi: 10.1016/j.celrep.2014.08.046. [DOI] [PMC free article] [PubMed] [Google Scholar]
- 53.Iwafuchi-Doi M., Donahue G., Kakumanu A., Watts J.A., Mahony S., Pugh B.F., Lee D., Kaestner K.H., Zaret K.S. The Pioneer Transcription Factor FoxA Maintains an Accessible Nucleosome Configuration at Enhancers for Tissue-Specific Gene Activation. Mol. Cell. 2016;62:79–91. doi: 10.1016/j.molcel.2016.03.001. [DOI] [PMC free article] [PubMed] [Google Scholar]
- 54.Lu Y., Liu M., Yang J., Weissman S.M., Pan X., Katz S.G., Wang S. Spatial transcriptome profiling by MERFISH reveals fetal liver hematopoietic stem cell niche architecture. Cell Discov. 2021;7:47. doi: 10.1038/s41421-021-00266-1. [DOI] [PMC free article] [PubMed] [Google Scholar]
- 55.Kaji K., Factor V.M., Andersen J.B., Durkin M.E., Tomokuni A., Marquardt J.U., Matter M.S., Hoang T., Conner E.A., Thorgeirsson S.S. DNMT1 is a required genomic regulator for murine liver histogenesis and regeneration. Hepatology. 2016;64:582–598. doi: 10.1002/hep.28563. [DOI] [PMC free article] [PubMed] [Google Scholar]
- 56.Lewis K., Yoshimoto M., Takebe T. Fetal liver hematopoiesis: from development to delivery. Stem Cell Res. Ther. 2021;12:139. doi: 10.1186/s13287-021-02189-w. [DOI] [PMC free article] [PubMed] [Google Scholar]
- 57.Barry P.A., Lockridge K.M., Salamat S., Tinling S.P., Yue Y., Zhou S.S., Gospe S.M., Jr., Britt W.J., Tarantal A.F. Nonhuman primate models of intrauterine cytomegalovirus infection. ILAR J. 2006;47:49–64. doi: 10.1093/ilar.47.1.49. [DOI] [PubMed] [Google Scholar]
- 58.Turner A.W., Martinuk A., Silva A., Lau P., Nikpay M., Eriksson P., Folkersen L., Perisic L., Hedin U., Soubeyrand S., McPherson R. Functional Analysis of a Novel Genome-Wide Association Study Signal in SMAD3 That Confers Protection From Coronary Artery Disease. Arterioscler. Thromb. Vasc. Biol. 2016;36:972–983. doi: 10.1161/ATVBAHA.116.307294. [DOI] [PubMed] [Google Scholar]
- 59.Ketharnathan S., Leask M., Boocock J., Phipps-Green A.J., Antony J., O'Sullivan J.M., Merriman T.R., Horsfield J.A. A non-coding genetic variant maximally associated with serum urate levels is functionally linked to HNF4A-dependent PDZK1 expression. Hum. Mol. Genet. 2018;27:3964–3973. doi: 10.1093/hmg/ddy295. [DOI] [PubMed] [Google Scholar]
- 60.Oldoni F., Palmen J., Giambartolomei C., Howard P., Drenos F., Plagnol V., Humphries S.E., Talmud P.J., Smith A.J.P. Post-GWAS methodologies for localisation of functional non-coding variants: ANGPTL3. Atherosclerosis. 2016;246:193–201. doi: 10.1016/j.atherosclerosis.2015.12.009. [DOI] [PMC free article] [PubMed] [Google Scholar]
- 61.Kulzer J.R., Stitzel M.L., Morken M.A., Huyghe J.R., Fuchsberger C., Kuusisto J., Laakso M., Boehnke M., Collins F.S., Mohlke K.L. A common functional regulatory variant at a type 2 diabetes locus upregulates ARAP1 expression in the pancreatic beta cell. Am. J. Hum. Genet. 2014;94:186–197. doi: 10.1016/j.ajhg.2013.12.011. [DOI] [PMC free article] [PubMed] [Google Scholar]
- 62.Yoo T., Joo S.K., Kim H.J., Kim H.Y., Sim H., Lee J., Kim H.H., Jung S., Lee Y., Jamialahmadi O., et al. Disease-specific eQTL screening reveals an anti-fibrotic effect of AGXT2 in non-alcoholic fatty liver disease. J. Hepatol. 2021;75:514–523. doi: 10.1016/j.jhep.2021.04.011. [DOI] [PubMed] [Google Scholar]
- 63.Glunk V., Laber S., Sinnott-Armstrong N., Sobreira D.R., Strobel S.M., Batista T.M., Kubitz P., Moud B.N., Ebert H., Huang Y. A non-coding variant linked to metabolic obesity with normal weight affects actin remodelling in subcutaneous adipocytes. Nat. Metab. 2023;5:861–879. doi: 10.1038/s42255-023-00807-w. [DOI] [PMC free article] [PubMed] [Google Scholar]
- 64.Musunuru K., Strong A., Frank-Kamenetsky M., Lee N.E., Ahfeldt T., Sachs K.V., Li X., Li H., Kuperwasser N., Ruda V.M., et al. From noncoding variant to phenotype via SORT1 at the 1p13 cholesterol locus. Nature. 2010;466:714–719. doi: 10.1038/nature09266. [DOI] [PMC free article] [PubMed] [Google Scholar]
- 65.Caussy C., Charrière S., Marçais C., Di Filippo M., Sassolas A., Delay M., Euthine V., Jalabert A., Lefai E., Rome S., Moulin P. An APOA5 3' UTR variant associated with plasma triglycerides triggers APOA5 downregulation by creating a functional miR-485-5p binding site. Am. J. Hum. Genet. 2014;94:129–134. doi: 10.1016/j.ajhg.2013.12.001. [DOI] [PMC free article] [PubMed] [Google Scholar]
- 66.He Y., Chhetri S.B., Arvanitis M., Srinivasan K., Aguet F., Ardlie K.G., Barbeira A.N., Bonazzola R., Im H.K., GTEx Consortium sn-spMF: matrix factorization informs tissue-specific genetic regulation of gene expression. Genome Biol. 2020;21:235. doi: 10.1186/s13059-020-02129-6. [DOI] [PMC free article] [PubMed] [Google Scholar]
- 67.Miller C.L., Pjanic M., Wang T., Nguyen T., Cohain A., Lee J.D., Perisic L., Hedin U., Kundu R.K., Majmudar D., et al. Integrative functional genomics identifies regulatory mechanisms at coronary artery disease loci. Nat. Commun. 2016;7 doi: 10.1038/ncomms12092. [DOI] [PMC free article] [PubMed] [Google Scholar]
- 68.Zhao Q., Wirka R., Nguyen T., Nagao M., Cheng P., Miller C.L., Kim J.B., Pjanic M., Quertermous T. TCF21 and AP-1 interact through epigenetic modifications to regulate coronary artery disease gene expression. Genome Med. 2019;11:23. doi: 10.1186/s13073-019-0635-9. [DOI] [PMC free article] [PubMed] [Google Scholar]
- 69.Teslovich T.M., Musunuru K., Smith A.V., Edmondson A.C., Stylianou I.M., Koseki M., Pirruccello J.P., Ripatti S., Chasman D.I., Willer C.J., et al. Biological, clinical and population relevance of 95 loci for blood lipids. Nature. 2010;466:707–713. doi: 10.1038/nature09270. [DOI] [PMC free article] [PubMed] [Google Scholar]
- 70.Huang L.O., Rauch A., Mazzaferro E., Preuss M., Carobbio S., Bayrak C.S., Chami N., Wang Z., Schick U.M., Yang N., et al. Genome-wide discovery of genetic loci that uncouple excess adiposity from its comorbidities. Nat. Metab. 2021;3:228–243. doi: 10.1038/s42255-021-00346-2. [DOI] [PubMed] [Google Scholar]
- 71.Teslovich T.M., Kim D.S., Yin X., Stancáková A., Jackson A.U., Wielscher M., Naj A., Perry J.R.B., Huyghe J.R., Stringham H.M., et al. Identification of seven novel loci associated with amino acid levels using single-variant and gene-based tests in 8545 Finnish men from the METSIM study. Hum. Mol. Genet. 2018;27:1664–1674. doi: 10.1093/hmg/ddy067. [DOI] [PMC free article] [PubMed] [Google Scholar]
- 72.GTEx Consortium The Genotype-Tissue Expression (GTEx) project. Nat. Genet. 2013;45:580–585. doi: 10.1038/ng.2653. [DOI] [PMC free article] [PubMed] [Google Scholar]
- 73.DeLaForest A., Di Furio F., Jing R., Ludwig-Kubinski A., Twaroski K., Urick A., Pulakanti K., Rao S., Duncan S.A. HNF4A Regulates the Formation of Hepatic Progenitor Cells from Human iPSC-Derived Endoderm by Facilitating Efficient Recruitment of RNA Pol II. Genes. 2018;10 doi: 10.3390/genes10010021. [DOI] [PMC free article] [PubMed] [Google Scholar]
- 74.Qu M., Duffy T., Hirota T., Kay S.A. Nuclear receptor HNF4A transrepresses CLOCK:BMAL1 and modulates tissue-specific circadian networks. Proc. Natl. Acad. Sci. USA. 2018;115:E12305–E12312. doi: 10.1073/pnas.1816411115. [DOI] [PMC free article] [PubMed] [Google Scholar]
- 75.Guo D., Dong L.Y., Wu Y., Yang L., An W. Down-regulation of hepatic nuclear factor 4alpha on expression of human hepatic stimulator substance via its action on the proximal promoter in HepG2 cells. Biochem. J. 2008;415:111–121. doi: 10.1042/BJ20080221. [DOI] [PubMed] [Google Scholar]
- 76.ENCODE Project Consortium The ENCODE (ENCyclopedia Of DNA Elements) Project. Science. 2004;306:636–640. doi: 10.1126/science.1105136. [DOI] [PubMed] [Google Scholar]
- 77.Nassar L.R., Barber G.P., Benet-Pagès A., Casper J., Clawson H., Diekhans M., Fischer C., Gonzalez J.N., Hinrichs A.S., Lee B.T., et al. The UCSC Genome Browser database: 2023 update. Nucleic Acids Res. 2023;51:D1188–D1195. doi: 10.1093/nar/gkac1072. [DOI] [PMC free article] [PubMed] [Google Scholar]
- 78.Castro-Mondragon J.A., Riudavets-Puig R., Rauluseviciute I., Lemma R.B., Turchi L., Blanc-Mathieu R., Lucas J., Boddie P., Khan A., Manosalva Pérez N., et al. JASPAR 2022: the 9th release of the open-access database of transcription factor binding profiles. Nucleic Acids Res. 2022;50:D165–D173. doi: 10.1093/nar/gkab1113. [DOI] [PMC free article] [PubMed] [Google Scholar]
- 79.Stoletzki N., Eyre-Walker A. Estimation of the neutrality index. Mol. Biol. Evol. 2011;28:63–70. doi: 10.1093/molbev/msq249. [DOI] [PubMed] [Google Scholar]
- 80.Villar D., Berthelot C., Aldridge S., Rayner T.F., Lukk M., Pignatelli M., Park T.J., Deaville R., Erichsen J.T., Jasinska A.J., et al. Enhancer evolution across 20 mammalian species. Cell. 2015;160:554–566. doi: 10.1016/j.cell.2015.01.006. [DOI] [PMC free article] [PubMed] [Google Scholar]
Associated Data
This section collects any data citations, data availability statements, or supplementary materials included in this article.
Supplementary Materials
Data Availability Statement
-
•
The files of the HepG2 enhancers, RIE enhancers, positive and negative activity regions used in this study are deposited to Zenodo (https://zenodo.org/records/14502340).
-
•
The study utilized TREDNet, which is a multi-phase DL framework composed of three consecutive convolutional neural networks (CNNs). This model is developed by our research group for the accurate prediction of enhancer regions and mutational effects in base-pair resolution.25 The TREDNet DL model can be found in Zenodo (https://doi.org/10.5281/zenodo.8161621).
-
•
All experimental datasets used in this study are publicly available and listed in the key resources table and supplemental file “Table S1.”