Abstract
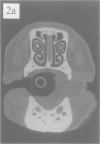
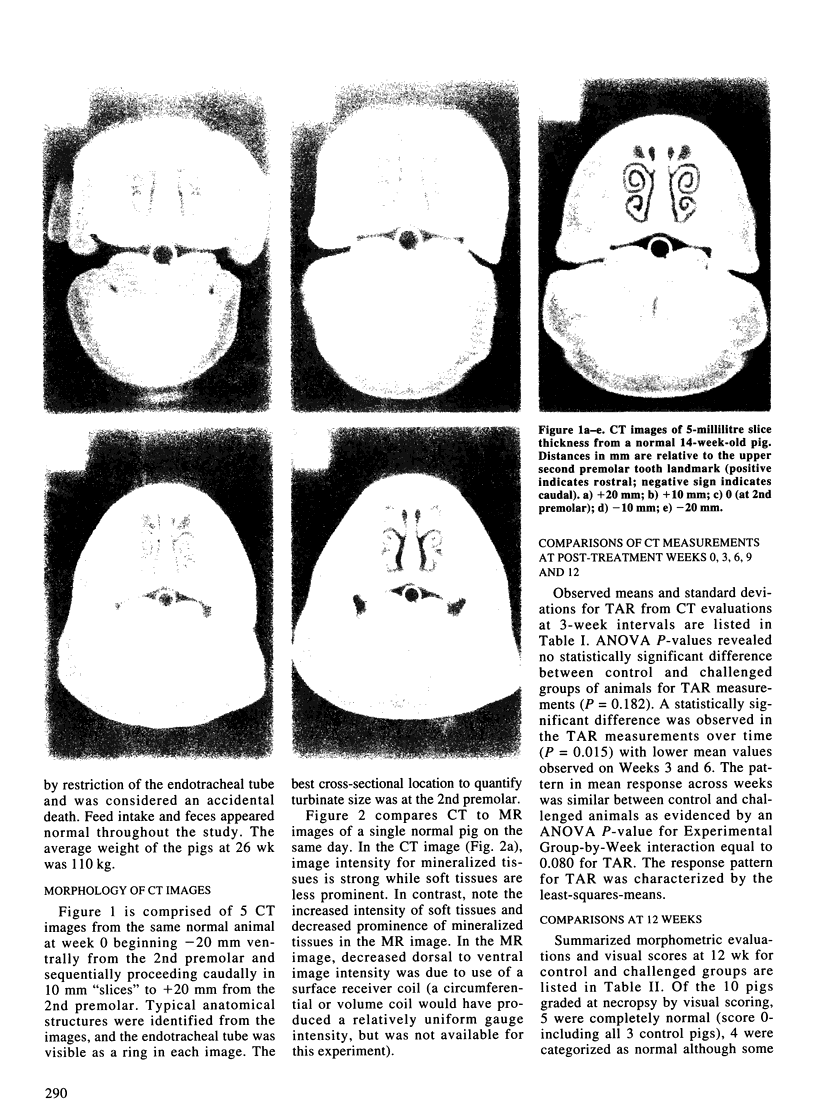
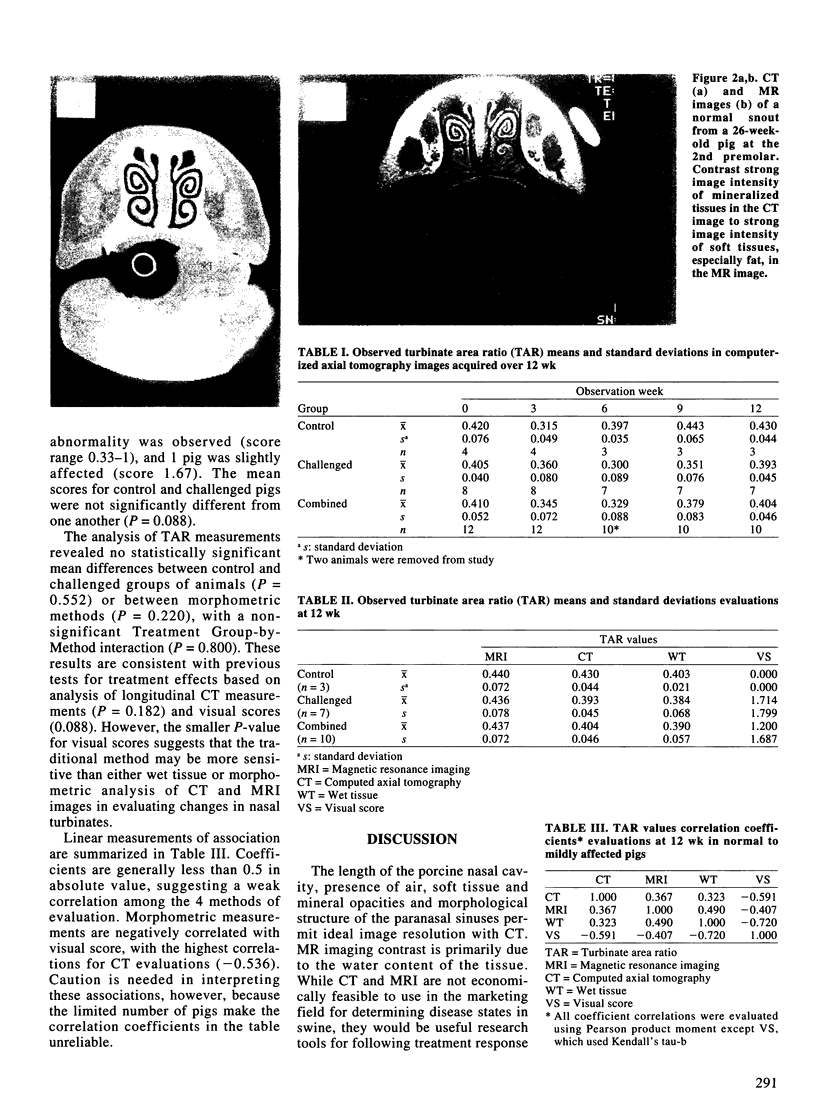
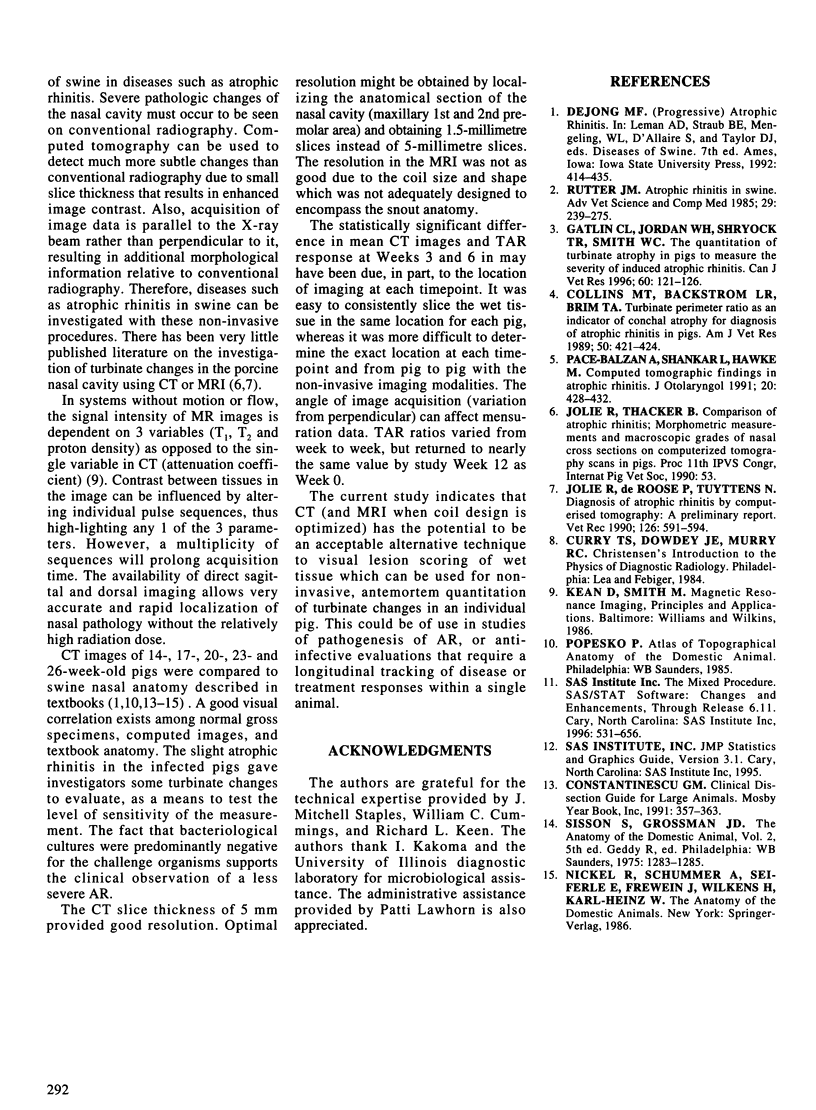
A non-invasive imaging modality, computed tomography (CT), was used to visualize changes in nasal turbinates of anesthetized pigs over a 12-week observation period (pigs were 14 wk of age at study week 0). Normal, non-infected pigs were compared to pigs with mild challenge-induced atrophic rhinitis (AR) in order to detect subtle differences in morphology. To determine feasibility for time course studies in future experiments, morphometric quantitation at the level of the 2nd premolar (turbinate area ratio or TAR) in cross-section CT images at multiple timepoints was done. Additionally, at study termination, the TAR determined from CT images, magnetic resonance imaging (MRI), and wet tissue (WT), were compared to each other and to the standard subjective measure, visual scoring. There were no statistically significant differences between the control and AR groups at CT imaging dates of 0, 3, 6, 9, or 12 wk (P = 0.182). However, a statistically significant decrease in TAR measurements over time (P = 0.015) was observed in both groups, with lower mean values observed on Weeks 3 and 6 before rebounding to baseline values at study termination. At Week 12 (termination of the study), the TAR measurements derived from CT, MRI, and WT were not statistically different from one another (P = 0.220) and the treatment group-by-method interaction was not significant (P = 0.800). This provided evidence of equivalency of the techniques. Mean values for normal and infected groups were not significantly different based on either TAR imaging methods (P = 0.552) or visual scores (P = 0.088). Thus, the current study demonstrated that CT was an acceptable alternative imaging modality which could be used for quantitation of turbinate changes in snouts of live pigs to provide data comparable to tissue taken at necropsy. Computed tomographic imaging would allow non-invasive tracking of disease or treatment responses within individual animals over time. Morphometric analysis of the TAR was equivalent between the CT, MRI, and WT specimens.
Full text
PDF
Images in this article
Selected References
These references are in PubMed. This may not be the complete list of references from this article.
- Collins M. T., Bäckström L. R., Brim T. A. Turbinate perimeter ratio as an indicator of conchal atrophy for diagnosis of atrophic rhinitis in pigs. Am J Vet Res. 1989 Mar;50(3):421–424. [PubMed] [Google Scholar]
- Gatlin C. L., Jordan W. H., Shryock T. R., Smith W. C. The quantitation of turbinate atrophy in pigs to measure the severity of induced atrophic rhinitis. Can J Vet Res. 1996 Apr;60(2):121–126. [PMC free article] [PubMed] [Google Scholar]
- Jolie R., de Roose P., Tuyttens N. Diagnosis of atrophic rhinitis by computerised tomography: a preliminary report. Vet Rec. 1990 Jun 16;126(24):591–594. [PubMed] [Google Scholar]
- Pace-Balzan A., Shankar L., Hawke M. Computed tomographic findings in atrophic rhinitis. J Otolaryngol. 1991 Dec;20(6):428–432. [PubMed] [Google Scholar]
- Rutter J. M. Atrophic rhinitis in swine. Adv Vet Sci Comp Med. 1985;29:239–279. [PubMed] [Google Scholar]


