

Abstract
We propose two-dimensional gel electrophoresis (2-DE) and mass spectrometry to define the protein components of regulons and stimulons in bacteria, including those organisms where genome sequencing is still in progress. The basic 2-DE protocol allows high resolution and reproducibility and enables the direct comparison of hundreds or even thousands of proteins simultaneously. To identify proteins that comprise stimulons and regulons, peptide mass fingerprint (PMF) with matrix-assisted laser desorption ionization/time-of-flight mass spectrometry (MALDI-TOF-MS) analysis is the first option and, if results from this tool are insufficient, complementary data obtained with electrospray ionization tandem-MS (ESI-MS/MS) may permit successful protein identification. ESI-MS/MS and MALDI-TOF-MS provide complementary data sets, and so a more comprehensive coverage of a proteome can be obtained using both techniques with the same sample, especially when few sequenced proteins of a particular organism exist or genome sequencing is still in progress.
Keywords: Spectrum Analysis, Mass; Rhizobium; Electrophoresis, Gel, Two-Dimensional
Introduction
Some years ago, the basic protocol for 2-DE was described (1). This protocol is still valid today: isoelectric focusing (IEF) is performed and after equilibration with SDS buffer in the presence of DTT, the IEF gel is applied to a SDS gel which allows the resolution of hundreds or even thousands of proteins present in a particular cell, while allowing synthesis rates to be determined quantitatively, all in one experiment. The procedure has become the core technology to visualize the global changes in protein expression for proteome analysis (2-7), permitting higher resolution (8), improved reproducibility (9, 10), higher loading capacity (11), and simplicity for preparative 2-DE with subsequent spot identification by mass spectrometry (7, 12).
An even more impressive recent development in proteomics is the use of tandem mass spectrometry for the rapid and sensitive identification of gel-separated proteins. Matrix-assisted laser desorption ionization/time-of-flight mass spectrometry (MALDI-TOF MS) and liquid chromatography electrospray ionization tandem-MS (LC-ESI-MS) are the keys to high-fidelity, high-throughput proteomics, and the two techniques have become the preferred methods for ionization of peptides and proteins due to their effective application on a wide range of proteins and peptides (13-18).
Bacterial genes encoding products with a common adaptational function are frequently coregulated. A stimulon is a set of proteins whose amount or synthesis rate changes in response to a single stimulus (6). Several stimulons have been described and range in size from a handful of proteins to nearly half of the proteins found in a cell (6, 19-21). A stimulon may consist of several different regulons (4, 19, 21), and a regulon is a protein group under the control of a specific regulatory protein. This organization ensures a balanced production of all proteins necessary for adaptation to a change in the environment which modify fundamental metabolic conditions, such as translation capacity, energy sufficiency, redox state, envelope integrity, building block supply, and protonmotive force (21).
We used 2-DE in combination with mass spectrometry (MS) to reveal protein synthesis patterns belonging to specific stimulons and regulons in R. etli (4, 6). Stimulons are studied comparing the protein expression profile in a control condition versus a test condition (6), while regulons are usually identified using strains in which the gene for the regulatory protein is mutated, and examining its response to specific conditions (4).
The current protocol of 2-DE, MS methodology, as well as recent modifications with respect to sample preparation, running conditions and staining techniques, will be critically discussed in this paper.
Materials and Methods
Cell growth conditions and protein extraction
R. etli CE3 is a spontaneous streptomycin-resistant derivative of strain CFN42 (4). Cells were grown under aerobic (minimal medium (MM) plus biotin), and fermentative conditions (MM without biotin) as described previously ((22) and Fig. 1A). Additional details on growth conditions and metabolic characteristics of aerobic and fermentative cultures are given in references 4 and 6.
Fig. 1. The proteomics approach suggested in this study, to identify the protein components of stimulons and regulons.
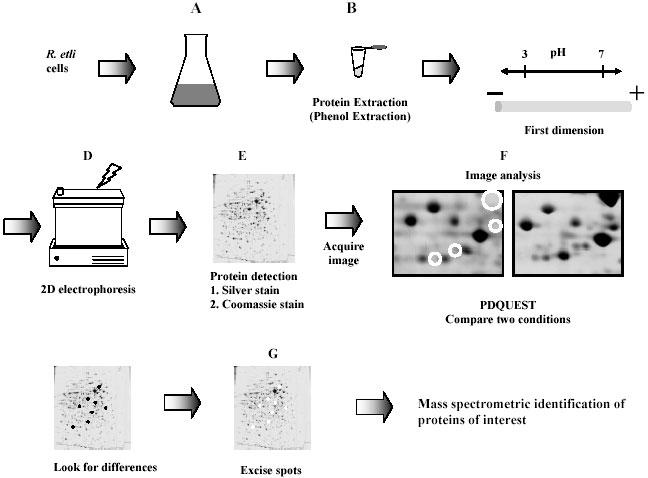
Samples to be compared are grown (A), after harvesting the proteins are solubilized (B). The crude protein mixture is then applied to a first dimension tube gel that separate the proteins based on their isoelectric points (C). After this step, the gel is applied to a second dimension SDS-PAGE gel where proteins are denatured and separated on the basis of size (D). Gels are fixed and stained by coomassie or silver staining (E). The resulting protein spots are recorded and quantified (F). The spots of interest are then excised (G) and subjected to mass spectrometric analysis.
Apparatus and chemicals for electrophoresis
For IEF and SDS electrophoresis the Millipore Investigator 2-D electrophoresis system was used (Genomics Solutions, Ann Arbor, MI.) Ammonium persulfate, 2-mercaptoethanol (2-ME) and sodium dodecyl sulfate (SDS) were purchased from BioRad (Richmond, CA). Acrylamide, bisacrylamide, CHAPS, Coomassie brilliant blue G-250, silver nitrate, urea, thiourea, TEMED, and all other chemicals (analytical grade) for electrophoresis and staining were obtained from Research Organics. DTT, Formaldehyde, IGEPAL CA-630, bromophenol blue, Trizma base and Tris hydrochloride were from Sigma (St. Louis, MO). Acetone, acetic acid, methanol, glycerol, and EDTA were from J.T. Baker (Ecatepec, Mexico state), and protease inhibitor was protease inhibitor cocktail tablets from Roche (Germany). Ampholytes, NaOH and phosphoric acid were from Genomic Solutions (Ann Arbor, Michigan, USA).
Sample preparation
In general, proteins were solubilized by sonication in 50mM Tris-HCl pH 6.8, with protease inhibitors, precipitated in cold acetone and resuspended in lysis buffer (see protocols for more detail) (Fig. 1B). The IEF sample solubilization buffer is based on O’Farrell’s (1) and is composed of 9.5 M urea, 2% Igepal CA-630, 5% (v/v) 2-mercaptoethanol and 5% v/v carrier ampholytes, the samples were stored in aliquots at -80°C until analyzed (this strategy has been found very useful for the inactivation of proteases to minimize protein degradation).
Protein electrophoresis and protein visualization
Electrophoresis was performed as described in protocols and in the 2D Investigator instruction manual (Genomic Solutions, Ann Arbor, MI, USA) (Fig. 1C and 1D). In the first dimension, pH 4 to 8 ampholytes were used.
For analytical 2-D electrophoresis, we used 100 μg of protein from a total cell lysate in the first dimension. The optimum sample volume for loading is 15 μL - 45 μL. Volumes less than 15 μL are not recommended because of the increased risk of protein precipitation at the application point.
For preparative 2-DE, which is used to obtain proteins for MS (MALDI-TOF-MS or LC-ESI-MS) identification, 0.5 mg of protein (sample volume: 100 μL) was applied using a pH range 4 - 8 (4, 6).
After electrophoresis, the gels were fixed and stained with colloidal Coomassie brilliant blue (preparative gels) or silver staining (analytical gels) as described in protocols and Fig. 1E. Silver and Coomassie brilliant blue stained gels were digitized at 127 × 127 μm resolution using a PDI image analysis system and PD-Quest software (Protein Databases, Inc., Huntington Station, N.Y.) ((4) and Fig. 1F). IP and MW were determined by using a 2D SDS-PAGE standard (Bio-Rad, Hercules, CA).
Mass spectrometry protein-identification
Procedure for in-gel digestion
Protein spots from Coomassie stained preparative 2-D gels were selected and excised manually using a clean scalpel or razor blade (Fig. 1G), put into 1.5 ml Eppendorf tubes, covered with water and store in the freezer until digestion. The samples were prepared for MALDI-TOF-MS analysis using a slightly modified published procedure (6, 23). In brief, protein spots were distained (Fig. 2A), reduced, alkylated (Fig. 2B) and digested in the gel with trypsin (Promega, Madison, USA) (Fig. 2C) and extracted (Fig. 2D). Before obtain the mass spectra of the peptide mixture, the peptides were desalted using a C18 ZipTip (Millipore, Bedford, MA. USA) according to the manufacturer's instructions (see protocols for more details).
Fig. 2. Schematic outlining of protein identification by mass spectrometric analysis.
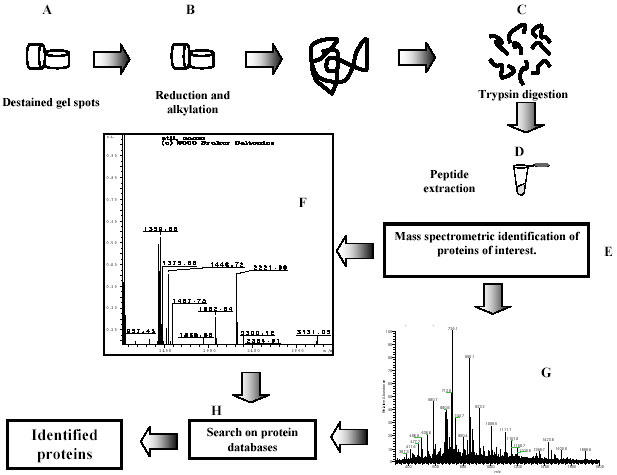
After 2-D PAGE, the protein spots were excised, subjected to distaining (A), and reduction and alkylation reactions (B), prior to digestion with trypsin (C). The volume was adjusted to ~20 μl (D), at this point the sample was ready for mass spectrometry analysis (E). An aliquot of the supernatant containing tryptic peptides is analyzed by MALDI-TOF MS, which results in a peptide-mass fingerprint of the protein; the panel shows the individual peptide peaks in the mass spectrum (F). The reminder of the supernatant is desalted and analyzed by nanoelectrospray ionization tandem-MS (ESI-MS). The figure shows how the sequence can be derived by fragmentation of the same peptide by tandem mass spectrometry (G).
MALDI-TOF-MS
All analyses were performed using a Bruker Daltonics Autoflex (Bruker Daltonics Bellerica, Mass. USA) operated in the delayed extraction and reflectron mode. Spectra were externally calibrated using a peptide calibration standard (Bruker Daltonics 206095). Peptide mixture was analysed using a saturated solution of α-cyano-4-hydroxycinnamic acid (HCCA) in 50% acetonitrile/0.1 % trifluoroacetic acid. Peaks lists of the tryptic peptide masses were generated and searched against the Rhizobase (6) and NCBInr databases (Fig. 2F) using the search program Mascot, (Matrix Science, Ltd., London, United Kingdom; http://www.matrixscience.com. The R. etli genome sequencing is still in progress, and for that reason a database was created using sequences deposited as a result of the Sinorhizobium meliloti (24), Mesorhizobium loti (25), Agrobacterium tumefaciens (26) and R.etli symbiotic plasmid (27) sequence projects, named Rhizobase database (6).
LC-ESI-MS/MS
Unknown samples, not identified by MALDI-TOF-MS were selected to be injected into a CapLC (Agilent 1100, Hewlett-Packard, Germany) System. Ten μl was injected and desalted on-line thorough a 100mm long, 360 OD, 75μm ID × I5 μm tip Aquasil C18 column (PicoFrit, USA) prior to introduction into the mass spectrometer. A typical reversed-phase gradient was used from low to high organic solvent over about 60 min. Mobile phase A was 0.1% formic acid and B was 100% MeCN, 0.1% formic acid. The system utilized a small split flow resulting in a column flow rate of approximately 300 nl/min.
As peptides elute into the mass spectrometer data-dependent data was performed. In this experiment, the mass spectrometer was set to acquired a conventional scan over the m/z range 400-1600. The most intense peak was selected for MS/MS experiments, which were performed on a Thermofinnigan LCQ (ThermoQuest/Finnigan, San Jose, CA. USA) and the mass spectra were searched against databases using the Sequest search algorithm (http://www.thermoquest.com).
Northern hybridization
Northern hybridization was performed as described previously (6, 28). The qualitative examination of the Northern hybridization data was validated by scanning the blots with a densitometer and determining the relative amounts of each specific transcript with a Quantity one software package (Bio-Rad Laboratories, Hercules, Calif.).
Results and Discussion
Whole-cell protein extracts of cells grown in MM supplemented with biotin (aerobic conditions) and MM without supplements (fermentative conditions) were analysed in at least three independent experiments, with duplicate analytical-gels being run for each extract as reported previously by us (6). Gels were qualitatively and quantitatively analysed with PD-Quest software. More than 900 protein spots were revealed on analytical-silver-stained 2-DE gels from 0.1 mg of protein samples prepared from cells from MM-biotin (Fig. 3). The protein spot pattern of the proteome obtained from biotin stimulon cultures was used as a reference standard for spot matching and also to describe relative changes in spot intensities during growth under other culture conditions (Fig. 3).
Fig. 3. 2-DE analysis of a R. etli protein profile stimulated by biotin.
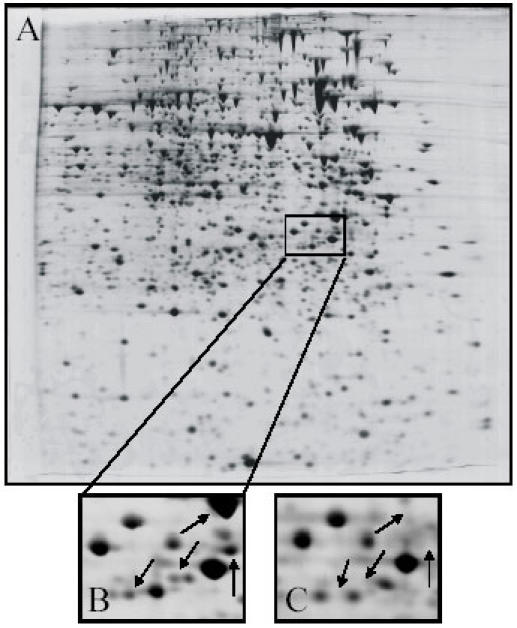
Total cellular proteins were prepared from a MM-biotin culture, isolated and analyzed by 2-DE protein electrophoresis. (A) Complete 2-D protein profile of R. etli grown in MM-biotin; (B) enlarged regions of the protein profile from biotin-stimulon; (C) enlarged region of the protein profile from fermentative metabolism (MM-without biotin). The boxed area in (A) shows the area of the gels enlarged for (B) and (C). Arrows indicate the proteins induced only with biotin.
The biotin stimulon was revealed after comparison of protein patterns obtained by 2-DE from cells grown in MM-biotin versus cells grown in MM-without supplements, and constitutes a set of proteins whose amount or synthesis rate changes in response to a single stimulus (the presence of biotin) (Fig. 3A and 3B) and (6) or by a regulator protein as AniA regulon (4). The proteome data indicate that hundreds of specific genes may be induced or repressed during specific growth conditions (6). Based on these synthesis patterns, we identified distinct protein classes: (i) proteins unique to condition A (proteins unique to MM or MM with biotin) or B, (ii) proteins downregulated in condition A and upregulated in condition B or conversely (proteins downregulated in MM and upregulated in MM with biotin or conversely), (iii) proteins present in comparable amounts under all conditions tested (Fig. 3).
Protein separation using 2-D electrophoresis
Currently, 2-DE is a widely used method for proteomic analysis enabling researchers to investigate and analyze levels of protein expression under a variety of protein expression conditions, however, some common problems are the presence of a few proteins visible on the SDS gel, probably caused by inappropriate sample extraction procedure and, in the 2nd dimension, poor protein transfer from the gel-tube to the SDS gel. Occasionally, low or high Mr proteins are missing on the SDS gels, caused by low Mr proteins not being adequately fixed after SDS polyacrylamide gel electrophoresis (SDS-PAGE). To avoid this, we suggest the use of 20% TCA or glutaraldehyde as a fixative, instead of 40% alcohol and 10% acetic acid and, when high Mr proteins are missing due to proteolytic endogenous degradation, proteases in the sample should be inactivated. Further problems include protein precipitation in the sample application zone, possibly caused by loading a very concentrated sample. Highly concentrated samples can be diluted with lysis buffer, while poorly soluble proteins can be resolved by adding high amounts of urea (> 8M), and/or a proper detergent (> 1%) to the lysis buffer or a combination of urea-thiourea-chaps (7M, 2M and 4% respectively) (29). To avoid solubilization problems, we suggested in Material and Methods 9.5 M as the urea concentration (and not 8M as used some groups, specifically users of IPG-strips (30, 31)). Urea at 9.5M is the concentration reported originally by O'Farrell in 1975 in his paper about 2D electrophoresis, additionally this concentration is recommended by the manufacturers of several 2D electrophoresis systems.
Additionally, in the gels, a diffuse background smear is occasionally observed, probable due to the presence of endogenous proteases in the sample which were not inactivated, poor quality of chemicals (use analytical grade) or water (use 18 meg Ohm water), insufficient washing during silver staining or complex formation between carrier ampholytes and SDS and/or other detergents. A possible solution could be fixing the gel >3h or overnight and intensive shaking to remove SDS-carrier ampholyte complexes.
Indeed, 2-DE is regarded as the most powerful separation method for resolving complex mixtures of proteins. However, classical 2-DE for successful proteomics, now requires increased resolving power, the ability to analyze low (<8 kDa) and high Mr proteins (over 100 kDa); the capacity to resolve very alkaline, hydrophobic, or membrane proteins; and capability to detect minor components in the presence of large quantities of house-keeping proteins. In addition, simplification and automation of the laborious 2-DE procedure would be helpful to resolve some of the points mentioned, immobilized pH gradients (IPG-methodology) (9) is constantly being refined by, for example, the development of basic IPGs up to pH 12 for the analysis of very alkaline proteins, or the introduction of overlapping narrow IPGs (30) to stretch the first dimension for higher resolution and the analysis of minor components. Using the range covering pH 3-10, only 20-25% of the proteins in the theoretical proteome are predicted to be observable in the resulting 2D-PAGE gel. However, good separation of higher protein loads was achieved using the narrow-range pH 4.5-5.5 and 5.5-6.7, significantly increasing the proportion of theoretical proteins detected to over 50% (32). In conclusion, 2-DE is a technique that fulfils the basic requirements of proteome research and which is being continuously improved to meet the demands of the future has been established.
Protein visualization
Today, researchers have a multitude of protein stains to choose from according to their project requirements. Most commonly, samples are visualized by silver staining, Coomassie brilliant blue or Sypro fluorescent dyes (33-35). As the sensitivities of protein stains are improved, the challenge to acquire good mass spectra from lower abundance proteins is heightened. It is imperative that the dye does not interfere with MS methods of analysis.
After the proteins were separated by 2-DE and visualized with the staining method selected, silver staining for analytical gels and Coomassie brilliant blue for preparative-gels, as described in protocols. The protein spot profiles were analysed using image analysis software (Fig. 3 and as described in Material and Methods and Protocols), and from there some proteins were selected for MS analysis (Figs. 4-6). These spots were excised from preparative-gels, and subjected to enzymatic digestion (as indicated in Material and Methods).
Fig. 4. MALDI-TOF mass spectrum of an in situ digest of gel spot 1, isolated from a Colloidal blue stained 2-D gel.
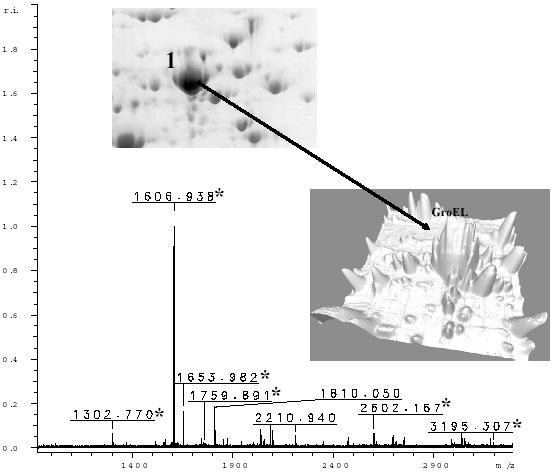
Peaks that matched the database entry for GroEL are marked with asterisk. Inset shows the spot analyzed.
Fig. 6. (A) Full scan of spot 2, showing the precursor ions, analyzed by LC-ESI-MS/MS.
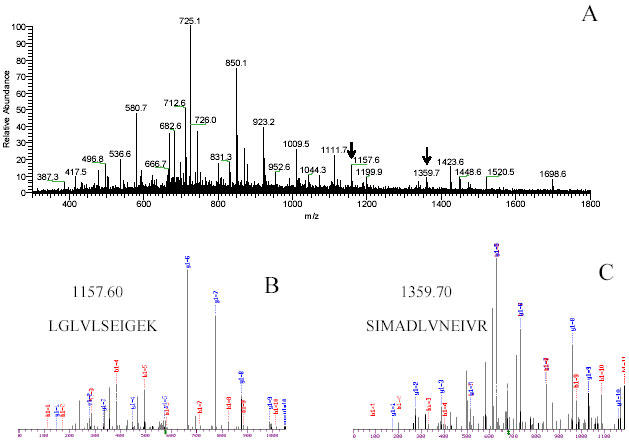
The two peaks were selected for MS/MS scans for further identification via collision induces. (B) and (C).The ESI-IT CID spectrum of the same spot show fragments ions corresponding to –b and –y type ions and the peptide sequence. Database searching with this fragmentation information results in identification of peptides LGLVLSEIGEK and SIMADLVNEIVR as trigger factor protein.
In contrast to silver staining, Coomassie brilliant blue (36, 37), is less sensitive but easier to perform and have been demonstrated to be useful for protein visualization due to their compatibility with MALDI-TOF-MS and LC-ESI-MS/MS spectrometry. Silver staining methods (23, 38, 39), due to their sensitivity, are ideal for the detection of trace components within a protein sample and analysis of protein samples available in only limited quantity (detection limit is as low as 0.1 ng of protein per spot). Despite these advantages, silver staining has some drawbacks doing incompatible with mass spectrometry analysis; however some groups are proposing a silver staining methodology performed similarly to the method described in this paper, except that treatment with glutaraldehyde (a cross-linking and sensitizing agent) was omitted. Their results suggest that silver staining is compatible with microanalytical protein characterization because it does not introduce chemical modifications (23, 39).
Additional a new generation of SYPRO dyes (40) and protein stains with attached fluorochromes (41) could be more sensitive (detection limit of these fluorescent dyes is in the range of 1-2 ng of protein per spot), and compatible with mass spectrometry, unfortunately they require expensive equipment for visualization, which is not available in all proteome laboratories.
Protein identification
Recent developments in technology and instrumentation have made mass spectrometry the method of choice for the identification of gel-separated proteins, and make use of the rapidly growing sequence databases (42). Proteins selected were subjected to enzymatic digestion (as indicated in material and methods), the resulting peptide fragments were analyzed using the complementary mass spectrometry methods MALDI-TOF-MS and LC-ESI-MS/MS. Each of these MS methods can be used independently for proteomic analysis, but when the high-throughput MALDI-TOF-MS analysis is combined with the sequence specificity of LC-ESI-MS/MS analysis, identification of unknown proteins from database searching is greatly facilitated, especially when the genome sequence from the bacteria studied is unknown or still in progress (18, 43, 44).
Proteins with a full-length sequence present in databases can be identified with high certainty and high throughput using the accurate masses obtained by MALDI-TOF MS peptide mapping (45). Sample protein mixtures can also be deciphered by peptide mapping (46) and the entire identification process, starting from in gel digestion and finishing with the acquisition of mass spectra and database searching, can be automated and are much easier to process than LC-ESI-MS/MS. Consequently, MALDI-TOF-MS was the first pass analysis. A representative spectra for spot 1 precursor is shown in Fig. 4. The peak list generated from MALDI-TOF-MS data (Autoflex, Bruker Daltonics, Billerica, MA) was used to search existing protein databases to identify the protein. In this example the protein was successfully identified because it belonged to the GroEL family, which is a group of proteins with very high similarity, even between prokaryotes and eukaryotes.
When the MALDI-TOF-MS information is insufficient for protein identification, amino acid sequencing is necessary (47). Only 1-3% of a total digest is consumed by MALDI-TOF MS analysis (48), even if the protein of interest is present on a gel in a subpicomolar amount, and the remaining protein digest can be analyzed by electrospray tandem mass spectrometry (LC-ESI-MS/MS) (14), producing data that allow highly specific database searches, specifically when the genome sequence from the bacteria studied is unknown. This is the case of spot 2, which demonstrated good MALDI-TOF-MS spectra (Fig. 5). Nevertheless, the protein was still not identified, and then LC-ESI-MS/MS was utilized. The masses of the peptide fragments are measured and fragmentation of the peptide is generated by collisionally activated dissociation (Fig. 6A). Then the proteins can be identified because the sequence of the unknown peptide can be determined from the resulting fragmentation patterns. A representative example are the spectra presented in Fig. 6B and 6C which demonstrate the additional data which may be acquired from LC-ESI-MS/MS analysis, the sequence obtained from fragmentation patterns obtained of MS/MS spectra was useful to identify the protein by homology as a trigger factor reported in S.meliloti. In R. etli, no sequences for trigger factors are present in the databases, but the additional information obtained from LC-ESI-MS/MS made possible its identification using databases from related organisms.
Fig. 5. Peptide mass fingerprint of gel spot 2.
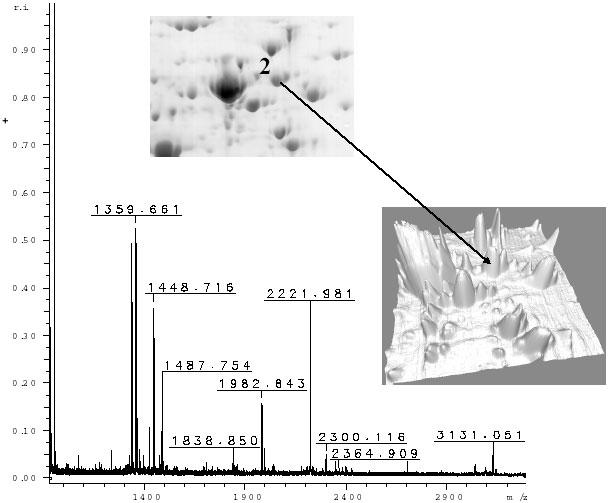
In this case the mass information was not sufficient for searching in the database and the identification was not possible, and subsequent LC-MS/MS was required. Inset shown the spot analyzed from the Colloidal blue stained 2-D gel.
PMF using MALDI-TOF-MS data cannot be used to match homologous proteins unless the two sequences have very high identity. This shows the utility of the LC-ESI-MS/MS approach for identifying homologous proteins if the two sequences have very high identity, and showed that the additional information provided by LC-ESI-MS/MS was essential for identification of the unknown protein. These kinds of sequence data are necessary for protein identification when the protein of interest does not appear in available databases, which limits the identification of proteins using PMF.
Mass spectrometry has been widely recognized as a cornerstone of proteomic research. Its high sensitivity (down to the femtomole level) and throughput are the main characteristics that make MS the best methodology to identify proteins. Another key feature of MS analysis of gel-separated proteins and peptides is the ability to generate different types of structural information about a particular peptide of interest. For example, the mass spectrometer can directly provide information on the mass of a particular peptide and can also generate de novo amino acid sequence information from tandem mass spectra obtained either by post-source decay or collision induced dissociation (as described in (49) and (50)). Additionally, Mass spectrometry can be used in studies to evaluate protein complexes and post-translational modifications (16).
Transcription analysis
Results of genome expression using proteome analysis require some kind of confirmation, but, remarkably, current technology expends nearly as much effort in confirming a suspected gene expression identity. There is clearly a need for technologies to simplify confirmation, and we used methods such as Northern blotting (6, 51-53). Using proteome analysis we identified a group of proteins present only in biotin stimulon, and from this set of proteins we selected the protein identified as catalase-peroxidase KatG (28) to investigate whether expression of this protein correlated at transcriptional level. Northern hybridization analysis was performed using a specific probe (6). The results clearly demonstrated that the gene encoding this protein was positively regulated at the transcriptional level, confirming the results of the proteome analysis, and also showing the utility of this methodology to confirm proteome results (6).
Concluding Remarks
A fundamental concept called proteome (PROTEin complement of a genOME) has recently emerged that should help to unravel biochemical and physiological mechanisms at the functional molecular level (54). Proteome analysis methodologies separate proteins by two-dimensional polyacrylamide gel electrophoresis (2-D PAGE) followed by powerful peptide mapping approaches in which gel-embedded proteins are enzymatically cleaved, peptide products are eluted, and identity determined by database searching of the masses or sequences derived from mass spectrometry (MS) analysis of those products. All these represent a set of methodologies with great capacity to analyze protein components of regulons and stimulons in bacteria. Additional, the present paper demonstrates that proteins of organisms with unknown genomes can be separated by 2-D electrophoresis, digested in-gel and rapidly identified at the femtomole level by peptide mass fingerprinting using MALDI-TOF and LC-ESI-MS/MS protocols. In general, MALDI-TOF MS is more effective for the analysis of a greater number of proteins, whereas LC-ESI-MS/MS offers better results to identify proteins for which the gene is not yet sequenced.
Acknowledgments
This work was supported by Conacyt grant 40046-Z and DGAPA-UNAM grant 203003-3. The authors would like to express their thanks to Michael Dunn and Yolanda Mora for critical reading of the manuscript.
Appendix
Protocols
Protein extraction (sample preparation)
Lysis buffer
5.7 g Urea
2.0 ml Igepal CA-630 10% (v/v)
0.5 ml 2-mercaptoethanol
0.125 ml Ampholytes 3-10
0.375 ml Ampholytes 4-8
2.4ml 18 meg Ohm water
Cells were washed, pelleted collected and sonicated in 1 ml of 50 mM Tris-HCl, pH 6.8 with protease inhibitors (complete tablets ROCHE).
The extract was precipitated over night in 5 volumes of acetone at -20°C.
Centrifuged at 16,000 g. 10 min at 4°C.
The pellet was resuspended in lysis solution and centrifuged at 16,000 10 min at 4°C (pellet was discard).
The protein concentration was determined to supernatant by the Bradford method.
The proteins extracts were aliquoted and stored at -70°C until analyzed.
Electrophoresis
2D electrophoresis was done according to the manufacturer’s instructions, with some modifications. Unless otherwise indicated, the water used for all solutions is 18meg Ohm purified, filtered through a 0.45 μm filter. To dissolve the urea, solutions were warmed to 37°C (do not heat above 37°C or the urea can carbamylate proteins in the sample causing charge heterogeneity). To thaw the urea solutions after storage, let stand at room temperature or place in a 37°C in water bath. All reagents are electrophoresis grade or the best quality as possible.
1D buffers and solution
1D IEF gel casting solution
57 g urea
2.0 ml Igepal CA-630
13 ml acrylamide solution
0.3 g CHAPS
Water to 95 ml. Aliquot 5.65 ml portions in analytical snap caps vials. Store at 70°C.
Sample overlay buffer
3.0 Urea
0.2 ml Igepal CA-630
0.25 ml Ampholytes (40% stock)
0.77 g DTT
Water to 100 ml. Aliquot into 0.5 ml portions. Store at 70°C.
Cathode (upper) solution
10 mL 10N NaOH
990 ml of water
Use freshly prepared. Do not filter.
Anode (lower) solution
1.4 ml 85% phosphoric acid
2 lt of water
Prepared freshly. Do not filter.
1D equilibration buffer
36.33 g Tris base
11.82 g Tris HCl
30 g SDS
Water to 1 lt. Store at room temperature
1D IEF gel storage buffer
10 ml glycerol
Water to 100 ml
Acrylamide Solution
300 g acrylamide
8 g bis acrylamide
Water to 1 lt. Store at 4°C. Do not store for more than 1 month.
Preparation of 1D gels
Fill the 1D-casting cylinder with 1100 ml of 18meg Ohm water.
Before running, add to each aliquot 87.5 μl of ampholyte stock solution pH 3-10 and 262.5 μl of ampholyte stock solution pH 4-8.
Add 40 μl of 10% ammonium persulfate. TEMED is not required due to the presence of ampholytes.
Mix the solution completely by inverting the vial several times. Try to minimize detergent bubbles when mixing.
Place the threaded glass capillary tubes in to the vial, guide the small end of the 1D casting funnel over the tops of the tubes and press the snap cap vial onto the assembly.
Slowly lower the snap cap vial, tubes and funnel combination into the casting cylinder so that the water entering through the lower hole in the funnel lays over the gel solution. Avoid mixing solution with the water.
Wait about 1 hour for the gel to polymerize. The length of gels is 18 cm.
Carefully remove the tubes and cast each tube gel into the 1D chamber.
Prefocusing 1D gels
Fill the 1D-running tank with anode solution, and upper reservoir with 800 ml of degassed cathode solution.
Fill a 1 ml syringe with cathode solution introduce into the gel tube and carefully expel cathode solution to remove the air bubbles.
Repeat until all tubes are completely debubbled.
Load approximately 5 μl of the sample overlay on the top of each gel.
Install the cover on the 1D running system.
Plug in the 1D chamber to programmable power supply, and start prefocus program following the manufacturer’s instructions.
Isoelectricfocusing 1D gels
When the prefocus program is finished, stop the program and load the sample in the gels. We use 100 μg for analytical running and 0.5 mg or 1.0 mg for preparative running.
Carefuly load on top of the gel the sample using a Hamilton syringe. Rinse the syringe and needle thoroughly each sample.
Install the cover on the 1D running system. Plug in to the programmable power supply.
Program the power supply for the isoelectric focusing. We follow the manufacturer standard conditions, except for the Volt-hours, which we programmed at 24 000 volt-hours.
While isoelectric focusing is running, cast the 2D slab gels.
2D buffers and solutions
Tris Slab gel buffer
130.8 g Tris Base
66.3 g Tris HCl
Water to 1.0 lt. Store solution at 4°C.
2D gel running buffer (10X solution)
60.55 g Tris Base
288.27 g glycine
20 g SDS
Water to 2.0 lt. Store at room temperature.
10% SDS stock solution
10 g SDS
Water to 100 ml
Store at room temperature.
10% Ammonium Persulfate (APS)
1.0g APS
Water to 10 ml
Store at 4°C
Prepare just before to use. The IEF gels polymerize poorly if the solution is more than 24 hours old. Don’t filter.
Cleaning solution
50 ml ammonium hydroxide
100 ml alkaline detergent
Tap water to 10 lt.
2D slab gel fixation solution
400 ml Methanol
100 ml Acetic Acid
Water to 1.0 lt
Cleaning glass plates
The cleanliness of glass plates is very important. These were washed with soap to remove all waste of acrylamide. They were soaked in cleaning solution overnight, washed with hot tap water and let dry. All chambers and casting systems are washed with tap water and handed with clean gloves, to avoid contamination with other proteins and keratins.
Preparing 2D slab gels
Follow the manufacturer instructions for assembling the single glass plates on the 2D casting system for slab gels. When casting box is assembled prepare the Acrylamide casting solution, following the later instructions. Amounts must be sufficient for 5 single gels and are slightly in excess.
Mix 211 ml of acrylamide solution, 130.5 ml of Tris slab gel buffer and 180.5 ml of water.
De-gas the mixture for ten minutes at 25 mm of Hg. Add 11.7 ml of 10% SDS.
Initiate the polymerization by adding 2.9 ml of 10% APS and 0.376 ml of TEMED. Mix gently, and do not shake.
Pour the Acrylamide solution into the casting cylinder.
Then fill the casting box at adequate level, 0.5 cm below the bottom of the bevel.
Close the pinch clamp and wait 30 seconds for the acrylamide level to settle.
Carefully layer 1ml of water-saturated butanol gel overlay into the beveled V-shaped trough and onto the top of the Acrylamide solution in each plate assembly.
Wait for complete polymerization, at least one hour.
If you wish, the casting unit could be stored overnight before using. Pour out the butanol, rinse the top of gels and cover with a 1:4 dilution of the 2D slab gel buffer.
Second dimension gel run
Prepare 1D equilibration buffer. Just before using, add 0.77 g DTT and 0.01 g Bromophenol Blue to 100 ml 1D equilibration buffer.
-
When the Focusing program was finished, turn off and remove the tubes from the 1D running system and place on ice, for approximately 5 to 10 min.
NOTE: If you don’t run 2D electrophoresis, you can store the 1D gels at -70°C in 1D IEF gel storage buffer.
Fill a holding tray with 1D equilibration buffer.
Carefully expel the gel using the gel extrusion adapter into a holding tray.
Incubate in 1D equilibration buffer for 2 min at room temperature.
Then load it onto the slab gel.
Place the cover to the 2D chamber and plug in to the programmable power supply.
Program according to the manufacturer’s instructions. Our run was made at 1000 mW constant. Longer times of running result in sharper spots. The run is stopped when dye front is one centimeter from the bottom gel.
Turn off the power supply and carefully open the sandwich gel, and place it into the fixation solution, at least 1 hour.
Preparative 2D gel electrophoresis
Follow the same procedure for analytical running, but use the preparative gel tubes of 2 mm 1D. In addition the 1D gel must be glued to 2D slab gel with agarose low melt (1% in 2D running buffer 1X with 0.01% bromophenol brilliant blue). The running conditions for the focus gel is in accord to the manufacturer instructions, except for the Volt-hours which we set at 24 000 Volts- hour.
Note: If you observe vertical streaks on the SDS gel, the possible reasons could be: a) proteins insufficiently loaded with SDS; possible presence of glycoproteins in which case we suggest the use of Borate buffer instead of Tris buffer in SDS gel; use steep pore gradient to deglycosylate proteins, ii) Partial re-oxidation of free SH-groups in which case, add sufficient DTT to break the disulfide bonded aggregates, since equilibration buffer, alkylate proteins; use tributylphosphine instead of DTT and iodoacetamide, iii) Carbamylation trains, we suggest never heating urea-containing solutions at > 37°C; deionize urea prior to use, iv) endogeneous proteolytic enzymes have not been inactivated during sample preparation, in this last case try to inactivate proteases by TCA-acetone treatment, boiling with SDS and/or adding protease inhibitors.
Note: It is important that the quality of chemicals should be at least analytical grade; double-distilled or deionized water (conductivity 18meg Ohm) should be used in solution preparation.
Visualization of proteins
Silver stain
The times indicated here should be observed exactly in order to ensure reproducible image development. All steps were carried out on a shaker at room temperature (20-25°C).
Washing solution
500 ml ethanol
500 ml water
Pretreatment solution
0.2 g Na2S2O3 • 5H2O
Water to 1 lt
Impregnation solution
2 g AgNO3
0.75 ml 37% formaldehyde
Water to 1 lt.
Development solution
60g Na2CO3
0.5 mL 37% HCOH
4 mg Na2S2O3 • 5H2O
Water to 1 lt
Stop solution
10 ml acetic acid
990 ml water
Fix gels for al least one hour. Wash in washing solution, three times for 20 minutes.
Incubate 1 minute in pretreatment solution. Rinse with water three times for 20 seconds.
Add impregnation solution and incubate for 20 minutes.
Rinse with water three times for 20 seconds.
Immerse in development solution for visualization of spots of proteins. Change development solution when is brown. Rinse with water two times for 2 minutes.
Immerse gels in stop solution. It can be stored in this solution at 4°C.
The gel is ready for analysis.
Suggestions: utilize pure chemicals (analytical grade) exclusively, highly purified deionized water (conductivity < 2 μS), meticulously cleaned and dust-free vessels only, never touch the gel with your fingers, always wear gloves, use fresh formaldehyde, check pH of developer, and the SDS gel has to be completely covered with buffer solutions during the silver staining procedure.
Coomassie stain
Water used in all solutions and in all rinses is 18meg Ohm purified. A fresh staining solution should be used.
Colloidal Coomassie brilliant blue
0.4 g CBB G-250
4.8 ml H3PO4 85%
40 ml saturated ammonium sulfate
275 ml water
At the moment to use add: 80 ml methanol.
Saturated ammonium sulfate
767 g of (NH4)2SO4 in 1 liter of water stir and gently warm. When the solution is still warm should be filtered by 0.45 μM filter.
After fixing the gels, wash 10 min in water. Then incubate in colloidal stain.
Gentle rock during 1 h. Stain only one gel at a time.
After spots are visible, store gels in water. Gels are ready for image analysis and cutting spots.
Sample digestion by mass spectrometry
All reagents are prepared immediately prior to use. The water used in all components of the procedure should be 18meg Ohm purified. The acetonitrile and methanol are HPLC grade. All other reagents are the highest possible commercial grade available. The trypsin used is sequencing-grade enzyme that has been modified to inhibit autolysis and to minimize non-tryptic protease activities.
100 mM ammonium bicarbonate
0.2 g ammonium bicarbonate
20 ml of water
50 mM Ammonium bicarbonate
2 ml of 100 mM ammonium bicarbonate
2 ml water
10mM DTT
1.5 mg DTT
1 ml 100mM ammonium bicarbonate
100 mM Iodoacetamide
18 mg iodoacetamide
1 ml 100 mM ammonium bicarbonate
Trypsin stock solution
20 μg trypsin
100 μl HCl 1mM
Aliquot in 10 μl and store at -20°C
Trypsin solution
10 μl trypsin stock solution
150 μl of 5 mM ammonium bicarbonate to obtain a concentration of 12.5 ng/μl
Prepare just before using and keep on ice until utilized
Extraction buffer
10 ml of acetonitrile
5 ml water
1 ml formic acid
Water to total volume 20 ml
Day one
The spot was cut from the gel and placed in an eppendorff tube. First step; Distaining in 50% acetonitrile in 2.5 mM ammonium bicarbonate, 2 h two times.
Dehydrate the gel pieces 10 min at room temperature in 100 μl of pure acetonitrile, two times. When dehydrated, the gel pieces will have an opaque white color and will be significantly smaller in size.
Carefully remove the acetonitrile from the sample and discard.
Store at -70°C.
Day two
Completely dry the gel pieces at room temperature in a vacuum centrifuge for 2-3 min.
Add 30 μl of 10 mM DTT and reduce the protein for 30 min at room temperature.
Carefully remove the DTT solution from the sample and discard.
Add 30 μl of 100 mM iodoacetamide and alkylate the protein at room temperature for 30 min.
Carefully remove the iodoacetamide solution from the sample and discard.
Add 100 μl of acetonitrile and dehydrate the gel pieces for ~5min at room temperature.
Carefully remove the acetonitrile from the sample and discard.
Rehydrate the gel pieces in 100 μl of 100mM ammonium bicarbonate, incubating the samples for 10 min at room temperature.
Carefully remove the ammonium bicarbonate from the sample and discard.
Add 100 μl of acetonitrile and dehydrate the gel pieces for ~5min at room temperature.
Carefully remove the acetonitrile from the sample and discard.
Completely dry the gel pieces at room temperature in a vacuum centrifuge for 2 to 3 min.
Digest the sample by adding 10 μl of trypsin solution, incubate 30 min in ice for rehydratation of gel, and then remove the supernatant and add 10-15 μl of 5 mM ammonium bicarbonate and incubate overnight at 37°C to carry out the digestion.
Day three
Extract the peptides produced by the digestion in three steps.
i) Add 30 μl of 5 mM ammonium bicarbonate to the digest and incubate the sample for 10 min with occasional gentle vortex mixing. Drive the digest to the bottom of the tube by centrifuging the sample for 30 sec. Carefully collect the supernatant and transfer the sample to a 0.5 ml plastic micro-centrifuge tube.
ii) Add 30 μl of extraction buffer to the tube containing the gel pieces, and incubate the sample for 10 min with occasional gentle vortex mixing. Drive the extract to the bottom of the tube by centrifuging the sample for 30 sec. Carefully collect the supernatant, and combine the extract in the 0.5-ml plastic micro-centrifuge tube.
iii) Add a second 30 μl aliquot of the extraction buffer to the tube containing the gel pieces, and incubate the sample for 10 min with occasional gentle vortex mixing. Drive the extract to the bottom of the tube by centrifuging the sample for 30 sec. Carefully collect the supernatant, and combine the extract in the 0.5 ml plastic micro-centrifuge tube.
Reduce the volume extract to ~10 μl by evaporation in a vacuum centrifuge at ambient temperature. Do not allow the extract to dry completely.
References
- O'Farrell PH. High resolution two-dimensional electrophoresis of proteins. J Biol Chem. 1975;250:4007–4021. [PMC free article] [PubMed] [Google Scholar]
- Bjellqvist B, Ek K, Richetti PG, Gianazza E, Gorg A, Westermeir R, Postel W. Isoelectric focusing in immobilized pH gradients: principle, methodology and some applications. J Biochem Biophys Methods. 1982;6:317–339. doi: 10.1016/0165-022x(82)90013-6. [DOI] [PubMed] [Google Scholar]
- Deiwick J, Hensel M. Regulation of virulence genes by environmental signals in Salmonella typhimurium. Electrophoresis. 1999;20:813–817. doi: 10.1002/(SICI)1522-2683(19990101)20:4/5<813::AID-ELPS813>3.0.CO;2-Q. [DOI] [PubMed] [Google Scholar]
- Encarnación S, del Carmen Vargas M, Dunn MF, Dávalos A, Mendoza G, Mora Y, Mora J. AniA regulates reserve polymer accumulation and global protein expression in Rhizobium etli. J Bacteriol. 2002;184:2287–2295. doi: 10.1128/JB.184.8.2287-2295.2002. [DOI] [PMC free article] [PubMed] [Google Scholar]
- Eymann C, Homuth G, Scharf C, Hecker M. Bacillus subtilis functional genomics: global characterization of the stringent response by proteome and transcriptome analysis. J Bacteriol. 2002;184:2500–2520. doi: 10.1128/JB.184.9.2500-2520.2002. [DOI] [PMC free article] [PubMed] [Google Scholar]
- Encarnación S, Guzmán Y, Dunn MF, Hernández M, Mora J. Proteome analysis of aerobic and fermentative metabolism in Rhizobium etli CE3. Proteomics. 2003;3:1077–1085. doi: 10.1002/pmic.200300427. [DOI] [PubMed] [Google Scholar]
- Henzel WJ, Billeci TM, Stults JT, Wong SC, Grimley C, Watanabe C. Identifying proteins from two-dimensional gels by molecular mass searching of peptide fragments in protein sequence databases. Proc Natl Acad Sci USA. 1993;90:5011–5015. doi: 10.1073/pnas.90.11.5011. [DOI] [PMC free article] [PubMed] [Google Scholar]
- Kamo M, Kawakami T, Miyatake N, Tsugita A. Separation and characterization of Arabidopsis thaliana proteins by two-dimensional gel electrophoresis. Electrophoresis. 1995;16:423–430. doi: 10.1002/elps.1150160169. [DOI] [PubMed] [Google Scholar]
- Corbett JM, Dunn MJ, Posch A, Gorg A. Positional reproducibility of protein spots in two-dimensional polyacrylamide gel electrophoresis using immobilized pH gradient isoelectric focusing in the first dimension: an interlaboratory comparison. Electrophoresis. 1994;15:1205–1211. doi: 10.1002/elps.11501501182. [DOI] [PubMed] [Google Scholar]
- Klose J, Kobalz U. Two-dimensional electrophoresis of proteins: an updated protocol and implications for a functional analysis of the genome. Electrophoresis. 1995;16:1034–1059. doi: 10.1002/elps.11501601175. [DOI] [PubMed] [Google Scholar]
- Oh-Ishi M, Satoh M, Maeda T. Preparative two-dimensional gel electrophoresis with agarose gels in the first dimension for high molecular mass proteins. Electrophoresis. 2000;21:1653–1669. doi: 10.1002/(SICI)1522-2683(20000501)21:9<1653::AID-ELPS1653>3.0.CO;2-9. [DOI] [PubMed] [Google Scholar]
- Patterson S, Aebersold R. Mass spectrometric approaches for the identification of gel-separated proteins. Electrophoresis. 1995;16:1791–1814. doi: 10.1002/elps.11501601299. [DOI] [PubMed] [Google Scholar]
- Nyman TA. The role of mass spectrometry in proteome studies. Biomol Eng. 2001;18:221–227. doi: 10.1016/s1389-0344(01)00097-1. [DOI] [PubMed] [Google Scholar]
- Fenn JB, Mann M, Meng CK, Wong SF, Whitehouse CM. Electrospray ionization for mass spectrometry of large biomolecules. Science. 1989;246:64–71. doi: 10.1126/science.2675315. [DOI] [PubMed] [Google Scholar]
- Karas M, Bahr U, Ingendoh A, Hillenkamp F. Laser desorption-ionization mass spectrometric of proteins with masses 100,000 to 250,000 dalton. Angew Chem Int Ed Eng. 1989;28:760–761. [Google Scholar]
- Link A, Eng J, Schieltz D, Carmack E, Mize G, Morris D, Garvik B, Yates J. Direct analysis of protein complexes using mass spectrometry. Nat Biotechnol. 1999;17:676–682. doi: 10.1038/10890. [DOI] [PubMed] [Google Scholar]
- Porubleva L, Vander VK, Kothari S, Livier DJ, Chitnis PR. The proteome of maize: use of gene sequence and expressed sequence tag data for identification of proteins with mass fingerprints. Electrophoresis. 2001;22:1724–1738. doi: 10.1002/1522-2683(200105)22:9<1724::AID-ELPS1724>3.0.CO;2-2. [DOI] [PubMed] [Google Scholar]
- Liska AJ, Popov AV, Sunyaev S, Coughlin P, Habermann B, Shevchenko A, Bork P, Karsenti E, Shevchenko A. Homology-based functional proteomics by mass spectrometry: application to the Xenopus microtubule-associated proteome. Proteomics. 2004;4:2707–2721. doi: 10.1002/pmic.200300813. [DOI] [PubMed] [Google Scholar]
- Bernhardt J, Weibezahn J, Scharf C, Hecker M. Bacillus subtilis during feast and famine: visualization of the overall regulation of protein synthesis during glucose starvation by proteome analysis. Genome Res. 2003;13:224–237. doi: 10.1101/gr.905003. [DOI] [PMC free article] [PubMed] [Google Scholar]
- Rosen R, Ron EZ. Proteome analysis in the study of the bacterial heat-shock response. Mass Spectrom Rev. 2002;21:244–265. doi: 10.1002/mas.10031. [DOI] [PubMed] [Google Scholar]
- VanBogelen RA, Schiller EE, Thomas JD, Neidhardt FC. Diagnosis of cellular states of microbial organisms using proteomics. Electrophoresis. 1999;20:2149–2159. doi: 10.1002/(SICI)1522-2683(19990801)20:11<2149::AID-ELPS2149>3.0.CO;2-N. [DOI] [PubMed] [Google Scholar]
- Encarnación S, Dunn M, Willms K, Mora J. Fermentative and aerobic metabolism in Rhizobium etli. J Bacteriol. 1995;177:3058–3066. doi: 10.1128/jb.177.11.3058-3066.1995. [DOI] [PMC free article] [PubMed] [Google Scholar]
- Shevchenko A, Wilm M, Vorm O, Mann M. Mass spectrometric sequencing of proteins silver-stained polyacrylamide gels. Anal Chem. 1996;68:850–858. doi: 10.1021/ac950914h. [DOI] [PubMed] [Google Scholar]
- Galibert F, Finan TM, Long SR, Puhler A, Abola P, Ampe F, Barloy-Hubler F, Barnett MJ, Becker A, Boistard P, Bothe G, Boutry M, Bowser L, Buhrmester J, Cadieu E, Capela D, Chain P, Cowie A, Davis RW, Dreano S, Federspiel NA, Fisher RF, Gloux S, Godrie T, Goffeau A, Golding B, Gouzy J, Gurjal M, Hernández-Lucas I, Hong A, Huizar L, Hyman RW, Jones T, Kahn D, Kahn ML, Kalman S, Keating DH, Kiss E, Komp C, Lelaure V, Masuy D, Palm C, Peck MC, Pohl TM, Portetelle D, Purnelle D, Ramsperger U, Surzycki R, Thebault P, Vandenbol M, Vorholter FJ, Weidner S, Wells DH, Wong K, Yeh KC, Batut J. The composite genome of the legume symbiont Sinorhizobium meliloti. Science. 2001;293:668–672. doi: 10.1126/science.1060966. [DOI] [PubMed] [Google Scholar]
- Kaneko T, Nakamura Y, Sato S, Asamizu E, Kato T, Sasamoto S, Watanabe A, Idesawa K, Ishikawa A, Kawashima K, Kimura T, Kishida Y, Kiyokawa C, Kohara M, Matsumoto M, Matsuno A, Mochizuki Y, Nakayama S, Nakazaki N, Shimpo S, Sugimoto M, Takeuchi C, Yamada M, Tabata S. Complete genome structure of the nitrogen-fixing symbiotic bacterium Mesorhizobium loti. DNA Res. 2000;7:331–338. doi: 10.1093/dnares/7.6.331. [DOI] [PubMed] [Google Scholar]
- Goodner B, Hinkle G, Gattung S, Miller N, Blanchard M, Qurollo B, Goldman BS, Cao Y, Askenazi M, Halling C, Mullin L, Houmiel K, Vaudin M, Iartchouk O, Epp A, Liu F, Wollam C, Allinger M, Doughty D, Scott C, Lappas C, Markelz B, Flanagan C, Crowell C, Gurson J, Lomo C, Sear C, Strub G, Cielo C, Slater S. Genome sequence of the plant pathogen and biotechnology agent Agrobacterium tumefaciens C58. Science. 2001;14:2323–2328. doi: 10.1126/science.1066803. [DOI] [PubMed] [Google Scholar]
- González V, Bustos P, Ramírez-Romero MA, Medrano-Soto A, Salgado H, Hernández-González I, Hernández-Celis JC, Quintero V, Moreno-Hagelsieb G, Girard L, Rodriguez O, Flores M, Cevallos MA, Collado-Vides J, Romero D, Dávila G. The mosaic structure of the symbiotic plasmid of Rhizobium etli CFN42 and its relation to other symbiotic genome compartments. Genome Biol. 2003;4:R36–R36. doi: 10.1186/gb-2003-4-6-r36. [DOI] [PMC free article] [PubMed] [Google Scholar]
- del Carmen Vargas M, Encarnación S, Dávalos A, Reyes-Pérez A, Mora Y, García-de los Santos A, Brom S, Mora J. Only one catalase, katG, is detectable in Rhizobium etli, and is encoded along with the regulator OxyR on a plasmid replicon. Microbiology. 2003;149:1165–1176. doi: 10.1099/mic.0.25909-0. [DOI] [PubMed] [Google Scholar]
- Chevallet M, Santoni V, Poinas A, Rouquie D, Fuchs A, Kieffer S, Rossignol M, Lunardi J, Garin J, Rabilloud T. New zwitterionic detergents improve the analysis of membrane proteins by two-dimensional electrophoresis. Electrophoresis. 1998;19:1901–1909. doi: 10.1002/elps.1150191108. [DOI] [PubMed] [Google Scholar]
- Görg A, Obermaier C, Boguth G, Harder A, Scheibe B, Wildgruber R, Weiss W. The current state of two-dimensional electrophoresis with immobilized pH gradients. Electrophoresis. 2000;21:1037–1053. doi: 10.1002/(SICI)1522-2683(20000401)21:6<1037::AID-ELPS1037>3.0.CO;2-V. [DOI] [PubMed] [Google Scholar]
- Sabounchi-Schutt F, Astrom J, Olsson I, Eklund A, Grunewald J, Bjellqvist B. An immobiline DryStrip application method enabling high-capacity two-dimensional gel electrophoresis. Electrophoresis. 2000;21:3649–3656. doi: 10.1002/1522-2683(200011)21:17<3649::AID-ELPS3649>3.0.CO;2-T. [DOI] [PubMed] [Google Scholar]
- Hesketh AR, Chandra G, Shaw AD, Rowland JJ, Kell DB, Bibb MJ, Chater KF. Primary and secondary metabolism, and post-translational protein modifications as portrayed by proteomic analysis of Streptomyces coelicolor. Mol Microbiol. 2002;46:917–932. doi: 10.1046/j.1365-2958.2002.03219.x. [DOI] [PubMed] [Google Scholar]
- Berggren K, Chernokalskaya E, Steinberg TH, Kemper C, Lopez MF, Diwu Z, Haugland RP, Patton WF. Background-free, high sensitivity staining of proteins in one- and two-dimensional sodium dodecyl sulfate-polyacrylamide gels using a luminescent ruthenium complex. Electrophoresis. 2000;21:2509–2521. doi: 10.1002/1522-2683(20000701)21:12<2509::AID-ELPS2509>3.0.CO;2-9. [DOI] [PubMed] [Google Scholar]
- Steinberg TH, Lauber WM, Berggren K, Kemper C, Yue S, Patton WF. Fluorescence detection of proteins in sodium dodecyl sulfate-polyacrylamide gels using environmentally benign, nonfixative, saline solution. Electrophoresis. 2000;21:497–508. doi: 10.1002/(SICI)1522-2683(20000201)21:3<497::AID-ELPS497>3.0.CO;2-I. [DOI] [PubMed] [Google Scholar]
- Steinberg TH, Jones LJ, Haugland RP, Singer VL. SYPRO orange and SYPRO red protein gel stains: one-step fluorescent staining of denaturing gels for detection of nanogram levels of protein. Anal Biochem. 1996;239:223–237. doi: 10.1006/abio.1996.0319. [DOI] [PubMed] [Google Scholar]
- Wilson CM. Staining of proteins on gels: comparisons of dyes and procedures. Methods Enzymol. 1983;91:236–247. doi: 10.1016/s0076-6879(83)91020-0. [DOI] [PubMed] [Google Scholar]
- Neuhoff V, Arold N, Taube D, Ehrhardt W. Improved staining of proteins in polyacrylamide gels including isoelectric focusing gels with clear background at nanogram sensitivity using Coomassie Brilliant Blue G-250 and R-250. Electrophoresis. 1988;9:255–262. doi: 10.1002/elps.1150090603. [DOI] [PubMed] [Google Scholar]
- Blum H, Beier H, Gross HJ. Improved silver staining of plant proteins, RNA and DNA in polyacrylamide gels. Electrophoresis. 1987;8:93–99. [Google Scholar]
- Yan JX, Wait R, Berkelman T, Harry RA, Westbrook JA, Wheeler CH, Dunn MJ. A modified silver staining protocol for visualization of proteins compatible with matrix-assisted laser desorption/ionization and electrospray ionization-mass spectrometry. Electrophoresis. 2000;21:3666–3672. doi: 10.1002/1522-2683(200011)21:17<3666::AID-ELPS3666>3.0.CO;2-6. [DOI] [PubMed] [Google Scholar]
- Chiu TC, Lin YW, Huang CC, Chrambach A, Chang HT. A simple, rapid, and sensitive method for analysis of SYPRO Red labeled sodium dodecyl sulfate-protein complexes by capillary electrophoresis with laser-induced fluorescence. Electrophoresis. 2003;24:1730–1736. doi: 10.1002/elps.200305428. [DOI] [PubMed] [Google Scholar]
- Patton WF. A thousand points of light: the application of fluorescence detection technologies to two-dimensional gel electrophoresis and proteomics. Electrophoresis. 2000;21:1123–1144. doi: 10.1002/(SICI)1522-2683(20000401)21:6<1123::AID-ELPS1123>3.0.CO;2-E. [DOI] [PubMed] [Google Scholar]
- Aebersold R, Mann M. Mass spectrometry-based proteomics. Nature. 2003;422:198–207. doi: 10.1038/nature01511. [DOI] [PubMed] [Google Scholar]
- Habermann B, Oegema J, Sunyaev S, Shevchenko A. The power and the limitations of cross-species protein identification by mass spectrometry-driven sequence similarity searches. Mol Cell Proteomics. 2004;3:238–249. doi: 10.1074/mcp.M300073-MCP200. [DOI] [PubMed] [Google Scholar]
- Liska AJ, Shevchenko A, Pick U, Katz A. Enhanced photosynthesis and redox energy production contribute to salinity tolerance in Dunaliella as revealed by homology-based proteomics. Plant Physiol. 2004;136:2806–2817. doi: 10.1104/pp.104.039438. [DOI] [PMC free article] [PubMed] [Google Scholar]
- Cottrell JS. Protein identification by peptide mass fingerprinting. Pept Res. 1994;7:115–124. [PubMed] [Google Scholar]
- Jensen ON, Podtelejnikov AV, Mann M. Identification of the components of simple protein mixtures by high-accuracy peptide mass mapping and database searching. Anal Chem. 1997;69:4741–4750. doi: 10.1021/ac970896z. [DOI] [PubMed] [Google Scholar]
- Steen H, Mann M. The ABC's (and XYZ's) of peptide sequencing. Nat Rev Mol Cell Biol. 2004;5:699–711. doi: 10.1038/nrm1468. [DOI] [PubMed] [Google Scholar]
- Karas M, Hillenkamp F. Laser desorption ionization of proteins with molecular masses exceeding 10,000 Daltons. Anal Chem. 1988;60:2299–2301. doi: 10.1021/ac00171a028. [DOI] [PubMed] [Google Scholar]
- Keough T, Youngquist R, Lacey MA. Method for high-sensitivity peptide sequencing using postsource decay matrix-assisted laser desorption ionization mass spectrometry. Proc Natl Acad Sci USA. 1999;96:7131–7136. doi: 10.1073/pnas.96.13.7131. [DOI] [PMC free article] [PubMed] [Google Scholar]
- Covey TR, Huang EC, Henion JD. Structural characterization of protein tryptic peptides via liquid chromatography/mass spectrometry and collision-induced dissociation of their doubly charged molecular ions. Anal Chem. 1991;63:1193–1200. doi: 10.1021/ac00013a003. [DOI] [PubMed] [Google Scholar]
- Alwine JC, Kemp DJ, Stark GR. Method for detection of specific RNAs in agarose gels by transfer to diazobenzyloxymethyl-paper and hybridization with DNA probes. Proc Natl Acad Sci USA. 1977;74(12):5350–5354. doi: 10.1073/pnas.74.12.5350. [DOI] [PMC free article] [PubMed] [Google Scholar]
- White BA, Bancroft FC. Cytoplasmic dot hybridization. Simple analysis of relative mRNA levels in multiple small cell or tissue samples. J Biol Chem. 1982;257:8569–8569. [PubMed] [Google Scholar]
- Thomas PS. Hybridization of denatured RNA and small DNA fragments transferred to nitrocellulose. Proc Natl Acad Sci USA. 1980;77:5201–5205. doi: 10.1073/pnas.77.9.5201. [DOI] [PMC free article] [PubMed] [Google Scholar]
- Dutt MJ, Lee KH. Proteomic analysis. Curr Opin Biotechnol. 2000;11:176–179. doi: 10.1016/S0958-1669(00)00078-1. [DOI] [PubMed] [Google Scholar]