

ABSTRACT
The GARP complex is an evolutionarily conserved protein complex proposed to tether endosome‐derived vesicles at the trans‐Golgi network. While complete depletion of the GARP leads to severe trafficking and glycosylation defects, the primary defects linked to GARP dysfunction remain unclear. In this study, we utilized the mAID degron strategy to achieve rapid degradation of VPS54 in human cells, acutely disrupting GARP function. This resulted in the partial mislocalization and degradation of a subset of Golgi‐resident proteins, including TGN46, ATP7A, TMEM87A, CPD, C1GALT1 and GS15. Enzyme recycling defects led to O‐glycosylation abnormalities. Additionally, while fibronectin and cathepsin D secretion were altered, mannose‐6‐phosphate receptors were largely unaffected. Partial displacement of COPI, AP1 and GGA coats caused a significant accumulation of vesicle‐like structures and large vacuoles. Electron microscopy detection of GARP‐dependent vesicles and identifying specific cargo proteins provide direct experimental evidence of GARP's role as a vesicular tether. We conclude that the primary defects of GARP dysfunction involve vesicular coat mislocalization, accumulation of GARP‐dependent vesicles, degradation and mislocalization of specific Golgi proteins and O‐glycosylation defects.
Keywords: degron, endosome‐to‐Golgi traffic, GARP complex, glycosylation, Golgi, vesicle tethering
Cartoon illustrating defects caused by GARP dysfunction. (Left) Control cells exhibit normal Golgi morphology with a stratified distribution of enzymes and trafficking machinery. (Right) Following acute VPS54 depletion, vesicle numbers increase, the trans‐Golgi enlarges, endosome‐Golgi trafficking proteins mislocalize to vesicles, and Golgi association of vesicular coats and v‐SNAREs decreases.

1. Introduction
Proteins and lipids within the cell are continuously trafficked between the plasma membrane and the trans‐Golgi network (TGN) via the endosome‐to‐TGN pathway [1, 2]. This retrograde transport mechanism is crucial for the recycling of protein and lipid cargo, balancing the anterograde movement of membranes [3] and preventing the degradation of these components in lysosomes [4]. Some of the cargoes that utilize endosome‐to‐TGN trafficking include the copper transporters ATP7A and ATP7B [5, 6, 7], enzymes carboxypeptidase D and furin [8, 9, 10], putative ion channel TMEM87 [3] and recycling receptors such as mannose‐6‐phosphate receptors (MPRs) [11], sortilins [12, 13] and TGN46 [1]. This trafficking step is also exploited by multiple pathogens, including cholera [14], Shiga [15] and SubAB [16] toxins.
Cargo transport between cellular compartments begins with the selection and packaging of cargo into small membrane intermediates (vesicles or tubules) at the donor compartment [17] and ends with the tethering of these vesicles and their subsequent fusion with the acceptor compartment [18, 19]. At the TGN, cargo‐laden vesicle tethering is mediated by long coiled‐coil proteins known as Golgins [20, 21] and the multisubunit tethering complex (MTC) Golgi Associated Retrograde Protein (GARP) [11, 22, 23]. The GARP complex is evolutionarily conserved across a range of organisms, including humans, mice and plants [24, 25, 26]. GARP belongs to the CATCHR (Complexes associated with tethering containing helical rods) family of MTCs. It is thought to tether retrograde transport vesicles originating from endosomes, facilitating their fusion with the TGN [27, 28, 29]. The GARP complex comprises four subunits: VPS51, VPS52, VPS53 and VPS54 [23]. VPS51, VPS52 and VPS53 are shared with the EARP (endosome‐associated recycling protein) complex, while VPS54 is unique to GARP [30]. In mammalian cells, GARP's localization to the TGN relies on small GTPases ARFRP1 and ARL5 [31]. GARP's role in retrograde trafficking is supported by multiple interactions with other components of the endosome‐TGN trafficking machinery [32, 33, 34]. However, the mechanism of GARP's action remains unclear. Mutations in VPS51 have been associated with abnormal glycosylation patterns in patients [30]. Similarly, the knockout (KO) of VPS53 and VPS54 in tissue culture cells causes severe defects in N‐ and O‐linked protein glycosylation resulting from mislocalization and degradation of multiple Golgi enzymes [35, 36]. Moreover, GARP‐KO led to significant mislocalization of COPI, AP1 and GGA vesicle coats, displacement of ARF1 GEFs (GBF1 and BIG1) and severe alterations in Golgi morphology. Although the expression of missing GARP subunits rescues all observed defects, some of these defects may be secondary, arising from the persistent mistargeting of receptors and cellular trafficking machinery or cellular adaptation to the chronic loss of the GARP complex.
To investigate the primary defects caused by GARP dysfunction, we developed a novel cellular system that enables the acute depletion of VPS54, a key subunit of the GARP complex, using the auxin‐inducible degron (mAID) technology [37, 38, 39, 40]. A combination of biochemical and microscopic techniques was used to analyze the impact of acute VPS54 depletion on Golgi morphology, the stability of other GARP subunits, GARP‐interacting membrane trafficking partners, glycosylation enzymes and other Golgi resident proteins. This study provides a comprehensive view of the primary cellular defects associated with GARP dysfunction in human cells.
2. Materials and Methods
2.1. Cell Culture
hTERT‐RPE1 (retinal pigment epithelial, RPE1) and HEK293T cells used for all experiments were purchased from ATCC. RPE1 VPS54‐KO cells were described previously [36]. HeLa‐KO cells were obtained from the Bonifacino lab (NIH) [31]. RPE1, HEK293T and HeLa cells were cultured in Dulbecco's Modified Eagle's Medium (DMEM) containing Nutrient mixture F‐12 (Corning) supplemented with 10% fetal bovine serum (FBS) (Thermo Fisher). Cells were incubated in a 37°C incubator with 5% CO2 and 90% humidity. All DNA plasmids used in this work are listed in Table 1.
TABLE 1.
List of plasmids used in the study.
| Plasmid name | Source | Citation |
|---|---|---|
| AAVS1‐T2‐CRISPR in pX330 | Addgene #72833 | [37] |
| AAVS1‐CMV‐OsTIR1F74G | Addgene #140536 | [37] |
| AAVS1‐Tet‐OsTIR1(F74G)‐V5 | Addgene #158664 | [37] |
| LAMP2‐GFP | Santiago Di Pietro | [41] |
| Lenti‐Cas‐9 blast | Addgene #52962 | [42] |
| M6PRmNG‐P2A‐mScarlet3‐GS15 in pLenti‐COG4prNeo DEST | This study | |
| MK289 (mAID‐mClover‐NeoR) | Addgene #72827 | [43] |
| mVps54‐13myc in pLenti‐COG4pr‐Neo DEST | This study | |
| mVPS54‐13myc‐mAID‐mClover in pLenti‐COG4pr‐Neo DEST | This study | |
| OsTIR1 (F74G)‐V5 pLenti CMV Neo DEST (705‐1) | Farhana Sumya | This study |
| pCl‐neo‐VPS54‐13myc | Juan Bonifacino | [31] |
| pENTR1A no ccDB (w48‐1) | Addgene #17398 | [44] |
| PLenti‐CMV‐Neo‐DEST (705‐1) | Addgene #17392 | [44] |
| PLenti‐COG4pr‐Neo DEST (705‐1) | Irina Pokrovskaya | |
| pMD2.G | Addgene #12259 | [45] |
| pMDLg/pRRE | Addgene #12251 | [45] |
| pRSV‐Rev | Addgene #12253 | [45] |
2.2. Preparation of mVPS54‐mAID Expressing Cells
hTERT RPE1 VPS54‐KO cells were rescued with mVPS54‐13‐myc–mAID‐mClover. For convenience, we will use VPS54‐mAID hereafter.
Briefly, mVPS54 in pENTR1A 48‐1 was amplified using VPS54‐Xba1‐Forward (CGGCCGCACTCGAGATATCTAGACCCAG) and VPS54‐BamH1‐Reverse (ATTGGATCCGTGGTGATGGTGGTGGTGATG) primers.
The PCR product was purified using the QIAquick PCR Purification Kit (QIAGEN) following the standard protocol. To create VPS54‐mAID in pENTR1A, mVPS54 in pENTR1A (48‐1) and MK289 (mAID‐mClover‐NeoR) were digested with BamHI and XbaI and ligated. This construct was then recombined with the pLentiCOG4pr‐Neo–DEST plasmid using Gateway LR Clonase II Enzyme Mix (Thermo Fisher). The recombined plasmid was transformed into Stbl3 competent cells as per the manufacturer's instructions, and DNA was extracted using the QIAprep Spin Miniprep Kit. VPS54‐mAID pLenti clones were verified by restriction analysis. The expression of mVPS54‐mAID was validated by transfecting HEK293T cells with the selected pLenti plasmids and performing Western blot (WB) analysis using an anti‐myc antibody.
To produce lentiviral particles, HEK293FT cells were co‐transfected with equal amounts of lentiviral packaging plasmids (pMD2.G, pRSV‐Rev, pMDLg/pRRE) and the mVPS54‐mAID pLenti plasmid using Lipofectamine 3000, following the manufacturer's protocol as previously described [36]. hTERT‐RPE1 VPS54‐KO cells were transduced with the lentivirus expressing mVPS54‐mAID. Single‐cell clones were isolated by serial dilution, expanded and validated by western blot (WB) and immunofluorescence (IF) for stable expression of mVPS54‐mAID.
2.3. Construction of Cells That Co‐Express mVPS54‐mAID and OsTIR1 (F74G)‐V5
hTERT‐RPE1 VPS54‐KO cells expressing mVPS54‐mAID were transduced with lentiviral AAVS1 CMV‐OsTIR1F74G. Briefly, OsTIR1 (F74G)‐V5 was amplified using OsTIR1 (F74G)‐V5 SAL1 Forward (GAGGTCGACATGACATACTTTCCTGAAGA) and OsTIR1 (F74G)‐V5 Kpn1 Reverse (GATGGTACCTCACGTAGAATCGAGACCGA) primers.
OsTIR1 (F74G)‐V5 PCR product was purified using the QIAquick PCR Purification Kit (QIAGEN) following the standard protocol. To generate OsTIR1 (F74G)‐V5 in pENTR1A, the OsTIR1 (F74G)‐V5 PCR product was subcloned into the pENTR1A no ccDB (w48‐1) entry vector using Sal1 and KpnI restriction sites. The OsTIR1 (F74G)‐V5 in pENTR1A was then recombined with the pLenti CMV‐Neo‐DEST (705‐1) vector under the CMV promoter using Gateway LR Clonase II Enzyme Mix according to the manufacturer's instructions. The OsTIR1 (F74G)‐V5 lentiviral particles were prepared as described previously. This lentivirus was used to transduce hTERT‐RPE1 VPS54‐KO cells expressing mVPS54‐mAID. The transduced cells were tested for mVPS54‐mAID/OsTIR1 (F74G)‐V5 co‐expression by WB and IF. Single‐cell clones were then isolated by serial dilution, expanded and characterized. To induce rapid VPS54 depletion in the resulting cells, the auxin analog 5‐phenyl‐indole‐3‐acetic acid (5‐Ph‐IAA) (10 μM) was added at various time points. For convenience, the auxin analog 5‐phenyl‐indole‐3‐acetic acid (5‐Ph‐IAA) will be named AA hereafter.
HeLa VPS54‐mAID OsTIR1 (F74G)‐V5 cells were generated using a slightly different procedure. Briefly, HeLa VPS54‐KO cells were co‐transfected with AAVS1‐Tet‐OsTIR1 (F74G)‐V5 and AAVS1 T2 CRISPR in pX330. After 48 h, the selection was performed with 2 μg/mL puromycin. Single‐cell sorting was conducted to isolate OsTIR1 (F74G)‐V5 positive clones. Once these clones were established, they were transduced with mVPS54‐mAID lentiviruses. Single‐cell clones expressing mVPS54‐mAID OsTIR1 (F74G)‐V5 were isolated by serial dilution. Expression of OsTIR1 (F74G)‐V5 was induced by doxycycline (2 μg/mL) for 24 h before the experiment. To induce rapid VPS54 depletion in HeLa cells, the auxin analog AA (10 μM) was added at various time points.
2.4. Construction of RPE1 Cell Lines Stably Expressing MPR‐mNeonGreen and mScarlet‐GS15
MPR‐mNeonGreen‐P2A‐mScarlet3‐GS15‐pUC57 construct synthesized by Genescript was subcloned into pENTR1A using BamH1 and XhoI sites. The resulting construct was then recombined into the pLenti‐COG4pr‐Neo‐DEST plasmid using Gateway LR Clonase II Enzyme Mix (Thermo Fisher). The recombined plasmid was transformed into Stbl3 competent cells as per the manufacturer's instructions, and DNA was extracted using the QIAprep Spin Miniprep Kit. Correct MPR‐mNG‐P2A‐mScarlet‐GS15 pLenti clones were verified by restriction analysis. The expression of MPR‐mNG and mScarlet‐GS15 was validated by WB and IF analysis of transfected HEK293T cells. The MPR‐mNG‐P2A‐mScarlet‐GS15 lentivirus was prepared as described previously, and RPE1 mVPS54‐mAID expressing cells were transduced and sorted for single‐cell clones.
2.5. Preparation of Cell Lysates and Western Blot Analysis
To prepare cell lysates, cells grown on tissue culture dishes were washed twice with PBS and lysed in 2% SDS that was heated for 5 min at 70°C. Total protein concentration in the cell lysates was measured using the BCA protein assay (Pierce). The protein samples were prepared in 6× SDS sample buffer containing beta‐mercaptoethanol and denatured by incubation at 70°C for 10 min. Approximately 10–30 μg of protein samples were loaded onto Bio‐Rad (4%–15%) gradient gels or Genescript (8%–16%) gradient gels. Gels were transferred onto nitrocellulose membranes using the Thermo Scientific Pierce G2 Fast Blotter. Membranes were rinsed in PBS, blocked in Odyssey blocking buffer (LI‐COR) for 20 min and incubated with primary antibodies overnight at 4°C. Membranes were washed with PBS and incubated with secondary fluorescently tagged antibodies diluted in Odyssey blocking buffer for 60 min. Blots were then washed and imaged using the Odyssey Imaging System. Images were processed using the LI‐COR Image Studio software. Primary and secondary antibodies used in this work are listed in Table 2.
TABLE 2.
List of primary and secondary antibodies.
| Antibody | Source/catalog # | Species | WB dilution | IF dilution |
|---|---|---|---|---|
| ATP7A | Santa Cruz, #Sc‐376 467 | Mouse | 1:500 | 1:300 |
| β‐Actin | Sigma, #A5441 | Mouse | 1:1000 | — |
| B4GALT1 | R&D Systems, AF‐3609 | Goat | 1:500 | 1:300 |
| BET1L/GS15 | BD Biosciences, #610961 | Mouse | — | 1:500 |
| BET1L/GS15 | This lab | Rabbit | — | 1:500 |
| BIG1 | Santa Cruz, #sc‐50 391 | Rabbit | — | 1:300 |
| C1GALT1 | Santa Cruz, #SC100745 | Mouse | 1:500 | 1:300 |
| Carboxypeptidase D/CPD | Kerafast, #EB5001 | Rabbit | 1:1000 | 1:500 |
| Cathepsin D/CATD | Sigma, #C0715 | Mouse | 1:500 | — |
| CD‐M6PR/MPR | Santa Cruz, #sc365196 | Mouse | 1:1000 | — |
| CD‐M6PR/MPR | Abcam, #AB134153 | Rabbit | — | 1:1000 |
| CI‐M6PR/IGF2R | Abcam, #AB124767 | Rabbit | 1:2000 | 1:1000 |
| COPB2 | ABclonal, #A7036 | Rabbit | — | 1:400 |
| GALNT2 | Thermo Fisher, #PA521541 | Rabbit | 1:1000 | — |
| GBF1 | BD transduction laboratories, #612116 | Mouse | — | 1:500 |
| GM130/GOLGA2 | BD Biosciences, #610823 | Mouse | — | 1:500 |
| GM130/GOLGA2 | CalBiochem, #CB1008 | Rabbit | — | 1:300 |
| GOSR1/GS28 | BD Biosciences, #611184 | Mouse | 1:500 | 1:500 |
| MGAT1 | Abcam, #ab180578 | Rabbit | 1:500 | — |
| MYC | Bethyl, #A190‐105A | Rabbit | 1:2000 | 1:1000 |
| myc‐Tag | Cell signaling, #2276 | Mouse | 1:1000 | 1:500 |
| P230/GOLGA4 | BD transduction laboratories, #611280 | Mouse | — | 1:200 |
| STX5 | Santa Cruz, #sc‐365124 | Mouse | — | 1:100 |
| STX6 | R&D Systems, #AF5664‐SP | Sheep | 1:1000 | 1:400 |
| STX10 | ProteinTech, #11036‐I‐AP | Rabbit | 1:1000 | — |
| STX16 | Abcam, #AB134945 | Rabbit | 1:2000 | 1:1000 |
| TGN46/TGOLN2 | Bio‐Rad, #AHP500G | Sheep | 1:2000 | — |
| TMEM87A | Novus, #NBP1‐90532 | Rabbit | 1:1000 | 1:400 |
| VAMP4 | Synaptic Sys, #136‐002 | Rabbit | 1:500 | — |
| VPS51 | Sigma, #HPA061447 | Rabbit | 1:1000 | — |
| VPS52 | Juan Bonifacino | Rabbit | 1:1000 | — |
| VPS53 | Thermo Fisher, #PA520548 | Rabbit | 1:1000 | — |
| VPS53 | Santa Cruz, #sc514920 | Mouse | 1:500 | — |
| VPS54 | St John's Lab, #STJ115181 | Rabbit | 1:1000 | — |
| VTI1A | BD, #611220 | Mouse | 1:500 | 1:300 |
| IRDye 680 anti‐Mouse | LiCOR/926‐68170 | Goat | 1:40 000 | — |
| IRDye 800 anti‐Rabbit | LiCOR/926‐32211 | Goat | 1:40 000 | — |
| IRDye 800 anti‐Goat | LiCOR/926‐32214 | Donkey | 1:40 000 | — |
| Alexa Fluor 647 anti‐Rabbit | Jackson Immuno Research/711‐605‐152 | Donkey | 1:500 | 1:1000 |
| Alexa Fluor 647 anti‐Mouse | Jackson Immuno Research/715‐605‐151 | Donkey | 1:500 | 1:1000 |
| Alexa Fluor 647 anti‐Goat | Jackson Immuno Research/705‐605‐147 | Donkey | — | 1:1000 |
| DyLight 647 anti‐Sheep | Jackson Immuno Research/713‐605‐147 | Donkey | — | 1:1000 |
| Cy3‐anti‐Rabbit | Jackson Immuno Research/711‐165‐152 | Donkey | — | 1:1000 |
| Cy3‐anti‐Mouse | Jackson Immuno Research/715‐165‐151 | Donkey | 1:500 | 1:1000 |
| Alexa Fluor 488 anti‐Rabbit | Jackson Immuno Research/711‐545‐152 | Donkey | 1:500 | 1:1000 |
| Alexa Fluor 488 anti‐Mouse | Jackson Immuno Research/715‐545‐151 | Donkey | 1:500 | 1:1000 |
2.6. Lectin Blotting and Staining
To perform blots with fluorescent lectins, 10 μg of cell lysates were loaded onto Bio‐Rad (4%–15%) gradient gels and run at 160 V. Next, proteins were transferred to the nitrocellulose membrane using the Thermo Scientific Pierce G2 Fast Blotter. The nitrocellulose membrane was blocked with 3% bovine serum albumin (BSA) for 30 min. The lectins Helix pomatia Agglutinin (HPA) or Galanthus nivalis Lectin (GNL) conjugated to Alexa 647 fluorophore were diluted 1:1000 in 3% BSA from their stock concentration of 1 and 5 μg/μL, respectively. Blots were incubated with lectin solutions for 30 min, washed in PBS four times for 4 min each and imaged using the Odyssey Imaging System.
2.7. Immunofluorescence Microscopy
Cells were plated on glass coverslips to 80%–90% confluency and fixed with 4% paraformaldehyde (PFA) (freshly made from 16% stock solution) in phosphate‐buffered saline (PBS) for 15 min at room temperature. Cells were then permeabilized with 0.1% Triton X‐100 for 1 min, followed by treatment with 50 mM ammonium chloride for 5 min and then washed with PBS. After washing and blocking twice with 1% BSA and 0.1% saponin in PBS for 10 min, cells were incubated with primary antibody (diluted in 1% cold fish gelatin, 0.1% saponin in PBS) for 40 min, washed and incubated with fluorescently conjugated secondary antibodies for 30 min. Cells were washed four times with PBS, then coverslips were dipped in PBS and water 10 times each and mounted on glass microscope slides using Prolong Gold antifade reagent (Life Technologies). Cells were imaged with a 63× oil 1.4 numerical aperture (NA) objective of an LSM880 Zeiss Laser inverted microscope and Airyscan super‐resolution microscope using ZEN software. Quantitative analysis was performed using single‐slice confocal images. All the microscopic images shown are Z‐stacked Maximum Intensity Projection images.
2.8. Live Cell Microscopy
Cells were plated on 35 mm glass bottom dishes with No. 1.5 coverglass (MatTek Corporation). Transfection was performed using Lipofectamine 3000. After 16–18 h, just before imaging, the media were replaced with warm FluoroBrite DMEM Media (Gibco, Cat # A1896701) supplemented with 10% FBS. Imaging was conducted on an LSM880 Zeiss inverted microscope equipped with confocal optics, using a 63× oil objective with a 1.4 numerical aperture (NA) and Airyscan. The environment was maintained during imaging at 37°C, 5% CO2 and 90% humidity.
2.9. Cell Fractionation
Cells grown to 90% confluency in 15 cm dishes were washed with PBS and collected by trypsinization, followed by centrifugation at 400 × g for 5 min. The cell pellet was resuspended in 1.5 mL of cell collection solution (0.25 M sucrose in PBS) and centrifuged again at 400 × g for 5 min. The pellet was then resuspended in 1.5 mL of hypotonic lysis solution (20 mM HEPES, pH 7.2, with a protein inhibitor cocktail and 1 mM PMSF) and passed through a 25 G needle 20 times to lyse the cells. Cell lysis efficiency was assessed under a phase‐contrast microscope. Subsequently, KCl (to a final concentration of 150 mM) and EDTA (to a final concentration of 2 mM) were added. Unlysed cells and nuclei were removed by centrifugation at 1000 × g. The post‐nuclear supernatant (PNS) was transferred to a 1.5 mL Beckman tube, and the Golgi‐enriched fraction (P30) was pelleted by centrifugation at 30 000 × g for 10 min. The supernatant (S30) was then transferred to a new Beckman tube, and the vesicle‐enriched fraction was isolated by centrifugation at 100 000 × g for 1 h at 4°C using a TLA‐55 rotor.
2.10. Vesicle Immunoprecipitation (GS15 IP)
Cells grown to 90% confluency in 15 cm dishes were washed with PBS and collected by trypsinization, followed by centrifugation at 400 × g for 5 min. The cell pellet was resuspended in 1.5 mL of cell collection solution (0.25 M sucrose in PBS) and centrifuged at 400 × g for 5 min. The pellet was then resuspended in 1.5 mL of hypotonic lysis solution (20 mM HEPES, pH 7.2, with a protein inhibitor cocktail and 1 mM PMSF) and passed through a 25 G needle 20 times to lyse the cells. Cell lysis efficiency was assessed under a phase‐contrast microscope. Subsequently, KCl (to a final concentration of 150 mM) and EDTA (to a final concentration of 2 mM) were added. Unlysed cells and nuclei were removed by centrifugation at 1000 × g. The PNS was transferred to a 1.5 mL Beckman tube, and the Golgi‐enriched fraction (P30) was pelleted by centrifugation at 30 000 × g for 10 min.
The supernatant (S30) was transferred to a new tube containing 10 μL of GS15 antibody and incubated at room temperature on a rotating platform for 2 h. Subsequently, 30 μL of Dyna Protein G magnetic beads (ThermoFisher Scientific #10004D) were added to the tube with the S30 and GS15 antibody mixture. This mixture was rotated at room temperature for an additional 1 h. Proteins bound to the beads were eluted by adding 2× sample buffer with 10% β‐mercaptoethanol and heated at 95°C in a heat block for 5 min.
2.11. Secretion Assay
hTERT‐RPE1‐VPS54‐mAID expressing cells were plated in three 6‐cm dishes and grown to 90%–100% confluency. Cells were then rinsed three times with PBS and placed in 2 mL serum‐free, chemically defined medium (BioWhittaker Pro293a‐CDM, Lonza) with 1× GlutaMAX (100× stock, Gibco) added per well for 48 h. Approximately 42 h post‐incubation of cells in serum‐free, chemically defined medium, one of the wells was treated with 10 μM of AA, and the other was used as a control. After 48 h of incubation, the supernatant was collected and spun down at 3000 × g to remove floating cells. The supernatant was concentrated using a 10 kDa concentrator (Amicon Ultra 10k, Millipore); cell lysates' final concentration was 10× of the initial volume of cell‐free supernatant.
2.12. High‐Pressure Freezing, Freeze Substitution and Electron Microscopy
Sapphire disks were initially coated with a 10 nm carbon layer, followed by a collagen (Corning) coating according to the manufacturer's protocol. The coated disks were sterilized under UV light and transferred into new sterile 3 cm dishes for plating the cells. After the cells reached 80%–100% confluence, they were incubated in fresh media for 2–3 h at 37°C to equilibrate, then treated with Auxin for 0 and 3 h, respectively. High‐pressure freezing (HPF) was carried out at designated time points in a cryoprotectant solution (PBS with 2% Type IX ultra‐low melt agarose (Sigma‐Aldrich), 100 mM D‐mannitol, and 2% FBS). This procedure used a Leica EM PACT2 high‐pressure freezing unit (Leica Microsystems) equipped with a rapid transfer system, maintaining a high pressure of 2100 bar. All solutions, bayonets and sample holders were pre‐warmed to 37°C, and every step of the process was performed on a 37°C heating platform to ensure consistent temperature control.
2.13. Freeze Substitution Dehydration
Samples were transferred under liquid nitrogen into cryovials containing anhydrous acetone with 2% osmium tetroxide (OsO4), 0.1% glutaraldehyde and 1% double‐distilled (dd) H2O. The cryovials were then placed into a freeze‐substitution chamber set at −90°C and subjected to the following schedule: maintained at −90°C for 22 h, warmed at 3°C per hour to −60°C, held at −60°C for 8 h, then warmed at 3°C per hour to −30°C and kept at −30°C for 8 h before warming to 0°C. Afterwards, the samples were placed on ice and transferred to a cold room set at 4°C. Following three washes with acetone, the samples were stained with 1% tannic acid and 1% ddH2O in acetone on ice for 1 h, followed by another three acetone washes. Next, the samples were stained with 1% OsO4 and 1% ddH2O solution in acetone on ice for 1 h. Afterwards, they were washed three times for 10 min each in acetone and dehydrated through a graded ethanol series (25%, 50%, 75% and 100%) using the automatic resin infiltration protocol for the PELCO Bio‐Wave Pro laboratory microwave system. Samples were embedded in Araldite 502/Embed 812 resins with a DMP‐30 activator and baked at 60°C for 48 h.
2.14. Thin Section TEM
Thin sections, 50 nm thick, were cut using a Leica UltraCut‐UCT microtome and subsequently post‐stained with aqueous uranyl acetate and Reynolds' lead citrate (EMS).
2.15. Electron Microscopy and Image Handling
Images were taken using an FEI Tecnai TF20 intermediate‐voltage electron microscope operated at 80 keV (FEI Co.). The images were acquired with an FEI Eagle 4 k digital camera controlled with FEI software.
2.16. Colocalization Analysis
Pearson's correlation coefficient was calculated using the “Colocalization” module of Zen Blue software. The colocalization between different proteins was recorded, and the graph was made using GraphPad Prism 9.3.0. At least 30 cells were used to quantify Golgi area per group, and Pearson's correlation coefficient was measured.
2.17. Statistical Analysis
All results are representative of at least three independent experiments. Western blot images are representative of three repeats. Western blots were quantified by densitometry using the LI‐COR Image Studio software. Error bars for all graphs represent standard deviation. Statistical analysis was done using one‐way ANOVA, two‐way ANOVA or paired t‐test using GraphPad Prism software.
3. Results
3.1. Development of the Rapid GARP Inactivation System
Previous investigation of hTERT‐RPE1 GARP‐KO cells [35, 36, 46] revealed that VPS54‐KO specifically inactivates the GARP complex, dramatically changing Golgi structure and function. To uncover primary defects associated with GARP dysfunction, an auxin‐inducible degron version 2 (AID2) system [37] was utilized. VPS54, the unique subunit of the GARP complex, was tagged with the plant degron mAID and stably expressed under the control of the COG4 promoter region [47] in the RPE1 VPS54‐KO cells. The constructed cellular system also expressed the auxin receptor OsTIR1 (F74G) mutant that, in the presence of the auxin homolog 5‐phenyl‐indole‐3‐acetic acid (AA) should form a complex with mAID, directing the hybrid protein for poly‐ubiquitination and proteasomal degradation. First, we tested the functionality of the VPS54‐mAID protein by western blot (WB) (Figure 1A,B) and immunofluorescence microscopy (IF) analysis (Figure 1C). We found that the decrease in total protein abundance of TGN46/TGOLN2, B4GALT1 and GS15/BET1L observed in VPS54‐KO cells was restored upon the expression of VPS54‐mAID (Figure 1B). Furthermore, a decrease in colocalization of TGN46 (Figure 1D) and GS15 (Figure 1E) with the trans‐Golgi marker P230/GOLGA4 in VPS54‐KO cells was rescued in VPS54‐KO cells expressing VPS54‐mAID. A similar functionality test of VPS54‐mAID in HeLa VPS54‐KO cells revealed that proper Golgi localization of TGN46, GBF1 and COPB2 was restored upon expression of VPS54‐mAID (Figure S1A–C). Hence, the VPS54‐mAID construct is functional.
FIGURE 1.

Expression of VPS54‐mAID rescues VPS54‐KO defects. (A) WB analysis of RPE1 cell lysates from WT, VPS54 knockout (VPS54‐KO) and VPS54‐KO cells rescued with VPS54‐mAID. Blots were probed with anti‐myc (to detect VPS54‐myc‐mAID) and anti‐β‐Actin antibodies. (B) WB analysis of RPE1 cell lysates from WT, VPS54‐KO and VPS54‐mAID, probed with anti‐TGN46, anti‐B4GALT1 and anti‐GS15 antibodies. β‐Actin was used as a loading control. (C) Confocal microscopy images of WT, VPS54‐KO and VPS54‐mAID RPE1 probed for TGN46, GS15 and P230. (D) Quantification of IF images in (C). Pearson's correlation coefficient was used to assess the colocalization of TGN46 and P230. (E) Pearson's correlation coefficient was used to assess the colocalization of GS15 and P230. ≥ 30 cells were analyzed per sample for the quantification. Statistical significance was determined using one‐way ANOVA. **p ≤ 0.01, ***p ≤ 0.001.
3.2. Acute Depletion of VPS54 Does Not Affect the Protein Abundance of Its Protein Partners
Once we confirmed that the cells expressing VPS54‐mAID could rescue the VPS54‐KO defects, we next aimed to induce the rapid depletion of VPS54 by treating the cells with 5‐Ph‐IAA (AA) (Figure 2A). We tested the efficiency of VPS54 depletion by treating the cells with AA for 0, 0.5, 1, 2 and 3 h. WB and IF analysis demonstrated that approximately 70% of the VPS54 was depleted in 30 min, and in 3 h, almost all VPS54 was degraded (Figure 2B,C). As the cells are functionally depleted of VPS54 after 3 h of AA treatment, we classify the defects observed at this point as primary. Prolonged (24–48 h) treatment with AA resulted in a continuous depletion of VPS54‐mAID (data not shown). A similar rapid depletion of VPS54 was observed in HeLa VPS54‐KO cells expressing VPS54‐mAID (Figure S2A). IF analysis confirmed a complete depletion of VPS54‐mAID in the Golgi of AA‐treated cells (Figure S2B). To ensure that AA treatment does not induce off‐target effects, we treated wild‐type (WT) RPE1 cells and analysed the localization of various Golgi proteins (Figure S3A–E). Our results confirmed that AA treatment did not affect the localization of these proteins, even after 6 h of exposure. This supports the specificity of the AA treatment in our experimental conditions. We next examined if the depletion of VPS54 can lead to the degradation of other GARP subunits. In agreement with the data obtained with VPS54‐KO cells (unpublished data), the total protein abundance of VPS51, VPS52 and VPS53 remains mostly unchanged in cells acutely depleted of VPS54 (Figure 2D–F). Their unchanged protein abundance indicates that rapid VPS54 depletion has not resulted in destabilization and degradation of the EARP complex, as VPS51, VPS52 and VPS53 are the shared subunits of GARP and EARP complexes.
FIGURE 2.
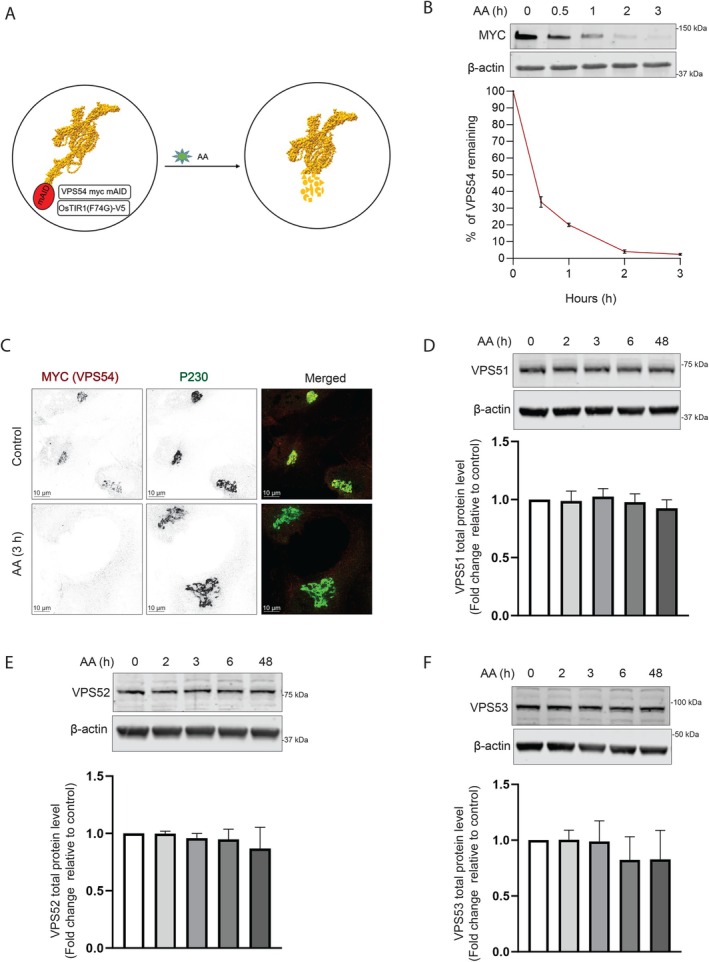
VPS54‐mAID rapid depletion does not affect the stability of other GARP subunits. (A) Diagram illustrating the cellular setup for the rapid depletion of VPS54 subunit of GARP complex using 5‐Ph‐IAA (Auxin Analogue or AA). (B) RPE1 VPS54‐mAID cells were treated with AA for 0, 0.5, 1, 2 and 3 h. (Top panel) WB with anti‐myc antibody. (Bottom Panel) Quantification of the blots from three independent experiments. (C) RPE1 VPS54‐mAID cells were treated with AA for 3 h and co‐stained for myc (red) and P230 (green). (D) WB of RPE1 VPS54‐mAID cells, treated with AA for 0, 2, 3, 6 and 48 h was performed using anti‐VPS51 antibody. (E) WB of RPE1 VPS54‐mAID cells, treated with AA for 0, 2, 3, 6 and 48 h was performed using anti‐VPS52 antibody. (F) WB of RPE1 VPS54‐mAID cells, treated with AA for 0, 2, 3, 6 and 48 h was performed using anti‐VPS53 antibody. The bottom panels in (D), (E) and (F) show quantification of the blots from three independent experiments.
3.3. Acute Depletion of VPS54 Alters the Protein Abundance and Localization of a Subset of TGN Proteins
The GARP complex is believed to tether the endosome‐derived vesicles at the TGN. Several TGN resident proteins, including TGN46/TGOLN2, ATP7A, TMEM87A, CPD and mannose‐6‐phosphate receptors, are known to cycle between the endosomes and Golgi [32, 48].
TGN46 is a single‐pass type I transmembrane protein believed to function as a receptor for secretory cargo [49]. TGN46 is localized to the TGN in a steady state, and it cycles between the TGN, endosomes and the plasma membrane [50, 51, 52, 53, 54]. Since TGN46 was significantly depleted in GARP‐KO cells [36], we reasoned that TGN46 instability could be a primary defect of GARP dysfunction. Indeed, we found that TGN46 was depleted considerably within 3 h of the induction of VPS54 degradation (Figure 3A). Additionally, TGN46 was significantly mislocalized from the Golgi to peripheral punctate structures in VPS54‐depleted cells. TGN46 mislocalization was specific since the localization of non‐cycling peripheral membrane proteins, such as the golgins GM130/GOLGA2 and P230/GOLGA4, was unaffected by GARP dysfunction (Figure 3B,E). Indeed, VPS54 depletion resulted in a significant decrease in colocalization of TGN46 with P230 (Figure 3C). As discussed later, it is possible that following the rapid degradation of VPS54, TGN46 is rerouted to endolysosomes for lysosomal degradation. In support of this model, treating VPS54‐depleted cells with lysosomal protease inhibitor (PI) resulted in partial restoration of TGN46 abundance (Figure S4A). Furthermore, co‐transfection of VPS54‐depleted cells with the rat homolog of TGN46, TGN38‐GFP and endolysosomal marker Lamp2‐mCherry resulted in partial colocalization of TGN38 with lysosomes (Figure S4B).
FIGURE 3.

Acute depletion of VPS54 alters the abundance and localization of TGN proteins. (A), (D), (G) and (J) RPE1 cells expressing VPS54‐mAID were treated with AA for 0, 2, 3, 6 and 48 h. (Top panels) WB analysis of cell lysates was performed and probed with (A) anti‐TGN46, (D) anti‐ATP7A, (G) anti‐TMEM87A and (J) anti‐CPD antibody. (Bottom panels) Quantification of the blots from three independent experiments. (B), (E), (H), (K) RPE1 cells expressing VPS54‐mAID were treated with AA for 3 h and co‐stained for (B) TGN46 and P230, (E) ATP7A and GM130, (H) TMEM87A and P230, (K) CPD and P230. (C), (F), (I) and (L) Colocalization analysis was performed by calculating the Pearson's correlation coefficient for (C) TGN46 and P230, (F) ATP7A and GM130, (I) TMEM87A and P230 and (L) CPD and P230. ≥ 30 cells were imaged per sample for the quantification. Statistical significance was assessed using one‐way ANOVA. **p ≤ 0.01, *p ≤ 0.05.
Menkes proteins (ATP7A/B) are integral to the mammalian copper transport system, which cycles continuously between the Golgi complex and the plasma membrane [55, 56]. VPS54‐KO resulted in mislocalization of ATP7A that was reversed by expression of VPS54‐mAID, indicating that ATP7A cycling is GARP‐dependent (Figure S4C). Indeed, the total protein abundance of ATP7A was significantly decreased within 3 h of the induction of VPS54 degradation (Figure 3D). Consistent with ATP7A mislocalization in GARP‐KO cells, acute depletion of VPS54 also altered the Golgi localization of ATP7A (Figure 3E,F). The internal environment of the Golgi is slightly acidic at pH 6.0–6.7 and is maintained by ion channels such as the Golgi‐pH‐regulating cation channel GolpHCat/TMEM87A [57]. We have discovered a significant decrease in the total protein level of TMEM87A in VPS54‐depleted cells, indicating that TMEM87A recycling depends on GARP function (Figure 3G). In agreement with TMEM87A sensitivity in GARP‐KO cells, the Golgi localization of TMEM87A and protein stability were significantly decreased in cells acutely depleted of VPS54 (Figure 3H,I).
Carboxypeptidase D/CPD, a transmembrane TGN enzyme, is known to recycle through endosomes and the plasma membrane [58]. IF analysis of CPD localization in WT and VPS54‐KO RPE1 cells confirmed its Golgi localization and revealed a decrease in Golgi staining in GARP‐KO cells (Figure S4D). CPD stability and localization were significantly affected in cells acutely depleted of VPS54 (Figure 3J–L). The mislocalization of TGN proteins persisted after 6 h of VPS54 depletion, indicating a sustained impact of GARP dysfunction on protein trafficking and Golgi organization (Figure S5A–D). Hence, the stability and localization of four TGN transmembrane proteins were specifically altered upon rapid GARP inactivation.
3.4. Rapid VPS54 Depletion Causes Cathepsin D Sorting Defects and Enhances Fibronectin Secretion Without Significant Alterations in Stability or Localization of Mannose‐6‐Phosphate Receptors
MPRs (mannose‐6‐phosphate receptors) are crucial for transporting lysosomal enzymes, like Cathepsin D, from the Golgi to the endosomes and then to the lysosomes [59]. There are two types of MPRs: cation‐dependent MPR (CD‐MPR/MPR) and cation‐independent MPR (CI‐MPR/IGF2R) [48, 60, 61]. After delivering their cargo, MPRs are recycled back to the Golgi for subsequent rounds of enzyme transport, and GARP is expected to be a part of the recycling machinery for MPRs [11]. Our previous work on GARP‐KO cells showed an increase in the secretion of pro‐Cathepsin D [36]. In agreement with the data in VPS54‐KO cells, we observed a significant increase in the secretion of pro‐Cathepsin D from cells acutely depleted of VPS54 (Figure 4A). At the same time, no changes in intracellular mature Cathepsin D or its precursor were observed (Figure 4B). Interestingly, pro‐Cathepsin D secretion was accompanied by the increased secretion of Fibronectin/FN1 (Figure 4C), indicating a TGN protein sorting machinery dysfunction in cells acutely depleted of VPS54. We further investigated whether GARP dysfunction stimulates the fibronectin release or if this results from protein overproduction and found that the intracellular fibronectin level remains unchanged (Figure 4D). These results collectively indicate that VPS54 acute depletion leads to TGN sorting defects.
FIGURE 4.

Acute VPS54 depletion causes secretory defects and relocalization of CD‐MPR to vesicle. (A) (Top panel) WB analysis of secreted Cathepsin D from RPE1 VPS54‐mAID cells treated with AA for 0 and 6 h. (Bottom panel) Quantification of secreted Cathepsin D from three independent experiments. (B) WB analysis of the whole cell lysates from (A), probed with anti‐Cathepsin D antibody. (Bottom panel) Quantification of intracellular Cathepsin D from three independent experiments. (C) (Top panel) WB analysis of the secreted Fibronectin from RPE1 VPS54‐mAID cells treated with AA for 0 h and 6 h. (Bottom panel) Quantification of secreted Fibronectin from three independent experiments. (D) WB analysis of the whole cell lysates from (C), probed with an anti‐fibronectin antibody. (Bottom panel) Quantification of intracellular fibronectin from three independent experiments. Statistical significance was assessed using a paired t‐test. **p ≤ 0.01. (E) (Top panel) WB analysis of RPE1 cells expressing VPS54‐mAID, treated with AA for 0, 2, 3, 6 and 48 h respectively and probed with anti‐CI‐MPR antibody. (Bottom panel) Quantification of the blots from three independent experiments. (F) RPE1 VPS54‐mAID expressing cells were treated with AA for 3 h and co‐stained for CI‐MPR and P230. (G) Colocalization of CI‐MPR to P230 of ≥ 30 cells was calculated between control and 3 h AA treatment groups using Pearson's correlation coefficient, and the graph was prepared in GraphPad prism. (H) (Top panel) WB analysis of RPE1 cells expressing VPS54‐mAID treated with AA for 0, 2, 3, 6 and 48 h, respectively, and probed with anti‐CD‐MPR antibody. (Bottom panel) Quantification of the blots from three independent experiments. (I) RPE1 VPS54‐mAID expressing cells were treated with AA for 3 h and cells were co‐stained for CD‐MPR and P230. (J) Colocalization of CD‐MPR to P230 of ≥ 30 cells was calculated between the control and 3 h AA treatment groups using Pearson's correlation coefficient and the graph was prepared in GraphPad prism. Statistical significance was calculated using a paired t‐test. *p ≤ 0.05.
Previous investigation of MPRs localization in HeLa cells suggested that siRNA depletion of VPS52 resulted in “accumulation of recycling MPRs in a population of light, small vesicles downstream of endosomes.” [11] To test if this is the case in cells rapidly depleted for VPS54, the stability and localization of CD‐MPR and CI‐MPR were tested. The total protein level of CI‐MPR and its Golgi localization were not significantly changed between control and VPS54‐depleted cells (Figure 4E–G), indicating that the trafficking pathway and/or machinery of CI‐MPR differ from other TGN transmembrane proteins. WB analysis showed that the protein level of CD‐MPR significantly decreased following acute VPS54 depletion (Figure 4H), coinciding with the appearance of a vesicle‐like haze surrounding the Golgi (Figure 4I). Interestingly, the Pearson coefficient of colocalization between CD‐MPR and the TGN marker golgin P230 increased in VPS54‐depleted cells (Figure 4J), indicating that CD‐MPR responds to GARP depletion in a manner distinct from other TGN resident proteins.
Additionally, a similar Golgi accumulation was observed for CI‐MPR after 6 h of VPS54 depletion (Figure S5E,F), indicating that the trafficking of MPRs responds to GARP depletion at varying rates. This suggests that CD‐MPR and CI‐MPR may follow unique trafficking or retention pathways under GARP‐deficient conditions. The data indicate that the missorting of cathepsin D in GARP‐depleted cells is possibly unrelated to the mistargeting of MPRs.
3.5. Acute GARP Dysfunction Affects a Subset of Golgi Enzymes, Resulting in O ‐Glycosylation Defects
Each Golgi cisterna houses a specific set of different Golgi enzymes, ion channels, pH sensors and transporters [62, 63, 64, 65, 66]. The Golgi enzymes catalyse the addition or removal of sugars to/from cargo glycoproteins and the addition of sulfate and phosphate groups [67]. Our previous study revealed that several tested Golgi enzymes, including B4GALT1, MGAT1 and GALNT2, significantly decreased in GARP‐KO cells [36]. Since these enzymes localize in different Golgi sub‐compartments, we aim to determine if the decrease in their stability is a primary or secondary defect associated with VPS54 depletion. We observed that the reduction in the protein level of B4GALT1 occurs only after a prolonged VPS54 depletion, indicating that this is not the immediate effect of GARP dysfunction (Figure 5A). Likewise, we observed no change in the Golgi localization of B4GALT1 in cells acutely depleted for VPS54 (Figure 5B,C). Similar results were obtained with MGAT1 and GALNT2 (Figure S6A–D), suggesting that the reduced protein stability of Golgi enzymes is an indirect consequence of GARP depletion. However, GARP acute depletion affected B4GALT1 localization to some extent since the localization of this enzyme became more sensitive to changes in Golgi pH induced by chloroquine treatment (Figure S7A–C), indicating that GARP activity is needed for proper trans‐Golgi homeostasis, maybe via GARP‐dependent stability of pH regulators such as TMEM87A. Supporting this observation, a 6‐h VPS54 depletion led to significant mislocalization of B4GALT1 (Figure S7D,E).
FIGURE 5.

Acute VPS54 depletion affects a subset of Golgi enzymes and results in O‐glycosylation defects. (A) WB analysis of cell lysates of AA‐treated RPE1 VPS54‐mAID cells probed with (top panels) anti‐B4GALT1 (A) and anti‐C1GALT1 (D). β‐Actin was used as a loading control. The bottom panels on (A) and (D) are the quantification of the blots from three independent experiments. (B) Airyscan microscopy of RPE1 VPS54‐mAID cells untreated (control) or treated with AA for 3 h and co‐stained for B4GALT1 and P230. (C) Colocalization of B4GALT1 with P230 of ≥ 30 cells was determined by calculation of the Pearson's correlation coefficient. (E) Airyscan microscopy of RPE1 VPS54‐mAID cells untreated (control) or treated with AA for 3 h and co‐stained for C1GALT1 and P230. (F) Colocalization of C1GALT1 with GM130 of ≥ 30 cells was determined by calculation of the Pearson's correlation coefficient. (G) Total proteins from AA‐treated RPE1 VPS54‐mAID were resolved by SDS‐PAGE and probed with (Top panel) HPA‐647 (G) and GNL‐647 (H). The bottom panels on (G) and (H) are the quantification of the blots from three independent experiments. Statistical significance was calculated using one‐way ANOVA. **p ≤ 0.01, ***p ≤ 0.001, ****p ≤ 0.0001.
In agreement with the proposed GARP‐related trans‐Golgi dysfunction, we observed a significant decrease in the protein abundance of another enzyme, C1GALT1, within 3 h of the induction of VPS54 degradation (Figure 5D). Consistent with this, there was a decrease in colocalization of C1GALT1 with GM130 (Figure 5E,F). We reasoned that C1GALT1 mislocalization/degradation could lead to a specific defect in O‐glycosylation. C1GALT1 transfers galactose from UDP‐galactose to Tn antigen (GalNAcα1‐O‐Ser/Thr) to form the core 1 O‐glycan structure, T antigen. This step is critical for the biosynthesis of complex O‐glycans [68]. Testing total cellular lysates with fluorescently labeled H. pomatia agglutin (HPA) that binds to Tn antigen revealed a significant increase in lectin binding to several protein bands (approximately 40, 50 and 120 kDa). Altered HPA binding was evident 6 h after the induction of VPS54 degradation (Figure 5G), indicating that the mislocalization of C1GALT1 in response to GARP depletion leads to O‐glycosylation defects. O‐glycosylation abnormalities progressively increased upon a prolonged (16–48 h) depletion of VPS54. The GARP‐associated O‐glycosylation defect appears specific, as fluorescently tagged GNL blot analysis did not reveal any abnormalities in proteins extracted from acutely depleted VPS54 cells, even after prolonged AA treatment (Figure 5H). These data indicate that N‐glycosylation defects are not a primary consequence of GARP dysfunction.
3.6. GS15 Is the Golgi SNARE That Depends on GARP Activity
SNAREs promote the fusion of cargo‐containing vesicles to their target membrane compartment. Once the TGN‐derived transport vesicles are fused to the endosomal compartments, the SNAREs must recycle back to the TGN. Qc SNARE GS15/BET1L is shown to have increasing concentrations across the cisternae toward the trans‐Golgi [69]. GS15 is believed to cycle via the endosomes, as it was found to be trapped in endosomes when endosome to Golgi recycling is disrupted [70]. In our study of VPS54‐KO cells, we observed a significant decrease in total protein level and Golgi localization of GS15 [36]. We wondered if GS15 is sensitive to the rapid VPS54 degradation. Indeed, after 3 h of VPS54 degradation induction, we observed that GS15 is mislocalized from the Golgi (Figure 6B,C). GS15 mislocalization led to a significant depletion of GS15 protein (Figure 6A), indicating that Qc SNARE mislocalization and consequent degradation is a primary defect of GARP dysfunction. GS28/GOSR1 is a partner of GS15 in the STX5/GOSR1/BET1L/YKT6 SNARE complex, and GS28 depletion leads to GS15 instability [71]. Interestingly, we observed that GS28 protein stability or localization was not significantly altered upon VPS54 acute depletion, and its expression was decreased only after 48 h of GARP malfunction (Figure 6D and data not shown), indicating that GS15 relies on GARP function independently of its SNARE partner. Moreover, the stability of another GS15 SNARE partner, Qa SNARE STX5, was insensitive to GARP dysfunction (Figure 6E). Despite the data that GARP was shown to regulate the formation or stability of STX16/STX6/VTI1A/VAMP4 SNARE complex [22], we found that the stability of STX6, VTI1A, VAMP4 and STX10 remained unaffected by VPS54 degradation (Figure 6E). These results indicate that GS15 is a unique Golgi SNARE protein that relies on GARP for its localization and stability.
FIGURE 6.
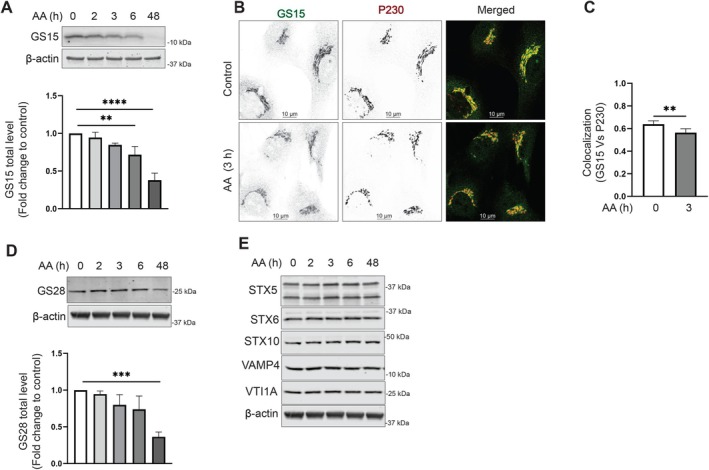
v‐SNARE GS15 is mislocalized in VPS54‐depleted cells. (A) RPE1 VPS54‐mAID cells were treated with AA as indicated, and cell lysates were probed with (top panel) anti‐GS15 (A) and anti‐GS28 (D). β‐Actin was used as a loading control. The bottom panels on (A) and (D) are the quantification of the blots from three independent experiments. (B) Airyscan microscopy of RPE1 VPS54‐mAID cells untreated or treated with AA for 3 h and co‐stained for GS15 and P230. (C) Colocalization analysis of GS15 and P230 of ≥ 30 cells was done by calculating Pearson's correlation coefficient. Statistical significance was calculated using a paired t‐test. **p ≤ 0.01. (F) WB analysis of RPE1 VPS54‐mAID cells treated with AA and probed with antibodies to STX5, STX6, STX10, VAMP4 and VTI1A, respectively. β‐Actin was used as a loading control.
3.7. Acute VPS54 Depletion Mislocalizes Vesicular Adaptor Proteins and COPI Coats
Previous investigation of GARP‐KO cells revealed that several Golgi‐localized vesicular coats, including AP1, GGA and COPI, were mislocalized to the cytosol and peripheral membranes. Coat binding to the Golgi membrane requires activation of ARF GTPases, facilitated by ARFGEF proteins GBF1, BIG1/ARFGEF1 and BIG2/ARFGEF2 [72]. In GARP‐KO cells, ARFGEFs were mislocalized from the Golgi ribbon to the cytosol and endolysosomal compartment [46]. To test if the Golgi coat localization defect is a primary manifestation of GARP malfunction, we investigated the localization of β‐adaptin (Figure 7A), GGA2 (Figure 7B), COPB2 (Figure 7C), GBF1 (Figure 7D), and BIG1 (Figure S8) in cells acutely depleted of VPS54. Colocalization analysis revealed that 3 h of VPS54 depletion was sufficient to cause significant alterations in the localization of all three coats. In contrast, the localization of BIG1 and GBF1 remained largely unaffected.
FIGURE 7.

Acute VPS54 depletion mislocalizes vesicular adaptor proteins and COPI coats. (Top panel) Airyscan microscopy of RPE1 VPS54‐mAID cells untreated and treated with AA for 3 h and co‐stained for (A) β‐adaptin and GM130 (B) GGA2 and GM130 (C) COPB2 and GM130 (D) GBF1 and GM130. (Bottom panel) Colocalization analysis of (A) β‐adaptin and GM130 (B) GGA2 and GM130 (C) COPB2 and GM130 (D) GBF1 and GM130 of ≥ 30 cells was done by calculation of the Pearson's correlation coefficient. **p ≤ 0.01.
3.8. Rapid VPS54 Depletion Causes Accumulation of GARP‐Dependent Vesicles
Previous electron microscopy analysis of VPS54‐KO cells revealed significant structural alterations in the Golgi complex, including swollen and partially fragmented cisternae. Notably, there was no substantial accumulation of small trafficking intermediates in GARP‐KO cells, raising questions about GARP's role as a vesicle tether [46]. To further investigate, we employed high‐pressure freezing (HPF) and freeze substitution (FS) sample preparation for transmission electron microscopy (TEM) to identify early morphological changes in VPS54‐depleted RPE1 cells. Our analysis revealed a significant increase in small vesicle‐like structures (50–60 nm in diameter) near the Golgi (Figure 8A,B), supporting the role of GARP in vesicle tethering and suggesting that vesicle accumulation is an acute but transient phenotype of GARP complex dysfunction. Stalled GARP‐dependent vesicles will likely be cleared by autophagy since we observed several autophagosomes in the Golgi area of VPS54‐depleted cells. Some autophagosomes were filled with vesicle‐like structures (Figure 8A, right panel shown by asterisk). Additionally, analysis of TEM images revealed the presence of large, round structures (0.2–0.6 microns in diameter) in the Golgi area. Electron‐dense material frequently accumulates on one side of this organelle, possibly indicating the aggregation of lumenal cargo. The remainder of the Golgi stack appeared intact and not fragmented, indicating that the swollen Golgi in GARP‐KO cells is likely a secondary manifestation of GARP dysfunction (Figure 8A). We hypothesized that the round structures represent altered TGN or enlarged late endosomal compartments resulting from the depletion of components of the endosome‐to‐TGN recycling machinery. If this is the case, the enlarged structures must carry endosome‐to‐TGN receptors, like MPRs, which are known to recycle through this pathway [11].
FIGURE 8.

Rapid VPS54 depletion results in the accumulation of GARP‐dependent vesicles and alteration of TGN morphology. (A) Transmission Electron Microscopy of high‐pressure frozen RPE1 VPS54‐mAID cells grown on sapphire discs before and after 3 h of AA treatment. “G” indicates Golgi stacks. Arrowheads point to vesicle‐like structures. Arrows indicate the enlarged vacuolar structures accumulated near the Golgi. Asterisks indicate the autophagosomes. Scale bar, 500 nm. (B) The graph represents the quantification of the total number of vesicles around the Golgi before and after 3 h of AA treatment. (C) Schematic of the cellular fractionation experiment to prepare P30 (Golgi), and P100 (Vesicle) fractions from control and 3 h AA treated groups. (D) WB analysis of TGN localized proteins (TGN46, CI‐MPR and CD‐MPR) in Golgi and vesicle fractions. (E) WB analysis of Golgi enzymes (B4GALT1, MGAT1, C1GALT1, GALNT2 and CPD) in Golgi and vesicle fractions. (F) WB analysis of SNAREs (STX5, GS15, STX10, STX6) in Golgi and vesicle fractions.
To investigate whether GARP dysfunction leads to the accumulation of MPR in enlarged structures, we used VPS54‐mAID cells stably expressing MPR‐NeonGreen to do the live‐cell imaging in control (Movie S1) and VPS54‐depleted cells (Movie S2). Live‐cell imaging of VPS54‐depleted cells revealed the MPR‐NeonGreen signal in Golgi membranes, small vesicles and large round organelles, similar to the round structures observed by TEM (Movie S2). We concluded that the accumulation of enlarged structures and small vesicles is a primary defect associated with GARP dysfunction. To better understand the nature of GARP‐dependent vesicles, RPE1 VPS54‐mAID cells were treated with AA for 3 h and then mechanically disrupted and fractionated through differential centrifugation to separate Golgi membranes (P30) and vesicles (P100) (Figure 8C). We analyzed the distribution of three categories of proteins: endosome‐TGN cycling receptors, Golgi enzymes and Golgi SNAREs. WB analysis revealed that acute GARP inactivation led to the redistribution into the vesicular fraction of several proteins in these three categories, such as the recycling receptor CD‐MPR (Figure 8D), the Golgi enzyme CPD (Figure 8E) and the Golgi SNAREs GS15 (Figure 8F), STX10 (Figure 8F) and STX6 (Figure 8F). Notably, the v‐SNARE GS15 showed a significant increase in the vesicular pool following rapid GARP depletion (Figure 8F; Figure S9A), prompting us to use it to isolate the vesicles containing GS15 by native immunoprecipitation (Figure S9B). WB analysis demonstrated a 2.5‐fold increase in GS15 protein in pull‐down vesicles after acute GARP depletion (Figure S9C), while TGN46 levels decreased significantly (Figure S9D). A significant decrease in the TGN46 signal in GS15 vesicles isolated from GARP‐depleted cells likely indicates that the recycling pathways of TGN46 and GS15 are differently affected by VPS54 depletion (Figure S9D).
WB analysis of several Golgi enzymes, including B4GALT1, MGAT1 and GALNT2, did not reveal any significant changes in their abundance in GS15‐positive vesicles isolated before and after VPS54 acute depletion (data not shown), but another Golgi enzyme, C1GALT1, was notably enriched in GARP‐dependent vesicles, suggesting that its mislocalization contributes to the O‐glycosylation defects observed in VPS54‐depleted cells (Figure S9E). The endosome‐TGN SNAREs STX6 (Figure S9F) also showed a significant increase in GARP‐dependent GS15‐positive vesicles despite no change in its total protein levels (Figure S9F).
Overall, the analysis of human cells acutely depleted for VPS54 revealed a marked increase in GS15‐positive vesicles containing a subset of Golgi recycling proteins, highlighting a specific role for the GARP complex in the Golgi‐endosomal trafficking cycle.
4. Discussion
In this study, we have uncovered the immediate defects associated with GARP dysfunction and therefore distinguished between the primary and secondary defects, which are observed in previous studies of GARP knockout and knock‐down in mammalian cells [3, 11, 22, 36, 46]. We discovered that the mislocalization of vesicle coat proteins, an increased number of GARP‐dependent vesicles, alteration of trans‐Golgi morphology, decreased stability and mislocalization of endosome‐to‐TGN cycling proteins and O‐glycosylation are primary defects of GARP dysfunction (Figure 9). These primary defects lead to O‐glycosylation abnormalities and missorting of lysosomal cargo proteins.
FIGURE 9.

Cartoon (made with BioRender.com) depicting the defects associated with GARP dysfunction. (Left) Control cells with normal Golgi morphology, Golgi enzymes, endosome‐Golgi trafficking proteins and a component of trafficking machinery such as coats and SNAREs. (Right) 3 h post‐depletion of VPS54, the trans‐side of Golgi is enlarged, the vesicle number is increased, endosome‐Golgi trafficking proteins are mislocalized and redistributed to vesicles and Golgi‐associated coat proteins and SNAREs are decreased.
While the degron activation resulted in a rapid depletion of VPS54, it did not change the total protein abundance of other subunits of GARP, supporting the notion that the EARP complex, which shares VPS51, VPS52 and VPS53 with GARP, is significantly more abundant than GARP [73]. In the future, it will be important to construct and test cells acutely depleted of shared and unique EARP subunits to determine the specific roles of each complex in the TGN/endolysosomal trafficking cycle.
One of the primary defects observed following VPS54 depletion is the mislocalization of three key protein coat complexes: COPI, AP‐1 and GGA. This defect is likely linked to vesicle tethering disruptions associated with GARP malfunction. Notably, a similar pattern of coat mislocalization was previously reported in VPS54 KO cells, which was also accompanied by the mislocalization of the ARFGEFs GBF1 and BIG1. When examining the localization of ARFGEFs in cells acutely depleted of VPS54, no significant mislocalization was observed at the whole‐cell level, likely due to the high background signal from antibody staining. However, quantification of GBF1, specifically in the Golgi region indicates a slight decrease in its Golgi localization (data not shown). This reduction could potentially affect Golgi levels of ARF1‐GTP, essential for the membrane association of all three vesicular coats [74]. Further confirmation of this finding will require the use of more sensitive tools.
GARP is critical for cellular sphingolipid homeostasis [75], which may, in turn, influence phosphoinositide turnover through lipid exchange mechanisms at ER/TGN contact sites [76]. Since GBF1 binds to phosphoinositides, particularly PI3P, PI4P and PI(4,5)P2, for membrane association [77], one possibility is that GARP depletion acutely disrupts the balance of Golgi phosphoinositides, thereby affecting GBF1 membrane binding. Two studies in yeast have reported transport defects in plasma membrane‐localized flippases following GARP deletions [78, 79]. It will be critical to investigate whether similar defects occur in mammalian cells acutely depleted of GARP complex function.
Previous analysis of HeLa cells detected accumulation of CI‐MPR in vesicle‐like cytoplasmic staining and a light membrane fraction in VPS52‐RNAi‐depleted cells [11], suggesting the buildup of small trafficking carriers. However, more recent TEM studies of GARP knockout cells did not detect vesicle accumulation [46], raising questions about the role of GARP in vesicle tethering. RNAi and CRISPR/Cas9 KO techniques require several days for protein depletion, which could introduce artifacts and/or allow cellular adaptation to the loss of the target protein. The detection of GARP‐dependent vesicles by TEM in cells acutely depleted for VSP54, along with identifying specific cargo proteins associated with these trafficking carriers, provides the first direct experimental evidence supporting GARP's role as a vesicular tether. TEM data also suggested that accumulated GARP‐dependent vesicles are being removed by autophagy, resolving the discrepancy between phenotypes in acutely depleted versus GARP‐KO cells.
What is the protein cargo of GARP‐dependent transport carriers? Our analysis identified several transmembrane Golgi resident proteins whose abundance and/or localization were significantly affected by acute VPS54 depletion. The list includes TGN46, ATP7A, TMEM87A, CPD, CD‐MPR, C1GALT1, GS15, STX6 and STX10. Consistent with previous reports in VPS54‐KO cells, the TGN46 protein was highly sensitive to VPS54 depletion. We found that TGN46 began to mislocalize from the Golgi into punctate structures within 1 h of inducing VPS54 degradation (unpublished data), making TGN46 the fastest responder to VPS54 loss. This suggests that TGN46 may cycle between the TGN and endolysosomal compartments at a rapid rate, and GARP dysfunction quickly leads to its degradation in lysosomes. Supporting this hypothesis, pretreatment of GARP‐deficient cells with protease inhibitors partially rescued TGN46 expression. Although TGN46 was detected in immunoprecipitated GS15 vesicles, GARP malfunction did not lead to the accumulation of TGN46 in GS15 carriers, indicating that the trafficking itinerary of this putative cargo receptor is distinct from that of GS15. Future investigations monitoring transport carriers via live microscopy using fluorescently tagged TGN46 in GARP‐depleted cells should help clarify this issue.
ATP7A, also known as Menke's protein, is predominantly localized at the TGN and is responsible for regulating copper homeostasis in cells [6, 80, 81, 82, 83]. In the steady state, ATP7A is in the Golgi, but when the cellular copper concentration is high, ATP7A migrates to the plasma membrane and regulates intracellular copper levels [84]. A study by Hartwig et al. showed that ATP7A interacts with the COG complex [85], and the ablation of the COG complex downregulated ATP7A in mammalian cells [86], indicating rapid intra‐Golgi recycling of this copper transporter. ATP7A has also been shown to interact physically with the AP‐1 coat complex and AP‐1 regulates ATP7A localization under basal copper concentrations [87]. AP‐1 is preferentially regulating endosome to Golgi retrograde trafficking [88], and it is likely that GARP depletion blocks constitutive endosome/Golgi recycling of ATP7A, leading to its mistargeting and degradation. Another GARP‐sensitive protein, TMEM87A, appears to play a critical role in maintaining Golgi pH, and its knockout in mice leads to Golgi fragmentation and altered protein glycosylation [57, 89]. Furthermore, overexpression of TMEM87A in VPS54‐KO cells partially restored retrograde transport from endosomes to the TGN [3]. Notably, GARP‐deficient cells became hypersensitive to chloroquine treatment that elevated Golgi pH. The specific mislocalization of the C1GALT1 enzyme and TMEM87A depletion‐related changes in Golgi pH may contribute to O‐glycosylation defects in VPS54‐depleted cells. Although GNL analysis did not reveal any early N‐glycosylation defects associated with acute GARP dysfunction, we cannot entirely rule out the role of GARP in N‐glycosylation. GNL‐647 detects specific aspects of N‐glycosylation and does not account for potential alterations occurring after oligomannose processing, particularly modifications in the trans‐Golgi. Supporting this notion, the localization of B4GALT1 was partially disrupted in VPS54‐depleted cells (Figure S7). This suggests that GARP dysfunction may impact later stages of N‐glycosylation.
It remains unclear whether TGN golgins and GARP regulate distinct or overlapping trafficking pathways. On the one hand, golgin‐decorated mitochondria can attract trafficking intermediates carrying CI‐MPR [20], a receptor unaffected by acute VPS54 depletion, suggesting that GARP and golgins may be involved in tethering different membrane carriers. On the other hand, both GARP and TGN golgin membrane recruitment are regulated by the same small GTPase, ARFRP1 [31], and our preliminary data show a very close spatial proximity between golgins and GARP (data not shown), pointing to a possible coordination between the two. Future investigations into membrane trafficking in cells deficient in golgins and GARP will help clarify whether there is redundancy within the TGN tethering machinery [90].
Our data indicate that acute depletion of VPS54 results in progressive defects, as 6 h of GARP depletion affected the sorting of the lysosomal enzyme cathepsin D, resulting in increased secretion of its precursor. However, we observed that both CI‐MPR and CD‐MPR mostly stayed in the Golgi proper, challenging the notion that GARP is directly involved in the trafficking of MPR proteins in human cells. One explanation of the microscopy data is that the tethering of MPR‐carrying intermediates is primarily mediated by TGN golgins [20], but biochemical data suggest a more complex scenario. Cellular fractionation of VPS54‐depleted cells showed that some CD‐MPR, but not CI‐MPR, was redistributed to the GARP‐dependent vesicle fraction, indicating that the two mannose‐6‐phosphate receptors may follow different TGN‐endosome pathways. Another piece of evidence supporting this notion is that we observed a significant accumulation of CI‐MPR in the Golgi area after only 6 h of GARP depletion. It is plausible that the partial mislocalization of CD‐MPR and potential changes in TGN acidity due to the mislocalization of TMEM87A could be a primary cause of the missorting of pro‐cathepsin D.
Interestingly, we found that 6 h of acute depletion of VPS54 also affected fibronectin secretion. The increase in the secretion of FN1 was not due to the increase in its expression and could be related to the altered pH and/or morphology of the TGN. A study by Koreishi et al. showed that cells with altered Golgi morphology stimulate the transport of secretory alkaline phosphatase [91], suggesting the importance of Golgi morphology and GARP machinery in controlling the protein secretion rate and quality. This potential GARP function agrees with the recently discovered AP‐1‐driven cycling of secretory cargo in yeast cells [92].
How many types of trafficking intermediates are regulated by the GARP complex? Initial characterization of GS15‐containing vesicles revealed the accumulation of three GARP‐dependent proteins, Golgi enzyme C1GALT1 and two SNAREs GS15 and STX6. However, the abundance of TGN46 was significantly decreased in GS15‐containing carriers isolated from VPS54‐deprived cells, indicating that at least some TGN46 is returned from post‐Golgi compartments by different carriers.
Another question concerns the composition and distribution of vesicle fusion machinery regulated by GARP. Qc SNARE GS15 is accumulated in GARP‐dependent trafficking intermediates, but GS15‐KO results in phenotypes much milder than VPS54‐KO [46, 71], and GARP is not known to regulate SNARE GS15‐containing complexes. Instead, GARP is predicted to regulate the STX16/STX6/VTI1A/VAMP4 SNARE complex [22], but, intriguingly, STX16 SNARE assembly is also controlled by the COG vesicle tethering complex [93]. Moreover, cells acutely depleted of VPS54 did not show any mislocalization or degradation of R‐SNARE VAMP4, while Qa–SNARE STX16 is accumulated in GS15‐independent vesicle carriers (data not shown). Future proteomic analysis of GARP‐dependent trafficking intermediates should clarify these crucial questions.
In summary, analysis of human cells acutely depleted for VPS54 revealed key cellular defects linked to GARP dysfunction (Table 3). Future proteomic studies on GARP‐dependent trafficking intermediates, combined with proximity labeling and in vitro methods, will enhance our understanding of GARP's role in membrane trafficking.
TABLE 3.
Golgi proteins affected by acute and prolonged GARP depletion.
| Affected proteins | Early defects (up to 3 h of VPS54 depletion) | Late defects (more than 6 h of VPS54 depletion or KO) |
|---|---|---|
| TGN proteins |
TGN46 ATP7A TMEM87A CPD |
|
| Golgi SNAREs | GS15/BET1L | GS28/GOSR1 |
| Golgi enzymes | C1GALT1 |
B4GALT1 MGAT1 GALNT2 |
| Calcium homeostasis maintenance proteins |
SDF4 ATP2C1 |
|
| ARFGEFs |
BIG1 GBF1 |
|
| Coats/adaptors/accessory proteins |
β‐adaptin GGA2 COPB2 |
Ethics Statement
This paper does not include any patient or animal data.
Conflicts of Interest
The authors declare no conflicts of interest.
Peer Review
The peer review history for this article is available at https://www.webofscience.com/api/gateway/wos/peer‐review/10.1111/tra.70003.
Supporting information
Figure S1. VPS54‐mAID rescue Golgi localization defects in VPS54‐KO HeLa cells. HeLa cells expressing VPS54‐mAID and VPS54‐KO were stained with antibodies to TGN46 (A), GBF1 (B) and COPB2 (C) and analyzed by confocal microscopy.
Figure S2. Efficient depletion of VPS54 in HeLa cells expressing VPS54‐mAID following AA treatment. (A) WB analysis of HeLa cells expressing VPS54‐mAID following rapid VPS54 depletion for 0, 0.5, 1, 2, 3, 24 and 48 h respectively and probed with anti‐myc (VPS54) antibody. The bottom panel shows the quantification of the blot. (B) HeLa cells expressing VPS54‐mAID were co‐stained with myc (red) and B4GALT1 (green) after 3 h of VPS54 depletion.
Figure S3. AA treatment does not alter the localization of Golgi proteins in wild‐type RPE1 cells. (A) Airyscan microscopy of RPE1 cells untreated or treated with AA for 6 h and co‐stained for GS15 and P230. Colocalization analysis of (B) GS15, (C) TGN46, (D) GBF1, (E) C1GALT1 and P230 of ≥ 30 cells was done by calculation of Pearson’s correlation coefficient. Statistical significance was calculated using a paired t‐test. **p ≤ 0.05.
Figure S4. Effect of VPS54‐KO on ATP7A and CPD localization. (A) (Top panel) WB analysis of RPE1 VPS54‐mAID cells treated with AA and protease inhibitors cocktail (PI) and probed with anti‐TGN46. (Bottom panel) Quantification of the blots from three independent experiments. Statistical significance was assessed using one‐way ANOVA. ****p ≤ 0.0001, **p ≤ 0.01. (B) Airyscan microscopy of RPE1 VPS54‐mAID cells transiently transfected with LAMP2‐mCherry and TGN38‐GFP for 24 h followed by 3 h AA treatment. (C) Airyscan microscopy of RPE1 WT, VPS54‐KO and VPS54‐mAID cells stained with anti‐B4GALT1, anti‐GM130 and anti‐ATP7A antibodies. (D) Co‐staining of RPE1 WT and VPS54‐KO cells for CPD and P230 using anti‐CPD and anti‐P230 antibodies.
Figure S5. Localization of Golgi proteins after 6 h of VPS54 depletion. (A) Airyscan microscopy of RPE1 VPS54‐mAID cells untreated or treated with AA for 6 h and co‐stained for TGN46 and P230. Colocalization analysis of (B) TGN46, (C) GS15 and P230, (D) ATP7A and GM130 of ≥ 30 cells was done by calculation of Pearson’s correlation coefficient. Statistical significance was calculated using a paired t‐test. **p ≤ 0.05. (E) Airyscan microscopy of RPE1 VPS54‐mAID cells untreated or treated with AA for 6 h and co‐stained for CI‐MPR and P230. (F) Colocalization of CI‐MPR with P230 of ≥ 30 cells was determined by calculating Pearson’s correlation coefficient.
Figure S6. Acute VPS54 depletion does not affect the Golgi enzymes MGAT1 and GALNT2 in RPE1 cells. (A) WB analysis of total lysates of RPE1 VPS54‐mAID cells treated with AA and probed with (Top panel) anti‐MGAT1 (A) and anti‐GALNT2 (D). β‐actin was used as a loading control. The bottom panels on (A), and (D) are the quantification of the blots from three independent experiments. (B) Airyscan microscopy of RPE1 VPS54‐mAID cells untreated or treated with AA for 3 h and co‐stained for MGAT1 and P230. (C) Colocalization analysis of MGAT1 with P230 was done by calculation of Pearson’s correlation coefficient.
Figure S7. Rapid depletion of VPS54 stimulates B4GALT1 relocation to endosomes following CQ treatment. (A) IF images of RPE1 VPS54‐mAID cells. Untreated cells (control), or treated with CQ for 3 h (CQ), or treated with AA for 1 h followed by CQ treatment for 3 h (AA + CQ), or treated with AA and CQ and recovered for 3 h (AA + CQ + W), or treated with CQ and recovered for 3 h (CQ + W) were stained for GPP130, B4GALT1 and Giantin. (B) Colocalization analysis of B4GALT1 and Giantin was done by calculating Pearson’s correlation coefficient. Statistical significance was calculated using one‐way ANOVA. **p ≤ 0.01, ***p ≤ 0.001, ****p ≤ 0.0001. (C) Colocalization analysis of GPP130 and Giantin was also done by calculation of Pearson’s correlation coefficient. Statistical significance was calculated using one‐way ANOVA. (D) Airyscan microscopy of RPE1 VPS54‐mAID cells untreated or treated with AA for 6 h and co‐stained for B4GALT1 and P230. (F) Colocalization of B4GALT1 with P230 of ≥ 30 cells was determined by calculation of Pearson’s correlation coefficient.
Figure S8. Acute VPS54 depletion does not affect BIG1 localization. (A) Airyscan microscopy of RPE1 VPS54‐mAID cells untreated or treated with AA for 6 h and co‐stained for BIG1 and P230. Colocalization of BIG1 and P230 after (B) 6 h and (C) 3 h of AA treatment was determined by the calculation of the Pearson’s correlation coefficient.
Figure S9. Acute VPS54 depletion led to the accumulation of C1GALT1 and STX6 in the GS15 positive vesicles. (A) WB analysis of GS15 in Golgi and vesicle fraction before (−) and after (+) acute VPS54 depletion. (B) Schematic of GS15 IP from the vesicular fraction (S30) using GS15 antibody in control and AA‐treated groups. (C–F) (Top panel) WB analysis of GS15 IP in control and AA‐treated groups probed with anti‐GS15 (C), TGN46 (D), C1GALT1 (E) and STX6 (F). (C–F) (Bottom panel) The graph quantifies three independent blots.
Movie S1. Super‐resolution Airyscan live cell imaging of RPE1 cells stably expressing CD‐MPR‐neon green. RPE1 VPS54‐mAID cells were stably expressed with CD‐MPR‐neon green and imaged in real time without AA. Live cell imaging was done for 60 frames in 30 s.
Movie S2. Super‐resolution Airyscan live cell imaging of RPE1 cells stably expressing CD‐MPR‐neon green treated with AA for 3 h. RPE1 VPS54‐mAID cells stably expressed with CD‐MPR‐neon green were treated with AA for 3 h and imaged in real time (AA 3 h). Live cell imaging was done for 60 frames in 30 s. Arrows on VPS54 depleted cells showed the accumulation of CD‐MPR in the enlarged round compartment near the Golgi. The timestamp represents seconds.
Acknowledgments
We are very immensely thankful to Juan S. Bonifacino for providing the HeLa VPS54‐KO cell line and plasmids used in the study. We acknowledge Tetyana Kudlyk's contribution to creating the cell lines and Farhana Taher Sumya for preparing lentivirus expressing OsTIR1 (F74G)‐V5. We want to be thankful to Eric Campeau, Wei Guo, Paul Kaufman, Frank Perez, Santiago M. Di Pietro, Didier Trono and others who provided reagents and cell lines. We are grateful to all members of Lupashin's lab and Roy Morello for their comments on the manuscript. This work was supported by the National Institute of Health (R01GM083144) and by the UAMS Easy Win Early Victory grant program (V.V.L).
Funding: This work was supported by the National Institute of General Medical Sciences, the National Institutes of Health (R01GM083144) and the UAMS Easy Win Early Victory Grant Program.
Data Availability Statement
All data supporting the findings of this manuscript are included in Figures 1, 2, 3, 4, 5, 6, 7, 8, 9 and Figures S1–S9. Raw data for the presented figures are available upon request.
References
- 1. Reaves B., Horn M., and Banting G., “TGN38/41 Recycles Between the Cell Surface and the TGN: Brefeldin A Affects Its Rate of Return to the TGN,” Molecular Biology of the Cell 4, no. 1 (1993): 93–105. [DOI] [PMC free article] [PubMed] [Google Scholar]
- 2. Ladinsky M. S. and Howell K. E., “The Trans‐Golgi Network Can Be Dissected Structurally and Functionally From the Cisternae of the Golgi Complex by Brefeldin A,” European Journal of Cell Biology 59, no. 1 (1992): 92–105. [PubMed] [Google Scholar]
- 3. Hirata T., Fujita M., Nakamura S., et al., “Post‐Golgi Anterograde Transport Requires GARP‐Dependent Endosome‐to‐TGN Retrograde Transport,” Molecular Biology of the Cell 26, no. 17 (2015): 3071–3084. [DOI] [PMC free article] [PubMed] [Google Scholar]
- 4. Tu Y., Zhao L., Billadeau D. D., and Jia D., “Endosome‐To‐TGN Trafficking: Organelle‐Vesicle and Organelle‐Organelle Interactions,” Frontiers in Cell and Development Biology 8 (2020): 163. [DOI] [PMC free article] [PubMed] [Google Scholar]
- 5. Petris M., Mercer J., Culvenor J., Lockhart P., Gleeson P., and Camakaris J., “Ligand‐Regulated Transport of the Menkes Copper P‐Type ATPase Efflux Pump From the Golgi Apparatus to the Plasma Membrane: A Novel Mechanism of Regulated Trafficking,” EMBO Journal 15, no. 22 (1996): 6084–6095. [PMC free article] [PubMed] [Google Scholar]
- 6. Zhu S., Shanbhag V., Hodgkinson V. L., and Petris M. J., “Multiple Di‐Leucines in the ATP7A Copper Transporter Are Required for Retrograde Trafficking to the Trans‐Golgi Network,” Metallomics: Integrated Biometal Science 8, no. 9 (2016): 993–1001. [DOI] [PMC free article] [PubMed] [Google Scholar]
- 7. Ruturaj R., Mishra M., Saha S., et al., “Regulation of the Apico‐Basolateral Trafficking Polarity of the Homologous Copper‐ATPases ATP7A and ATP7B,” Journal of Cell Science 137, no. 5 (2024): jcs261258. [DOI] [PMC free article] [PubMed] [Google Scholar]
- 8. Varlamov O. and Fricker L. D., “Intracellular Trafficking of Metallocarboxypeptidase D in AtT‐20 Cells: Localization to the Trans‐Golgi Network and Recycling From the Cell Surface,” Journal of Cell Science 111, no. 7 (1998): 877–885. [DOI] [PubMed] [Google Scholar]
- 9. Cattin‐Ortolá J., Kaufman J. G., Gillingham A. K., et al., “Cargo Selective Vesicle Tethering: The Structural Basis for Binding of Specific Cargo Proteins by the Golgi Tether Component TBC1D23,” Science Advances 10, no. 13 (2024): eadl0608. [DOI] [PMC free article] [PubMed] [Google Scholar]
- 10. Chia P. Z. C., Gasnereau I., Lieu Z. Z., and Gleeson P. A., “Rab9‐Dependent Retrograde Transport and Endosomal Sorting of the Endopeptidase Furin,” Journal of Cell Science 124, no. 14 (2011): 2401–2413. [DOI] [PMC free article] [PubMed] [Google Scholar]
- 11. Pérez‐Victoria F. J., Mardones G. A., and Bonifacino J. S., “Requirement of the Human GARP Complex for Mannose 6‐Phosphate‐Receptor‐Dependent Sorting of Cathepsin D to Lysosomes,” Molecular Biology of the Cell 19, no. 6 (2008): 2350–2362. [DOI] [PMC free article] [PubMed] [Google Scholar]
- 12. Pan X., Zaarur N., Singh M., Morin P., and Kandror K. V., “Sortilin and Retromer Mediate Retrograde Transport of Glut4 in 3T3‐L1 Adipocytes,” Molecular Biology of the Cell 28, no. 12 (2017): 1667–1675. [DOI] [PMC free article] [PubMed] [Google Scholar]
- 13. Dumanis S. B., Burgert T., Caglayan S., et al., “Distinct Functions for Anterograde and Retrograde Sorting of SORLA in Amyloidogenic Processes in the Brain,” Journal of Neuroscience 35, no. 37 (2015): 12703–12713. [DOI] [PMC free article] [PubMed] [Google Scholar]
- 14. Matsudaira T., Niki T., Taguchi T., and Arai H., “Transport of the Cholera Toxin B‐Subunit From Recycling Endosomes to the Golgi Requires Clathrin and AP‐1,” Journal of Cell Science 128, no. 16 (2015): 3131–3142. [DOI] [PubMed] [Google Scholar]
- 15. Mallard F., Antony C., Tenza D., Salamero J., Goud B., and Johannes L., “Direct Pathway From Early/Recycling Endosomes to the Golgi Apparatus Revealed Through the Study of Shiga Toxin B‐Fragment Transport,” Journal of Cell Biology 143, no. 4 (1998): 973–990. [DOI] [PMC free article] [PubMed] [Google Scholar]
- 16. Smith R. D., Willett R., Kudlyk T., et al., “The COG Complex, Rab6 and COPI Define a Novel Golgi Retrograde Trafficking Pathway That Is Exploited by SubAB Toxin,” Traffic 10, no. 10 (2009): 1502–1517. [DOI] [PMC free article] [PubMed] [Google Scholar]
- 17. Bonifacino J. S. and Glick B. S., “The Mechanisms of Vesicle Budding and Fusion,” Cell 116, no. 2 (2004): 153–166. [DOI] [PubMed] [Google Scholar]
- 18. Whyte J. R. and Munro S., “Vesicle Tethering Complexes in Membrane Traffic,” Journal of Cell Science 115, no. 13 (2002): 2627–2637. [DOI] [PubMed] [Google Scholar]
- 19. Rothman J. E., “The Protein Machinery of Vesicle Budding and Fusion,” Protein Science 5, no. 2 (1996): 185–194. [DOI] [PMC free article] [PubMed] [Google Scholar]
- 20. Wong M. and Munro S., “The Specificity of Vesicle Traffic to the Golgi Is Encoded in the Golgin Coiled‐Coil Proteins,” Science 346, no. 6209 (2014): 1256898. [DOI] [PMC free article] [PubMed] [Google Scholar]
- 21. Cheung P.‐y P. and Pfeffer S. R., “Transport Vesicle Tethering at the Trans Golgi Network: Coiled Coil Proteins in Action,” Frontiers in Cell and Development Biology 4 (2016): 18. [DOI] [PMC free article] [PubMed] [Google Scholar]
- 22. Pérez‐Victoria F. J. and Bonifacino J. S., “Dual Roles of the Mammalian GARP Complex in Tethering and SNARE Complex Assembly at the Trans‐Golgi Network,” Molecular and Cellular Biology 29, no. 19 (2009): 5251–5263. [DOI] [PMC free article] [PubMed] [Google Scholar]
- 23. Liewen H., Meinhold‐Heerlein I., Oliveira V., et al., “Characterization of the Human GARP (Golgi Associated Retrograde Protein) Complex,” Experimental Cell Research 306, no. 1 (2005): 24–34. [DOI] [PubMed] [Google Scholar]
- 24. Koumandou V. L., Dacks J. B., Coulson R. M., and Field M. C., “Control Systems for Membrane Fusion in the Ancestral Eukaryote; Evolution of Tethering Complexes and SM Proteins,” BMC Evolutionary Biology 7 (2007): 1–17. [DOI] [PMC free article] [PubMed] [Google Scholar]
- 25. Oka T. and Krieger M., “Multi‐Component Protein Complexes and Golgi Membrane Trafficking,” Journal of Biochemistry 137, no. 2 (2005): 109–114. [DOI] [PubMed] [Google Scholar]
- 26. Bröcker C., Engelbrecht‐Vandré S., and Ungermann C., “Multisubunit Tethering Complexes and Their Role in Membrane Fusion,” Current Biology 20, no. 21 (2010): R943–R952. [DOI] [PubMed] [Google Scholar]
- 27. Santana‐Molina C., Gutierrez F., and Devos D. P., “Homology and Modular Evolution of CATCHR at the Origin of the Eukaryotic Endomembrane System,” Genome Biology and Evolution 13, no. 7 (2021): evab125. [DOI] [PMC free article] [PubMed] [Google Scholar]
- 28. Conibear E. and Stevens T. H., “Vps52p, Vps53p, and Vps54p Form a Novel Multisubunit Complex Required for Protein Sorting at the Yeast Late Golgi,” Molecular Biology of the Cell 11, no. 1 (2000): 305–323. [DOI] [PMC free article] [PubMed] [Google Scholar]
- 29. Siniossoglou S. and Pelham H. R., “An Effector of Ypt6p Binds the SNARE Tlg1p and Mediates Selective Fusion of Vesicles With Late Golgi Membranes,” EMBO Journal 20, no. 21 (2001): 5991–5998. [DOI] [PMC free article] [PubMed] [Google Scholar]
- 30. Gershlick D. C., Ishida M., Jones J. R., Bellomo A., Bonifacino J. S., and Everman D. B., “A Neurodevelopmental Disorder Caused by Mutations in the VPS51 Subunit of the GARP and EARP Complexes,” Human Molecular Genetics 28, no. 9 (2019): 1548–1560. [DOI] [PMC free article] [PubMed] [Google Scholar]
- 31. Ishida M. and Bonifacino J. S., “ARFRP1 Functions Upstream of ARL1 and ARL5 to Coordinate Recruitment of Distinct Tethering Factors to the Trans‐Golgi Network,” Journal of Cell Biology 218, no. 11 (2019): 3681. [DOI] [PMC free article] [PubMed] [Google Scholar]
- 32. Khakurel A. and Lupashin V. V., “Role of GARP Vesicle Tethering Complex in Golgi Physiology,” International Journal of Molecular Sciences 24, no. 7 (2023): 6069. [DOI] [PMC free article] [PubMed] [Google Scholar]
- 33. Gershlick D. C., Schindler C., Chen Y., and Bonifacino J. S., “TSSC1 Is Novel Component of the Endosomal Retrieval Machinery,” Molecular Biology of the Cell 27, no. 18 (2016): 2867–2878. [DOI] [PMC free article] [PubMed] [Google Scholar]
- 34. Abascal‐Palacios G., Schindler C., Rojas A. L., Bonifacino J. S., and Hierro A., “Structural Basis for the Interaction of the Golgi‐Associated Retrograde Protein Complex With the t‐SNARE Syntaxin 6,” Structure 21, no. 9 (2013): 1698–1706. [DOI] [PMC free article] [PubMed] [Google Scholar]
- 35. Khakurel A., Kudlyk T., and Lupashin V. V., “Generation and Analysis of hTERT‐RPE1 VPS54 Knock‐Out and Rescued Cell Lines,” in Golgi: Methods and Protocols (Springer US, 2022), 349–364. [DOI] [PMC free article] [PubMed] [Google Scholar]
- 36. Khakurel A., Kudlyk T., Bonifacino J. S., and Lupashin V. V., “The Golgi‐Associated Retrograde Protein (GARP) Complex Plays an Essential Role in the Maintenance of the Golgi Glycosylation Machinery,” Molecular Biology of the Cell 32, no. 17 (2021): 1594–1610. [DOI] [PMC free article] [PubMed] [Google Scholar]
- 37. Yesbolatova A., Saito Y., Kitamoto N., et al., “The Auxin‐Inducible Degron 2 Technology Provides Sharp Degradation Control in Yeast, Mammalian Cells, and Mice,” Nature Communications 11, no. 1 (2020): 5701. [DOI] [PMC free article] [PubMed] [Google Scholar]
- 38. Saito Y. and Kanemaki M. T., “Targeted Protein Depletion Using the Auxin‐Inducible Degron 2 (AID2) System,” Current Protocols 1, no. 8 (2021): e219. [DOI] [PubMed] [Google Scholar]
- 39. Nishimura K., Fukagawa T., Takisawa H., Kakimoto T., and Kanemaki M., “An Auxin‐Based Degron System for the Rapid Depletion of Proteins in Nonplant Cells,” Nature Methods 6, no. 12 (2009): 917–922. [DOI] [PubMed] [Google Scholar]
- 40. Holland A. J., Fachinetti D., Han J. S., and Cleveland D. W., “Inducible, Reversible System for the Rapid and Complete Degradation of Proteins in Mammalian Cells,” Proceedings of the National Academy of Sciences 109, no. 49 (2012): E3350–E3357. [DOI] [PMC free article] [PubMed] [Google Scholar]
- 41. Ambrosio A. L., Boyle J. A., and Di Pietro S. M., “Mechanism of Platelet Dense Granule Biogenesis: Study of Cargo Transport and Function of Rab32 and Rab38 in a Model System,” Blood 120, no. 19 (2012): 4072–4081. [DOI] [PMC free article] [PubMed] [Google Scholar]
- 42. Sanjana N. E., Shalem O., and Zhang F., “Improved Vectors and Genome‐Wide Libraries for CRISPR Screening,” Nature Methods 11, no. 8 (2014): 783–784. [DOI] [PMC free article] [PubMed] [Google Scholar]
- 43. Natsume T., Kiyomitsu T., Saga Y., and Kanemaki M. T., “Rapid Protein Depletion in Human Cells by Auxin‐Inducible Degron Tagging With Short Homology Donors,” Cell Reports 15, no. 1 (2016): 210–218. [DOI] [PubMed] [Google Scholar]
- 44. Campeau E., Ruhl V. E., Rodier F., et al., “A Versatile Viral System for Expression and Depletion of Proteins in Mammalian Cells,” PLoS One 4, no. 8 (2009): e6529. [DOI] [PMC free article] [PubMed] [Google Scholar]
- 45. Dull T., Zufferey R., Kelly M., et al., “A Third‐Generation Lentivirus Vector With a Conditional Packaging System,” Journal of Virology 72, no. 11 (1998): 8463–8471. [DOI] [PMC free article] [PubMed] [Google Scholar]
- 46. Khakurel A., Kudlyk T., Pokrovskaya I., D'Souza Z., and Lupashin V. V., “GARP Dysfunction Results in COPI Displacement, Depletion of Golgi v‐SNAREs and Calcium Homeostasis Proteins,” Frontiers in Cell and Development Biology 10 (2022): 1066504. [DOI] [PMC free article] [PubMed] [Google Scholar]
- 47. Sumya F. T., Pokrovskaya I. D., and Lupashin V., “Development and Initial Characterization of Cellular Models for COG Complex‐Related CDG‐II Diseases,” Frontiers in Genetics 12 (2021): 733048. [DOI] [PMC free article] [PubMed] [Google Scholar]
- 48. Buser D. P. and Spang A., “Protein Sorting From Endosomes to the TGN,” Frontiers in Cell and Development Biology 11 (2023): 1140605. [DOI] [PMC free article] [PubMed] [Google Scholar]
- 49. Lujan P., Garcia‐Cabau C., Wakana Y., et al., “Sorting of Secretory Proteins at the Trans‐Golgi Network by Human TGN46,” eLife 12 (2024): RP91708. [DOI] [PMC free article] [PubMed] [Google Scholar]
- 50. Banting G. and Ponnambalam S., “TGN38 and Its Orthologues: Roles in Post‐TGN Vesicle Formation and Maintenance of TGN Morphology,” Biochimica et Biophysica Acta (BBA) ‐ Molecular Cell Research 1355, no. 3 (1997): 209–217. [DOI] [PubMed] [Google Scholar]
- 51. Bos K., Wraight C., and Stanley K., “TGN38 Is Maintained in the Trans‐Golgi Network by a Tyrosine‐Containing Motif in the Cytoplasmic Domain,” EMBO Journal 12, no. 5 (1993): 2219–2228. [DOI] [PMC free article] [PubMed] [Google Scholar]
- 52. Mallet W. G. and Maxfield F. R., “Chimeric Forms of Furin and TGN38 Are Transported From the Plasma Membrane to the Trans‐Golgi Network via Distinct Endosomal Pathways,” Journal of Cell Biology 146, no. 2 (1999): 345–360. [DOI] [PMC free article] [PubMed] [Google Scholar]
- 53. Humphrey J. S., Peters P. J., Yuan L. C., and Bonifacino J. S., “Localization of TGN38 to the Trans‐Golgi Network: Involvement of a Cytoplasmic Tyrosine‐Containing Sequence,” Journal of Cell Biology 120, no. 5 (1993): 1123–1135. [DOI] [PMC free article] [PubMed] [Google Scholar]
- 54. Reaves B. and Banting G., “Overexpression of TGN38/41 Leads to Mislocalisation of γ‐Adaptin,” FEBS Letters 351, no. 3 (1994): 448–456. [DOI] [PMC free article] [PubMed] [Google Scholar]
- 55. La Fontaine S. and Mercer J. F., “Trafficking of the Copper‐ATPases, ATP7A and ATP7B: Role in Copper Homeostasis,” Archives of Biochemistry and Biophysics 463, no. 2 (2007): 149–167. [DOI] [PubMed] [Google Scholar]
- 56. Polishchuk R. and Lutsenko S., “Golgi in Copper Homeostasis: A View From the Membrane Trafficking Field,” Histochemistry and Cell Biology 140 (2013): 285–295. [DOI] [PMC free article] [PubMed] [Google Scholar]
- 57. Kang H., Han A.‐r., Zhang A., et al., “GolpHCat (TMEM87A), A Unique Voltage‐Dependent Cation Channel in Golgi Apparatus, Contributes to Golgi‐pH Maintenance and Hippocampus‐Dependent Memory,” Nature Communications 15, no. 1 (2024): 5830, 10.1038/s41467-024-49297-8. [DOI] [PMC free article] [PubMed] [Google Scholar]
- 58. Harasaki K., Lubben N. B., Harbour M., Taylor M. J., and Robinson M. S., “Sorting of Major Cargo Glycoproteins Into Clathrin‐Coated Vesicles,” Traffic 6, no. 11 (2005): 1014–1026. [DOI] [PubMed] [Google Scholar]
- 59. Ghosh P., Dahms N. M., and Kornfeld S., “Mannose 6‐Phosphate Receptors: New Twists in the Tale,” Nature Reviews Molecular Cell Biology 4, no. 3 (2003): 202–213. [DOI] [PubMed] [Google Scholar]
- 60. Olson L. J., Hindsgaul O., Dahms N. M., and Kim J.‐J. P., “Structural Insights Into the Mechanism of pH‐Dependent Ligand Binding and Release by the Cation‐Dependent Mannose 6‐Phosphate Receptor,” Journal of Biological Chemistry 283, no. 15 (2008): 10124–10134. [DOI] [PMC free article] [PubMed] [Google Scholar]
- 61. Bohnsack R. N., Song X., Olson L. J., et al., “Cation‐Independent Mannose 6‐Phosphate Receptor,” Journal of Biological Chemistry 284, no. 50 (2009): 35215–35226. [DOI] [PMC free article] [PubMed] [Google Scholar]
- 62. Lissandron V., Podini P., Pizzo P., and Pozzan T., “Unique Characteristics of Ca2+ Homeostasis of the Trans‐Golgi Compartment,” Proceedings of the National Academy of Sciences 107, no. 20 (2010): 9198–9203. [DOI] [PMC free article] [PubMed] [Google Scholar]
- 63. Munro S., “The Golgi Apparatus: Defining the Identity of Golgi Membranes,” Current Opinion in Cell Biology 17, no. 4 (2005): 395–401. [DOI] [PubMed] [Google Scholar]
- 64. Stanley P., “Golgi Glycosylation,” Cold Spring Harbor Perspectives in Biology 3, no. 4 (2011): a005199. [DOI] [PMC free article] [PubMed] [Google Scholar]
- 65. Li J. and Wang Y., “Golgi Metal Ion Homeostasis in Human Health and Diseases,” Cells 11, no. 2 (2022): 289. [DOI] [PMC free article] [PubMed] [Google Scholar]
- 66. Kellokumpu S., “Golgi pH, Ion and Redox Homeostasis: How Much Do They Really Matter?,” Frontiers in Cell and Development Biology 7 (2019): 93. [DOI] [PMC free article] [PubMed] [Google Scholar]
- 67. Hirschberg C. B., Robbins P. W., and Abeijon C., “Transporters of Nucleotide Sugars, ATP, and Nucleotide Sulfate in the Endoplasmic Reticulum and Golgi Apparatus,” Annual Review of Biochemistry 67, no. 1 (1998): 49–69. [DOI] [PubMed] [Google Scholar]
- 68. Sun X., Zhan M., Sun X., Liu W., and Meng X., “C1GALT1 in Health and Disease,” Oncology Letters 22, no. 2 (2021): 1–15. [DOI] [PMC free article] [PubMed] [Google Scholar]
- 69. Volchuk A., Ravazzola M., Perrelet A., et al., “Countercurrent Distribution of Two Distinct SNARE Complexes Mediating Transport Within the Golgi Stack,” Molecular Biology of the Cell 15, no. 4 (2004): 1506–1518. [DOI] [PMC free article] [PubMed] [Google Scholar]
- 70. Tai G., Lu L., Wang T. L., et al., “Participation of the Syntaxin 5/Ykt6/GS28/GS15 SNARE Complex in Transport From the Early/Recycling Endosome to the Trans‐Golgi Network,” Molecular Biology of the Cell 15, no. 9 (2004): 4011–4022. [DOI] [PMC free article] [PubMed] [Google Scholar]
- 71. D'Souza Z., Pokrovskaya I., and Lupashin V. V., “Syntaxin‐5's Flexibility in SNARE Pairing Supports Golgi Functions,” Traffic 24, no. 8 (2023): 355–379. [DOI] [PMC free article] [PubMed] [Google Scholar]
- 72. Donaldson J. G. and Jackson C. L., “ARF Family G Proteins and Their Regulators: Roles in Membrane Transport, Development and Disease,” Nature Reviews Molecular Cell Biology 12, no. 6 (2011): 362–375. [DOI] [PMC free article] [PubMed] [Google Scholar]
- 73. Schindler C., Chen Y., Pu J., Guo X., and Bonifacino J. S., “EARP Is a Multisubunit Tethering Complex Involved in Endocytic Recycling,” Nature Cell Biology 17, no. 5 (2015): 639–650. [DOI] [PMC free article] [PubMed] [Google Scholar]
- 74. Donaldson J. G., Honda A., and Weigert R., “Multiple Activities for Arf1 at the Golgi Complex,” Biochimica et Biophysica Acta (BBA) ‐ Molecular Cell Research 1744, no. 3 (2005): 364–373. [DOI] [PubMed] [Google Scholar]
- 75. Fröhlich F., Petit C., Kory N., et al., “The GARP Complex Is Required for Cellular Sphingolipid Homeostasis,” eLife 4 (2015): e08712, 10.7554/eLife.08712. [DOI] [PMC free article] [PubMed] [Google Scholar]
- 76. Capasso S., Sticco L., Rizzo R., et al., “Sphingolipid Metabolic Flow Controls Phosphoinositide Turnover at the Trans‐Golgi Network,” EMBO Journal 36, no. 12 (2017): 1736–1754. [DOI] [PMC free article] [PubMed] [Google Scholar]
- 77. Meissner J. M., Bhatt J. M., Lee E., et al., “The ARF Guanine Nucleotide Exchange Factor GBF1 Is Targeted to Golgi Membranes Through a PIP‐Binding Domain,” Journal of Cell Science 131, no. 3 (2018): jcs210245, 10.1242/jcs.210245. [DOI] [PMC free article] [PubMed] [Google Scholar]
- 78. Takagi K., Iwamoto K., Kobayashi S., Horiuchi H., Fukuda R., and Ohta A., “Involvement of Golgi‐Associated Retrograde Protein Complex in the Recycling of the Putative Dnf Aminophospholipid Flippases in Yeast,” Biochemical and Biophysical Research Communications 417, no. 1 (2012): 490–494. [DOI] [PubMed] [Google Scholar]
- 79. Chen Y. T., Wang I. H., Wang Y. H., et al., “Action of Arl1 GTPase and Golgin Imh1 in Ypt6‐Independent Retrograde Transport From Endosomes to the Trans‐Golgi Network,” Molecular Biology of the Cell 30, no. 8 (2019): 1008–1019. [DOI] [PMC free article] [PubMed] [Google Scholar]
- 80. Dmitriev O. Y. and Patry J., “Structure and Mechanism of the Human Copper Transporting ATPases: Fitting the Pieces Into a Moving Puzzle,” Biochimica et Biophysica Acta (BBA) ‐ Biomembranes 1866 (2024): 184306. [DOI] [PubMed] [Google Scholar]
- 81. Lutsenko S., “Human Copper Homeostasis: A Network of Interconnected Pathways,” Current Opinion in Chemical Biology 14, no. 2 (2010): 211–217. [DOI] [PMC free article] [PubMed] [Google Scholar]
- 82. Sluysmans S., Méan I., Xiao T., et al., “PLEKHA5, PLEKHA6, and PLEKHA7 Bind to PDZD11 to Target the Menkes ATPase ATP7A to the Cell Periphery and Regulate Copper Homeostasis,” Molecular Biology of the Cell 32, no. 21 (2021): ar34, 10.1091/mbc.E21-07-0355. [DOI] [PMC free article] [PubMed] [Google Scholar]
- 83. Kaler S. G., “ATP7A‐Related Copper Transport Diseases—Emerging Concepts and Future Trends,” Nature Reviews Neurology 7, no. 1 (2011): 15–29. [DOI] [PMC free article] [PubMed] [Google Scholar]
- 84. Gale J. and Aizenman E., “The Physiological and Pathophysiological Roles of Copper in the Nervous System,” European Journal of Neuroscience 60, no. 1 (2024): 3505–3543. [DOI] [PMC free article] [PubMed] [Google Scholar]
- 85. Hartwig C., Méndez G. M., Bhattacharjee S., et al., “Golgi‐Dependent Copper Homeostasis Sustains Synaptic Development and Mitochondrial Content,” Journal of Neuroscience 41, no. 2 (2021): 215–233. [DOI] [PMC free article] [PubMed] [Google Scholar]
- 86. Comstra H. S., McArthy J., Rudin‐Rush S., et al., “The Interactome of the Copper Transporter ATP7A Belongs to a Network of Neurodevelopmental and Neurodegeneration Factors,” eLife 6 (2017): e24722. [DOI] [PMC free article] [PubMed] [Google Scholar]
- 87. Yi L. and Kaler S. G., “Direct Interactions of Adaptor Protein Complexes 1 and 2 With the Copper Transporter ATP7A Mediate Its Anterograde and Retrograde Trafficking,” Human Molecular Genetics 24, no. 9 (2015): 2411–2425. [DOI] [PMC free article] [PubMed] [Google Scholar]
- 88. Robinson M. S., Antrobus R., Sanger A., Davies A. K., and Gershlick D. C., “The Role of the AP‐1 Adaptor Complex in Outgoing and Incoming Membrane Traffic,” Journal of Cell Biology 223, no. 7 (2024): e202310071. [DOI] [PMC free article] [PubMed] [Google Scholar]
- 89. Kang H. and Lee C. J., “Transmembrane Proteins With Unknown Function (TMEMs) as Ion Channels: Electrophysiological Properties, Structure, and Pathophysiological Roles,” Experimental & Molecular Medicine 56, no. 4 (2024): 850–860. [DOI] [PMC free article] [PubMed] [Google Scholar]
- 90. Shin J. J., Crook O. M., Borgeaud A. C., et al., “Spatial Proteomics Defines the Content of Trafficking Vesicles Captured by Golgin Tethers,” Nature Communications 11, no. 1 (2020): 5987. [DOI] [PMC free article] [PubMed] [Google Scholar]
- 91. Koreishi M., Gniadek T. J., Yu S., Masuda J., Honjo Y., and Satoh A., “The Golgin Tether Giantin Regulates the Secretory Pathway by Controlling Stack Organization Within Golgi Apparatus,” PLoS One 8, no. 3 (2013): e59821. [DOI] [PMC free article] [PubMed] [Google Scholar]
- 92. Casler J. C., Papanikou E., Barrero J. J., and Glick B. S., “Maturation‐Driven Transport and AP‐1–Dependent Recycling of a Secretory Cargo in the Golgi,” Journal of Cell Biology 218, no. 5 (2019): 1582–1601. [DOI] [PMC free article] [PubMed] [Google Scholar]
- 93. Laufman O., Freeze H. H., Hong W., and Lev S., “Deficiency of the Cog8 Subunit in Normal and CDG‐Derived Cells Impairs the Assembly of the COG and Golgi SNARE Complexes,” Traffic 14, no. 10 (2013): 1065–1077. [DOI] [PMC free article] [PubMed] [Google Scholar]
Associated Data
This section collects any data citations, data availability statements, or supplementary materials included in this article.
Supplementary Materials
Figure S1. VPS54‐mAID rescue Golgi localization defects in VPS54‐KO HeLa cells. HeLa cells expressing VPS54‐mAID and VPS54‐KO were stained with antibodies to TGN46 (A), GBF1 (B) and COPB2 (C) and analyzed by confocal microscopy.
Figure S2. Efficient depletion of VPS54 in HeLa cells expressing VPS54‐mAID following AA treatment. (A) WB analysis of HeLa cells expressing VPS54‐mAID following rapid VPS54 depletion for 0, 0.5, 1, 2, 3, 24 and 48 h respectively and probed with anti‐myc (VPS54) antibody. The bottom panel shows the quantification of the blot. (B) HeLa cells expressing VPS54‐mAID were co‐stained with myc (red) and B4GALT1 (green) after 3 h of VPS54 depletion.
Figure S3. AA treatment does not alter the localization of Golgi proteins in wild‐type RPE1 cells. (A) Airyscan microscopy of RPE1 cells untreated or treated with AA for 6 h and co‐stained for GS15 and P230. Colocalization analysis of (B) GS15, (C) TGN46, (D) GBF1, (E) C1GALT1 and P230 of ≥ 30 cells was done by calculation of Pearson’s correlation coefficient. Statistical significance was calculated using a paired t‐test. **p ≤ 0.05.
Figure S4. Effect of VPS54‐KO on ATP7A and CPD localization. (A) (Top panel) WB analysis of RPE1 VPS54‐mAID cells treated with AA and protease inhibitors cocktail (PI) and probed with anti‐TGN46. (Bottom panel) Quantification of the blots from three independent experiments. Statistical significance was assessed using one‐way ANOVA. ****p ≤ 0.0001, **p ≤ 0.01. (B) Airyscan microscopy of RPE1 VPS54‐mAID cells transiently transfected with LAMP2‐mCherry and TGN38‐GFP for 24 h followed by 3 h AA treatment. (C) Airyscan microscopy of RPE1 WT, VPS54‐KO and VPS54‐mAID cells stained with anti‐B4GALT1, anti‐GM130 and anti‐ATP7A antibodies. (D) Co‐staining of RPE1 WT and VPS54‐KO cells for CPD and P230 using anti‐CPD and anti‐P230 antibodies.
Figure S5. Localization of Golgi proteins after 6 h of VPS54 depletion. (A) Airyscan microscopy of RPE1 VPS54‐mAID cells untreated or treated with AA for 6 h and co‐stained for TGN46 and P230. Colocalization analysis of (B) TGN46, (C) GS15 and P230, (D) ATP7A and GM130 of ≥ 30 cells was done by calculation of Pearson’s correlation coefficient. Statistical significance was calculated using a paired t‐test. **p ≤ 0.05. (E) Airyscan microscopy of RPE1 VPS54‐mAID cells untreated or treated with AA for 6 h and co‐stained for CI‐MPR and P230. (F) Colocalization of CI‐MPR with P230 of ≥ 30 cells was determined by calculating Pearson’s correlation coefficient.
Figure S6. Acute VPS54 depletion does not affect the Golgi enzymes MGAT1 and GALNT2 in RPE1 cells. (A) WB analysis of total lysates of RPE1 VPS54‐mAID cells treated with AA and probed with (Top panel) anti‐MGAT1 (A) and anti‐GALNT2 (D). β‐actin was used as a loading control. The bottom panels on (A), and (D) are the quantification of the blots from three independent experiments. (B) Airyscan microscopy of RPE1 VPS54‐mAID cells untreated or treated with AA for 3 h and co‐stained for MGAT1 and P230. (C) Colocalization analysis of MGAT1 with P230 was done by calculation of Pearson’s correlation coefficient.
Figure S7. Rapid depletion of VPS54 stimulates B4GALT1 relocation to endosomes following CQ treatment. (A) IF images of RPE1 VPS54‐mAID cells. Untreated cells (control), or treated with CQ for 3 h (CQ), or treated with AA for 1 h followed by CQ treatment for 3 h (AA + CQ), or treated with AA and CQ and recovered for 3 h (AA + CQ + W), or treated with CQ and recovered for 3 h (CQ + W) were stained for GPP130, B4GALT1 and Giantin. (B) Colocalization analysis of B4GALT1 and Giantin was done by calculating Pearson’s correlation coefficient. Statistical significance was calculated using one‐way ANOVA. **p ≤ 0.01, ***p ≤ 0.001, ****p ≤ 0.0001. (C) Colocalization analysis of GPP130 and Giantin was also done by calculation of Pearson’s correlation coefficient. Statistical significance was calculated using one‐way ANOVA. (D) Airyscan microscopy of RPE1 VPS54‐mAID cells untreated or treated with AA for 6 h and co‐stained for B4GALT1 and P230. (F) Colocalization of B4GALT1 with P230 of ≥ 30 cells was determined by calculation of Pearson’s correlation coefficient.
Figure S8. Acute VPS54 depletion does not affect BIG1 localization. (A) Airyscan microscopy of RPE1 VPS54‐mAID cells untreated or treated with AA for 6 h and co‐stained for BIG1 and P230. Colocalization of BIG1 and P230 after (B) 6 h and (C) 3 h of AA treatment was determined by the calculation of the Pearson’s correlation coefficient.
Figure S9. Acute VPS54 depletion led to the accumulation of C1GALT1 and STX6 in the GS15 positive vesicles. (A) WB analysis of GS15 in Golgi and vesicle fraction before (−) and after (+) acute VPS54 depletion. (B) Schematic of GS15 IP from the vesicular fraction (S30) using GS15 antibody in control and AA‐treated groups. (C–F) (Top panel) WB analysis of GS15 IP in control and AA‐treated groups probed with anti‐GS15 (C), TGN46 (D), C1GALT1 (E) and STX6 (F). (C–F) (Bottom panel) The graph quantifies three independent blots.
Movie S1. Super‐resolution Airyscan live cell imaging of RPE1 cells stably expressing CD‐MPR‐neon green. RPE1 VPS54‐mAID cells were stably expressed with CD‐MPR‐neon green and imaged in real time without AA. Live cell imaging was done for 60 frames in 30 s.
Movie S2. Super‐resolution Airyscan live cell imaging of RPE1 cells stably expressing CD‐MPR‐neon green treated with AA for 3 h. RPE1 VPS54‐mAID cells stably expressed with CD‐MPR‐neon green were treated with AA for 3 h and imaged in real time (AA 3 h). Live cell imaging was done for 60 frames in 30 s. Arrows on VPS54 depleted cells showed the accumulation of CD‐MPR in the enlarged round compartment near the Golgi. The timestamp represents seconds.
Data Availability Statement
All data supporting the findings of this manuscript are included in Figures 1, 2, 3, 4, 5, 6, 7, 8, 9 and Figures S1–S9. Raw data for the presented figures are available upon request.