

Abstract
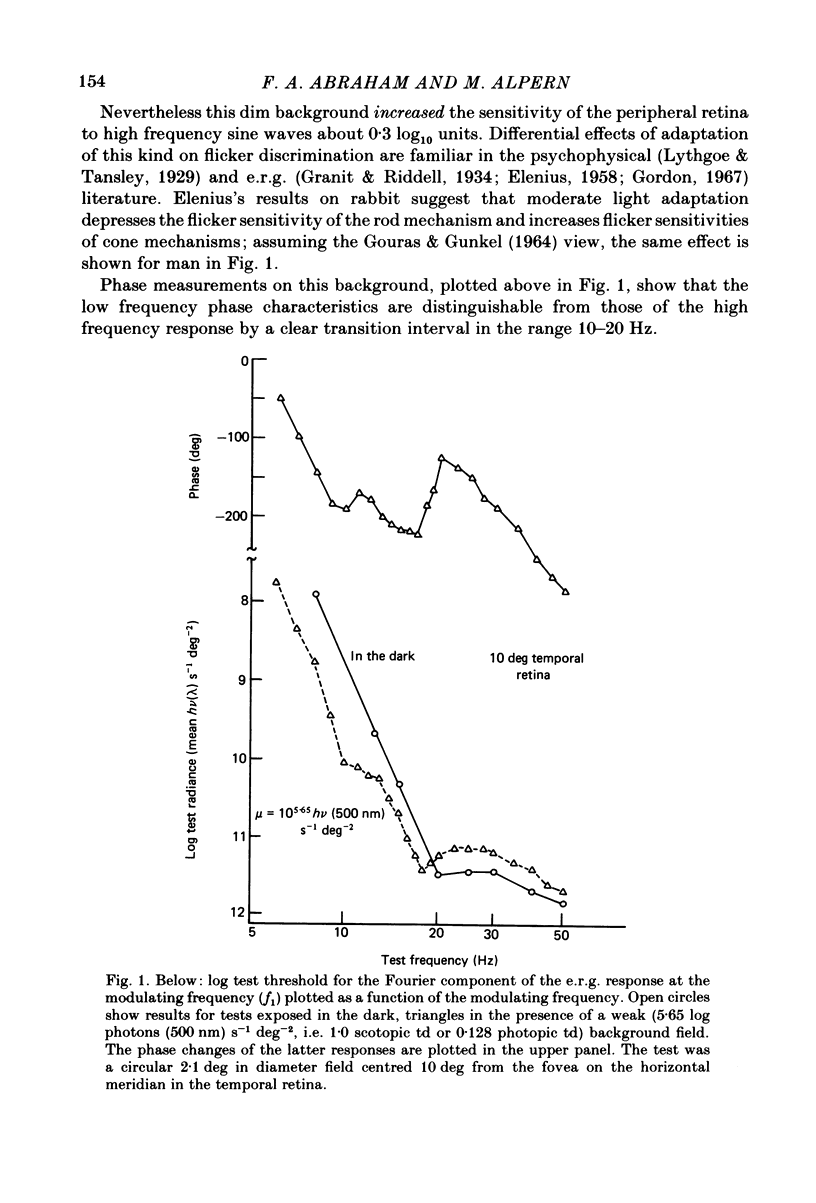
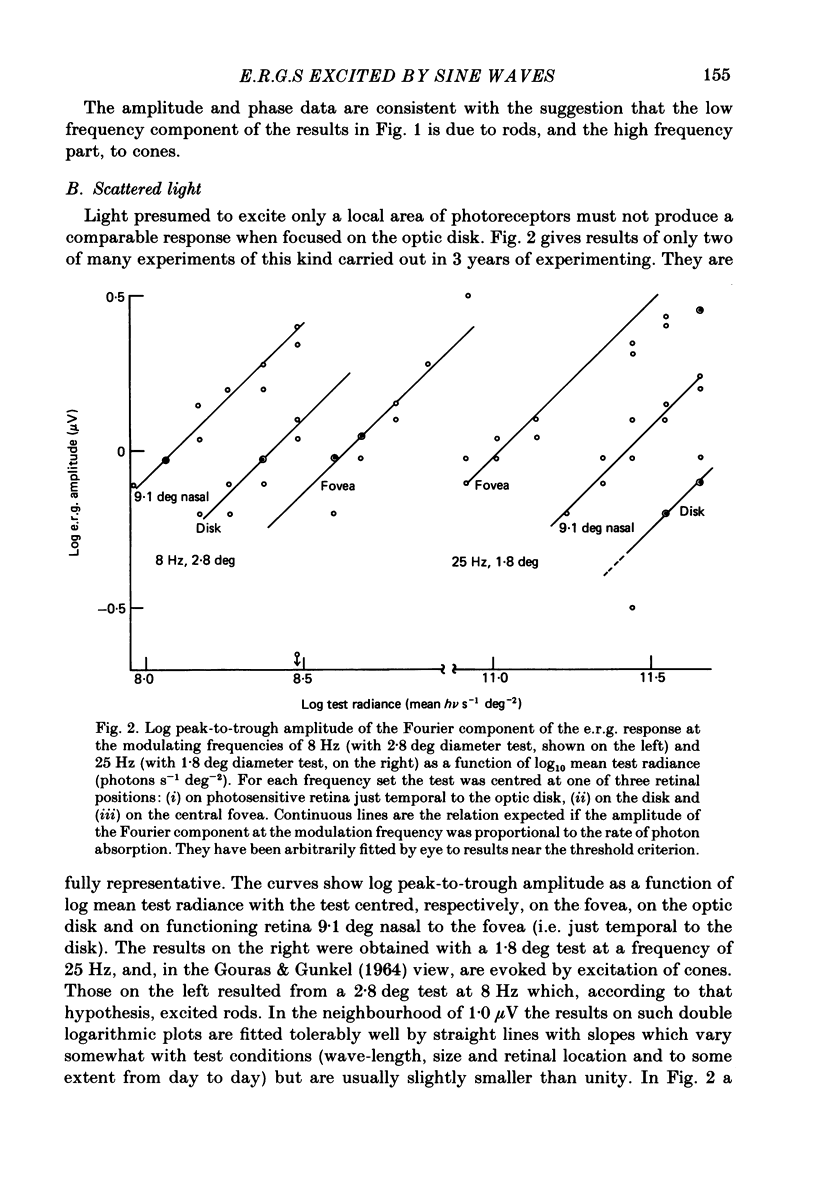
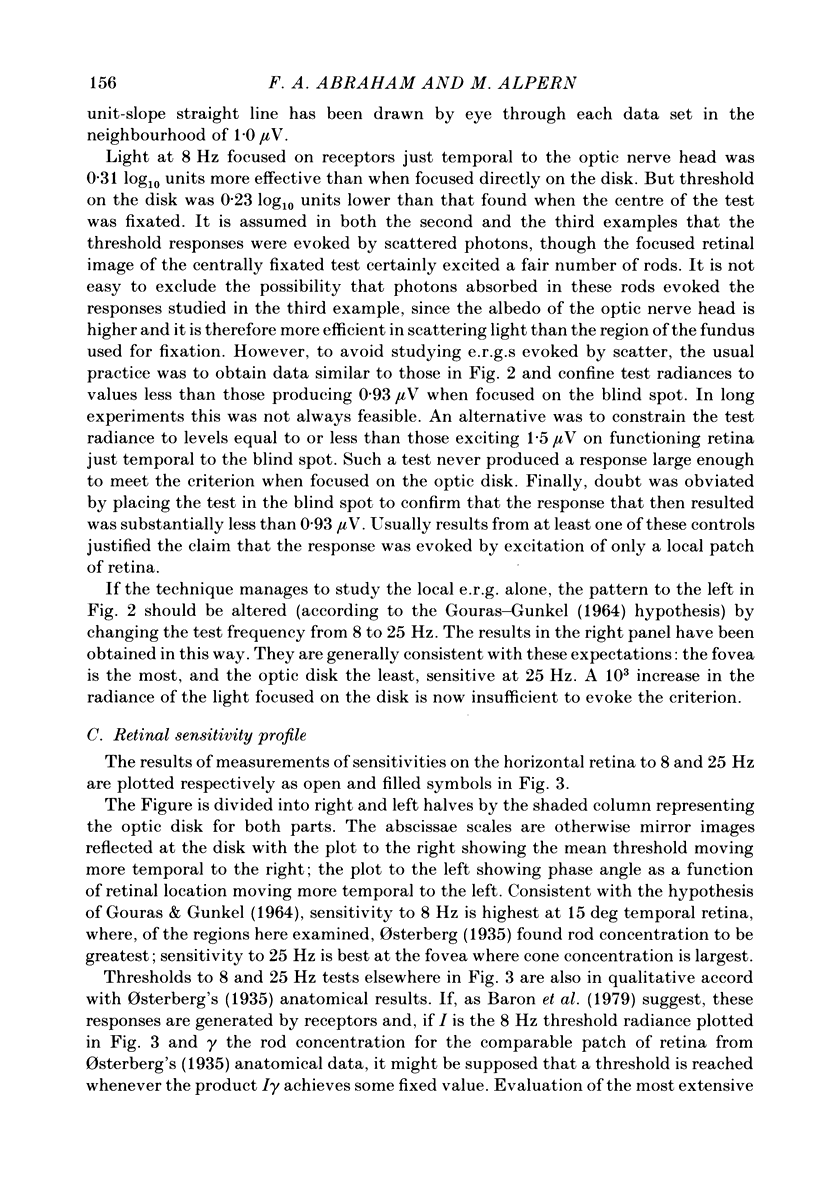
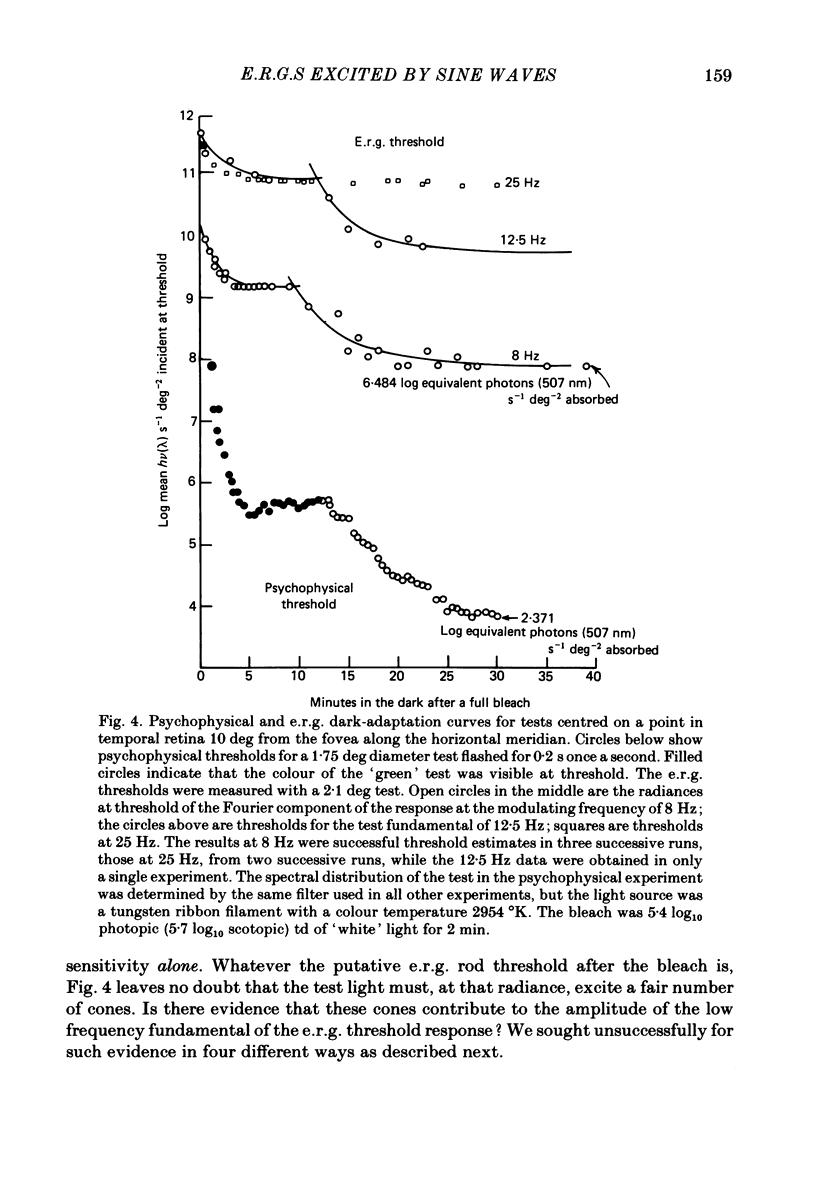
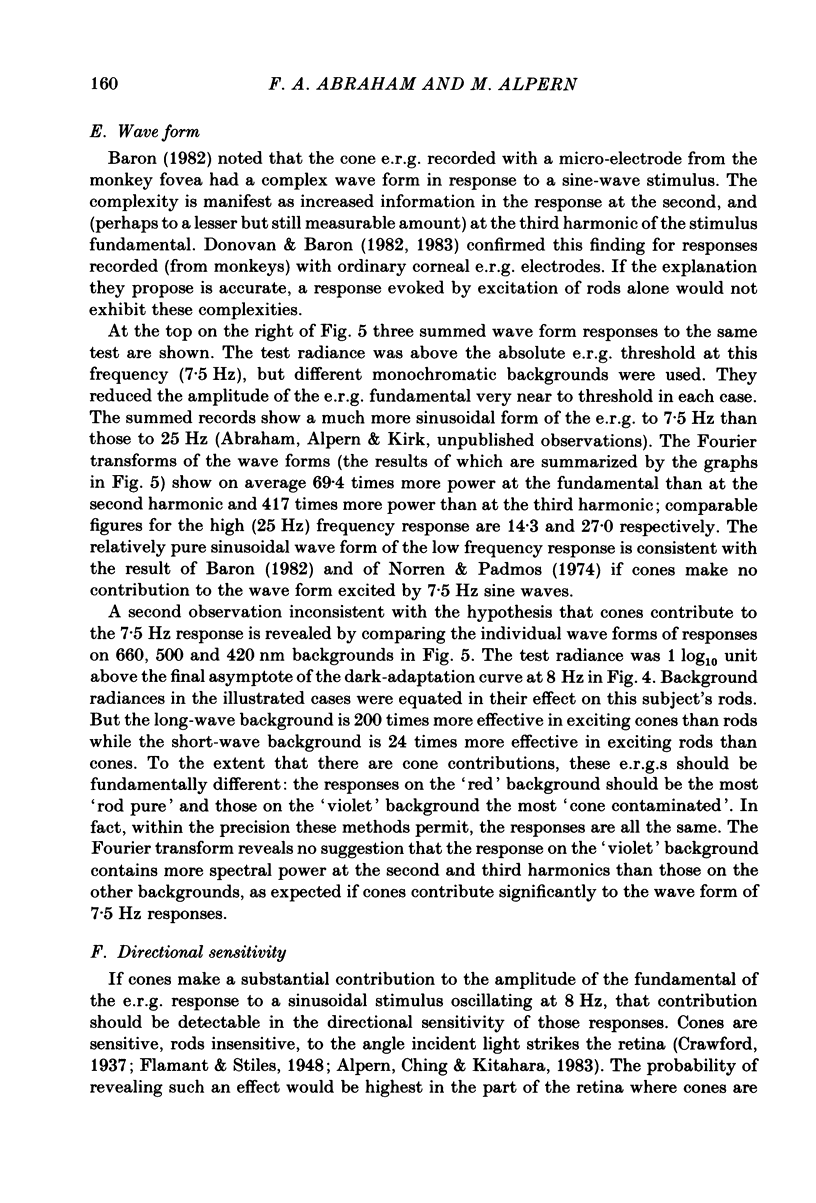
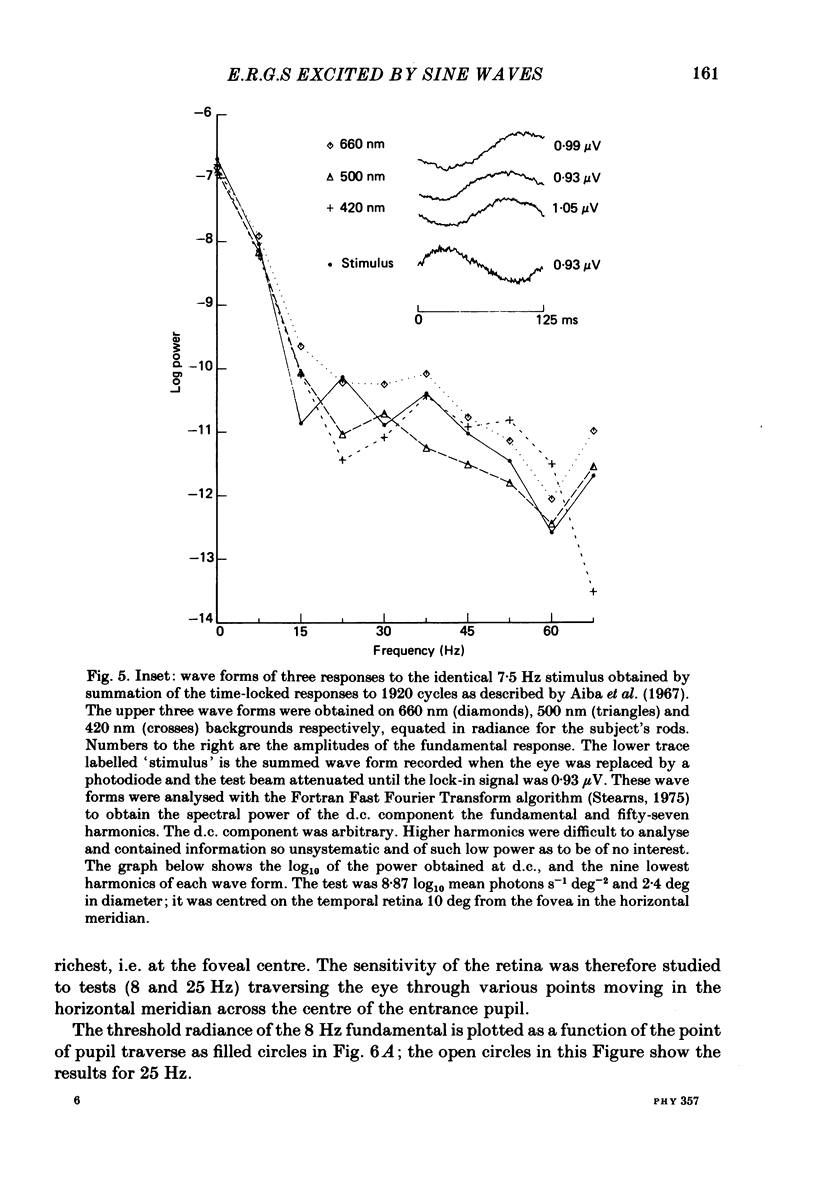
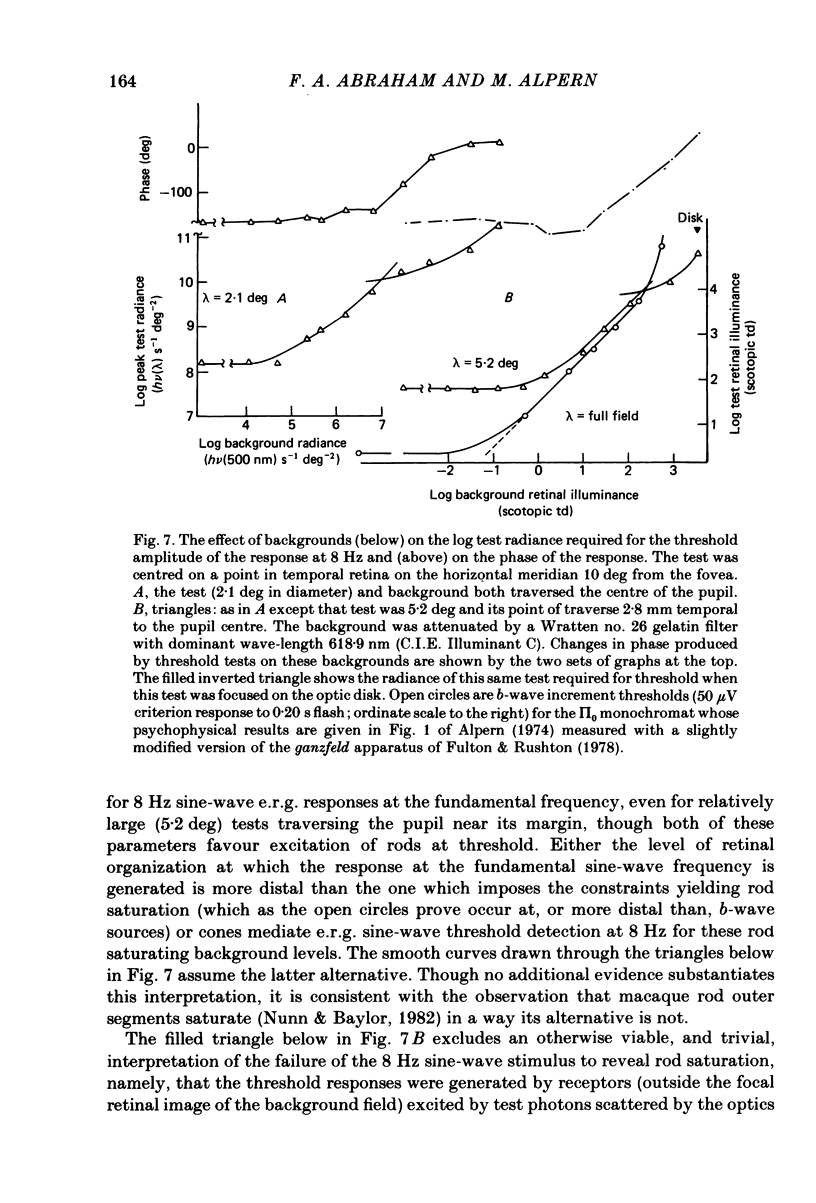
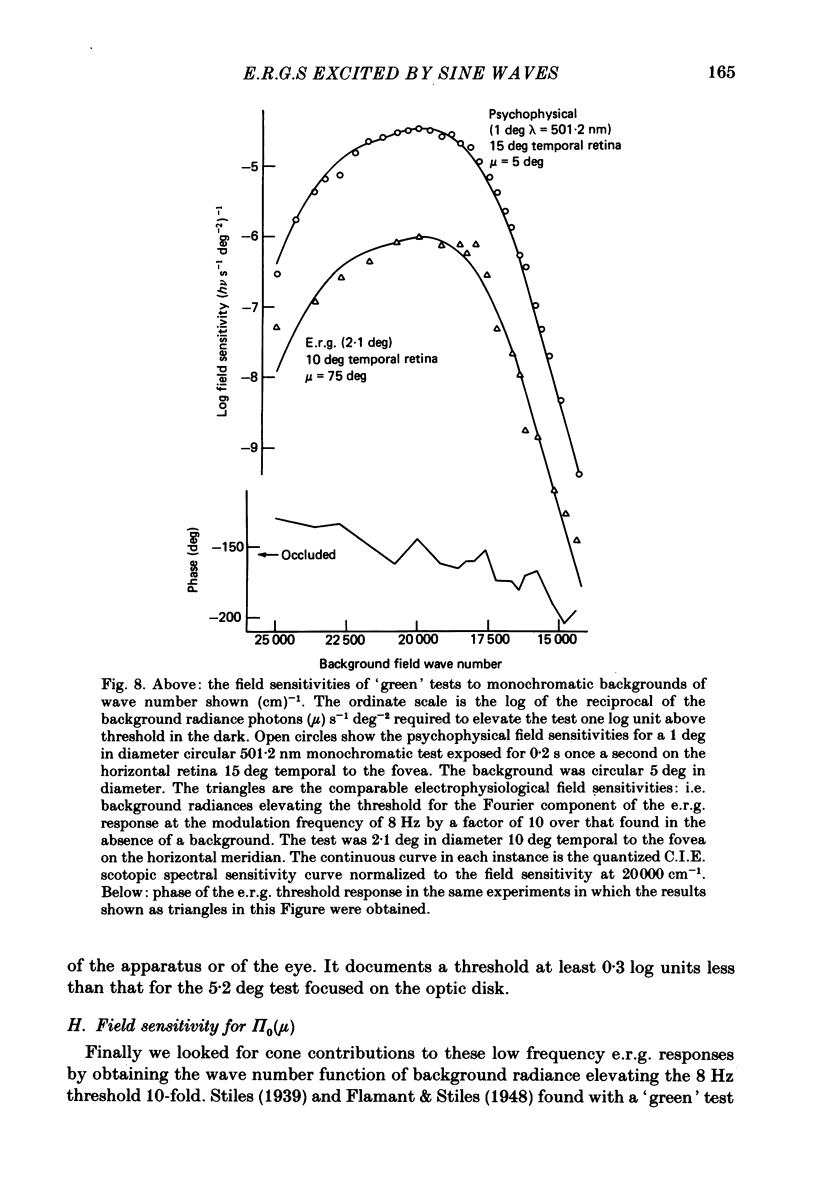
The amplitude and phase of the fundamental Fourier component of the electroretinogram (e.r.g.) in response to sinusoidally modulated light were studied in the range 7-50 Hz. Sensitivity was best at the lowest frequency. The threshold-frequency relationship divided into two parts. A weak steady background depressed sensitivity of the low, but increased sensitivity of the high, frequency component. At 8 Hz a small test spot was 0.7 log10 units more effective on the most sensitive part of the retina than on the optic disk. On the fovea, it was 0.1-0.2 log10 units less effective than on the disk. The fovea was 0.7 log10 units more sensitive to 25 Hz than the blind spot. Psychophysical and e.r.g. dark-adaptation curves were similar, but the former was 10(4) times more sensitive than the latter. Four sets of experiments examined the possibility that the Fourier component of the e.r.g. response at the modulation frequency of 8 Hz during the 'rod' phase of the e.r.g. dark-adaptation curve arose from excitation of rods alone. The only hint of a possible cone contribution was a very small but systematic increase in phase delay with increase in background wave number found while measuring the field sensitivity action spectrum. No suggestion was found that the fundamental Fourier component of threshold e.r.g. responses at the modulation frequency of 25 Hz was influenced by photons absorbed in rods.
Full text
PDF
Selected References
These references are in PubMed. This may not be the complete list of references from this article.
- ALPERN M., SPENCER R. W. Variation of critical flicker frequency in the nasal visual field; relation to variation in size of the entrance pupil and to stray light within the eye. AMA Arch Ophthalmol. 1953 Jul;50(1):50–63. doi: 10.1001/archopht.1953.00920030053008. [DOI] [PubMed] [Google Scholar]
- ARMINGTON J. C., TEPAS D. I., KROPFL W. J., HENGST W. H. Summation of retinal potentials. J Opt Soc Am. 1961 Aug;51:877–886. doi: 10.1364/josa.51.000877. [DOI] [PubMed] [Google Scholar]
- Aiba T. S., Alpern M., Maaseidvaag F. The electroretinogram evoked by the excitation of human foveal cones. J Physiol. 1967 Mar;189(1):43–62. doi: 10.1113/jphysiol.1967.sp008154. [DOI] [PMC free article] [PubMed] [Google Scholar]
- Alpern M., Ching C. C., Kitahara K. The directional sensitivity of retinal rods. J Physiol. 1983 Oct;343:577–592. doi: 10.1113/jphysiol.1983.sp014911. [DOI] [PMC free article] [PubMed] [Google Scholar]
- Alpern M., Kitahara K. The directional sensitivities of the Stiles' colour mechanisms. J Physiol. 1983 May;338:627–649. doi: 10.1113/jphysiol.1983.sp014693. [DOI] [PMC free article] [PubMed] [Google Scholar]
- Alpern M., Rushton W. A., Torii S. The attenuation of rod signals by backgrounds. J Physiol. 1970 Jan;206(1):209–227. doi: 10.1113/jphysiol.1970.sp009007. [DOI] [PMC free article] [PubMed] [Google Scholar]
- Alpern M. What is it that confines in a world without color? Invest Ophthalmol. 1974 Sep;13(9):648–674. [PubMed] [Google Scholar]
- Arden G. B., Vaegan, Hogg C. R. Clinical and experimental evidence that the pattern electroretinogram (PERG) is generated in more proximal retinal layers than the focal electroretinogram (FERG). Ann N Y Acad Sci. 1982;388:580–607. doi: 10.1111/j.1749-6632.1982.tb50818.x. [DOI] [PubMed] [Google Scholar]
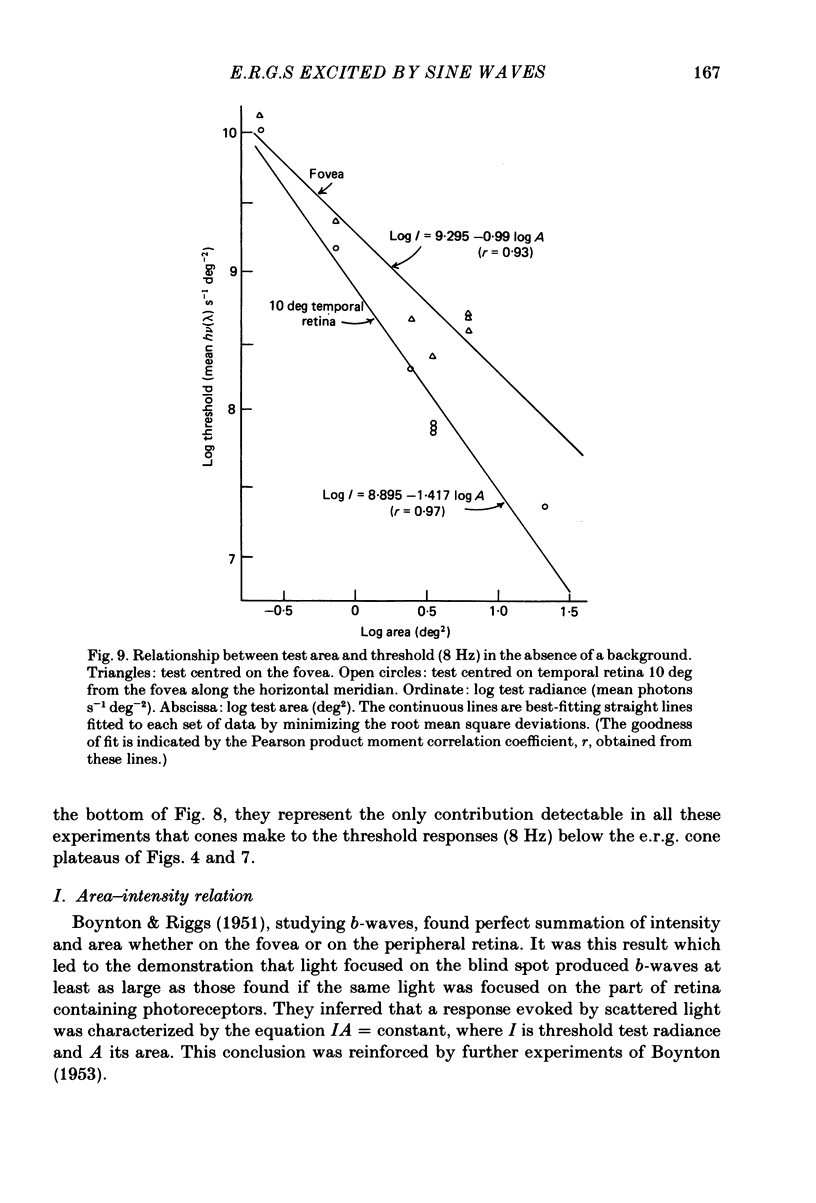
- BOYNTON R. M., RIGGS L. A. The effect of stimulus area and intensity upon the human retinal response. J Exp Psychol. 1951 Oct;42(4):217–226. doi: 10.1037/h0057679. [DOI] [PubMed] [Google Scholar]
- BOYNTON R. M. Stray light and the human electroretinogram. J Opt Soc Am. 1953 Jun;43(6):442–449. doi: 10.1364/josa.43.000442. [DOI] [PubMed] [Google Scholar]
- BURIAN H. M. Electroretinography and its clinical application. AMA Arch Ophthalmol. 1953 Mar;49(3):241–256. doi: 10.1001/archopht.1953.00920020248001. [DOI] [PubMed] [Google Scholar]
- Baker H. D., Bargoot F. G. Effect of stimulus presentation rate upon visual threshold. Vision Res. 1977;17(3):379–383. doi: 10.1016/0042-6989(77)90027-x. [DOI] [PubMed] [Google Scholar]
- Baron W. S., Boynton R. M., Hammon R. W. Component analysis of the foveal local electroretinogram elicited with sinusoidal flicker. Vision Res. 1979;19(5):479–490. doi: 10.1016/0042-6989(79)90132-9. [DOI] [PubMed] [Google Scholar]
- Baron W. S. Chromatic adaptation and flicker-frequency effects on primate R-G-cone difference signal. J Opt Soc Am. 1982 Aug;72(8):1008–1013. doi: 10.1364/josa.72.001008. [DOI] [PubMed] [Google Scholar]
- Brindley G. S., Westheimer G. The spatial properties of the human electroretinogram. J Physiol. 1965 Aug;179(3):518–537. doi: 10.1113/jphysiol.1965.sp007678. [DOI] [PMC free article] [PubMed] [Google Scholar]
- Brown K. T. The eclectroretinogram: its components and their origins. Vision Res. 1968 Jun;8(6):633–677. doi: 10.1016/0042-6989(68)90041-2. [DOI] [PubMed] [Google Scholar]
- Cleland B. G., Enroth-cugell C. Quantitative aspects of sensitivity and summation in the cat retina. J Physiol. 1968 Sep;198(1):17–38. doi: 10.1113/jphysiol.1968.sp008591. [DOI] [PMC free article] [PubMed] [Google Scholar]
- Conner J. D., MacLeod D. I. Rod photoreceptors detect rapid flicker. Science. 1977 Feb 18;195(4279):698–699. doi: 10.1126/science.841308. [DOI] [PubMed] [Google Scholar]
- Creutzfeldt O. D., Sakmann B., Scheich H., Korn A. Sensitivity distribution and spatial summation within receptive-field center of retinal on-center ganglion cells and transfer function of the retina. J Neurophysiol. 1970 Sep;33(5):654–671. doi: 10.1152/jn.1970.33.5.654. [DOI] [PubMed] [Google Scholar]
- DeMonasterio F. M., Schein S. J., McCrane E. P. Staining of blue-sensitive cones of the macaque retina by a fluorescent dye. Science. 1981 Sep 11;213(4513):1278–1281. doi: 10.1126/science.7268439. [DOI] [PubMed] [Google Scholar]
- Donovan W. J., Baron W. S. Identification of the R-G-cone difference signal in the corneal electroretinogram of the primate. J Opt Soc Am. 1982 Aug;72(8):1014–1020. doi: 10.1364/josa.72.001014. [DOI] [PubMed] [Google Scholar]
- Donovan W. J., Baron W. S. Wavelength-dependent rod-cone transition of the electroretinographic response. Am J Optom Physiol Opt. 1983 Jul;60(7):559–566. doi: 10.1097/00006324-198307000-00002. [DOI] [PubMed] [Google Scholar]
- Easter S. S., Jr Excitation in the goldfish retina: evidence for a non-linear intensity code. J Physiol. 1968 Mar;195(2):253–271. doi: 10.1113/jphysiol.1968.sp008457. [DOI] [PMC free article] [PubMed] [Google Scholar]
- Enroth-Cugell C., Harding T. H. Summation of rod signals within the receptive field centre of cat retinal ganglion cells. J Physiol. 1980 Jan;298:235–250. doi: 10.1113/jphysiol.1980.sp013078. [DOI] [PMC free article] [PubMed] [Google Scholar]
- Finkelstein D., Gouras P., Hoff M. Human electroretinogram near the absolute threshold of vision. Invest Ophthalmol. 1968 Apr;7(2):214–218. [PubMed] [Google Scholar]
- Fricker S. J. Application of synchronous detector techniques for electroretinographic studies in patients with retinitis pigmentosa. Invest Ophthalmol. 1971 May;10(5):329–339. [PubMed] [Google Scholar]
- Fulton A. B., Rushton W. A. The human rod ERG: correlation with psychophysical responses in light and dark adaptation. Vision Res. 1978;18(7):793–800. doi: 10.1016/0042-6989(78)90119-0. [DOI] [PubMed] [Google Scholar]
- GOURAS P., GUNKEL R. D. THE FREQUENCY RESPONSE OF NORMAL, ROD ACHROMAT AND NYCTALOPE ERGS TO SINUSOIDAL MONOCHROMATIC LIGHT STIMULATION. Doc Ophthalmol. 1964;18:137–150. doi: 10.1007/BF00160570. [DOI] [PubMed] [Google Scholar]
- Glezer V. D. The receptive fields of the retina. Vision Res. 1965 Oct;5(9):497–525. doi: 10.1016/0042-6989(65)90084-2. [DOI] [PubMed] [Google Scholar]
- Granit R., Riddell L. A. The electrical responses of light- and dark-adapted frogs' eyes to rhythmic and continuous stimuli. J Physiol. 1934 Mar 29;81(1):1–28. doi: 10.1113/jphysiol.1934.sp003112. [DOI] [PMC free article] [PubMed] [Google Scholar]
- Green D. G. Scotopic and photopic components of the rat electroetinogram. J Physiol. 1973 Feb;228(3):781–797. doi: 10.1113/jphysiol.1973.sp010112. [DOI] [PMC free article] [PubMed] [Google Scholar]
- Kline R. P., Ripps H., Dowling J. E. Generation of b-wave currents in the skate retina. Proc Natl Acad Sci U S A. 1978 Nov;75(11):5727–5731. doi: 10.1073/pnas.75.11.5727. [DOI] [PMC free article] [PubMed] [Google Scholar]
- Mafei L., Fiorentini A. Electroretinographic responses to alternating gratings before and after section of the optic nerve. Science. 1981 Feb 27;211(4485):953–955. doi: 10.1126/science.7466369. [DOI] [PubMed] [Google Scholar]
- Marc R. E., Sperling H. G. Chromatic organization of primate cones. Science. 1977 Apr 22;196(4288):454–456. doi: 10.1126/science.403607. [DOI] [PubMed] [Google Scholar]
- Newman E. A. B-wave currents in the frog retina. Vision Res. 1979;19(3):227–234. doi: 10.1016/0042-6989(79)90167-6. [DOI] [PubMed] [Google Scholar]
- Norren D. V., Padmos P. Dark adaptation of separate cone systems studied with psychophysics and electroretinography. Vision Res. 1974 Aug;14(8):677–686. doi: 10.1016/0042-6989(74)90064-9. [DOI] [PubMed] [Google Scholar]
- Norren D. V., Padmos P. Human and macaque blue cones studied with electroretinography. Vision Res. 1973 Jul;13(7):1241–1254. doi: 10.1016/0042-6989(73)90200-9. [DOI] [PubMed] [Google Scholar]
- Nowak L. M., Green D. G. Flicker fusion characteristics of rod photoreceptors in the toad. Vision Res. 1983;23(9):845–849. doi: 10.1016/0042-6989(83)90051-2. [DOI] [PubMed] [Google Scholar]
- Nunn B. J., Baylor D. A. Visual transduction in retinal rods of the monkey Macaca fascicularis. Nature. 1982 Oct 21;299(5885):726–728. doi: 10.1038/299726a0. [DOI] [PubMed] [Google Scholar]
- Padmos P., Norren D. V. The vector voltmeter as a tool to measure electroretinogram spectral sensitivity and dark adaptation. Invest Ophthalmol. 1972 Sep;11(9):783–788. [PubMed] [Google Scholar]
- Padmos P., van Norren D. Cone spectral sensitivity and chromatic adaptation as revealed by human flicker-electroretinography. Vision Res. 1971 Jan;11(1):27–42. doi: 10.1016/0042-6989(71)90203-3. [DOI] [PubMed] [Google Scholar]
- Riggs L. A., Johnson E. P., Schick A. M. Electrical Responses of the Human Eye to Moving Stimulus Patterns. Science. 1964 May 1;144(3618):567–567. doi: 10.1126/science.144.3618.567. [DOI] [PubMed] [Google Scholar]
- van der TWEEL L. Some problems in vision regarded with respect to linearity and frequency response. Ann N Y Acad Sci. 1961 Jan 28;89:829–856. doi: 10.1111/j.1749-6632.1961.tb20181.x. [DOI] [PubMed] [Google Scholar]