

Abstract
Monosomy of the human chromosome 6p terminal region results in a variety of congenital malformations that include brain, craniofacial, and organogenesis abnormalities. To examine the genetic basis of these phenotypes, we have carried out an unbiased functional analysis of the syntenic region of the mouse genome (proximal Mmu13). A genetic screen for recessive mutations in this region recovered thirteen lines with phenotypes relevant to a variety of clinical conditions. These include two loci that cause holoprosencephaly, two that underlie anophthalmia, one of which also contributes to other craniofacial abnormalities such as microcephaly, agnathia, and palatogenesis defects, and one locus responsible for developmental heart and kidney defects. Analysis of heterozygous carriers of these mutations shows that a high proportion of these loci manifest with behavioral activity and sensorimotor deficits in the heterozygous state. This finding argues for the systematic, reciprocal phenotypic assessment of dominant and recessive mouse mutants. In addition to providing a resource of single gene mutants that model 6p-associated disorders, the work reveals unsuspected genetic complexity at this region. In particular, many of the phenotypes associated with 6p deletions can be elicited by mutation in one of a number of genes. This finding implies that phenotypes associated with contiguous gene deletion syndromes can result not only from dosage sensitivity of one gene in the region but also from the combined effect of monosomy for multiple genes that function within the same biological process.
Keywords: anophthalmia, ENU mutagenesis, holoprosencephaly
Chromosome 6p deletions are rare events in the population, but detailed cytogenetic analysis has lead to the description of two distinct 6p deletion syndromes (1-4). Terminal deletions of 6p25 are associated with hearing loss, anterior and structural eye anomalies, craniofacial defects including cleft lip and palate, delayed bone maturation, heart defects, and neuronal defects. Interstitial deletion of 6p24-6p22 material results in kidney defects, short neck, structural eye anomalies, limb defects, and heart defects. Most of the features are apparent at birth, implicating genes involved in embryogenesis. Precise localization of deletion breakpoints can assist identification of the genes responsible for these 6p-associated phenotypes; however, inconsistent loss of genetic material, variable expressivity, and decreased penetrance impede human genetic studies.
Mouse models exist for some genes in the 6p region. Homozygous null mutation of the mouse Foxc1 gene causes anterior eye defects, heart and skeletal abnormalities, and hydrocephalus (5-7), whereas mice that lack Foxf2 develop cleft palate (8). The homologous genes are located at 6p25 and haploinsufficiency of these genes may account for many of the congenital abnormalities associated with the 6p terminal deletions (3, 4). Likewise, mouse models have revealed candidate genes for 6p22-24-associated defects. The transcription factor Tcfap2a and the secreted molecule Edn1 are both involved in craniofacial and cardiac development and Tcfap2a is also required for kidney development (9, 10). These candidates were identified by mutation of individual genes, rather than via a systematic examination of the functional content of the deleted region. It is possible that other genes contribute to the deletion phenotypes and that more candidates remain to be uncovered.
In a recently developed approach to the identification of genes relevant to 6p deletion syndromes and 6p-associated disorders, we have used a forward genetics strategy in the mouse. The approach relies on a large block of synteny between 6p22-25 and mouse chromosome 13 and takes advantage of a line of mice [Del(13)Svea36H] (11) that carries an interstitial deletion of proximal Mmu13. This line is monozygous for genetic material corresponding to regions of 6p25 and 6p22, but is relatively insensitive to aneusomy because it does not exhibit all of the phenotypes associated with the 6p deletion syndromes (12). This finding is not unexpected because the analysis of many mouse single gene mutants suggests that mice are less sensitive to haploinsufficiency than humans (13); however, this does mean that the Del(13)Svea36H line can be used to search for recessive mutations that model aspects of the 6p phenotypes. A further advantage of this line is that a high-quality finished sequence has been generated and fully annotated by using a comparative sequencing approach for a 12.7-Mb interval that spans the deletion (14). The region is unusually gene-rich, with the analysis identifying a total of 201 genes and 91 pseudogenes. However, over half of the genes belong to five gene family clusters that also reside on human 6p with only 71 genes residing without these clusters.
The deleted material includes a forkhead transcription factor (Foxq1) that is required for hair differentiation. Homozygous null mutation of this gene produces mice with a glossy coat, referred to as satin (sa) (15). This coat enables the Del(13)Svea36H mouse to be used in a two-generation genetic screen to identify viable and lethal recessive mutations within the segment of the genome defined by the deletion. The screen identified 13 previously undescribed mutant lines of mice, and phenotypic analysis demonstrates that they all mimic aspects of the 6p deletion syndromes. Although three similar deletion screens have previously been reported (16-18), the phenotypic consequences of monosomy at the syntenic human region was not available for comparison in these cases. Our work, in the context of human studies, indicates that phenotypes associated with contiguous gene deletions may arise due to the cumulative consequence of the simultaneous loss of several genes.
Methods
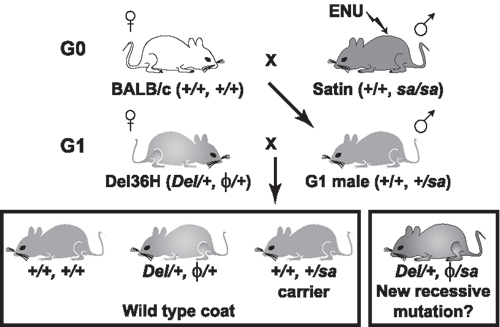
Mouse Strains and the Genetic Screen. Additional details are provided in Supporting Text, Tables 3 and 4, and Figs. 4 and 5, which are published as supporting information on the PNAS web site. Briefly, the satin (sa) mutant (19) was maintained as a closed colony of sa/sa mice segregating C3H/HeH and 101/HeH alleles. Homozygous sa mice have a glossy coat that can be distinguished as the fur grows in at 9 days after birth, and, when necessary, the sa mutation was identified molecularly by using a published assay (15). The Del(13)Svea36H deletion mouse (11) was maintained on a (C3H/HeH × 101/H) F1 hybrid background as described (12). To produce deletion carriers for use in the screen, C57BL/6J females were crossed with Del(13)Svea36H/+ males and hemizygotes identified by amplification of a deleted SSLP marker (D13Mit17: variant for C3H/HeH, 101/HeH, and C57BL/6J). The marker was analyzed by the incorporation of Sybr Green dye during PCR and DNA melt analysis on an ABI7000 Sequence Detection System. For the screen, male sa/sa mice (8-12 weeks of age) were injected i.p. once with 100 mg of ENU per kg body weight or twice with 80 mg of ENU per kg body weight, with repeat injections separated by 1 week. Males that recovered fertility were bred with BALB/cOlaHsd females until they had produced 30 male offspring for use in the G1 cross to female Del(13)Svea36H carriers. At least 25 progeny were obtained from each G1 cross. All breeding data from the primary screen were tested for significance by using the exact one tail binomial test at the 95% confidence interval.
Secondary Screen and Analysis. The +/sa carriers were identified and either crossed to a Del(13)Svea36H hemizygote (a repeat of the G1 cross), or intercrossed to examine the homozygous effect of the mutation. At least 60 progeny were scored for the satin coat from each cross, and the data were tested for significance by using the exact one tail binomial test at the 95% and 99% confidence intervals. Subsequently, colonies were maintained by genotyping progeny for a panel of markers spanning the deletion (Table 3) to select nonrecombinant mice for cross to Del(13)Svea36H hemizygotes. For the complementation test proven males were crossed to +/sa females nonrecombinant across the region. For phenotype analysis, proven males were crossed to Del(13)Svea36H hemizygotes. Some litters were dissected during embryogenesis, examined for visible phenotypes, and genotyped at the sa locus and markers internal to the deletion. Timed mates, recovery of embryos, sectioning, and photography were as described (20). MRI scanning of 14.5-days postcoitum (dpc) embryos and data analysis was as described (21), with a final image resolution of either 12.7 × 12.7 × 9.8 μm per voxel or 25.4 × 25.4 × 24.4 μm per voxel (x, y, and z axes). Some litters were allowed to proceed to term, and either newborn pups were collected for skeletal analysis or animals were genotyped and kept till 8-10 weeks of age for neurological and behavioral assays. Skeletal preparation and bone and cartilage staining was carried out as described (22). The neurological and behavioral screens were conducted on 6-10 heterozygous carriers and wild-type littermate controls. Tests were carried out in the same order over a 2-week period and conducted under standard operating procedures developed by the EUMORPHIA consortium (details available at www.eumorphia.org). A list of the tests is provided in supporting information.
Recombination Mapping and Mutation Detection. For recombination mapping, mutation carriers were crossed to a Del(13)Svea36H hemizygote, and progeny were genotyped for markers (Table 3) that spanned the deletion. Haplotypes were analyzed, and recombinant animals were mated to determine whether the mutation was retained. Test mating involved crossing to a Del(13)Svea36H hemizygote and scoring of ≈60 progeny (either for the satin coat or for the parental haplotype). For mutation detection, PCR primers were designed to amplify the Sox4, Foxc1, Foxq1, and Foxf2 genes (RefSeq accession numbers NM_009238, NM_008592, NM_008239, and NM_010225, respectively) from heterozygous genomic DNA. The amplified products were either sequenced as described (20) or analyzed by using Denaturing High Performance Liquid Chromatography with the WAVE DNA Fragment Analysis System (Transgenomic, York, U.K.) as detailed in Table 4.
Results
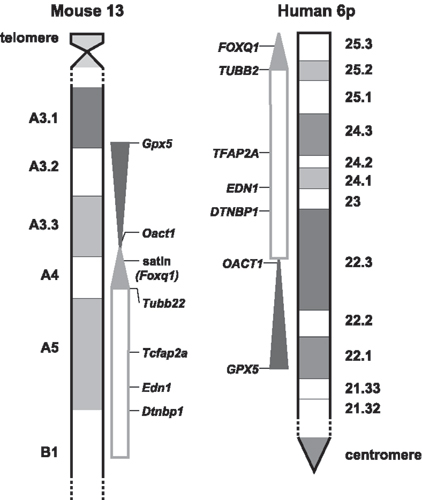
Human 6p and Mouse 13 Synteny. Human and mouse sequence comparison allowed the accurate evaluation of the extent of the 6p/13 synteny and the relative location of the Del13(Svea)36H deletion. As shown in Fig. 4, there has been a genomic rearrangement such that on Mmu13 the 6p23-25 telomeric material lies distal to material that corresponds to 6p22. Furthermore, the 6p22 material is inverted on the mouse chromosome. The Del13(Svea)36H mutant is monozygous for genetic material that corresponds to two regions of human 6p. Firstly, all 6p25.3 and that part of 6p25.2 distal to the Tubb2 gene, and secondly that part of 6p22.3 proximal to Oact1, all of 6p22.2 and that part of 6p22.1 distal to the Gpx5 gene.
The Genetic Screen. The breeding protocol for the primary genetic screen at Del(13)Svea36H is shown in Fig. 5. Among the test progeny, hemizygous mice that carry the mutagenized chromosome are identified by their satin coat. Using this protocol, a viable recessive phenotype will consistently be associated with mice that exhibit the satin coat, and a recessive lethal phenotype will be indicated by the absence of the satin phenotype class. A total of 1,730 crosses were established, resulting in 1,709 complete data sets from which 25 lines were selected for secondary screening. This test confirmed that 13 of these lines carry heritable, recessive mutations, linked to sa (Table 1). All of the recovered mutations were lethal. To establish the time of lethality, +/sa carriers were crossed to Del(13)Svea36H carriers and dissected at a variety of time points. The majority of lines analyzed cause lethality during the second half of gestation (Table 1). Recombination mapping further refined the position of the mutations within the deleted region (Fig. 1).
Table 1. Mutant lines isolated.
| Lethal lines isolated
|
Time of lethality
|
|||||
|---|---|---|---|---|---|---|
| Del/+ × +/sa
|
+/sa × +/sa
|
|||||
| Line | O | E (n) | O | E (n) | Stage (n) | No. Del/sa (%) |
| 54† | 10** | 22.4 (112) | 17** | 38.5 (154) | 9.5 dpc (51) | 9 (17.6) |
| Weaning (112) | 10 (8.9)* | |||||
| 91† | 1** | 8 (40) | 0** | 9.5 (38) | 10.5 dpc (353) | 84 (23.8) |
| 15.5 dpc (25) | 4# (16.0)* | |||||
| 241† | 6** | 18.8 (94) | 3* | 7.5 (30) | 10.5 dpc (104) | 24 (23.0) |
| 16.5 dpc (51) | 8 (16) | |||||
| 369† | 19** | 34.6 (173) | 6** | 25.5 (102) | 15.5 dpc (30) | 8 (26) |
| Weaning (158) | 19 (12)* | |||||
| 412† | 9** | 22.2 (111) | 3* | 9 (36) | 16.5 dpc (23) | 5 (21.7) |
| Weaning (161) | 14 (8.7)* | |||||
| 624† | 7** | 16 (80) | 12 | 14.5 (58) | 9.5 dpc (30) | 8 (26) |
| 16.5 dpc (38) | 5 (13) | |||||
| 667† | 19* | 28.2 (141) | 8** | 20.25 (81) | NT | |
| 876† | 19 | 15.8 (79) | 8** | 27.5 (110) | 7.5 dpc (24) | 2 (8.3) |
| 14.5 dpc (49) | 4 (8.1)* | |||||
| 1073† | 5** | 16.2 (81) | 11 | 14.25 (57) | 13.5 dpc (38) | 8 (21) |
| Weaning (81) | 5 (6.2)* | |||||
| 1185† | 10** | 21.4 (107) | 33 | 39 (156) | 9.5 dpc (26) | 7 (26.9) |
| 16.5 dpc (29) | 2 (6.9)* | |||||
| 1239† | 6** | 14.8 (74) | 24 | 26.5 (106) | 9.5 dpc (102) | 29 (28.4) |
| 16.5 dpc (27) | 2 (11.1)* | |||||
| 1616 | 15* | 25.4 (127) | 11 | 16 (64) | 9.5 dpc (43) | 7 (16.3) |
| 16.5 dpc (16) | 2 (12.5) | |||||
| 1645 | 6* | 12.4 (62) | 13* | 21 (84) | 13.5 dpc (23) | 4 (17.4) |
| Weaning (62) | 6 (9.6)* | |||||
O, observed number of satin progeny; E, expected number of satin progeny; n, total number of progeny scored; NT, not tested; *, statistical significance based on exact one-tailed binomial test with P < 0.05; **, statistical significance based on exact one-tailed binomial test with P < 0.01; #, all embryos in this class were dead; †, no mutation was detected in Foxc1 or Foxf2 in this line.
Fig. 1.

Mutation location. A line diagram of the Del(13)Svea36H region showing human synteny, the position of gene clusters and markers used in the recombination mapping (black) relative to relevant genes in the region (red). The critical interval for each mapped line is shown by the blue line beneath the map. Line 91 carries a mutation in the Sox4 gene.
Brain and Craniofacial Malformations. Three mutant lines (54, 412, and 1,073) exhibit craniofacial defects that mimic those of the 6p25 deletion syndrome. Analysis of skeletal preparations from newborn pups of lines 54, 412, and 1,073 shows that they all have microcephaly, micrognathia, or agnathia and structural defects of the eyes, nose, ears, palate, and dental components (Fig. 2 a-o). Mapping suggests that these mutations may be allelic (Fig. 1). If so, this localizes the homologous gene to the terminal 3 Mb of 6p. The most common phenotype of 6p25 deletions is ocular dysgenesis and this is generally attributed to deletion of the FOXC1 gene (3). However, loss-of-function mutations in Foxc1 (either heterozygous or homozygous) only produce anterior chamber anomalies and not the structural eye defects (such as micropthalmia) that can accompany 6p25 deletion (1, 5, 23, 24). The mutants uncovered in this mutagenesis experiment may account for this discrepancy and identify a candidate gene for other craniofacial defects associated with 6p25 deletion. Some craniofacial defects (such as structural eye defects) are also associated with 6p22-24 deletions, and line 241, which exhibits anophthalmia without micrognathia (Fig. 2r) and maps to the 6p22 syntenic region (Fig. 1), models this defect.
Fig. 2.

Craniofacial and forebrain development. The genotype of mutant animals is represented as Del/m to indicate the mutation (m) in trans to the Del(13)Svea36H chromosome (Del). (a-o) Differential bone and cartilage staining of wild type (+/+; a, f, and k) and mutants from three lines: 54 Del/m (b, c, g, h, l, and m), 1073 Del/m (d, i, and n), and 412 Del/m (e, j, and o). Norma lateralis views (a-e) demonstrate that each mutant specimen is microcephalic and has significant neurocranial, splanchnocranial, and dermatocranial defects, whereas norma basalis views (f-o) highlight the nature of the midline defects of the mutants. The nasal and optic capsules are severely deficient, as are the trabecular basal plate of the neurocranium to which they normally attach and the dermatocranial elements that develop in association with the capsules. Labeled colored arrows represent keys to the identification of homologous elements. (p) Lateral view of the cranial region of a wild-type 15.5-dpc embryo. (q) Lateral view of the cranial region of a line 54 15.5-dpc Del/m embryo showing impaired craniofacial development with anophthalmia, agnathia, and absence of ear pinnae. (r) Lateral view of the cranial region of a line 241 15.5-dpc Del/m embryo showing anophthalmia and absence of ear pinnae. (s) Lateral view of the cranial region of a line 369 15.5-dpc Del/m embryo exhibiting exencephaly. (t) Lateral view of the cranial region of a line 624 15.5 dpc Del/m embryo exhibiting a single, ventrally displaced eye beneath a thin walled holosphere. (u) Anterior view of an 18.5-dpc wild-type embryo (Right) and a 1239 Del/m embryo with cyclopia (Left). (v-x) Transverse sections through the prosencephalon of a 15.5-dpc wild-type embryo (v) or hemizygous mutants (w and x) showing hypoplastic lateral ventricles in lines 412 and 54 with no development of the interhemispheric fissure (arrow in v).
Each of the four lines with craniofacial defects, along with 624 and 1239, show defective brain development (Fig. 2 t-x). All of these mutants have midline forebrain phenotypes (visible at either 9.5 or 15.5 dpc) that fall into the spectrum of defects known as holoprosencephaly (HPE). Human genetic studies have so far identified 12 genomic intervals associated with HPE (25). Although 6p is not one of these segments, this observation may be explained by the rarity of 6p deletions and by embryonic lethality of 6p deletions that cause HPE (1). Mapping of the lines that exhibit HPE shows that the causative loci are found in two distinct regions that are syntenic to 6p25 and 6p22 (Fig. 1). An intercross between the two mutations found in the 6p22 syntenic region (lines 241 and 1239) resulted in a normal number of sa progeny (21 Del/sa pups from 89, P = 0.84), the ability of these mutations to complement one another suggests that they may not be allelic. It is possible that midline defects underlie the commonly reported brain developmental delay in 6p deletion cases. Additionally, one line (412) also shows a visible rostral hindbrain phenotype at 9.5 dpc (data not shown). This locus may contribute to the Dandy-Walker type of hydrocephalus seen in some 6p deletion cases that cannot be attributed to haploinsufficiency for Foxc1 (3, 4).
Organogenesis Defects. Organogenesis defects are associated with the 6p deletion syndromes but are inconsistently documented due to the difficulty of invasive investigations. The 6p interstitial deletions are associated with heart and kidney defects, and a mutant that dies at 14.5 dpc because of circulatory failure mimics these defects (line 91; Table 2). Examination of line 91 mutant embryos by MRI revealed specific cardiac defects (Fig. 3) and hypoplastic kidneys that are occasionally abnormally positioned. The candidate genes, based on mouse mutant models, for the heart and kidney defects associated with 6p22-24 deletions (Tcfap2a and Edn1) (3) are not deleted in the Del(13)Svea36H mice (Fig. 1). Therefore, we sought to identify the mutated gene in line 91. Recombination frequencies positioned the mutation within 0.8 cM of either side of Foxq1. Sox4, the HMG box transcription factor located within this interval, was considered a strong candidate because targeted mutation of this gene results in homozygous embryos that succumb to circulatory failure at 14.5 dpc (26). Mutation scanning of Sox4 identified a change at nucleotide 869 (RefSeq accession no. NM_009238). The T to C transition at this nucleotide generates the Ser70Pro missense mutation (Fig. 3). This transition introduces a proline residue into the first α-helix of the HMG box of Sox4 and proline residues are incompatible with the formation of α-helices. Evidence that this is the causative mutation is provided by the phenocopy of the spectrum of cardiac defects documented in the targeted allele of Sox4 (Sox tm1Cle) (26).
Table 2. Summary of phenotype analysis.

*Assay was performed on heterozygous carriers of the mutation (+/sa).
†Phenotype associated with 6p deletion syndromes.
Fig. 3.

The Sox4 missense mutation. (a and b) Sequencing of Sox4 in line 91 heterozygotes reveals a T to C transition (arrow) at nucleotide 869. (c-h) Magnetic resonance imaging of the heart in wild-type and Line91 hemizygote mutant embryos at 14.5 dpc. (c) Transverse section through a wild-type embryo at the level of the mitral valve (MV). The left (LV) and right (RV) ventricles are separated by the interventricular septum (IVS) and the left (LA) and right (RA) atria by the primary atrial septum (PAS). The systemic venous sinus (SVS) draining into the RA is indicated. (d) A corresponding section through a Sox4-/- heart. A primum atrial septal defect (ASDP) is seen at the ventral margin of the PAS, with a common atrioventricular junction. The mitral valve is dysplastic. (e and g) Transverse section at the level of the left ventricular outflow tract (LVOT) and 3D reconstruction of a wild-type embryonic heart at 14.5 dpc. The aorta (Ao) originates from the left ventricle (LV), and the main pulmonary artery (PA) from the right ventricle (RV). The right ventricular outflow tract (RVOT) is indicated. The aortic arch (Ao-A) is the same size as the PA. (f and h) Corresponding transverse section and 3D reconstruction of a Sox4-/- heart at 14.5 dpc. A large ventricular septal defect (VSD) connects the RV and LV. The aorta and pulmonary artery both originate from the right ventricle (double-outlet right ventricle). The Ao-A is smaller than the PA. Axes: D, dorsal; V, ventral; L, left; R, right. (Scale bar, 500 μM.)
Neurobehavioral Deficits. The 6p deletion patients have a variety of neuronal deficits, and neurobehavioral syndromes have also been associated with this region [schizophrenia (27) and attention deficit hyperactivity disorder and reading disability (28, 29)]. The time-consuming nature of behavioral and neurological tests meant that it was impractical to test a cohort from each of the 1,730 pedigrees screened. Instead, we assessed the heterozygous carriers of the isolated lines for behavioral and neurological deficits. This strategy identified five lines (of 10 tested) with distinct neurological and behavioral phenotypes (Table 2) and, in at least three of these, the hemizygous mutation causes an overt neurodevelopmental phenotype. Line 876 heterozygotes show a specific deficit in sensorimotor gating when assayed for prepulse inhibition of the acoustic startle response (11% decrease, P < 0.05) relative to wild-type siblings, a feature common to a broad spectrum of psychiatric patients including those with 6p-associated disorders such as schizophrenia (27, 30). Interestingly, a recently identified 6p25 deletion carrier presented with schizophrenia.** Association studies favor the DTNBP1 gene (located at 6p22.3) as a candidate for the 6p schizophrenia locus (27); however, this gene is not deleted in the Del(13)Svea36H mice (Fig. 4). Several lines show aberrant behavior in the Open Field Activity test where cumulative entries into the center of the arena provides a measure of anxiety state. Three lines show decreased cumulative center entries (line 876, 24% decrease, P < 0.05; line 91, 31% decrease, P < 0.05; line 1239, 29% decrease, P < 0.05) indicative of a heightened anxiety state. Moreover, line 91 shows additional reductions in total distance traveled (22% decrease, P < 0.004) and movement time (14% decrease, P < 0.002) implying that different behavioral processes are affected in individual lines. In contrast line 1073 shows increased center entries (29% increase, P < 0.05). Line 369 shows small but nonsignificant increases in many cumulative open field parameter tests indicating elevated activity levels. To investigate these changes further, we compared parameters over 3-min bins and carried out repeated measures analysis. Heterozygotes show increased activity and increased center time over the first three bins of the test (≈50%↑, P < 0.05). All of these mutants warrant further investigation to determine their suitability for the study of 6p-associated disorders.
The Fox Gene Cluster. Six of the recovered mutants are located in the 6p25 syntenic region that contains three Fox genes (Fig. 1). Allelism with either the Foxc1 or Foxf2 gene, known to be associated with perinatal lethality (5-7), is possible. We carried out mutation detection across the three Fox genes in heterozygous carriers from all lines that exhibited eye, craniofacial, skeletal, or heart defects. This analysis failed to identify any UTR, splice-site, or coding region mutations in the lines examined (Tables 1 and 4). Our previous annotation of this region (14) makes it unlikely that unidentified exons are associated with these genes. Additionally, in situ hybridization did not detect altered Foxc1 or Foxf2 mRNA expression in these mutant lines at 9.5 dpc (Foxc1) or 10.5 dpc (Foxf2), ruling out a regulatory region mutation that causes a complete absence of transcript (data not shown). These data do not rule out mutations that cause subtle effects on mRNA regulation or some other aspect of gene regulation. It does, however, seem unlikely that all six of these lines carry unidentified mutations in one of these two genes.
Discussion
All of the mutations recovered in the screen at Del(13)Svea36H are embryonic lethal. Recessive viable and dominant mutations (unlinked to sa) were recovered, and the latter was found at the expected frequency based on previous screens (31). This finding demonstrates that the sa/sa mice were efficiently mutagenized and that our screening protocols were sufficiently sensitive. The possibility that phenotypes were missed needs to be weighed against the resources required for more elaborate, or invasive tests. Other screens designed to recover both lethal and viable mutants found that the majority of isolated mutations were embryonic lethal (16, 17, 32). Between-screen comparisons of phenotype class and recovery rate of region-specific screens assume an even distribution of functionally equivalent genes. Our knowledge of gene distribution indicates that this is clearly not the case with the Del(13)Svea36H region itself, showing that gene family expansion can lead to highly irregular patterns of gene distribution.
The genetic screen at Del(13)Svea36H has clearly not reached saturation. Based on an average mutation rate of ENU in the mouse (0.001 mutations per locus; ref. 33), the number of pedigrees screened represents a one- to two-times genome coverage. In this type of sample, not all genes in the region will have been mutated in any pedigree, whereas some genes may have been mutated in more than one pedigree. When the mutation frequency is 0.00108 mutations per locus, it can be estimated that screening 1,730 pedigrees generates an ≈80% chance of finding one allele and a ≈50% chance of finding two mutant alleles of any gene (34). The number of pedigrees examined would need to be doubled before a ≈98% chance of finding an allele at every locus was attained (34) and, because of the diminishing return from screening further lines, we considered this a sensible end point for the screen.
Despite the screen not reaching saturation, it has recovered mutant lines that reveal candidate genes for 6p-associated disorders and diseases. The cloning of these mutations will supply new genes for patient screening and inform the analysis of a variety of clinical conditions. Moreover, two important conclusions that impact beyond the Del(13)Svea36H region have been reached. First, the screen has identified several distinct phenotypes in behavioral tests, giving a mutant recovery rate much higher than that found in genome-wide behavioral screens (31). In appraising the significance of these findings, we conclude that mutations of small phenotypic effect (such as the 11% reduction in prepulse inhibition we found here) are nigh on impossible to identify in genome-wide screens. The systematic phenotyping of heterozygous carriers of developmental mutations should provide a new paradigm for identifying mutants relevant to the study of behavioral and neurological disorders. The mutant lines described here provide an opportunity to investigate the developmental basis of such disorders (35). Likewise, our findings argue that the homozygous effect of dominant mutations should be scrutinized.
Secondly, when analyzed in the context of human genetic studies, the work reveals several examples of 6p-associated phenotypes that can be elicited by more than one gene. It is now clear that at least four 6p genes are involved in heart development (Sox4 as well as Foxc1, Tcfap2, and Edn1) and that two genes in the 6p22-24 region can elicit kidney phenotypes (Sox4 and Tcfap2). The screen identified six mutations that produce visible forebrain defects in either the hemizygous or homozygous state. Mapping and complementation studies show that these represent at least three distinct loci, two of which meiotically exclude Foxc1, the only 6p gene previously associated with developmental CNS function. Additionally, several independent loci show discrete effects on behavioral activity. These data suggest that phenotypes associated with segmental monosomy may arise because of contributions from a number of genes with similar function rather than by haploinsufficiency at a single locus. Although this phenomenon may be unique to the 6p/proximal 13 region, two recent studies support a more wide-spread applicability. Study of trisomy 21 models found that the associated phenotypes may arise due to interactions between the triplicated genes and studies of the 22q11 minimal deletion region have identified two separate schizophrenia risk loci (36, 37). Our work demonstrates the need for continued unbiased, comprehensive mutational analysis of the sort that can be achieved using phenotype-driven genetic strategies.
Supplementary Material
Acknowledgments
We thank J. Peters, M. Lyon, and D. Fitzpatrick for critical reading of the manuscript and D. Napper, L. Robertson, E. Alexander, S. Fuller, M. Cormack, S. Bailey, and T. Hacker for technical assistance. This work was funded by Medical Research Council fellowships (to R.M.A.), a Wellcome Trust grant (to P.T.S. and J.R.) and N.T. was supported by a King's College Fellowship (to J.R., P.T.S., and Ellen Solomon).
Author contributions: P.T.S., A.G., P.D., S.D.M.B., J.R., and R.M.A. designed research; D.B., C.W., J.D., K.K., G.M., A.P., H.H., R.M., M.C., G.P., J.E.S., A.H., N.T., M.J.D., R.C., G.D., P.T.S., J.R., and R.M.A. performed research; K.K., J.E.S., S.B., and J.R. contributed new reagents/analytic tools; D.B., C.W., J.D., K.K., G.M., A.P., G.P., S.B., A.H., P.M.N., M.J.D., G.D., P.T.S., P.D., J.R., and R.M.A. analyzed data; and D.B., C.W., P.M.N., M.J.D., P.T.S., A.G., S.D.M.B., and R.M.A. wrote the paper.
This paper was submitted directly (Track II) to the PNAS office.
Abbreviation: dpc, days postcoitum.
Footnotes
Caluseriu, O., Chow, E. W. C., Weksberg, R., Rosenberg, L., MacCrimmon, D. J. & Bassett, A. S., American Society for Human Genetics Meeting, Oct. 26-30, 2004, Toronto, ON, Canada, abstr. 664.
References
- 1.Palmer, C. G., Bader, P., Slovak, M. L., Comings, D. E. & Pettenati, M. J. (1991) Am. J. Med. Genet. 39, 155-160. [DOI] [PubMed] [Google Scholar]
- 2.Davies, A. F., Mirza, G., Sekhon, G., Turnpenny, P., Leroy, F., Speleman, F., Law, C., van Regemorter, N., Vamos, E., Flinter, F., et al. (1999) Hum. Genet. 104, 64-72. [DOI] [PubMed] [Google Scholar]
- 3.Gould, D. B., Jaafar, M. S., Addison, M. K., Munier, F., Ritch, R., MacDonald, I. M. & Walter, M. A. (2004) BMC Med. Genet. 5, 17. [DOI] [PMC free article] [PubMed] [Google Scholar]
- 4.Mirza, G., Williams, R. R., Mohammed, S., Clark, R., Newbury-Ecob, R., Baldinger, S., Flinter, F. & Ragoussis, J. (2004) Eur. J. Hum. Genet. 12, 718-728. [DOI] [PubMed] [Google Scholar]
- 5.Hong, H. K., Lass, J. H. & Chakravarti, A. (1999) Hum. Mol. Genet. 8, 625-637. [DOI] [PubMed] [Google Scholar]
- 6.Kume, T., Deng, K. Y., Winfrey, V., Gould, D. B., Walter, M. A. & Hogan, B. L. (1998) Cell 93, 985-996. [DOI] [PubMed] [Google Scholar]
- 7.Winnier, G. E., Kume, T., Deng, K., Rogers, R., Bundy, J., Raines, C., Walter, M. A., Hogan, B. L. & Conway, S. J. (1999) Dev. Biol. 213, 418-431. [DOI] [PubMed] [Google Scholar]
- 8.Wang, T., Tamakoshi, T., Uezato, T., Shu, F., Kanzaki-Kato, N., Fu, Y., Koseki, H., Yoshida, N., Sugiyama, T. & Miura, N. (2003) Dev. Biol. 259, 83-94. [DOI] [PubMed] [Google Scholar]
- 9.Kurihara, Y., Kurihara, H., Suzuki, H., Kodama, T., Maemura, K., Nagai, R., Oda, H., Kuwaki, T., Cao, W. H., Kamada, N., et al. (1994) Nature 368, 703-710. [DOI] [PubMed] [Google Scholar]
- 10.Zhang, J., Hagopian-Donaldson, S., Serbedzija, G., Elsemore, J., Plehn-Dujowich, D., McMahon, A. P., Flavell, R. A. & Williams, T. (1996) Nature 381, 238-241. [DOI] [PubMed] [Google Scholar]
- 11.Tease, C. & Fisher, G. (1993) Mouse Genome 91, 855. [Google Scholar]
- 12.Arkell, R. M., Cadman, M., Marsland, T., Southwell, A., Thaung, C., Davies, J. R., Clay, T., Beechey, C. V., Evans, E. P., Strivens, M. A., et al. (2001) Mamm. Genome 12, 687-694. [DOI] [PubMed] [Google Scholar]
- 13.Goodman, F. R. (2003) Lancet 362, 651-662. [DOI] [PubMed] [Google Scholar]
- 14.Mallon, A. M., Wilming, L., Weekes, J., Gilbert, J. G., Ashurst, J., Peyrefitte, S., Matthews, L., Cadman, M., McKeone, R., Sellick, C. A., et al. (2004) Genome Res. 14, 1888-1901. [DOI] [PMC free article] [PubMed] [Google Scholar]
- 15.Hong, H. K., Noveroske, J. K., Headon, D. J., Liu, T., Sy, M. S., Justice, M. J. & Chakravarti, A. (2001) Genesis 29, 163-171. [DOI] [PubMed] [Google Scholar]
- 16.Shedlovsky, A., King, T. R. & Dove, W. F. (1988) Proc. Natl. Acad. Sci. USA 85, 180-184. [DOI] [PMC free article] [PubMed] [Google Scholar]
- 17.Rinchik, E. M. & Carpenter, D. A. (1999) Genetics 152, 373-383. [DOI] [PMC free article] [PubMed] [Google Scholar]
- 18.Rinchik, E. M., Carpenter, D. A. & Johnson, D. K. (2002) Proc. Natl. Acad. Sci. USA 99, 844-849. [DOI] [PMC free article] [PubMed] [Google Scholar]
- 19.Major, M. H. (1955) Mouse News Lett. 12, 47. [Google Scholar]
- 20.Bogani, D., Warr, N., Elms, P., Davies, J., Tymowska-Lalanne, Z., Goldsworthy, M., Cox, R. D., Keays, D. A., Flint, J., Wilson, V., et al. (2004) Genesis 40, 109-117. [DOI] [PubMed] [Google Scholar]
- 21.Schneider, J. E., Cassidy, P. J., Lygate, C., Tyler, D. J., Wiesmann, F., Grieve, S. M., Hulbert, K., Clarke, K. & Neubauer, S. (2003) J. Magn. Reson. Imaging 18, 691-701. [DOI] [PubMed] [Google Scholar]
- 22.Wassersug, R. J. (1976) Stain Technol. 51, 131-134. [DOI] [PubMed] [Google Scholar]
- 23.Kidson, S. H., Kume, T., Deng, K., Winfrey, V. & Hogan, B. L. (1999) Dev. Biol. 211, 306-322. [DOI] [PubMed] [Google Scholar]
- 24.Chitayat, D., Hahm, S. Y., Iqbal, M. A. & Nitowsky, H. M. (1987) Am. J. Med. Genet. 26, 145-151. [DOI] [PubMed] [Google Scholar]
- 25.Roessler, E. & Muenke, M. (1998) J. Inherit. Metab. Dis. 21, 481-497. [DOI] [PubMed] [Google Scholar]
- 26.Schilham, M. W., Oosterwegel, M. A., Moerer, P., Ya, J., de Boer, P. A., van de Wetering, M., Verbeek, S., Lamers, W. H., Kruisbeek, A. M., Cumano, A., et al. (1996) Nature 380, 711-714. [DOI] [PubMed] [Google Scholar]
- 27.Straub, R. E., Jiang, Y., MacLean, C. J., Ma, Y., Webb, B. T., Myakishev, M. V., Harris-Kerr, C., Wormley, B., Sadek, H., Kadambi, B., et al. (2002) Am. J. Hum. Genet. 71, 337-348. [DOI] [PMC free article] [PubMed] [Google Scholar]
- 28.Grigorenko, E. L., Wood, F. B., Golovyan, L., Meyer, M., Romano, C. & Pauls, D. (2003) Am. J. Med. Genet. B 118, 89-98. [DOI] [PubMed] [Google Scholar]
- 29.Willcutt, E. G., Pennington, B. F., Smith, S. D., Cardon, L. R., Gayan, J., Knopik, V. S., Olson, R. K. & DeFries, J. C. (2002) Am. J. Med. Genet. 114, 260-268. [DOI] [PubMed] [Google Scholar]
- 30.Braff, D. L., Geyer, M. A. & Swerdlow, N. R. (2001) Psychopharmacology 156, 234-258. [DOI] [PubMed] [Google Scholar]
- 31.Nolan, P. M., Peters, J., Strivens, M., Rogers, D., Hagan, J., Spurr, N., Gray, I. C., Vizor, L., Brooker, D., Whitehill, E., et al. (2000) Nat. Genet. 25, 440-443. [DOI] [PubMed] [Google Scholar]
- 32.Kile, B. T., Hentges, K. E., Clark, A. T., Nakamura, H., Salinger, A. P., Liu, B., Box, N., Stockton, D. W., Johnson, R. L., Behringer, R. R., et al. (2003) Nature 425, 81-86. [DOI] [PubMed] [Google Scholar]
- 33.Hitotsumachi, S., Carpenter, D. A. & Russell, W. L. (1985) Proc. Natl. Acad. Sci. USA 82, 6619-6621. [DOI] [PMC free article] [PubMed] [Google Scholar]
- 34.Coghill, E. L., Hugill, A., Parkinson, N., Davison, C., Glenister, P., Clements, S., Hunter, J., Cox, R. D. & Brown, S. D. (2002) Nat. Genet. 30, 255-256. [DOI] [PubMed] [Google Scholar]
- 35.Waddington, J. L., Buckley, P. F., Scully, P. J., Lane, A., O'Callaghan, E. & Larkin, C. (1998) J. Psychiatr. Res. 32, 179-189. [DOI] [PubMed] [Google Scholar]
- 36.Olson, L. E., Richtsmeier, J. T., Leszl, J. & Reeves, R. H. (2004) Science 306, 687-690. [DOI] [PMC free article] [PubMed] [Google Scholar]
- 37.Liu, H., Abecasis, G. R., Heath, S. C., Knowles, A., Demars, S., Chen, Y. J., Roos, J. L., Rapoport, J. L., Gogos, J. A. & Karayiorgou, M. (2002) Proc. Natl. Acad. Sci. USA 99, 16859-16864. [DOI] [PMC free article] [PubMed] [Google Scholar]
Associated Data
This section collects any data citations, data availability statements, or supplementary materials included in this article.