

Abstract
DNA damage in cells induces the expression of inflammatory genes. However, the mechanism by which cells initiate an innate immune response in the presence of DNA lesions blocking transcription remains unknown. Here, we find that genotoxic stresses lead to an acute activation of the transcription factor NF-κB through two distinct pathways, each triggered by different types of DNA lesions and coordinated by either ATM or IRAK1 kinases. ATM stimulates NF-κB in cells with DNA double-strand breaks. In contrast, IRAK1-induced NF-κB signaling occurs in neighboring cells via IL-1α secretion from transcriptionally stressed cells caused by DNA lesions blocking RNA polymerases. Subsequently, both pathways stimulate TRAF6 and the IKK complex to promote NF-κB-mediated inflammatory gene expression. These findings provide an alternative mechanism for damaged cells with impaired transcription to initiate an inflammatory response without relying on their own gene expression, a necessary step that injured cells depend on during canonical innate immune responses.
INTRODUCTION
DNA integrity is frequently compromised by both exogenous and endogenous DNA damage, leading to genomic instability that contributes to the development of cancer, age-related diseases, chronic inflammation, and cell death1–3. The DNA damage response (DDR) plays a crucial role in maintaining genome stability by sensing DNA lesions and mediating signaling to promote temporary cell cycle arrest and DNA repair mechanisms1–3. Moreover, DNA damage produces an inflammatory response by activating specific innate immune signaling pathways. Genotoxic stress-induced innate immunity relies on nucleic acid-sensing pattern recognition receptors (PRRs). PRRs detect self-nucleic acids released from damaged nuclear or mitochondria DNA4,5. Upon activation in damaged cells, PRRs trigger the expression and secretion of immunomodulatory proteins such as interferons (IFNs) initiating a signaling cascade to induce inflammatory genes in neighboring cells and/or immune cells5,6. However, the Achilles’ heel of the innate immune response lies in its dependency on ongoing transcription in the injured cells. Indeed, DNA lesions that block RNA polymerases elongation have been reported to impede IFN gene expression in virally infected cells, resulting in inhibition of the IFN-mediated signaling cascade7–9. Therefore, how cells manage to trigger an innate immune response in the context of DNA damage-induced transcription blockage remains unknown.
Cytosolic double-stranded DNAs resulting from the formation of micronuclei in mitosis or the export of DNA fragments generated during DNA repair in the nucleus are detected by the PRR cGAS10–12. Once activated, cGAS promotes STING to trigger an IFN response by activating TBK1 kinase and the IKK complex (IKKα, IKKβ, and NEMO), leading to the phosphorylation of transcription factors IRFs and NF-κB, respectively5,13. The inflammatory response mediated by cGAS-STING escalates over several days after DNA damage in contrast to the DDR that occurs rapidly within minutes to hours10–12. This asynchronous kinetics can be explained by rate-limiting steps preventing cGAS activation, such as mitotic progression10,11,14, micronuclei rupture15–17, or the presence of DDR factors such as TREX1 that degrade cytosolic DNA18,19. This interplay between the innate immune system and DDR is critical in limiting aberrant inflammation response and cell death following DNA damage.
In contrast to the delayed inflammation and cytokine production mediated by cGAS-STING, DNA damage can also quickly trigger the NF-κB pathway within a few hours. This acute activation of NF-κB has been associated with pro-survival gene expressions20–23 and occurs through a signaling cascade regulated by the Ataxia-telangiectasia mutated (ATM) kinase, which is stimulated by DNA double-strand breaks (DSBs)23–25. Once activated, ATM relocalizes to the cytoplasm and promotes the ubiquitin ligase TRAF623,26. In turn, TRAF6 induces the IKK complex to initiate the proteasomal degradation of IκBα that sequesters the NF-κB heterodimer p65-p50 in the cytoplasm21,23. The release of the p65-p50 complex from IκBα allows its nuclear localization to induce specific gene expressions20. Although ATM has been well characterized to promote NF-κB in response to DSBs23,26–31, it is still unknown whether additional pathways can rapidly activate NF-κB in cells damaged by other types of DNA lesions not recognized by ATM.
The innate immune signaling mediated by either cGAS-STING or ATM rely entirely on the expression and secretion of IFN and other immunomodulatory proteins by the damaged cells, underscoring the pathway’s vulnerability to DNA lesions that inhibit transcription. Here, we uncover an immune signaling response to DNA lesions impeding transcription. We find that in response to different types of DNA lesions, the NF-κB pathway is rapidly activated through two separate mechanisms orchestrated by ATM or IRAK1 kinases. Consistent with previous reports, ATM mediates an acute activation of p65 upon DNA lesions resulting in DSB formation. In contrast, DNA lesions blocking transcription cause Interleukin 1α (IL-1α) release from the cells to stimulate the transmembrane receptor IL-1R1 of nearby cells, which in turn activates the Myd88-IRAK1 complex. Like ATM, IRAK1 induces TRAF6, resulting in NF-κB activation and expression of specific inflammatory genes. Together these findings provide an explanation of how damaged cells initiate an inflammatory response in the absence of active transcription.
RESULTS
Distinct mode of activation of NF-κB after TOP1 inhibition
To investigate the spatial and temporal regulation of the NF-κB pathway in response to DNA damage, particularly in the context of DNA lesions known to block transcription, we developed a quantitative image-based cytometry (QIBC) method using high-content microscopy32, by measuring the difference in p65 localization between the cytoplasm and nucleus in each cell (Figure 1A and Extended Data Figure 1A). QIBC enables the tracking and quantification of p65 activation at the single-cell level allowing us to study the direct association between p65 localization, cell cycle phases, and DNA damage levels in individual cells. We selected the DNA damage marker γH2AX to detect DSBs and/or replication fork collapse33. To monitor the cell cycle phases, we quantified Geminin levels that gradually increase from early S-phase through G2-phase34 and/or measured DNA content (DAPI integrated intensity). We first validated QIBC as a method to monitor NF-κB localization in response to DNA damage caused by topoisomerase I (TOP1) inhibitors (Camptothecin [CPT]) known to stimulate NF-κB28,29. CPT traps TOP1 on the DNA after cleavage of one DNA strand, forming a TOP1 cleavage complex (TOP1cc) that prevents the religation of the single-strand break (SSB)35,36. SSBs are either repaired in cells by the base excision repair pathway (BER) or converted to DSBs during S-phase if they encounter a replication fork35,36. CPT treatment of MCF10A cells, an untransformed cell line commonly used to study the innate immune response caused by genotoxic stresses, promotes a rapid nuclear localization of p65 only in cells positive for γH2AX or with increasing levels of Geminin (Figure 1A–C), suggesting that TOP1 inhibition-induced DNA replication forks collapse triggers NF-κB. Importantly, nuclear p65-positive cells were negative for cytoplasmic IκBα levels, and p65 activation was completely abolished in NEMO knockout (KO) cells (Extended Data Figures 1B–D). These data demonstrate that the nuclear localization of p65 after TOP1 inhibition is a direct consequence of signaling events triggered by DNA damage rather than a defect in the export/import of the p65/IκBα complex37.
Figure 1: A quantitative image-based cytometry approach to monitor p65 activation caused by TOP1 inhibition.
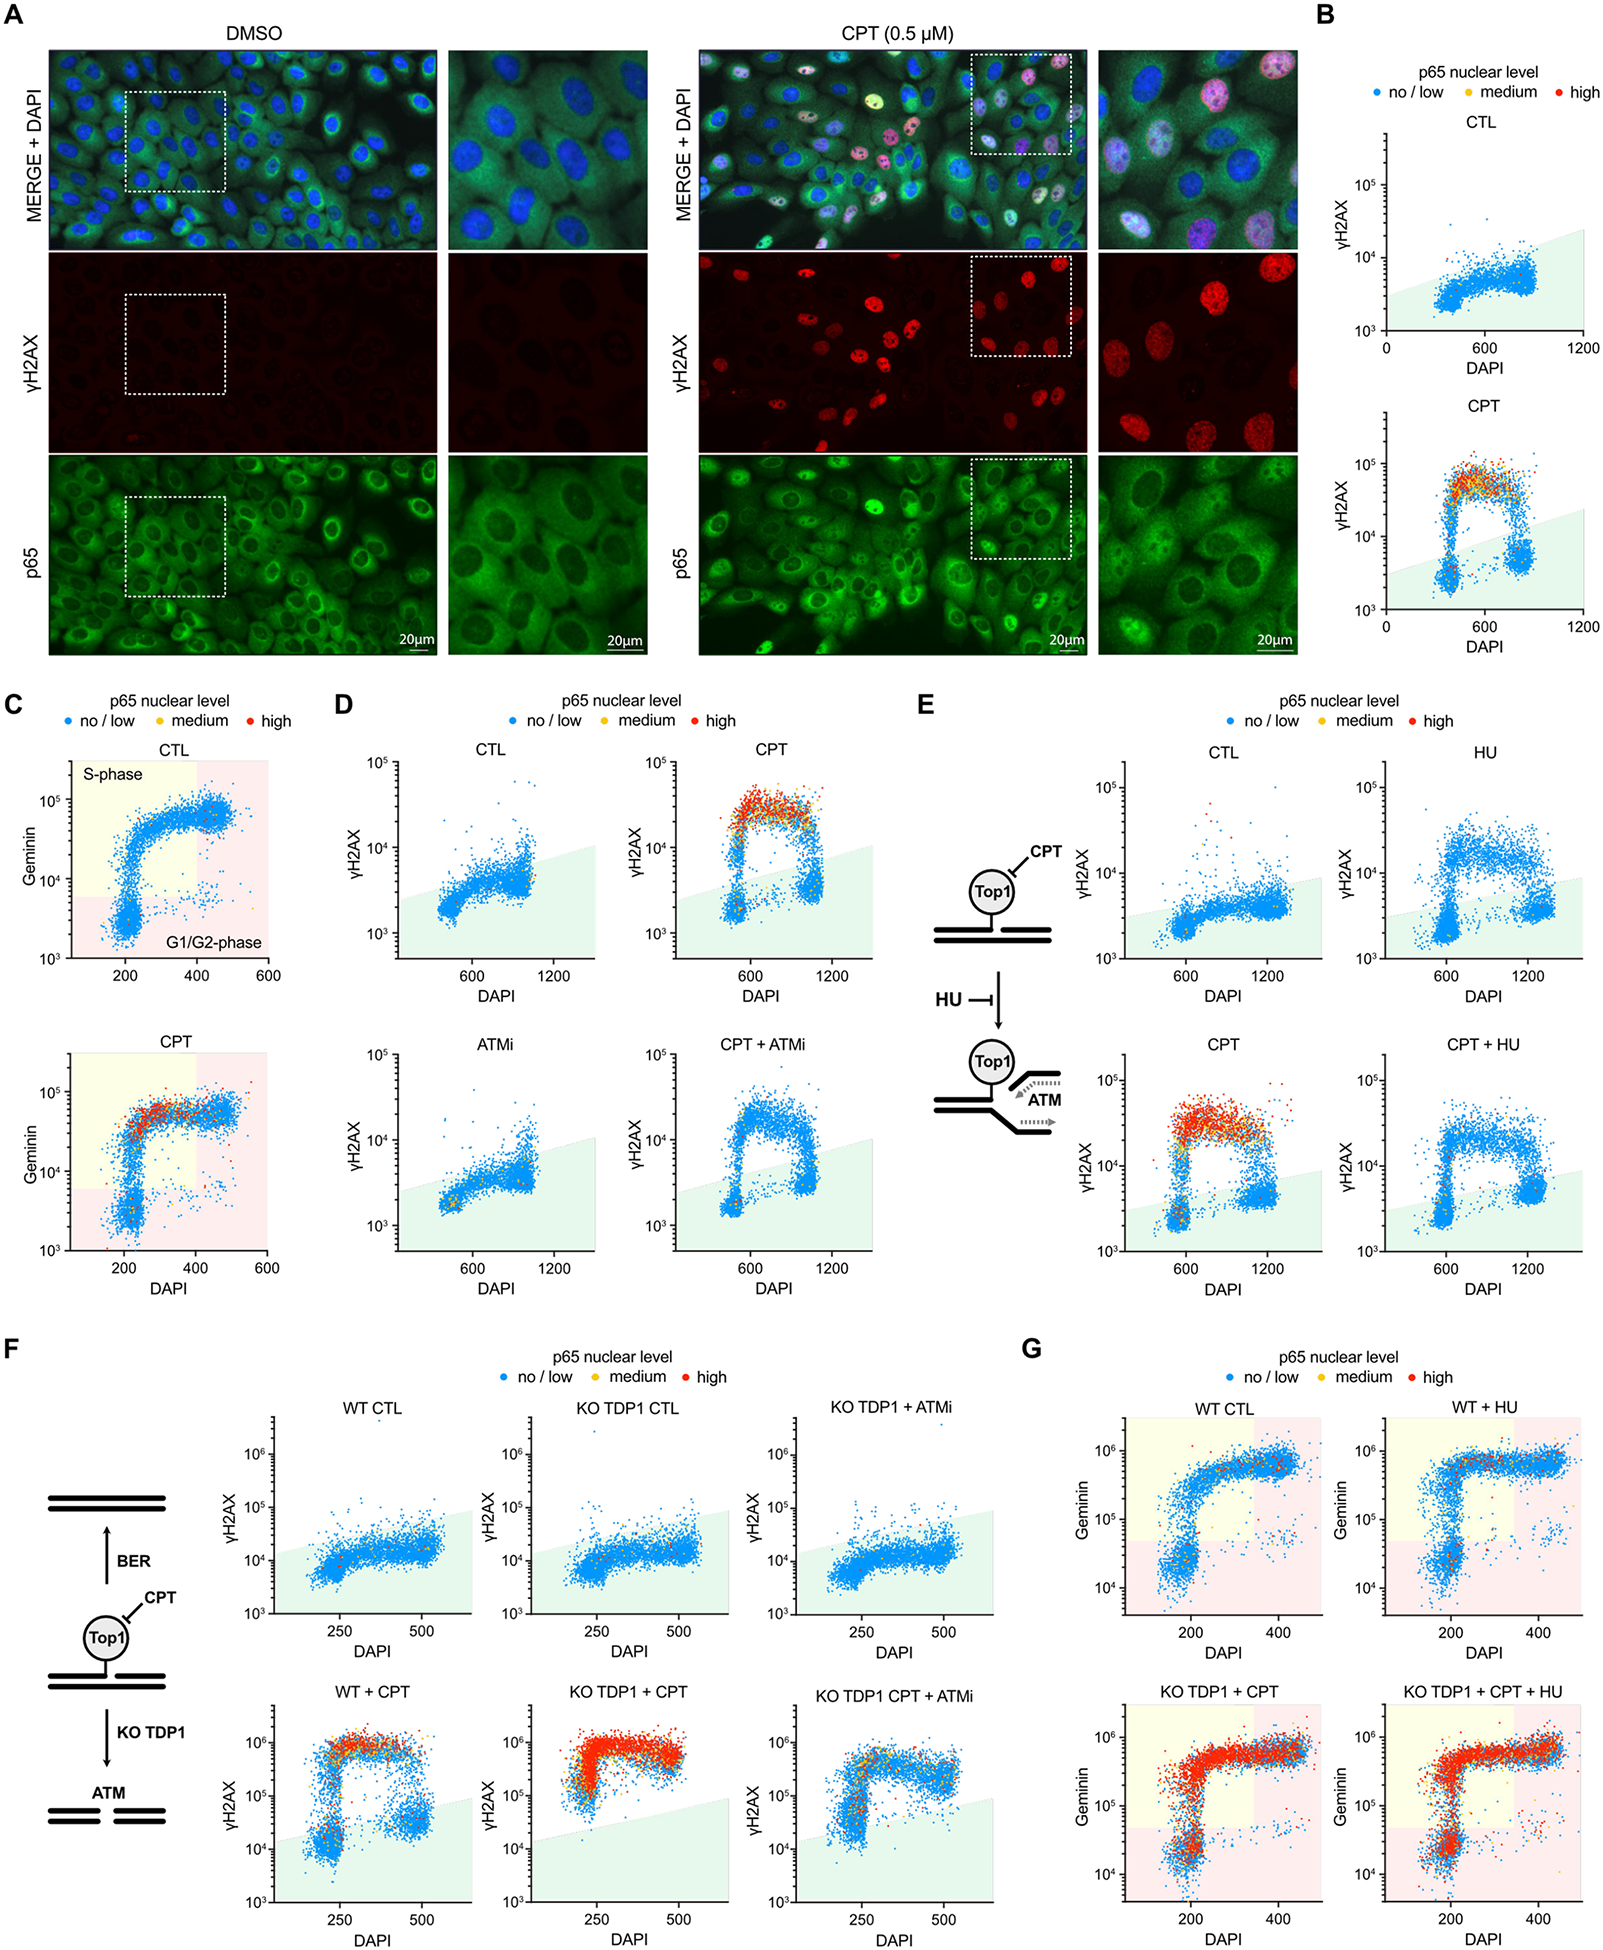
A. Immunofluorescence for p65 and γH2AX in MCF10A cells treated with DMSO or CPT (0.5 μM) for 2 h. Scale bar: 20 μm. B-C. Quantification of p65 nuclear levels, DNA contents, and γH2AX (B) or Geminin (C) intensity of 5,000 MCF10A cells treated for 2 h with DMSO or CPT (0.5 μM). Each individual cell was color-coded according to the intensity of p65 in the nucleus compared to its cytoplasmic staining. D. Quantification of p65 nuclear levels, γH2AX intensity, and DNA contents of 5,000 MCF10A cells treated with DMSO or CPT (0.5 μM) for 2 h. When indicated, cells were pre-treated with ATMi (10 μM) for 30 min before adding CPT. Cells were color-coded according to the levels of p65 nuclear intensity. E. Left: Model in which HU blocks DNA replication fork collapse caused by TOP1cc. Right: Quantification of p65 nuclear levels, γH2AX intensity, and DNA contents of 5,000 MCF10A cells treated with HU (2 mM) for 5 min followed by DMSO or CPT (0.5 μM) treatment for 2 h. Cells were color-coded according to the levels of p65 nuclear intensity. F. Left: Model highlighting TOP1cc leading to DSBs formation in the absence of TDP1. Right: Quantification of p65 nuclear levels, γH2AX intensity, and DNA contents of 5,000 MCF10A WT or TDP1 KO cells treated with DMSO or CPT (0.5 μM) for 2 h. When indicated, cells were pre-treated with DMSO or ATMi (10 μM), for 30 min before CPT. Cells were color-coded according to the intensity of p65 nuclear staining. G. Quantification of p65 nuclear levels, Geminin intensity, and DNA contents of 5,000 MCF10A WT or TDP1 KO cells treated CPT (0.5 μM) ± HU (2 mM) for 2 h. Cells were color-coded according to the levels of p65 nuclear intensity.
We then asked how the DDR affects the activation of p65 in S-phase caused by TOP1 inhibition. We showed that ATR inhibitor (ATRi) further enhanced p65 activation in cells treated with two different TOP1 inhibitors (CPT and Topotecan [TPT]), while the inhibition of DNA-PKcs did not affect p65 levels (Extended Data Figures 1E–F). These results suggest that ATR plays a role in preventing NF-κB activation by limiting replication fork collapse38,39. In contrast, cells treated with ATM inhibitor (ATMi) or KO for ATM blocked nuclear p65 localization in cells damaged with CPT or TPT (Figure 1D and Extended Data Figures 1G–I). Thus, our data corroborates previous studies that have identified ATM as a critical factor promoting NF-κB activation in response to DSBs23,24,27–31.
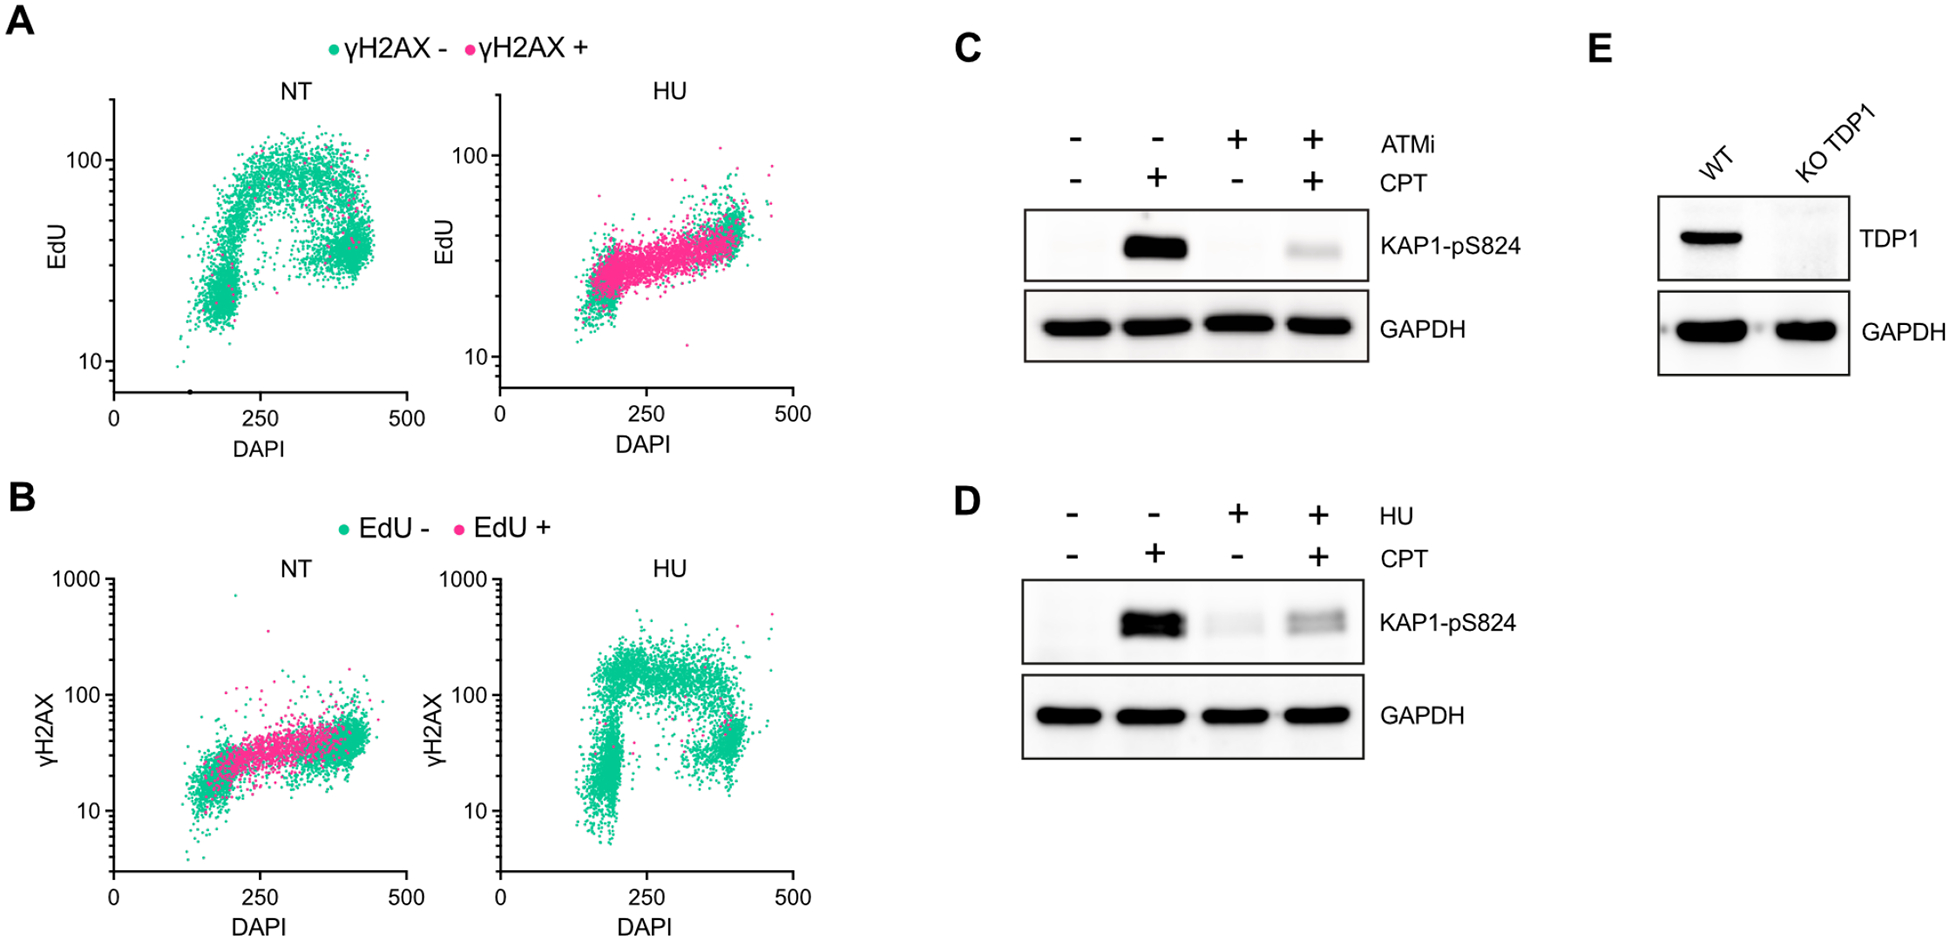
To further investigate the mechanism by which CPT stimulates p65 specifically in S-phase, we blocked ongoing DNA replication to prevent fork collapse and DSB formation by treating cells with Hydroxyurea (HU) before adding TOP1 inhibitor (Extended Data Figures 2A–B). HU treatment suppressed CPT-induced p65 activation in S-phase as well as ATM activation monitored as evidenced by a decrease in phosphorylation levels of ATM target KAP1 (Figure 1E and Extended Data Figures 2C–D). Thus, these results demonstrate that the conversion of SSBs to DSBs during DNA replication is required to promote ATM-mediated p65 nuclear localization after TOP1 inhibition. We then blocked BER repair by knocking out TDP1 (Extended Data Figure 2E), which is essential for removing trapped TOP1cc from DNA and enabling SSBs to be accessed and repaired by BER factors35,36. In the absence of active BER, unresolved TOP1cc and SSBs are subsequently subjected to further processing by other enzymes such as MUS81 and the proteasome, resulting in the formation of replication-independent DSBs40. Consistent with this model, γH2AX signal increased in G1/G2- and S-phases after CPT treatment in TDP1 KO cells (Figure 1F). In the absence of TDP1, cells now exhibited a significant enhancement in p65 nuclear localization across all phases of the cell cycle, not just in S-phase, which still depends on ATM (Figure 1F). In addition, blocking ongoing replication with HU treatment in TDP1 knockout cells now failed to suppress p65 activation (Figure 1G), which is in contrast to wild-type cells that require the collapse of the replication forks to trigger p65 nuclear localization after CPT treatment (Figure 1E). Thus, the association between NF-κB activation by ATM and cell cycle phases is dictated by the specific context of DSB formation resulting from TOP1 inhibition rather than by a direct regulation of the cell cycle signaling or the DNA replication machinery.
ATM-dependent and independent activation of NF-κB after DNA damage
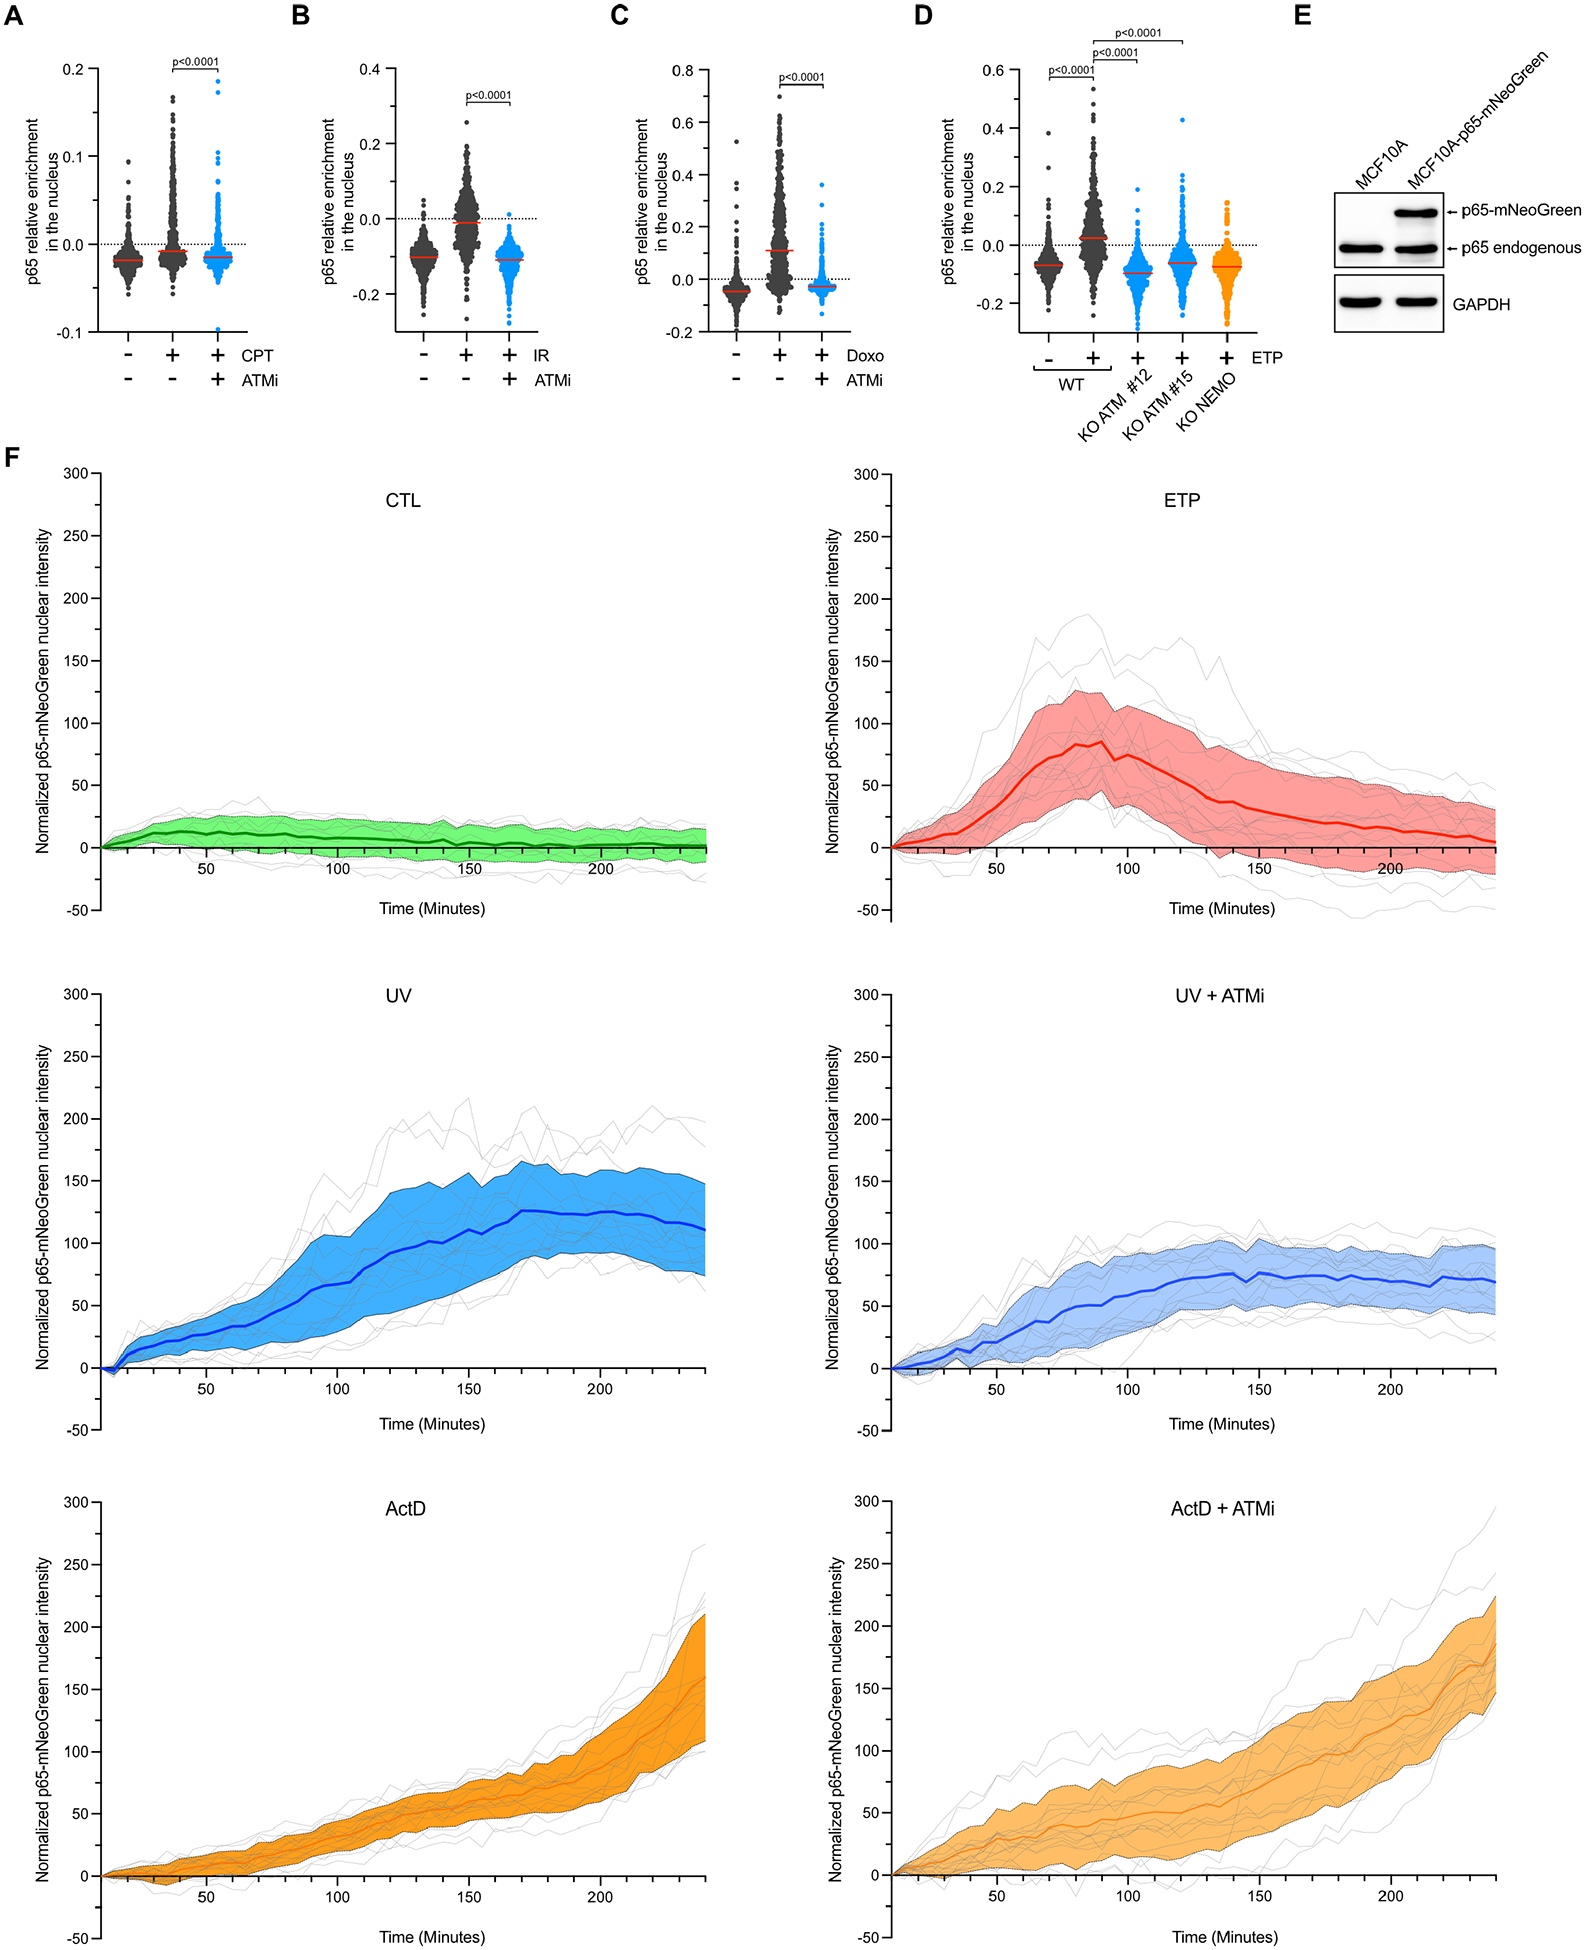
Now that we have established QIBC as a powerful method to assess NF-κB regulation at different cell cycle stages in response to TOP1 inhibition, we asked which other types of DNA lesions rapidly promote NF-κB’s nuclear localization. We treated cells with various DNA damaging agents and measured the difference between nuclear and cytoplasmic intensity of p65 staining within 4 hours post-treatment. Importantly, we carefully selected drug concentrations or irradiation conditions that do not induce any cell death during this time frame (Extended Data Figures 3A–B). As previously reported, DSB formation caused by Irradiation (IR) or topoisomerase II inhibitors (Etoposide [ETP] and Doxorubicin [Doxo]) promotes a rapid localization of p65 in the nucleus in an ATM-dependent manner (Figures 2A–B and Extended Data Figures 3C, 4A–C). In contrast, treatments that caused DNA modifications (Methyl methanesulfonate [MMS] and Hydrogen peroxide [H2O2]), DNA crosslinks (Mitomycin C and Oxaliplatin), replication stress (ATR and PARP inhibitors), or stalled replication forks (Hydroxyurea, Aphidicolin, and 5-fluorouracil) did not induce any p65 nuclear localization during this time frame (Extended Data Figure 3C). However, we found that treatments with DNA intercalating agent Actinomycin D (ActD) and ultraviolet (UV) radiation, both of which generate distinct types of DNA lesions but share the common effect of inhibiting ongoing transcription41,42, also strongly activated p65 (Figures 2A–B and Extended Data Figure 3C). Surprisingly, in contrast to ETP, p65 nuclear localization following both UV or ActD treatments was resistant to ATM inhibition (Figures 2A–B). These results were further confirmed in ATM knockout cell lines (Figures 2C–D and Extended Data Figure 4D). Next, we performed live cell imaging by stably expressing p65 fused to mNeoGreen in MCF10A cells (Extended Data Figure 4E). Similar to the results obtained with QIBC, ETP transiently induced p65-mNeoGreen nuclear localization between 1 to 2 hours of treatment, while UV and ActD stimulated gradual p65-mNeoGreen nuclear localization within 4 hours post-treatment in an ATM-independent manner (Extended Data Figures 3C and 4F and Supplementary Videos 1–2). Thus, we propose that cells can initiate an acute activation of NF-κB after DNA damage through an ATM-dependent or an ATM-independent pathway depending on the type of DNA lesions.
Figure 2: Two distinct classes of DNA lesions promote nuclear p65.
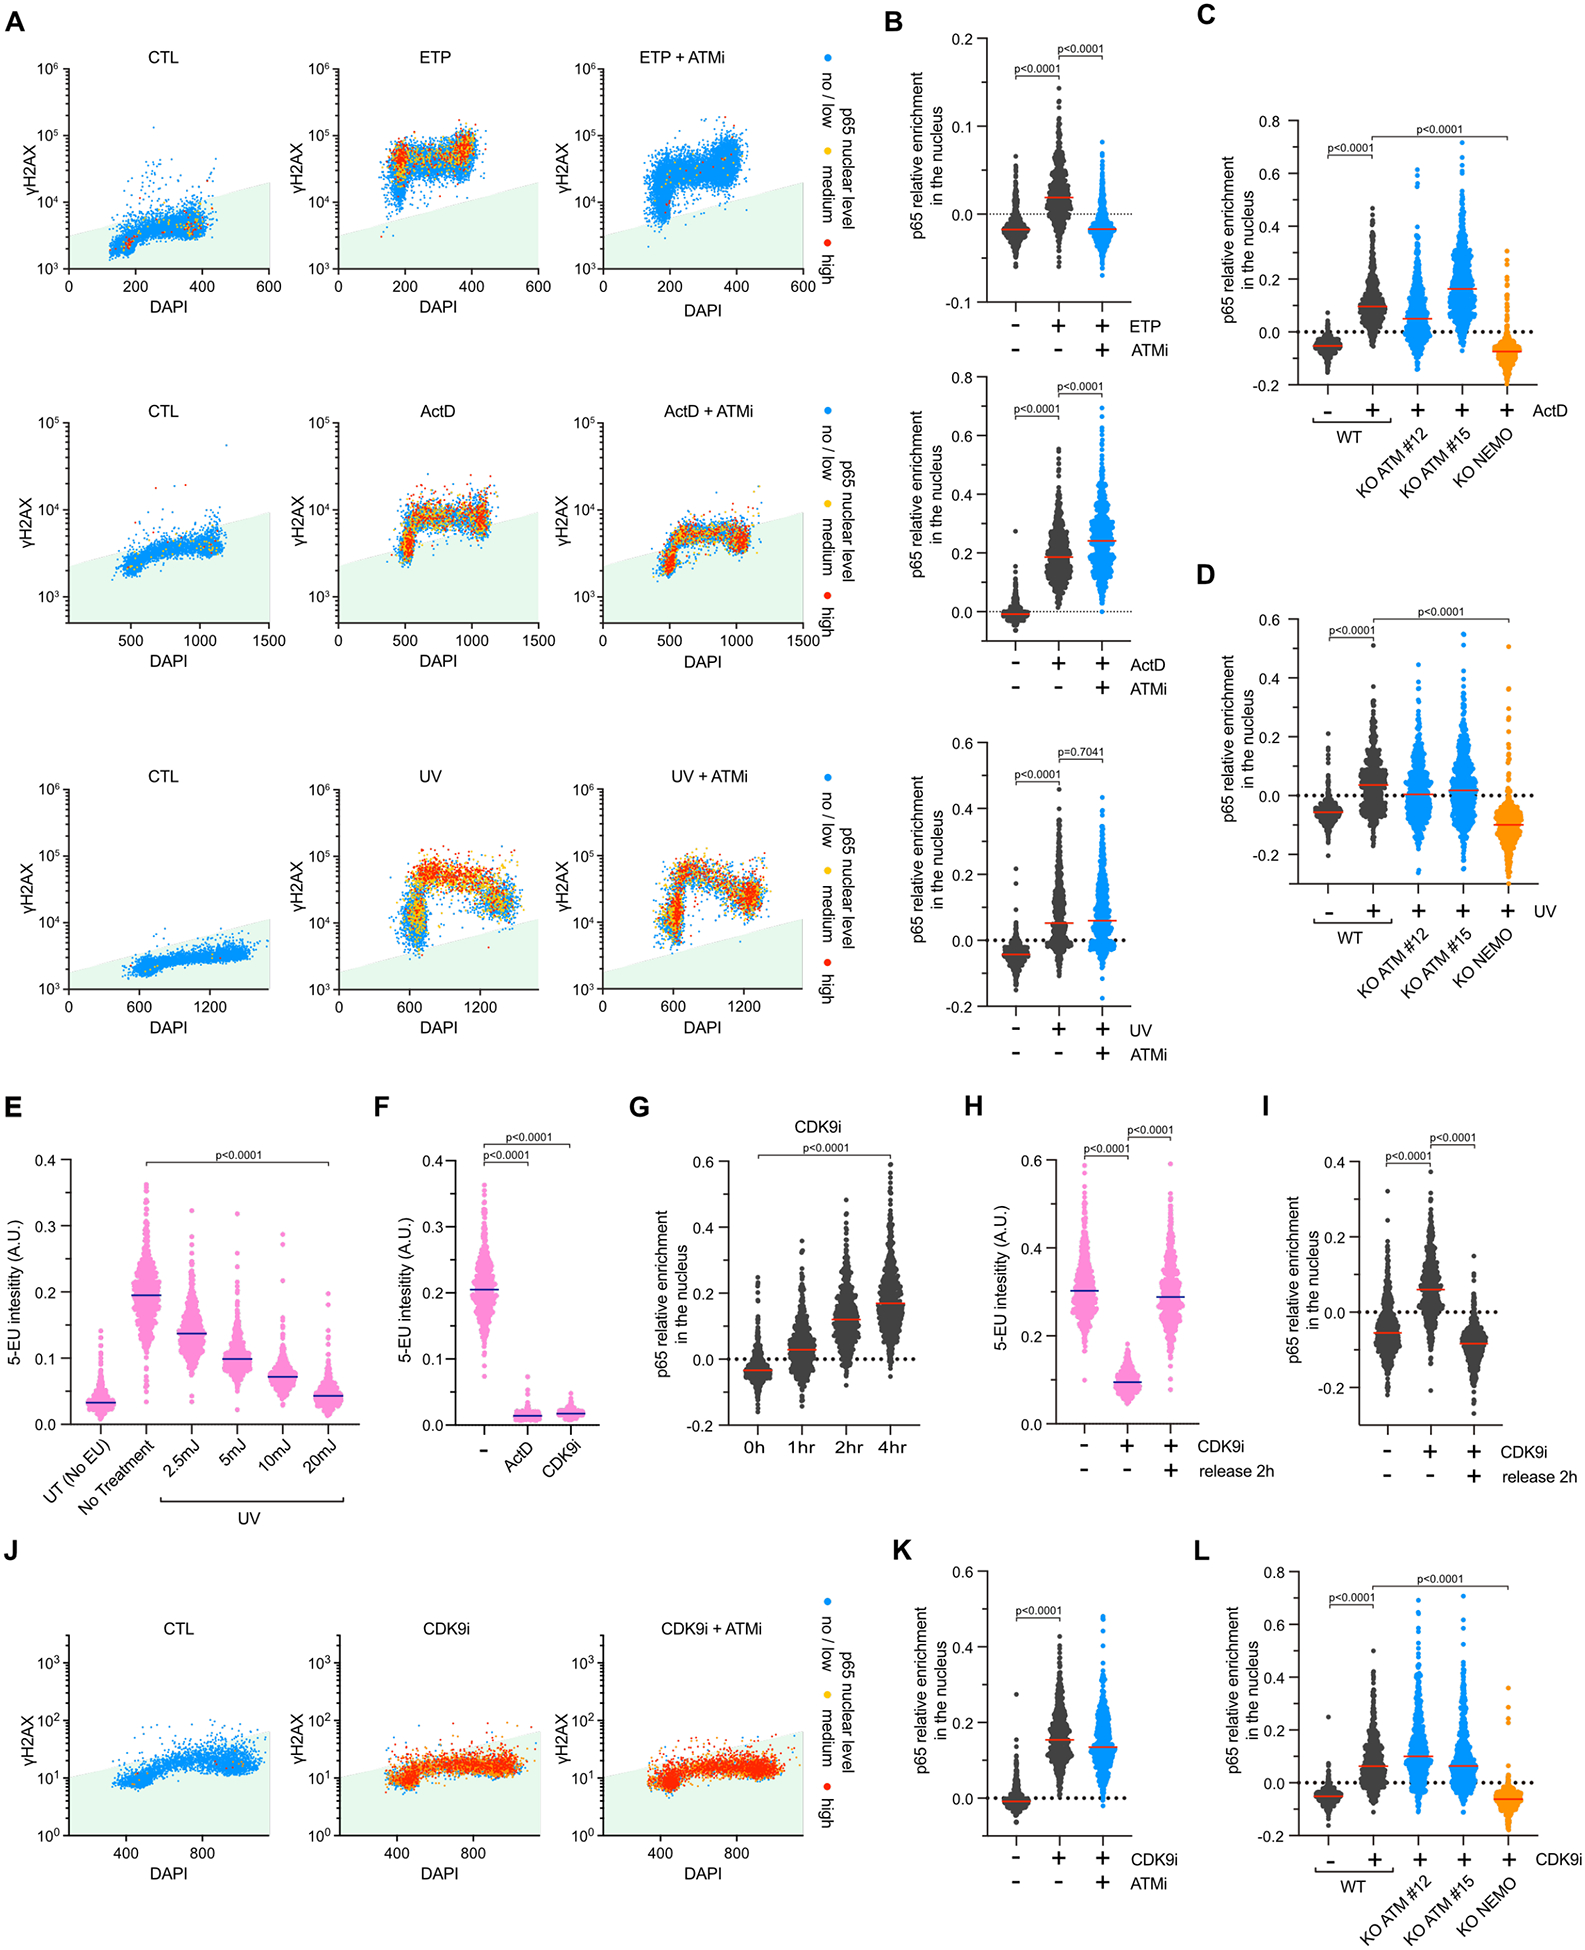
A. Quantification of p65 nuclear levels, γH2AX intensity, and DNA contents of 5,000 MCF10A cells treated with ETP (25 μM; 2 h), ActD (5 μM; 4 h), or UV (20 mJ/cm2; 4 h) in the presence or absence of ATMi (10 μM). B. Levels of nuclear p65 intensify relative to cytoplasmic p65 intensity were measured by immunofluorescence following indicated treatments. Red lines indicate the mean. (Number of cells, n=550). C-D. Quantification of p65 nuclear relative intensity in MCF10A WT, ATM KO, or NEMO KO cells treated with ActD (5 μM) (C) or UV (10 mJ/cm2) (D) for 4 h. Red lines indicate the mean. (Number of cells, n=550). E-F. MCF10A cells were treated with UV (E), ActD (5 μM) or CDK9i (6 μM) (F) for 4 h. RNA synthesis was analyzed by visualizing incorporated 5-EU. Blue lines indicate the mean. (Number of cells, n=550). G. p65 nuclear relative intensity was quantified by immunofluorescence in MCF10A cells treated with CDK9i (6 μM) and analyzed at the indicated time. Red lines indicate the mean. (Number of cells, n=550). H-I. MCF10A WT cells were treated with CDK9i (6 μM; 4 h), then washed and released in fresh media for 2 h. The levels of 5-EU incorporation (H) and relative nuclear p65 intensity (I) were analyzed by microscopy. Blue or red lines indicate the mean. (Number of cells, n=550). J. QIBC of MCF10A cells stained for p65 and γH2AX. Cells were treated with 6 μM of CDK9i for 4h in the presence or absence of ATMi (10 μM). (Number of cells, n=5000). K. Quantification of p65 nuclear relative intensity in MCF10A cells treated with CDK9i (6 μM; 4 h) ± ATMi (10 μM). Red lines indicate the mean. (Number of cells, n=550). L. The levels of nuclear p65 were analyzed in MCF10A WT, ATM KO, or NEMO KO cell lines treated with 6 μM of CDK9i for 4h. Red lines indicate the mean. (Number of cells, n=550).
Transcriptional stress induces NF-κB activation
DNA lesions caused by both ActD and UV treatment have a significant impact on ongoing transcription, as shown by the reduction in the incorporation of 5-ethynyl uridine (5-EU) in newly synthesized RNAs (Figures 2E–F). We hypothesized that transcriptional stresses induced by certain types of DNA lesions could activate the NF-κB pathway through a mechanism that did not involve ATM. To validate this model, we directly inhibited transcription by treating cells with a CDK9 inhibitor (CDK9i) or a CDK7 inhibitor (CDK7i) to suppress the elongation of RNA polymerase II, or Triptolide (TPL) to induce the degradation of RNA polymerase II43–45 (Figure 2F and Extended Data Figures 5A–D). Remarkably, CDK9i, CDK7i, and TPL triggered nuclear localization of p65 within 4 hours of treatment similar to UV or ActD (Figure 2G and Extended Data Figures 5E–F). Moreover, cells treated with CDK9i and then released to a drug-free media quickly restarted transcription and restored cytoplasmic localization of p65 (Figures 3H–I), suggesting that the activation of p65 mediated by transcriptional stress is transient and can be rapidly turned off upon the restoration of transcription. Additionally, p65 activation after CDK9i or CDK7i occurred in all phases of the cell cycle and without any induction of DNA damage, as confirmed by the absence of γH2AX signal (Figure 2J and Extended Data Figure 5G). Thus, transcription inhibition alone was sufficient to activate NF-κB without the requirement of any DNA damage signaling events. Consistent with this model, p65 activation after treatment with transcription inhibitors (CDK9i, CDK7i, or TPL) was not altered by the absence of ATM but remained dependent on NEMO (Figures 2K–L and Extended Data Figures 5H–I). Taken together, these results revealed that transcriptional blockade is a new type of stress that triggers NF-κB activation in cells.
Figure 3: ATM-dependent and independent activation of p65 after TOP1 inhibition.

A-B. MCF10A cells were treated with the indicated concentration of CPT for 2 h. The levels of 5-EU incorporation (A) and relative nuclear p65 intensity (B) were analyzed by microscopy. Blue and red lines indicate the mean. (Number of cells, n=550). C-D. MCF10A cells were treated with CPT (20 μM) for 2 h then washed and released in fresh media for 4h. The levels of 5-EU incorporation (C) and relative nuclear p65 intensity (D) were analyzed by microscopy. Blue or red lines indicate the mean. (Number of cells, n=550). E. QIBC of MCF10A cells stained for p65 and γH2AX. Cells were treated with CPT (0.5 μM) or CPT high (20 μM) for 2 h in the presence or absence of ATMi (10 μM). (Number of cells, n=5000). F. The relative levels of nuclear p65 were analyzed in MCF10A WT treated with CPT (20 μM) for 2 h ± ATMi (10 μM). Red lines indicate the mean. (Number of cells, n=550). G. Quantification of relative p65 nuclear levels in MCF10A WT, ATM KO, or NEMO KO cell lines treated with CPT (20 μM) for 4 h. Red lines indicate the mean. (Number of cells, n=550). H-I. MCF10A cells were treated with 0.5 μM (H) or 20 μM (I) CPT for 2 h in the presence or absence of ATMi (10 μM). The relative levels of nuclear p65 intensity were analyzed in the designated cell cycle phases. Red lines indicate the mean. (Number of cells, n=550). J. QIBC of MCF10A cells stained for p65 and γH2AX. Cells were treated with CPT (0.5 μM) or CPT high (20 μM) for 2 h in the presence or absence of HU (2 mM). (Number of cells, n=5000).
To further investigate the interplay between DNA damage-induced NF-κB and transcription inhibition, we subjected cells to a gradually increasing concentration of CPT. As the concentration of CPT increased, TOP1 trapped on DNA started to impede transcription9,41,46, as indicated by the reduction of 5-EU incorporation in newly formed RNAs (Figure 3A). This decrease in transcription correlated with a gradual increase in nuclear p65 localization (Figure 3B). Similar to CDK9i treatment, cells that had been exposed to a high concentration of CPT and released to a drug-free media quickly resumed transcription and restored cytoplasmic p65 localization (Figures 3C–D). Moreover, the nuclear localization of p65 in response to a high concentration of CPT occurred throughout the cell cycle and was no longer restricted to S-phase (Figure 3E). Notably, these cells positive for p65 displayed resistance to ATM inhibition (Figures 3E–G). Although p65 activation was not impacted by the absence of ATM in cells in G1 and G2-phases following treatment with high concentration of CPT, the level of nuclear p65 localization in S-phase was still partially reduced suggesting that both ATM-dependent and independent pathways were activated simultaneously in these replicating cells. This was in contrast to cells treated with a low concentration of CPT, where ATM inhibition completely abolished p65 activation in cells in S-phase and no significant activation of p65 was detected in cells in G1 or G2 phases (Figures 3H–I). Consistently, cells pre-treated with HU to suppress TOP1-mediated fork collapse and ATM activation recapitulated the results monitored after ATMi (Figure 3J). Collectively, these results demonstrate that DNA damage caused by TOP1 inhibition activates NF-κB through two distinct pathways – an ATM-dependent pathway triggered by the formation of DSBs in S-phase and an ATM-independent pathway induced by trapped TOP1-mediated transcription blockage that occurs throughout the cell population regardless of cell cycle phase.
TRAF6 is at the crossroads of ATM-dependent and independent pathways.
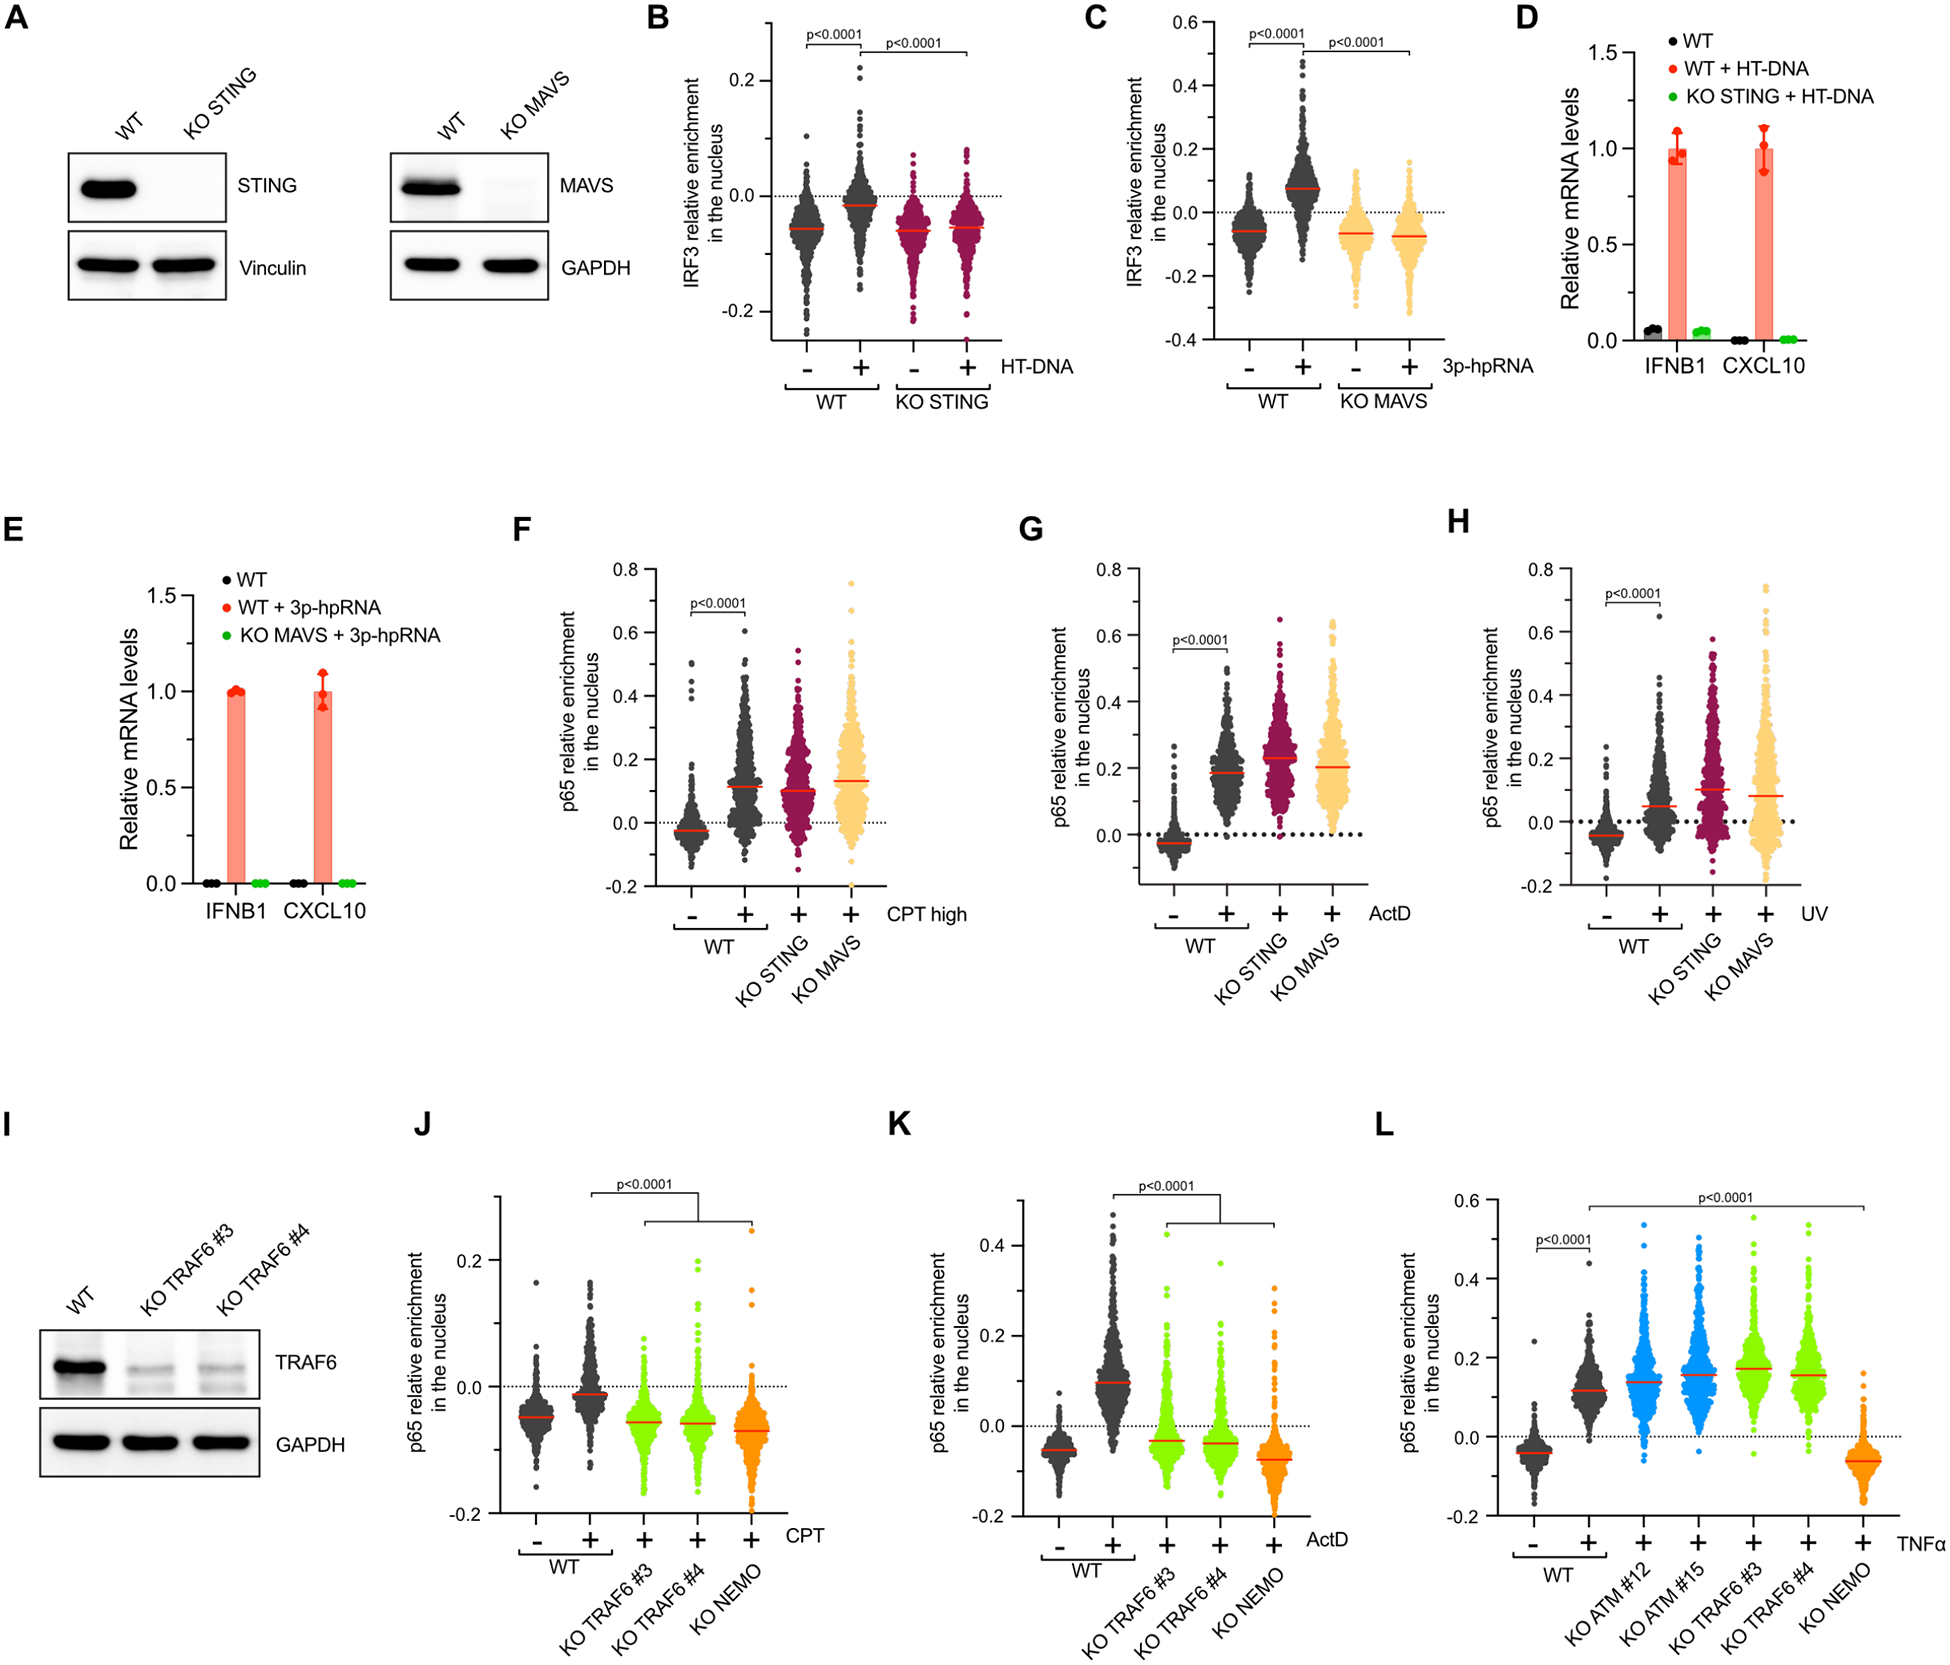
To determine how DNA lesions causing transcription arrest promote the NF-κB pathway independently of ATM, we first knocked out STING or MAVS, both known to stimulate p65 after DNA damage5,47. We validated STING or MAVS KO cells by transfecting cells with HT-DNA or 3p-hpRNA, respectively26,48. As expected in the absence of STING or MAVS, cells failed to promote IRF3 nuclear localization and mRNA expression of IFNB1 and CXCL10 (Extended Data Figures 6A–E). However, neither the lack of STING nor MAVS affected p65 nuclear localization following cell treatment with UV, ActD, or high doses of CPT (Extended Data Figures 6F–H), demonstrating that neither STING of MAVS were required for ATM-independent NF-κB activation after transcriptional stress. ATM binds and phosphorylates TRAF6 to promote the activation of the IKK complex through the recruitment of TAB2/3 and TAK123,49. However, TRAF6 is also at the crossroads of many other innate immune response signaling pathways50. Thus, we asked whether TRAF6 is required for p65 activation regardless of the type of DNA lesions. We found that the absence of TRAF6 not only suppressed p65 nuclear recruitment mediated by the ATM-dependent response (cells treated with ETP or low dose of CPT), but also inhibited p65 activation in the ATM-independent pathway induced by transcription inhibition (UV, ActD, high dose of CPT, or CDK9i) (Figures 4A–D and Extended Data Figures 6I–K). As a specificity control, we showed that TRAF6 KO cells, but not NEMO KO cells, induce p65 activation upon TNFα treatment (Extended Data Figure 6L), a known inducer of the IKK complex through the stimulation of TRAF2, instead of TRAF649. Together, these results demonstrate that TRAF6 resides at the intersection between ATM-dependent and ATM-independent pathways triggered by DSBs and transcriptional stress respectively.
Figure 4: TRAF6, IRAK1, and Myd88 promote p65 nuclear localization mediated by DNA lesions blocking transcription.

A-D. The relative levels of nuclear p65 intensity were analyzed in MCF10A WT, TRAF6 KO, or NEMO KO cell lines treated with ETP (25 μM; 2 h) (A), UV (10 mJ/cm2; 4 h) (B), CPT (20 μM; 4 h) (C), and CDK9i (6 μM; 4 h) (D). Red lines indicate the mean. (Number of cells, n=550). E. MCF10A WT or IRAK1 KO cells were treated with DMSO or CDK9i (6 μM) for 4h, and the relative levels of nuclear p65 were analyzed. Red lines indicate the mean. (Number of cells, n=550). F. The relative levels of nuclear p65 were analyzed in MCF10A transfected with siRNA against IRAK1 or Myd88 and subsequently treated with CDK9i (6 μM) for 4 h. Red lines indicate the mean. (Number of cells, n=550). G-H. QIBC of MCF10A cells stained for p65, γH2AX, and DAPI. MCF10A WT or IRAK1 KO cells were treated with CPT (10 μM) (G) or UV (10 mJ/cm2) (H) ± ATMi (10 μM) for 4 h. (Number of cells, n=5000). I. MCF10A cells knockdown for the indicated targets were treated with CPT (10 μM) for 4 h in the presence or absence ATMi (10 μM). Relative p65 nuclear levels, γH2AX intensity, and DNA contents of 5,000 MCF10A cells were monitored by QIBC. J. The relative levels of nuclear p65 were analyzed in MCF10A WT or IRAK1 KO cells treated with ActD (5 μM) ± ATMi (10 μM) for 4h. Red lines indicate the mean. (Number of cells, n=550).
IRAK1 kinase promotes NF-κB after DNA damage-induced transcription blockage.
We next asked how TRAF6 was activated in an ATM-independent manner after transcription blockage. Besides ATM, both IRAK1 and RIP1 kinases are known to trigger TRAF6 following various types of stresses49,51. Following CDK9i treatment to activate NF-κB independently of ATM (Extended Data Figure 7A), we found that p65 nuclear localization was suppressed in the absence of IRAK1 but not RIP1 (Figure 4E and Extended Data Figures 7B–D). We further confirmed this result by knocking down Myd88 (Figure 4F and Extended Data Figure 7E), an upstream activator of IRAK149. We then examined whether IRAK1 and Myd88 also regulate p65 localization after DNA damage-induced transcription blockage. Remarkably, cells without IRAK1 or Myd88 failed to activate p65 in G1/G2 phases after UV or a high dose of CPT, while S-phase cells were still p65 positive (Figures 4G–I and Extended Data Figures 7F–G). However, ATM inhibition now abrogated S-phase p65 positive cells in both IRAK1 and Myd88 deficient cells after a high dose of CPT or UV treatment (Figures 4G–I and Extended Data Figures 7F–G), further demonstrating that both ATM and the IRAK1-Myd88 complex promote p65 nuclear localization in replicating cells. In contrast, p65 nuclear localization remained unaffected by the absence of IRAK1 or Myd88 following treatment with ETP (Extended Data Figures 7H–I), validating that neither IRAK1 nor Myd88 were required in p65 activation by the ATM-dependent pathway. After ActD treatment, neither the absence of IRAK1, Myd88, nor ATM alone significantly impacted nuclear p65 localization regardless of the cell cycle phases. However, ATM inhibition completely restored p65 cytoplasmic levels in both IRAK1 KO cells and Myd88 knocked-down cells after ActD treatment (Figure 4J and Extended Data Figure 7J). Thus, ActD simultaneously activated both ATM and IRAK1 in all phases of the cell cycle and both pathways need to be abrogated to fully suppress NF-κB activation. Taken together, these results establish that depending on the type of DNA lesions and the cell cycle phase, NF-κB activation after DNA damage is mediated by either ATM, IRAK1, or both, through TRAF6 activation.
IL-1α signaling activates IRAK1 following transcriptional stress
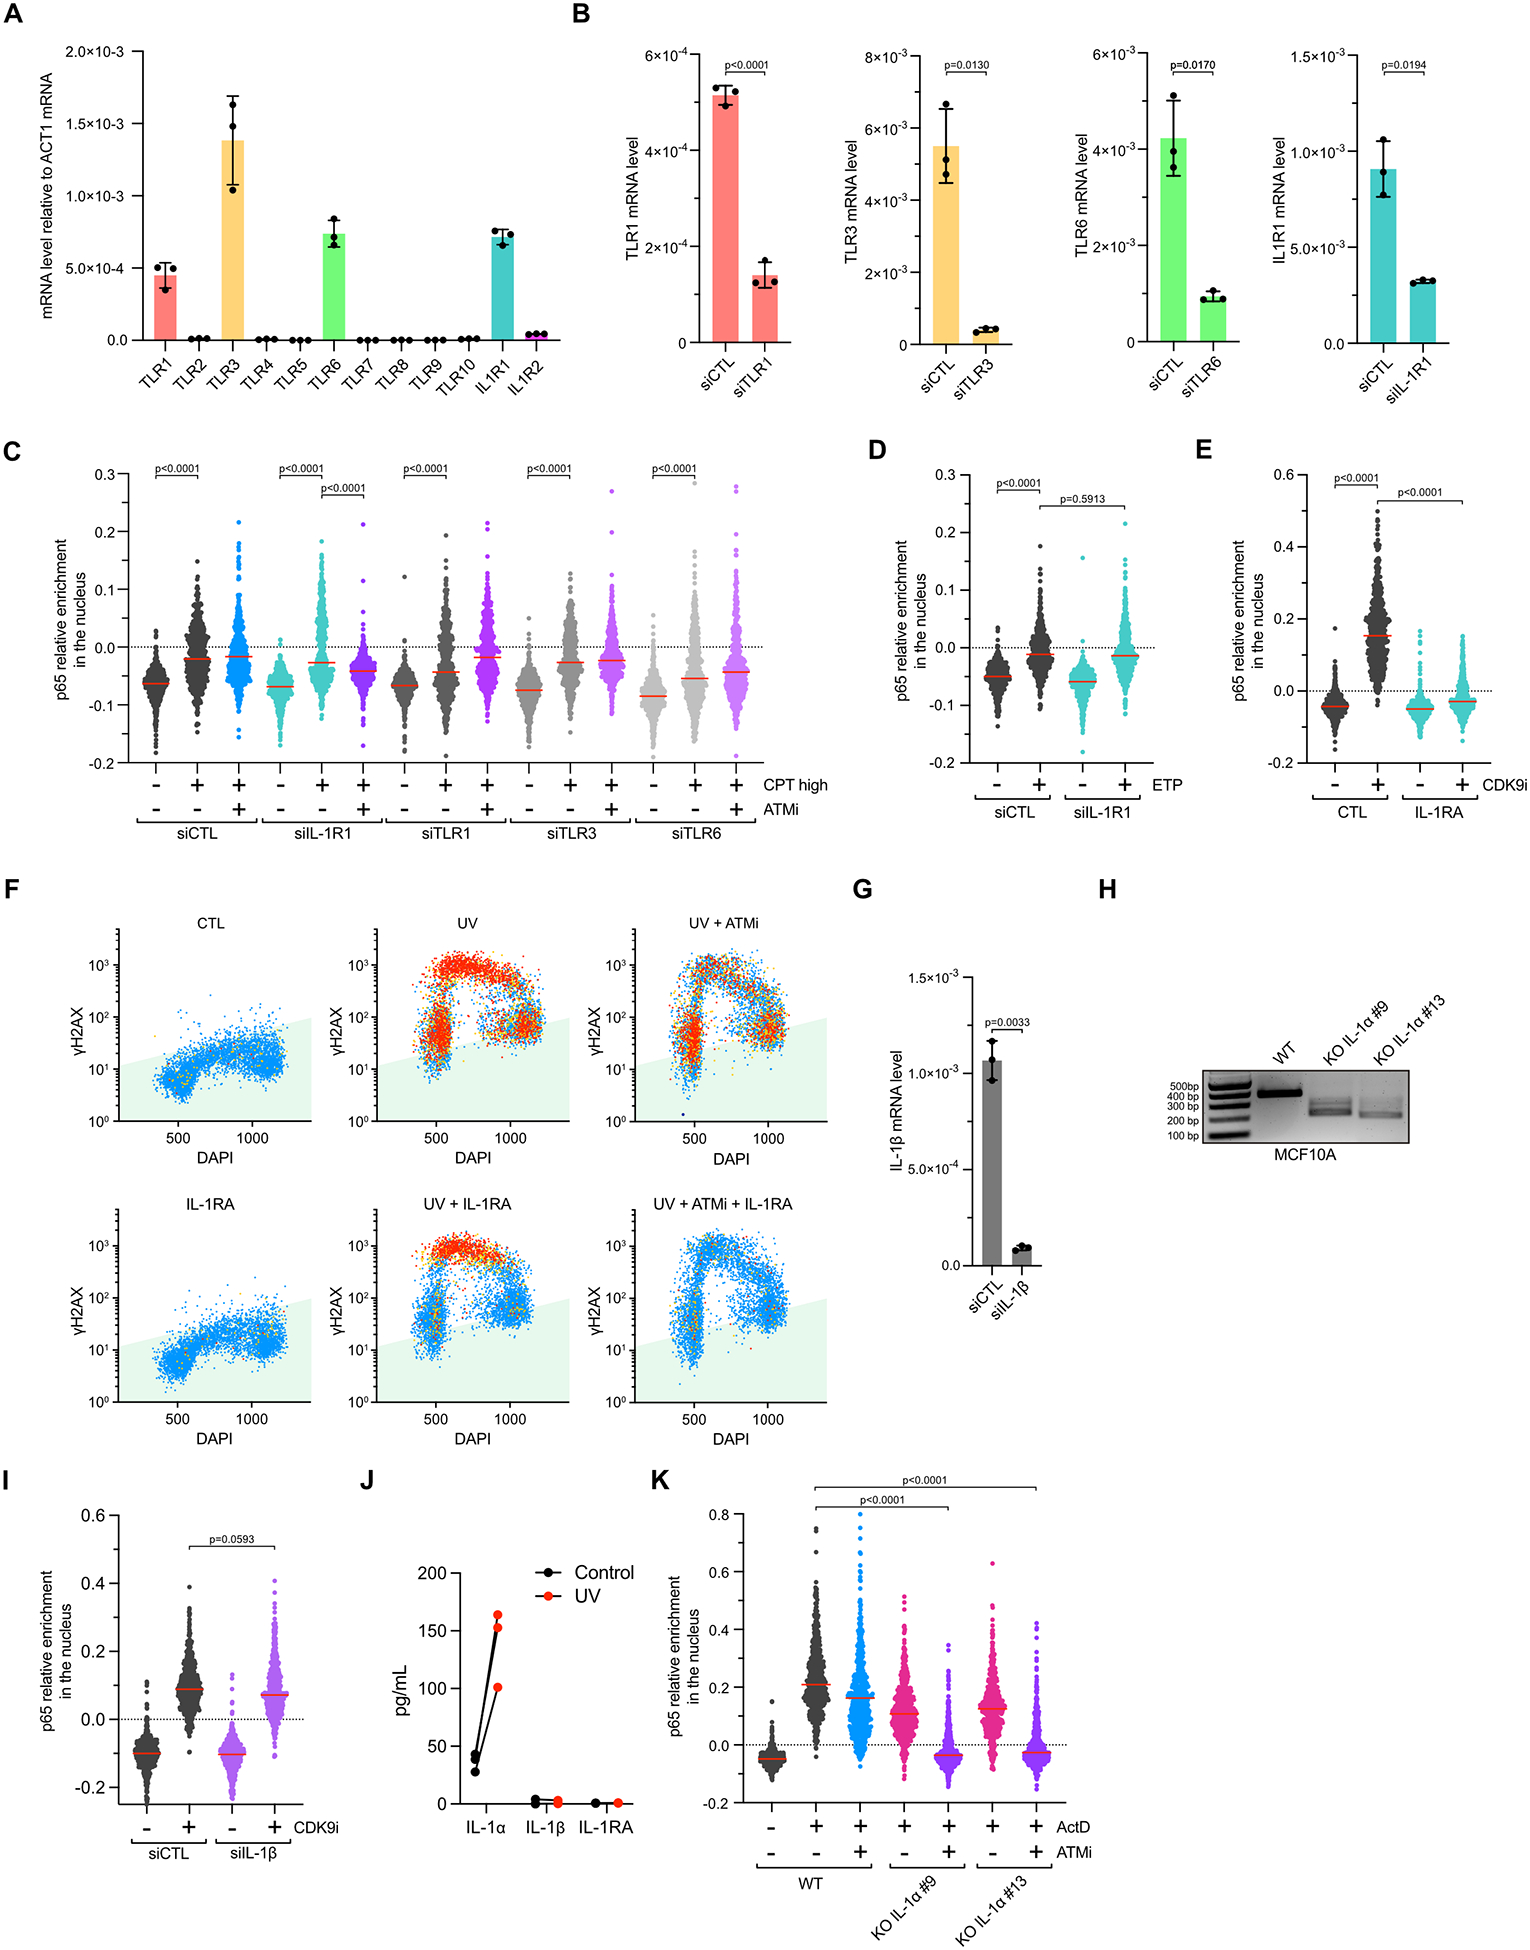
We next aimed to address how the Myd88-IRAK1 complex was activated after DNA damage-induced transcription arrest. Myd88 contains a TIR domain that interacts with many different transmembrane receptors52. To identify which transmembrane receptors promote Myd88-IRAK1 signaling, we knocked down TLR1, TRL3, TLR6, and IL-1R1 that were expressed in MCF10A cells (Extended Data Figures 8A–B). Depletion of TLR1, TRL3, and TLR6 did not impact p65 activation after high concentration of CPT+ATMi or CDK9i treatments, whereas knockdown of IL-1R1 (type 1 interleukin receptor) completely abolished p65 nuclear localization (Figure 5A and Extended Data Figure 8C). Similar to the result obtained in IRAK1 or Myd88 deficient cells after high concentration of CPT or after UV, knockdown of IL-1R1 receptor suppressed p65 activation in G1 and G2 cells but not in S-phase cells (Figures 5B–C). Again, p65 activation was completely abolished in replicating cells only when knocked down for IL-1R1 and treated with ATMi (Figures 5B–C). Consistently, inhibition of IL-1R1 with purified recombinant IL-1RA (Interleukin-1 Receptor Antagonist)53–55 recapitulated the results obtained after knockdown of IL-1R1 following CPT, UV, ActD, and CDK9i (Figures 5D–E, and Extended Data Figures 8E–F). Together, these results demonstrate that Myd88-IRAK1 signaling activating NF-κB after DNA damage-induced transcriptional stress is mediated through the transmembrane IL-1R1 receptor by an external signal.
Figure 5: IL-1α signaling-mediated IRAK1 activation stimulates p65 in response to transcriptional stresses.
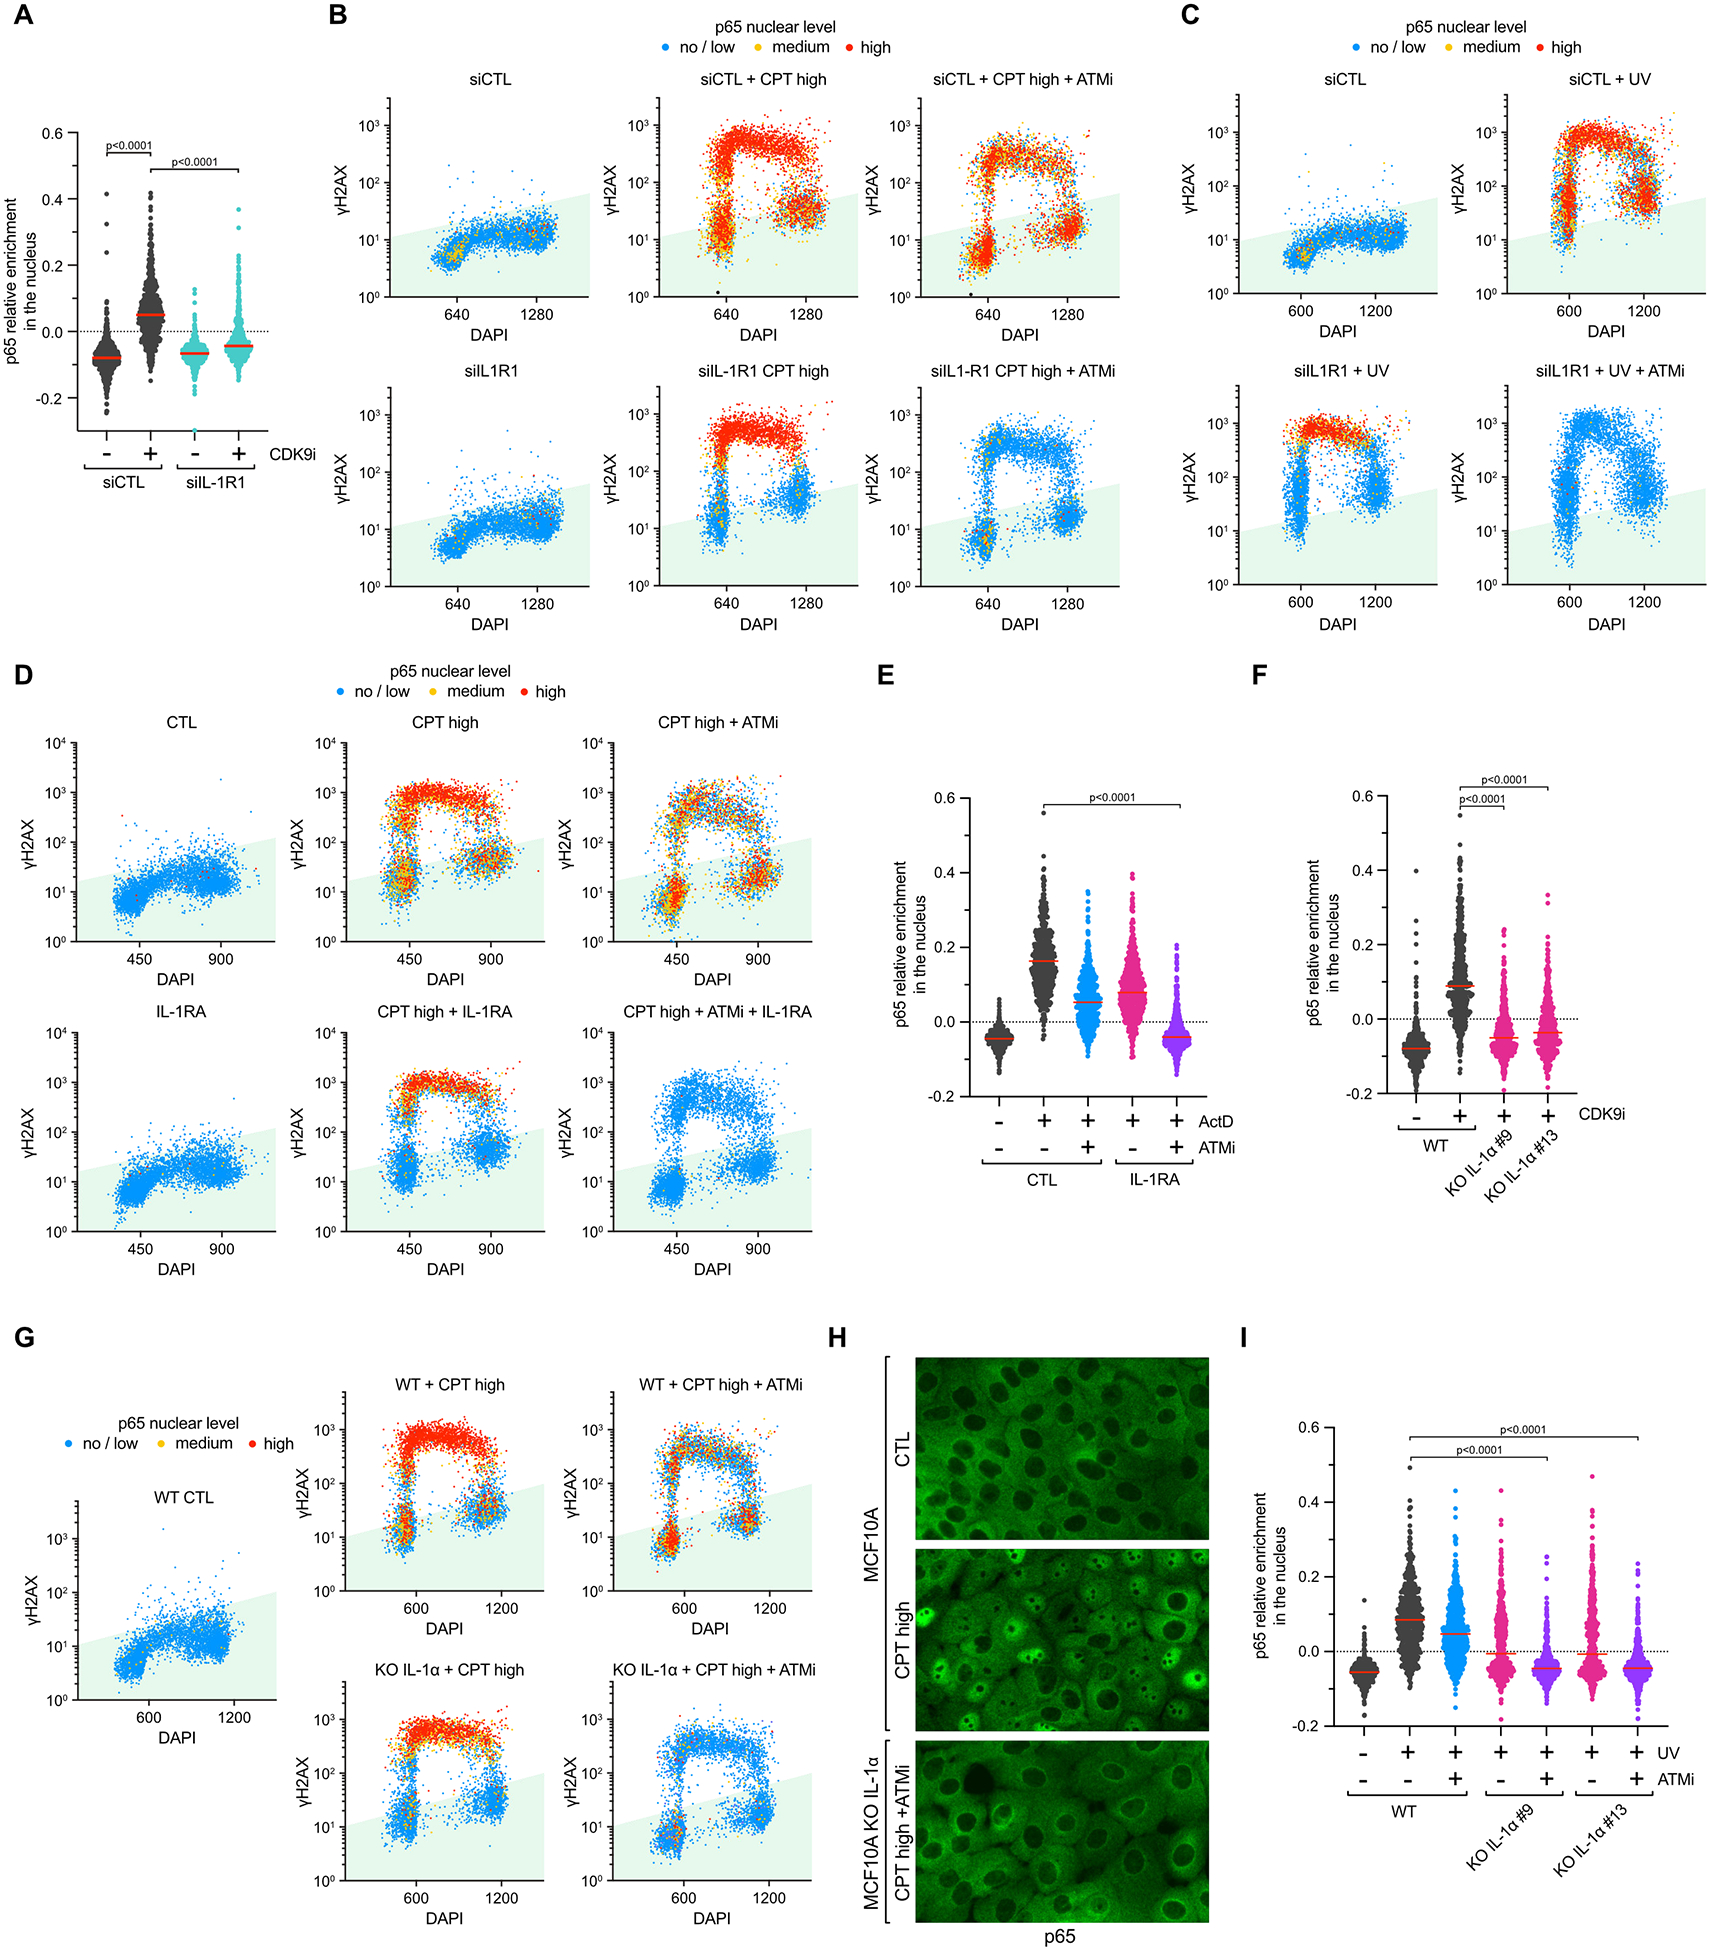
A. Relative levels of nuclear p65 intensity were analyzed in MCF10A transfected with siRNA targeting IL-1R1 and subsequently treated with CDK9i (6 μM) for 4 h. Red lines indicate the mean. (Number of cells, n=550). B-C. QIBC of MCF10A cells stained for p65, γH2AX, and DAPI. Cells knockdown for IL-1R1 were treated with CPT (10 μM; 2 h) (B) or UV (10 mJ/cm2; 4 h) (C) in the presence or in the absence of ATMi (10 μM). (Number of cells, n=5000). D. MCF10A cells were pretreated with IL-1RA (150 ng/mL) for 1h before and then treated with CPT (10 μM) or CPT+ATMi for 4 h. Relative p65 nuclear levels, γH2AX intensity, and DNA contents of 5,000 MCF10A cells were monitored by QIBC. E. The relative nuclear levels of p65 were analyzed in MCF10A cells treated ActD (5 μM; 4 h) in the presence or absence of IL-1RA (150 ng/mL) and/or ATMi (10 μM). Red lines indicate the mean. (Number of cells, n=550). F. Quantification of p65 nuclear levels in MCF10A WT or IL-1α KO cells treated with CDK9i (6 μM) for 4 h. Red lines indicate the mean. (Number of cells, n=550). G. Quantification by QIBC of p65, γH2AX, and DAPI staining in MCF10A WT or IL-1α KO cells treated with CPT (10 μM) or CPT+ATMi for 2 h. (Number of cells, n=5000). H. Representative immunofluorescence pictures of MCF10A WT or IL-1α KO cells treated as indicated in (G). I. The relative levels of nuclear p65 were analyzed in MCF10A WT or IL-1α KO cells treated with UV (10 mJ/cm2) for 4 h in the presence or absence of ATMi (10 μM). Red lines indicate the mean. (Number of cells, n=550).
We then sought to identify which extracellular signal(s) were responsible for IL-1R1 activation after transcription blockage. Interleukin 1α (IL-1α) and Interleukin 1β (IL-1β) are both key activating cytokines of IL-1R1 that are secreted by cells in response to different types of stresses56. We found that IL-1α KO cells failed to promote p65 nuclear localization after CDK9i treatment, whereas the absence of IL-1β did not have any impact (Figure 5F and Extended Data Figures 8G–I). Furthermore, we detected by ELISA the secretion of IL-1α but not IL-1β in media from cells treated with UV (Extended Data Figure 8J), further supporting the role of IL-1α as an extracellular signal leading to IL-1R1 activation. Consistent with the results obtained after knockdown or knockout of IL-1R1, Myd88, and IRAK1, the absence of IL-1α led to the abolition of p65 activation in G1 and G2 cells treated with a high concentration of CPT or irradiated with UV (Figures 5G–I). Again, the complete suppression of p65 nuclear localization in S-phase cells following this treatment was observed only in IL-1α KO cells treated with ATMi (Figures 5G–I). Moreover, we also found that both IL-1α and ATM were required to promote p65 nuclear localization in cells damaged with ActD (Extended Data Figure 8K). Taken together, these results demonstrate that IL-1α is the critical factor stimulating the IL-1R1 receptor in response to transcriptional stress to activate the NF-κB pathway.
Differential activation of the NF-κB pathway in cancer cells
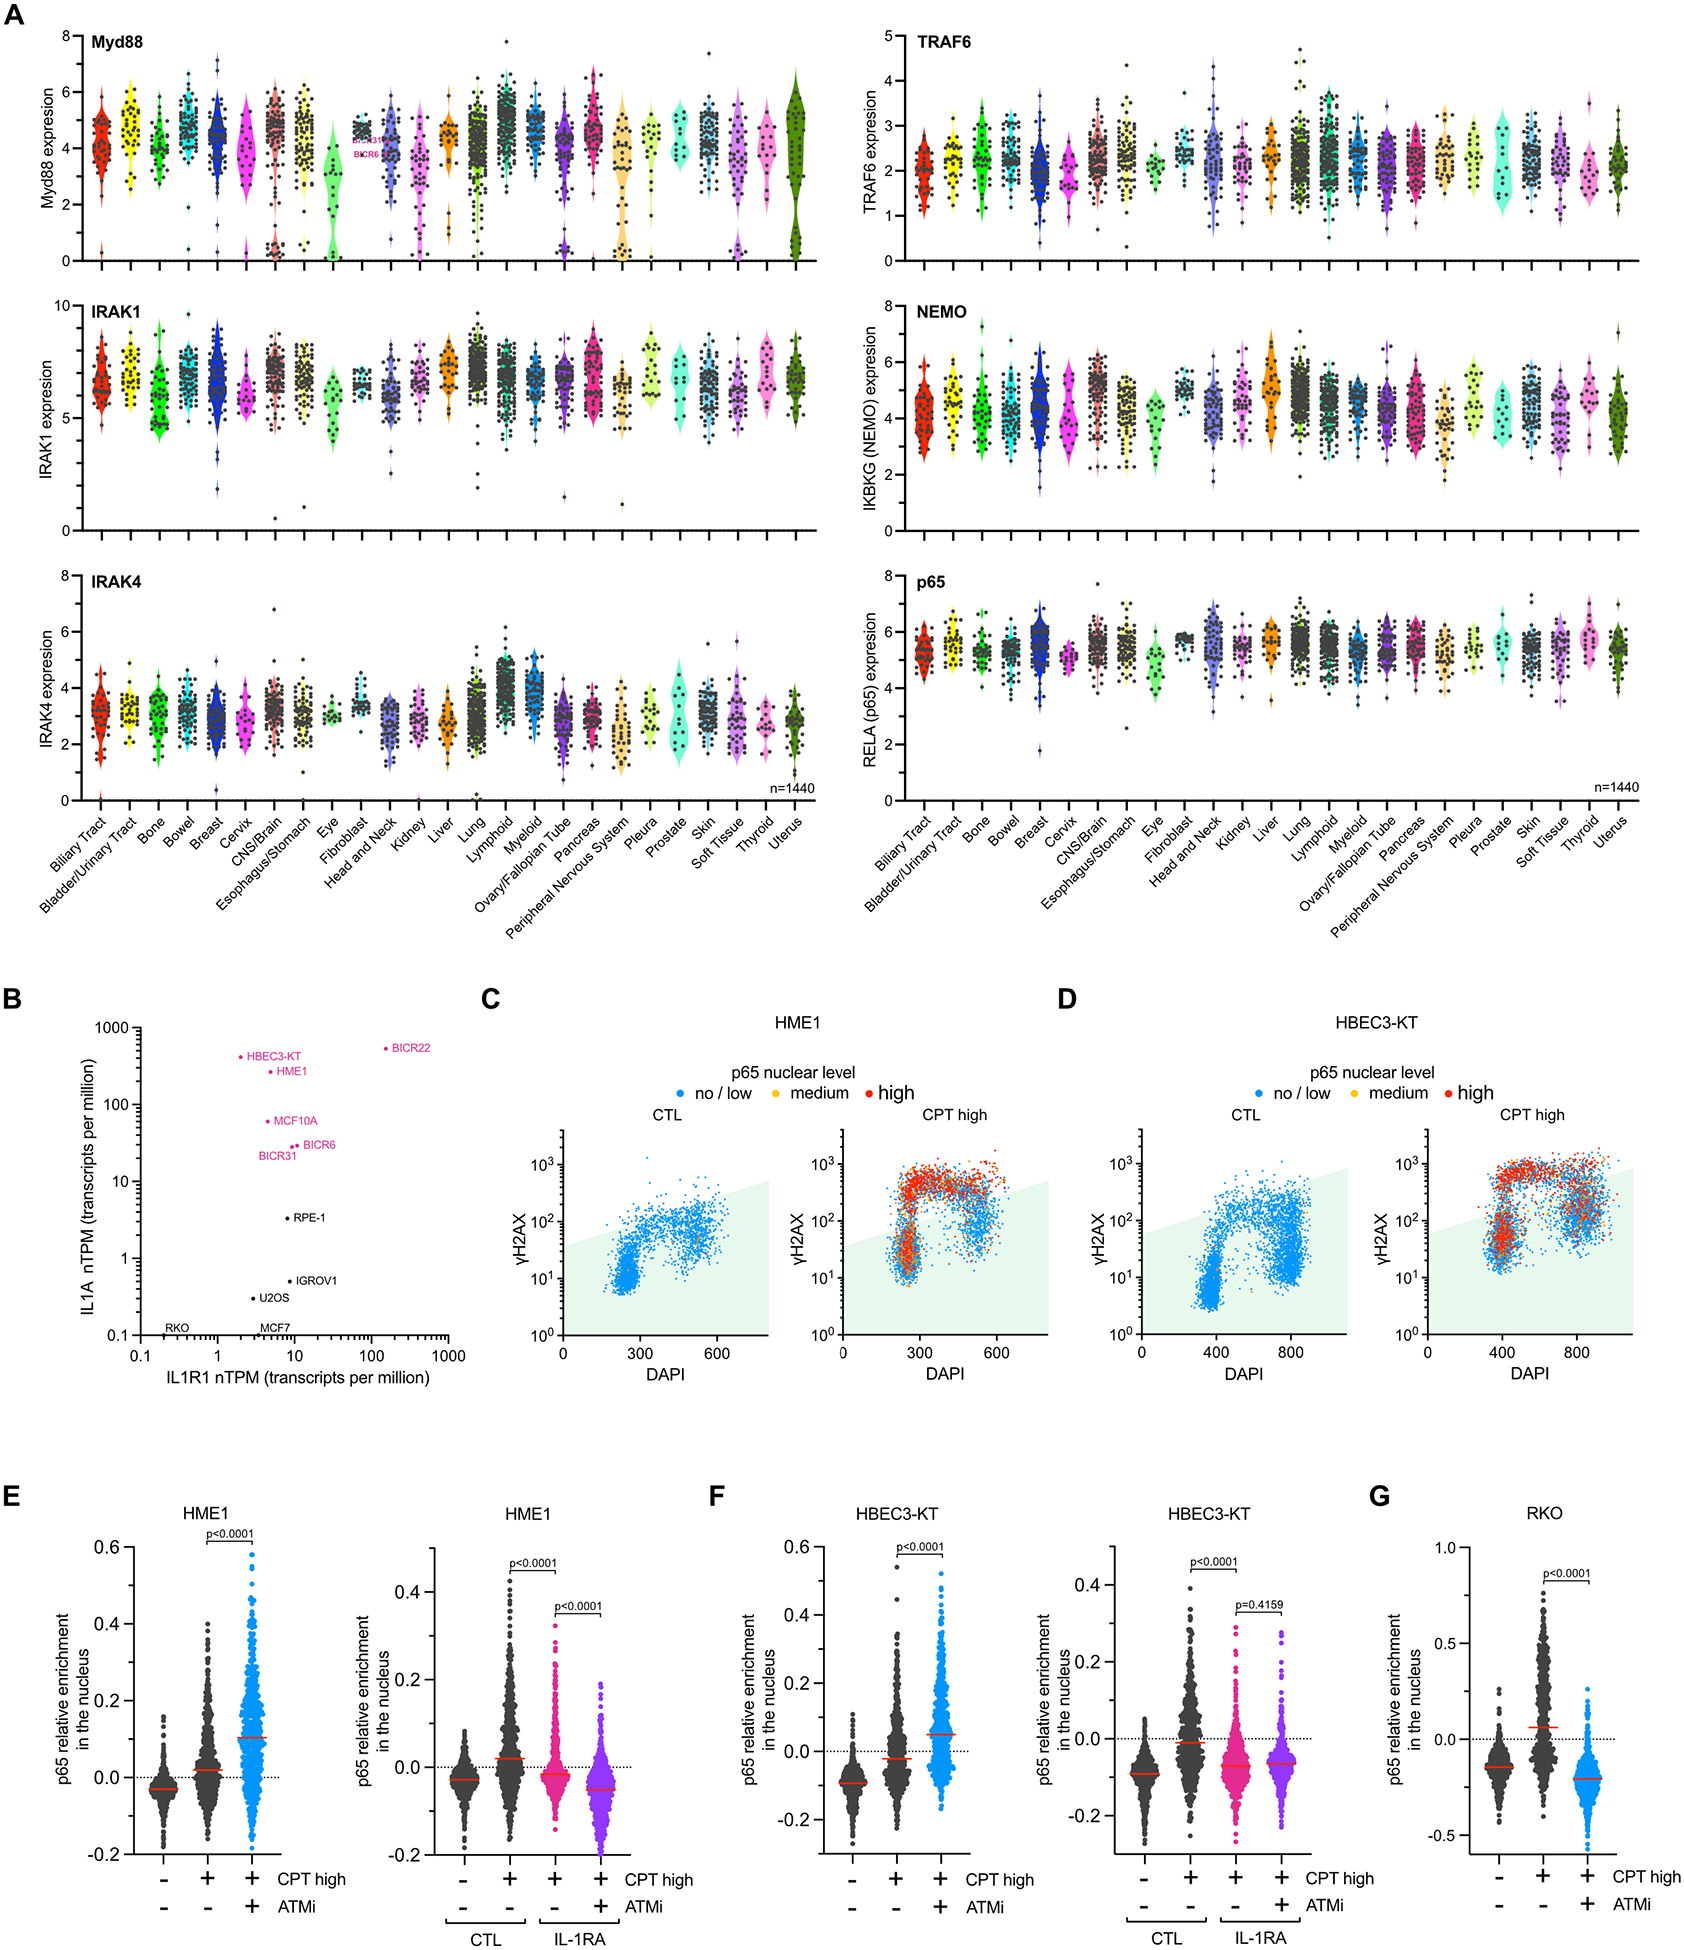
We then investigated whether IL-1α, IL-1R1, and IRAK1-mediated activation of the NF-κB pathway was conserved among cancer cell lines. We first analyzed the expression IL-1α and IL-1R1 in 1440 cell lines derived from different types of cancers. We found that both IL-1α and IL-1R1 were highly up and downregulated in many cancer cell lines, with Head & Neck and Bladder/Urinary tract tumor types showing the highest expression levels (Figure 6A). In contrast, other genes involved in the NF-κB pathway, such as Myd88, IRAK1, TRAF6, NEMO, or p65, showed little to no change in expression levels (Extended Data Figure 9A). This observation suggests that cancer cells might suppress transcriptional stress-induced inflammation by abrogating IL-1α or IL-1R1 expression. We then selected three untransformed immortalized cell lines (HME1, HBEC3-KT, and RPE-1) and seven cancer cell lines expressing different levels of IL-1α and/or IL-1R1 (Extended Data Figure 9B) and monitored p65 cellular localization following treatment that induced NF-κB through both ATM and IRAK1 (CPT high, UV, and ActD), ATM only (ETP), IRAK1 only (IL-1α), and neither ATM nor IRAK1 (TNFα) (Figure 6B and Extended Data Figures 9C–G and 10). All chosen cell lines showed a strong activation of p65 following TNFα treatment, demonstrating that all these cells have a functional NF-κB pathway (Figure 6B). Notably, primary and cancer cell lines expressing both IL-1α and IL-1R1 promote p65 activation in an ATM-independent but IL-1R1-dependent manner after treatment with a high concentration of CPT (Extended Data Figures 9C–F and 10A–B). On the other hand, RKO cells that do not express IL-1R1 showed no response to transcriptional stress or recombinant IL-1α treatment (Figure 6B and Extended Data Figure 9G). Moreover, we confirmed that cancer cell lines expressing both IL-1α and IL-1R1 (BICR6, BICR31, and BICR22) promoted p65 nuclear localization in an IRAK1- and Myd88-dependent manner (Figure 6B and Extended Data Figures 10C–D). Interestingly, several cell lines were found to be completely unresponsive to ETP, regardless of their IL-1α and IL-1R1 expression status (Figure 6B). This finding suggests that cancer cells frequently inhibit NF-κB-mediated inflammatory responses triggered by DSBs. Lastly, cells expressing IL-1R1 but lacking IL-1α expression (IGROV-1 and U2OS) were unable to stimulate p65 in response to transcriptional stress, yet showed a response to recombinant IL-1α treatment (Figure 6B). Together, these results demonstrate that the sole suppression of IL-1α expression in cells was enough to abrogate the NF-κB pathway in the context of DNA damage-induced transcription blockage.
Figure 6: Transcriptional stress promotes p65 activation in surrounding cells.

A. IL1A and IL1R1 mRNA expression levels in a panel of 1440 cell lines and classified by cancer types. B. Percentage of cells positive for p65 nuclear localization in the indicated cell lines treated with either TNFα (50 ng/mL; 30 min), UV (10 mJ/cm2; 4 h), CPT (20 μM; 4 h), ETP (50 μM; 2 h), or recombinant human IL-1α (1.25 ng/mL; 30 min). C. Representative immunofluorescence pictures illustrating p65 nuclear localization in U2OS cells (GFP negative cells) or U2OS co-cultured with MCF10A WT-GFP following treatment with UV+ATMi in the presence or absence of IL-1RA (250 ng/mL) for 4h. Scale bar: 20 μm. D. Quantification of p65 relative nuclear intensity in U2OS cells showed in C. Red lines indicate the mean. (Number of cells, n=550). E. Representative immunofluorescence pictures for p65 and GFP staining of U2OS cells or U2OS complemented with IL-1α-GFP and treated as indicated for 4 h. Scale bar: 20 μm. F. Quantification of p65 nuclear localization in U2OS cells co-cultured with U2OS transfected with IL-1α-GFP following the indicated treatment for 4 h. Red lines indicate the mean. (Number of cells, n=550). G. Quantification of relative p65 nuclear levels in MCF10A WT cells treated with UV+ATMi (10 mJ/cm2) for 4 h in the presence or absence of the indicated HDAC inhibitors. When indicated, cells were treated with recombinant human IL-1α (1.25 ng/mL). Red lines indicate the mean. (Number of cells, n=550).
IL-1α is secreted from damaged cells to trigger the NF-κB pathway in neighboring cells
To determine whether cells damaged with lesions blocking ongoing transcription release IL-1α to alert neighboring cells that have the IL-1R1 receptor, we co-cultured cells by selecting one cell line labeled with GFP, which expressed IL-1α (MCF10A-GFP) and one cell line expressing IL-1R1 but not IL-1α (U2OS, IGROV-1, or MCF10A IL-1α KO) (Figure 6A). For these experiments, U2OS and MCF10A IL-1α KO cells were treated with ATMi to prevent DSB-mediated p65 activation, whereas IGROV-1 cells already exhibited an inability to activate p65 in response to DSBs (Figure 6B). Neither U2OS, IGROV-1, nor MCF10A IL-1α KO cells induced p65 nuclear localization following treatment with UV, high concentration of CPT, or CDK9i. However, co-culturing them with MCF10A-GFP cells results in p65 activation upon identical treatments (Figures 6C–D and Extended Data Figures 11A–D). Conversely, the same cell lines, when co-cultured with MCF10A IL-1α KO-GFP cells or treated with IL-1R1 antagonist IL-1RA, failed to promote p65 translocation in the nucleus (Figures 6C–D and Extended Data Figures 11A–D). We next complemented U2OS cells, which do not express IL-1α at endogenous levels, with IL-1α-GFP. The expression of IL-1α-GFP was sufficient to restore p65 nuclear localization in non-complemented U2OS cells (GFP negative cells) following treatment with UV or high concentration of CPT (Figures 6E–F and Extended Data Figure 11E). Finally, we transferred UV-irradiated conditioned media from MCF10A WT or IL-1α KO cells to naïve U2OS cells. p65 activation occurred in undamaged U2OS cells incubated with conditioned media from UV-irradiated MCF10A WT cells, but not from IL-1α KO cells (Extended Data Figure 11F). Altogether, these results demonstrate that IL-1α secretion following DNA damage-induced transcriptional stress activates the NF-κB pathway in surrounding cells.
We next investigated how DNA lesions that impede transcription induce IL-1α secretion from the damaged cells. IL-1α is a dual-function cytokine that plays a role in the nucleus in addition to its canonical signaling role57,58. Previous studies reported that IL-1α is associated with chromatin59,60 and interacts with histone acetyltransferase (HAT) p300/CBP-associated factor (PCAF) and GCN561–63 that are associated with transcriptional activation64. Moreover, IL-1α is acetylated in unstressed conditions on the lysine 8260, and its deacetylation by histone deacetylases (HDACs) is required for its release from the cells following UV treatment60,65. Consistently, MCF10A cells pre-treated with HDAC inhibitors failed to induce p65 in response to UV or high concentration of CPT treatment in the presence of ATMi (Figure 6G and Extended Data Figure 12A), and similar results were obtained in MCF10A ATM KO cells (Extended Data Figure 12B). However, HDAC inhibitors had no impact on p65 nuclear localization after ETP treatment (Extended Data Figure 12C). These results suggest that HDAC activity is required for the induction of p65 in response to DNA damage-mediated transcription inhibition. Remarkably, cell treatment with recombinant IL-1α restored p65 activation suppressed by HDAC inhibitors in damaged cells (Figure 6G and Extended Data Figures 12A–B), demonstrating that HDAC inhibition blocked only the IL-1α activation step but not the other downstream factors involved in the activation of p65. Next, we complemented U2OS cells with IL-1α WT, IL-1α acetyl mutants (K82R), and IL-1α acetyl mimic (K82Q). In addition, we also mutated IL-1α on K83 to avoid its potential acetylation when K82 was mutated and cannot be acetylated. The expression of either IL-1α mutants (K82R and K82/83R) promotes p65 activation after UV+ATMi treatment compared to the expression of WT IL-1α (Extended Data Figure 12D). On the other hand, the expression of IL-1α acetyl mimics (K82Q and K82/83Q) in U2OS cells decreased p65 activation in response to UV+ATMi treatment compared to cells transfected with IL-1α WT or IL-1α acetyl mutants (Extended Data Figure 12D), further demonstrating that the deacetylation of IL-1α is critical for p65 activation after DNA damage-induced transcriptional stress.
Following cell treatment with UV, a high dose of CPT, or ActD, we detected a reduction in histone acetylation, as indicated by the decreased levels of H3K9Ac and H3K27Ac (Extended Data Figure 12E). These results were in accord with a published study showing that transcription inhibition is associated with a global decrease in HAT activity66. In contrast, ETP treatment, which only causes DSBs, did not impact either H3K9Ac or H3K27Ac levels. Conversely, HDAC inhibitor (HDACi) further promoted H3 acetylation (Extended Data Figure 12F). Hence, we posit that the overall reduction in protein acetylation levels induced by transcriptional stresses facilitates the activation of IL-1α from damaged cells and can be prevented through the treatment with HDAC inhibitors. In agreement, IL-1α association with chromatin decreased following UV treatment in an HDAC-dependent manner (Extended Data Figure 12G), and MCF10A cells pre-treated with p300/CBP inhibitors present an enhanced p65 nuclear localization after UV+ATMi (Extended Data Figures 12H–I). Together, these results further support that IL-1α regulation by HATs and HDACs directly impacts its ability to promote the NF-κB pathway following DNA damage-mediated transcriptional stress.
IL-1α/IRAK1 signaling drives selective inflammatory gene expression
To evaluate the impact of NF-κB pathway activation by ATM or IRAK1 on gene expression, we performed RNA sequencing on MCF10A cells treated with UV. We first selected UV as it induces a rapid suppression of ongoing transcription followed by a gradual recovery over time67, allowing cells to initiate inflammatory gene expression. Transcriptomic analysis of UV-treated cells revealed a significant increase in the expression of various inflammatory genes, including CXCL2, CXCL3, CXCL8, CCL20, IL-6, or TNF, in an IRAK1-dependent manner (Figures 7A–B and Extended Data Figure 13A). Importantly, we detected by ELISA the secretion of IL-6, IL-8, and TNFα in cell media from cells treated with UV but not in media from cells treated with UV and IL-1RA (Figure 7C and Extended Data Figure 13B). We then confirmed that the expression of these genes was also p65-dependent (Figure 7D) and occurred in other types of cell lines (Extended Data Figure 13C). Moreover, both IL-1R1 knockdown and IL-1α KO abolished CXCL2, CXCL3, CXCL8, CCL20, and TNF expression (Figure 7E and Extended Data Figure 13D), while treatment with recombinant IL-1α alone was sufficient to induce their expression in an IRAK1-dependent manner (Figure 7F). Consistently, the transfer of UV-irradiated conditioned media from MCF10A WT promotes the expression of these genes in naïve U2OS cells. However, U2OS cells incubated with conditioned media from UV-irradiated MCF10A IL-1α KO cells or U2OS cells pre-treated with IL-1RA failed to induce their expression (Extended Data Figures 13E–F). In contrast, we found only a modest decrease in gene expression in cells treated with both UV and ATMi (Figure 7A and Extended Data Figures 13A and 13G), suggesting that IRAK1 is the main driver of p65-dependent inflammatory gene expression after UV. We further confirmed IRAK1-induced gene expression using an intermediate concentration of CPT sufficient to cause transcriptional stress and partial abrogation of ongoing transcription (Figures 3A and 7G and Extended Data Figures 14A–C). Taken together, these results demonstrate that NF-κB activation by IRAK1 via the IL-1α and IL-1R1 signaling axis drives the expression of specific inflammatory genes in response to different DNA lesions-induced translational stresses.
Figure 7: Transcriptional stress induces specific inflammatory gene expression.

A. Volcano plots of differentially expressed genes in MCF10A WT and IRAK1 KO#7 cells treated with UV (10 mJ/cm2) for 12 h in the presence or absence of ATMi (10 μM). Data are derived from n = 2 biological replicates. B. Quantification of CXCL2, CXCL3, CXCL8, CCL20 and TNF mRNA levels by RT-qPCR in MCF10A WT or IRAK1 KO cells treated with UV (10 mJ/cm2) for 12 h. Each target was normalized to the highest expressing condition. Mean values ± SD (n = 3). C. MCF10A WT cells were treated with UV (10 mJ/cm2) ± IL-1RA (250 ng/mL). The levels of secreted IL-8 and TNFα were then analyzed in conditioned media by ELISA. Red lines indicate the mean. D-E. CXCL2, CXCL3, CXCL8, CCL20 and TNF mRNA levels were monitored by RT-qPCR in MCF10A WT, p65 KO (D), or IL-1α KO (E) treated for 12 h with UV (10 mJ/cm2). Each target was normalized to the highest expressing condition. Mean values ± SD (n = 3). F-G. Quantification of CXCL2, CXCL3, CXCL8, CCL20 and TNF mRNA levels by RT-qPCR in MCF10A WT or IRAK1 KO treated for 12 h with recombinant human IL-1α (1.25 ng/mL) (F), or CPT (2.5 μM) (G). Each target was normalized to the highest expressing condition. Mean values ± SD (n = 3).
DISCUSSION
The transcription factor NF-κB plays a crucial role in regulating both innate and adaptive immune functions by promoting the expression of various inflammatory genes. Activation of the NF-κB pathway results from various extracellular ligands binding to cell surface receptors68, as well as from intrinsic stresses, including DNA damage69. Although the role of ATM promoting NF-κB has been extensively characterized in response to DSBs, it remains unclear whether other types of DNA lesions can directly trigger NF-κB without being first converted into DSBs or by activating ATM. Herein, we have established a QIBC method using high-throughput microscopy to monitor NF-κB activation in individual cells. Our analysis, which compared p65 localization between the cytoplasm and the nucleus of each cell, revealed that rapid activation of NF-κB following DNA damage is mediated through two independent pathways, each triggered by distinct types of DNA lesions. These two pathways are orchestrated by either ATM or IRAK1 kinases in response to DSBs and transcriptional stress, respectively. In contrast to ATM, which promotes NF-κB solely in damaged cells with DSBs, the IRAK1 signaling axis operates in neighboring cells stimulated by the secretion of IL-1α from the injured cells (Figure 8). These findings offer an alternative mechanism for cells damaged by DNA lesions that impaired transcription to initiate an inflammatory response without relying on their own gene expression, a necessary step occurring during canonical innate immune responses.
Figure 8:

DNA damage induces two distinct pathways promoting NF-κB. The NF-κB pathway is activated through two separate mechanisms orchestrated by ATM or IRAK1 kinases in response to different types of DNA damage. ATM mediates an acute activation of p65 upon DNA lesions, resulting in DSB formation. In contrast, DNA lesions blocking transcription cause IL-1α release from the cells to stimulate the transmembrane receptor IL-1R1 of nearby cells, which in turn activates the MyD88–IRAK1 complex. Like ATM, IRAK1 induces TRAF6, resulting in NF-κB activation and expression of specific inflammatory genes.
QIBC as a new standard method to study the NF-kB pathway
Our single-cell level analyses revealed that ATM mediates the rapid induction of NF-κB following double-strand breaks, consistent with previously published models23,24,26,28,30,31. We showed that ATM-induced NF-κB occurred regardless of the cell cycle after TOP2 inhibitors and only in S-phase when cells are damaged with a low concentration of TOP1 poison (Figures 1B and 2A). The link between NF-κB activation induced by TOP1 inhibitors and S-phase cells was attributed to the collapse of replication forks, resulting in the formation of DSBs (Figure 2E). Thus, our data suggest that NF-κB association with a specific phase of the cell cycle is predominantly influenced in the way by which DSBs are generated in cells, rather than cell cycle specific regulation of the pathway. As a result, it is important to exercise caution when examining the NF-κB pathway in response to treatments that cause DSBs in a cell cycle-dependent manner using techniques that monitor NF-κB in a bulk population. Indeed, bulk measurements to assess NF-κB activation including Western blot analysis to determine the activation state of key players of the pathway, electrophoretic mobility shift assay (EMSA) to monitor NF-κB DNA binding, or quantitative PCR to measure gene expression mediated by NF-κB do not account for any variations in the cell cycle population. Moreover, changes in activity in one cell may be masked if it is offset by an opposite change in another cell within the same population. This distinction between populations and individual cells is particularly important given that the repair of DNA lesions can significantly vary between cells at different stages of the cell cycle. Unlike these methods, QIBC allows us to monitor p65 activation and its regulation at the single-cell level. QIBC directly associates p65 localization with cell cycle phases, DNA damage levels, and other potential markers in each individual cell. Therefore, it is important to point out that when the knockdown, knockout, or inhibition of proteins potentially involved in the regulation of the NF-κB pathways also alters the cell cycle phase distribution or ongoing replication, any resulting changes to NF-κB levels may not necessarily indicate a direct involvement of these factors in the pathway regulation. Therefore, we suggest monitoring NF-κB activation levels by QIBC as a new standard for appropriately interpreting such findings. In contrast to other methods, QIBC allows the normalization of NF-κB activation to a specific cell population or a cellular marker and assures that any change in NF-κB levels is not the indirect consequence of an alteration of the cell cycle or a change in DSB levels.
An innate immune response resistant to transcriptional shutdown
The activation of the innate immune system in response to genotoxic stress is critical for promoting cell survival or also killing cells at risk of becoming cancerous because they are too damaged to be repaired correctly. This cellular response is characterized by the production of cytokines, chemokines, and other inflammatory mediators to recruit immune cells and eliminate genomically unstable cells. However, canonical innate immune responses after DNA damage strongly rely on transcription. For example, the inflammatory response induced by cGAS-STING first requires expression of IFN proteins that are then released from the damaged cells to activate IFN receptors and the expression of interferon-stimulated genes (ISGs) in neighboring cells. Consequently, the cell’s ability to produce IFNs in response to DNA damage would be compromised by DNA lesions blocking transcription, ultimately suppressing the host’s capability to mount an effective innate immune response. In line with this model, multiple studies have reported the suppression of the IFN response in cells infected with SARS-CoV-2, Influenza, or Ebola viruses and treated with TOP1 or transcription inhibitors7–9. Furthermore, we found that cells subjected to UV irradiation failed to express any ISGs (Figure 7A), in accordance with previous studies that have shown inactivation of the IFN response after UV treatment70,71. It is important to note that cGAMP produced by cGAS can also be transferred to neighboring cells through gap junctions to activate STING72 and potentially bypass the cell’s transcription requirement to alert neighboring cells. However, in this study, we found that STING has no effect on NF-κB activation, suggesting that this mechanism was not involved after DNA damage-induced transcription stress. Thus, our study reveals an alternative mechanism to bypass the requirement of transcription in the damaged cell with DNA lesions that impede RNA polymerases.
We identified a signaling pathway promoting NF-κB after specific types of DNA lesions that affect ongoing cellular transcription and do not require ATM. Mechanistically, we found that genotoxic stress-induced transcriptional blockage leads to the release of IL-1α from cells. Then, IL-1α stimulates the transmembrane receptor IL-1R1 of surrounding cells, which in turn activates IRAK1 kinase. IRAK1, like ATM, triggers the activation of TRAF6, resulting in the activation of the IKK complex, the degradation of IκBα, and the nuclear localization of p65. Recent studies reported a non-canonical IRAK1 signaling pathway triggered by DSBs and driven by ATR kinase, causing IRAK1 to relocate to the nucleus73,74. Notably, the activation of IRAK1 in response to DSBs is independent of IL-1R1 and Myd88 and has not been associated with p65 activation73,74. In contrast, we showed that after DNA damage that impacts transcription specifically, IRAK1-mediated p65 required both IL-1R1 and Myd88 (Figures 5 and 6). These data suggest that IRAK1 could be differentially regulated depending on the types of DNA damage. The sequestration of IRAK1 within the nucleus of the cells following DSB formation may prevent IRAK1 interaction with TRAF6 or Myd88, which could explain why the absence of IRAK1 did not impact the induction of p65 following DSB formation (Extended Data Figure 7H). This physical separation of IRAK1 from TRAF6 may be a mechanism used by cells to tightly regulate the NF-κB pathway after DSBs ensuring that only one signaling axis is activated at any given time. We speculate that this stringent regulation is crucial for preventing an aberrant inflammatory response and allowing a transient response that can be rapidly suppressed once DNA breaks have been repaired. However, further investigations will be necessary to assess the impact on NF-κB activity after inhibiting nuclear translocation of IRAK1.
Up and down-regulation of NF-κB in cancers
Although acute and transient activation of NF-κB is associated with promoting cell survival, prolonged activation of NF-κB after DNA damage leads to the expression of pro-inflammatory genes and senescence-associated secretory phenotype (SASP) genes, which are detrimental to cancer cells75. Our data identified several cancer-derived cell lines that specifically inactivate NF-κB in response to DNA damage (Figure 6B). Depending on the cell type, either the ATM-dependent pathway, the IL-1α/IRAK1-signaling pathway, or both are suppressed to avert DNA damage-induced NF-κB activation. We found that the absence of response to transcriptional stress was the result of the lack of IL-1α or IL-1R1 expression in these cancer cells. These results were similar to other studies that have reported the transcription suppression of cGAS and STING found in many cancers to prevent IFN response caused by DNA damage76,77. Thus, these data further highlight how cancer cells downregulate various innate immune pathways to block inflammatory responses against different types of genotoxic stress that tumors might encounter to facilitate evasion of the immune surveillance system. On the other hand, constitutive activation or hyperactivation of NF-κB in cancers has often been associated with cancer development and progression by inducing genes responsible for cell proliferation, angiogenesis, metastasis, and survival78. Consistently, tumors can be addicted to the cGAS-STING pathway triggered by chromosomal instability (CIN) through the rewiring of downstream signaling leading to a pro-metastatic tumor microenvironment79. Likewise, IL-1α exerts dual effects in tumors, demonstrating both anti- and pro-tumor activities. IL-1α stimulates immune cells to target cancer cells and enhances cell death, while also promoting angiogenesis and proliferation, ultimately contributing to tumor growth80,81. Cancer addiction to IL-1α suggests a potential avenue for cancer therapy through the use of IL-1RA (Anakinra) to impede IL-1α-mediated signaling.
METHODS
Cell culture
MCF10A cells were cultured in DMEM/F12 supplemented with 5 % horse serum, 2 ng/mL epidermal growth factor (EGF), 0.5 μg/mL hydrocortisone, 100 ng/mL cholera toxin, 10 μg/mL insulin, and 1 % penicillin/streptomycin. BICR6, BICR31, BICR22, RKO, and MCF7 were maintained in DMEM/F12 GlutaMAX supplemented with 10 % FBS and 1 % penicillin/streptomycin. IGROV-1 cell line was cultured in RPMI GlutaMAX supplemented with 10 % FBS and 1 % penicillin/streptomycin. U2OS and RPE-1 cell lines were cultured in DMEM supplemented with 4 mM L-glutamine, 10 % FBS and 1% penicillin/streptomycin. hTERT-HME1 cell line was cultured in Human Mammary Epithelial cell basal medium, complemented with Mammary Epithelial Growth Supplement (MEGS) and 50μg/mL of Gemtamycin. HBEC3-KT cells were cultured in Keratinocyte-SFM supplemented with 50μg/mL Gemtamycin.
Kinase inhibitors and chemicals
The chemicals and concentrations used in this study are listed in Supplementary Table 1, unless otherwise indicated. When indicated, cells were pretreated with HU for 5 min, with ATMi, ATRi, or DNA-PKi for 30 min, with IL-1RA for 1 h, or with HDAC inhibitors for 6h.
RNA interference
siRNA transfections were performed by reverse transfection with Lipofectamine RNAiMAX (Thermo Fisher Scientific, #13778150). siRNAs were purchased from Thermo Fisher Scientific (Silencer Select siRNA). Cells were transfected with siRNA for 48 h before indicated treatment (4 nM). The sequences of the siRNAs used in this study are listed in Supplementary Table 2.
CRISPR-Cas9 Knockout cells
NEMO, ATM, IRAK1, RIP1, TDP1, STING, TRAF6, p65, and IL-1α CRISPR-Cas9 knockout MCF10A cell lines were performed by transfection with Lipofectamine CRISPRMAX (Thermo Fisher Scientific, #CMAX00008) of TrueGuide Synthetic CRISPR gRNA and TrueCut Cas9 Protein v2 (Thermo Fisher Scientific, #A36497) according to the manufacturer’s instructions. CRISPR gene editing efficiency was verified using GeneArt Genomic Cleavage Detection kit (Thermo Fisher Scientific, #A24372). Independent clones were generated for each target. gRNA sequences used in this study are listed in Supplementary Table 3. Primers used to validate IL-1α KO cells by PCR are: TTCATTGGCGTTTGAGTCAGC and AAAGGTGCTGACCTAGGCTTG. MCF10A MAVS KO cell line was provided by Dr. Junjie Chen (MD Anderson Cancer center)82.
Antibodies
The antibodies used in this study are listed in Supplementary Table 4.
Immunofluorescence
Cells grown on glass coverslips were fixed with paraformaldehyde (3 % paraformaldehyde and 2 % sucrose in 1x PBS) for 20 min, washed twice with 1x PBS, and cells were permeabilized with a permeabilization buffer (1x PBS and 0.2 % Triton X-100) for 5 min. Subsequently, cells were washed twice with 1x PBS and blocked in PBS-T (1x PBS and 0.05 % Tween-20) containing 2 % BSA and 10 % milk for 1 h. Cells were then incubated with the primary antibody diluted in 1x PBS containing 2 % BSA and 10 % milk at room temperature for 2 h. Coverslips were washed three times with PBS-T before incubation (1 h) with the appropriate secondary antibodies conjugated to fluorophores (Alexa-488 or Cy3). After three washes with PBS-T, cells were stained with DAPI (5 μg/mL, MilliporeSigma #D9542), and the coverslips were mounted using slow-fade mounting media (Thermo Fisher Scientific, #S36936). When indicated, cells pulse-labeled with 5-EU (500 μM for 15 min) or EdU (10 μM for 15 min) were labeled with the Click-iT™ RNA Alexa Fluor™ 594 Imaging Kit (Thermo Fisher Scientific, #C10330) or the Click-iT EdU Alexa Fluor 488 Imaging Kit (Thermo Fisher Scientific, #C10639) according to manufacturer’s protocol before performing the immunofluorescence protocol described above. Images were captured using a Leica DMi8 THUNDER microscope.
Quantitative Image-Based Cytometry (QIBC)
Using a Leica DMi8 THUNDER microscope with a Leica HC PL APO 20x/0,80 objective, 30 to 50 individual images were taken for each sample. The intensity signals of p65, γH2AX, Geminin, EdU, 5-EU, and DAPI of individual cells were quantified using the CellProfiler software. The detailed CellProfiler pipeline used to quantify p65, γH2AX, Geminin, EdU, 5-EU, and DAPI intensity levels is described in Supplementary Methods. The intensity levels of γH2AX, Geminin, EdU, and 5-EU were quantified in DAPI-stained nucleus, and the intensity levels were normalized between the different images by subtracting the background signal from the nuclear intensity signal. p65 relative nuclear levels were calculated by subtraction of p65 cytoplasmic intensity (mean intensity measured from extension of the nucleus) to its nuclear intensity (mean intensity measured from DAPI-stained area). p65 intensity signal was color-coded into three groups: “no/low”, “medium”, and “high” p65 intensity. The threshold between “no/low” and “medium” groups was set up to include 97–98% of the untreated cells in the “no/low” group. The threshold between “medium” and “high” was defined to label between 20 to 40% of p65 positive cells in the “high” group. The threshold between “medium” and “high” groups was adapted in different experiments to best visually reflect the differences in p65 intensity levels between samples. Dot blot graphs were generated using GraphPad Prism software by randomly selecting 550 cells (for single target dot plot graphs) or 5,000 cells (for dot plot graphs quantifying p65, γH2AX, and DAPI or Geminin intensity levels).
Quantitative reverse transcription PCR (RT-qPCR)
Total RNA was extracted from cells using Quick-RNA MiniPrep Kit (Zymo Research, #R1055) according to the manufacturer’s instructions. Following extraction, total RNA was reverse transcribed using the High-Capacity cDNA Reverse Transcription Kit (Thermo Fisher Scientific, #4368814). RT products were analyzed by real-time qPCR using SYBR Green (PowerUp SYBR Green Master Mix, Thermo Fisher Scientific, #A25742) in a QuantStudio 3 Real-Time PCR detection system (Thermo Fisher Scientific). For each sample tested, the levels of indicated mRNA were normalized to the levels of Actin mRNA. The sequences of the PCR primers used in this study are listed in Supplementary Table 5.
RNA sequencing and data analysis
MCF10A WT or IRAK1 KO#7 cells were treated with UV (10mJ/cm2) ± ATMi (10 μM) for 12h and total RNA was extracted using the Quick-RNA MiniPrep Kit (Zymo Cat#11–328). Five micrograms of total RNA for each sample were used to construct the sequencing library using Invitrogen Collibri Stranded RNA Library Prep Kit (#A39114096) according to the manufacturer’s protocol. Libraries were amplified using 11 PCR cycles. Library size distributions were measured using a BioAnalyzer and quantified via qPCR. Libraries were sequenced on a Novaseq 6000 platform. For RNA-seq data analysis, the fastq files were mapped on the human genome (GRCh38.109) using STAR algorithm, and PCR duplicates were removed using Picard tools. Differential gene expressions were analyzed using R studio. The detailed pipeline used to analysis RNA-seq data is described in Supplementary Methods.
Conditioned Medium Transfer
MCF10A and U2OS cells were cultured in DMEM/F12 supplemented with 5 % horse serum, 2 ng/mL epidermal growth factor (EGF), 0.5 μg/mL hydrocortisone, 100 ng/mL cholera toxin, 10 μg/mL insulin, and 1 % penicillin/streptomycin. MCF10A cells were treated with UV (20 mJ/cm2), and the conditioned cell media from untreated or UV-irradiated cells were collected 4 h after UV irradiation. The conditioned cell media was added to naïve U2OS cells for 30 min. U2OS cells were subsequently fixed for immunofluorescence or collected for RNA analysis, as described above.
Enzyme-Linked ImmunoSorbent Assay (ELISA)
Conditioned media was collected following the indicated treatment, centrifuged at 1,000 g for 4 min at 4°C, aliquoted, and frozen on dry ice. The levels of L-1α, IL-1β, IL-1RA, IL-6, IL-8, and TNFα, in conditioned media, were quantified by Eve Technologies (Canada, Calgary) using a Human Cytokine Panel A 48-Plex Discovery Assay® (MilliporeSigma, Burlington, Massachusetts, USA) on a Luminex™ 200 system (Luminex, Austin, TX, USA) according to the manufacturer’s protocol.
Extended Data
Extended Data Figure 1:

A. Representative images showing p65 staining by immunofluorescence in MCF10A WT or p65 KO cells. B. Immunofluorescence for p65 and IκBα in MCF10A WT cells treated with CPT (0.5 μM) for 2 h. C. The levels of NEMO and GAPDH were analyzed by western blot in MCF10A WT or NEMO KO cells. D. MCF10A WT and NEMO KO cells were treated with CPT (0.5 μM) for 2 h and relative levels of p65 nuclear intensity in individual cell was quantified by immunofluorescence. Red lines indicate the mean. (Number of cells, n=550). E. Quantification of p65 nuclear levels, γH2AX intensity, and DNA content (DAPI) of 5,000 MCF10A WT cells treated with CPT (0.5 μM) or TPT (1 μM) for 2 h in the presence of absence of ATRi (0.5 μM). Colors display nuclear p65 levels compared to the cytoplasm in each cell. F-G. QIBC of MCF10A WT cells stained for p65, γH2AX, and DNA content (DAPI). Cells were with CPT (0.5 μM) ± DNA-PKi (2 mM) (F) or TPT (1 μM) ± ATMi (10 μM) (G) for 2 h. Cells were color coded according to the levels of nuclear p65. (Number of cells, n=5000). H. The levels of ATM and Vinculin were analyzed by western blot in MCF10A WT or ATM KO cells. I. MCF10A WT or ATM KO cells were treated with CPT (0.5 μM) for 2 h then p65 nuclear levels were quantified by immunofluorescence.
Extended Data Figure 2:
A-B. QIBC of MCF10A cells treated with HU (2 mM) for 2 h and stained for EdU, γH2AX, and DNA content (DAPI). Cells were color coded according to the levels of γH2AX (A) or EdU (B). (Number of cells, n=5000). C-D. MCF10A WT cells were treated with CPT (0.5 μM) for 2 h in the presence or in the absence of ATMi (10 μM) (C) or HU (2 mM) (D). Level of KAP1-pS824 and GAPDH were analyzed by western blot. E. The levels of TDP1 and GAPDH were analyzed by western blot in MCF10A WT or TDP1 KO cells.
Extended Data Figure 3:

A. The levels of PARP1, Caspase 3, and GAPDH levels were analyzed by western blot in MCF10A treated with CPT (20 μM, 4 h), UV (20 mJ/cm2, 4 h), ActD (5 μM, 4 h), CDK9i (6 μM, 4 h), ETP (50 μM, 4 h), Doxo (0.5 μM, 4h), or with Staurosporine (1 μM, 7h). B. Representative flow cytometry plots of Annexin V-FITC and Propidium Iodide (PI) staining of MCF10A cells treated with CPT (20 μM, 4 h), UV (20 mJ/cm2, 4 h), ActD (5 μM, 4 h), CDK9i (6 μM, 4 h), ETP (50 μM, 4 h), or with Staurosporine (1 μM, 7h). C. The levels of nuclear p65 were analyzed in MCF10A treated with CPT (0.5 μM), ETP (25 μM), IR (20 Gy), Doxorubicin (Doxo; 0.5 μM), HU (2 mM), APH (1 μg/mL), H2O2 (0.5 μM), Oxaliplatin (300 μM), MMC (3 μM), MMS (500 μM), 5-FU (10 μM), ATRi (1 μM), PARPi (10 μM), ActD (5 μM), or UV (10 mJ/cm2) for the indicated time. Red lines indicate the mean. (Number of cells, n=550).
Extended Data Figure 4:
A-C. The relative levels of nuclear p65 were analyzed in MCF10A WT or indicated KO cells treated with CPT (1 μM; 2 h) (A), IR (20 Gy; 1 h) (B), Doxo (0.5 μM; 2 h) (C) ± ATMi (10 μM). Red lines indicate the mean. (Number of cells, n=550). D. Quantification of p65 nuclear relative intensity in MCF10A WT, ATM KO, or NEMO KO cells treated with ETP (25 μM; 2 h). Red lines indicate the mean. (Number of cells, n=550). E. The levels of endogenous p65 and ectopically expressed p65-mNeonGrean were analyzed by western blot. F. Relative nuclear p65 intensity was quantified over time by live imaging in MCF10A-p65-mNeonGreen treated with ETP (50 μM), UV (10 mJ/cm2), or ActD (5 μM). When indicated, cells were pre-treated with ATMi (10 μM) for 30 min. For cells treated with ETP, UV or ActD ± ATMi, only cells that become nuclear p65-mNeonGreen positive during treatment were quantified. Red lines indicate the mean, and shadow sections represent the standard deviation. (Number of cells, n=15).
Extended Data Figure 5:

A-B. The levels of indicated proteins were analyzed by western blot in MCF10A WT treated with CDK9i (6 μM; 4 h), CDK7i (1 μM; 4 h) (A), or TPL (10 μM) (B). C-D. Quantification of 5-EU incorporation in MCF10A cells treated with TPL (10 μM) (C) or CDK7i (1 μM) (D) for 4h. Blue lines indicate the mean. (Number of cells, n=550). E-F. The relative levels of nuclear p65 were analyzed in MCF10A treated with TPL (10 μM) (E) or CDK7i (1 μM) (F) for the indicated time. Red lines indicate the mean. (Number of cells, n=550). G. QIBC of MCF10A cells stained for p65, γH2AX, and DNA contents (DAPI). Cells were treated with CDK7i (1 μM) ± ATMi (10 μM) for 4 h. (Number of cells, n=5000). H-I. Quantification of the relative levels of nuclear p65 in the indicated cell lines treated with 10 μM of TPL ± ATMi (10 μM) for 4 h. Red lines indicate the mean. (Number of cells, n=550).
Extended Data Figure 6:
A. The indicated protein levels were analyzed by western blot in MCF10A WT, STING KO, or MAVS KO cells. B. MCF10A WT and STING KO cells were transfected with HT-DNA (1 mg/mL) for 12 h. Relative nuclear IRF3 levels were then monitored by immunofluorescence. Red lines indicate the mean. (Number of cells, n=550). C. Quantification by immunofluorescence of nuclear IRF3 levels in MCF10A WT and MAVS KO cells transfected with 3phpRNA (250 ng/mL) for 12 h. Red lines indicate the mean. (Number of cells, n=550). D-E. Quantification of IFNB1 and CXCL10 mRNA levels by RT-qPCR in MCF10A WT cells and STING KO (D) or MAVS KO (E) cells treated as indicated. Each target was normalized to the highest expressing condition. Mean values ± SD (n = 3). F-H. The relative levels of nuclear p65 were analyzed in MCF10A WT, STING KO, or MAVS KO cell lines treated with CPT (10 μM) for 2 h (F), ActD (5 μM) for 4 h (G), or UV (10 mJ/cm2) for 4 h (H). Red lines indicate the mean. (Number of cells, n=550). I. The levels of TRAF6 and GAPDH were analyzed by western blot in MCF10A WT or TRAF6 KO cells. J-L. The relative levels of nuclear p65 were analyzed in MCF10A WT, ATM KO, TRAF6 KO, or NEMO KO cell lines treated with CPT (0.5 μM; 2 h) (J), ActD (5 μM; 4 h) (K), or TNFα (50ng/mL; 30 min) (L). Red lines indicate the mean. (Number of cells, n=550).
Extended Data Figure 7:

A. MCF10A cells were treated with CPT (10 μM), UV (10 mJ/cm2), ActD (5 μM), CDK9i (6 μM), or TPL (10 μM) for 4 h and the levels of KAP1-pS824 and GAPDH were analyzed by western blot. B. The levels of RIP1 and GAPDH were analyzed by western blot in MCF10A WT or RIP1 KO cells. C. Quantification of relative p65 nuclear levels in MCF10A WT or RIP1 KO cell lines treated with CDK9i (6 μM) for 4 h. Red lines indicate the mean. (Number of cells, n=550). D-E. The protein levels of IRAK1, Myd88, and GAPDH were analyzed by western blot in MCF10A cells knockout or knockdown for IRAK1 and Myd88. F. Representative immunofluorescence images of p65 in MCF10A WT or IRAK1 KO cells treated with UV (10 mJ/cm2) ± ATMi (10 μM) for 4 h. G. QIBC of MCF10A cells stained for p65, γH2AX, and DNA content (DAPI). Cells were transfected with a siRNA control (CTL) or targeting Myd88 and treated with UV (10 mJ/cm2) for 4 h. (Number of cells, n=5000). H. Quantification by QIBC of p65, γH2AX, and DAPI staining in MCF10A WT or IRAK1 KO cells treated with ETP (50 μM; 2 h). (Number of cells, n=5000). I. MCF10A cells were transfected with a siRNA control (CTL) or targeting Myd88 and treated with ETP (50 μM) for 2 h. p65 nuclear levels, γH2AX intensity, and DNA content were then monitor by QIBC. (Number of cells, n=5000). J. Quantification of relative p65 nuclear levels in MCF10A WT cells transfected with siMyd88 and treated with ActD (5 μM) ± ATMi (10 μM) for 4 h. Red lines indicate the mean. (Number of cells, n=550).
Extended Data Figure 8:
A. mRNA expression levels of indicated targets were analyzed by RT-qPCR in MCF10A cells. Mean values ± SD (n = 3). B. Quantification of TLR1, TLR3, TLR6 and IL1R1 mRNA levels by RT-qPCR in MCF10A WT cells knockdown for the respective targets. Mean values ± SD (n = 3). C-D. The relative levels of nuclear p65 were analyzed in MCF10A WT cells transfected with siRNAs against indicated targets, and subsequently treated with CPT (10 μM) ± ATMi (10 μM) (C) or ETP (50 μM) (D) for 2 h. Red lines indicate the mean. (Number of cells, n=550). E. Quantification of p65 nuclear relative levels in MCF10A cells treated with CDK9i (6 μM) ± IL-1RA (150 ng/mL) for 4 h. Red lines indicate the mean. (Number of cells, n=550). F. QIBC of MCF10A WT cells stained for p65, γH2AX, and DNA content (DAPI). Cells were treated with UV (10 mJ/cm2) ± ATMi (10 μM) in the presence or absence of IL-1RA (150 ng/mL) for 4 h. (Number of cells, n=5000). G. IL1B mRNA levels were monitored by RT-qPCR in MCF10A cells transfected with siCTL or siIL-1β. Mean values ± SD (n = 3). H. PCR amplicons on mRNA templates prepared from the indicated cell lines and performed using primers surrounding both gRNAs used to generate IL-1α KO cell lines. I. The relative levels of nuclear p65 were analyzed in MCF10A cells transfected with siIL-1β, subsequently treated with CDK9i (6 μM) ± IL-1RA (100 ng/mL) for 4 h. Red lines indicate the mean. (Number of cells, n=550). J. The levels of IL-1α, IL-1β, and IL-1RA were measured by ELISA in conditioned media from MCF10A WT cells treated with UV (10 mJ/cm2) for 4 h. K. Quantification of p65 nuclear relative levels in MCF10A WT or IL-1α KO cells treated with ActD (5 μM) ± ATMi (10 μM). Red lines indicate the mean. (Number of cells, n=550).
Extended Data Figure 9:
A. mRNA expression levels of Myd88, IRAK1, IRAK4, TRAF6, NEMO, and RELA (p65) in a panel of 1440 cell lines and classified by cancer types. B. IL1A and IL1R1 mRNA levels were analyzed in MCF10A, BICR6, BICR31, BICR22, HBEC3-KT, HME1, RPE-1, IGROV1, U2OS, RKO, and MCF7. C-D. QIBC of HME1 cells (C) or HBEC3-KT cells (D) cells stained for p65, γH2AX, and DNA content (DAPI). Cells were treated with CPT (20 μM) for 4 h. (Number of cells, n=5000). E-G. Relative levels of nuclear p65 intensity were analyzed in HME1 (E), HBEC3-KT (F), or RKO (G) cells treated with CPT (20 μM) ± ATMi (10 μM) for 4 h in the presence or absence of IL-1RA (250 ng/mL). Red lines indicate the mean. (Number of cells, n=550).
Extended Data Figure 10:

A. BICR6, BICR31, and BICR22 cells were treated with CPT (20 μM) ± ATMi (10 μM) for 4 h. The relative nuclear levels of p65 were then analyzed by immunofluorescence. Red lines indicate the mean. (Number of cells, n=550). B. BICR6, BICR31, and BICR22 cells were pretreated with IL-1RA (250 ng/mL) for 1 h and subsequently treated with CPT (20 μM) ± ATMi (10 μM) for 4 h. The relative nuclear levels of p65 were then analyzed by immunofluorescence. Red lines indicate the mean. (Number of cells, n=550). C-D. Quantification of p65 nuclear relative levels in BICR6, BICR31, and BICR22 cells transfected with the indicated siRNAs and treated with CPT (20 μM) ± ATMi (10 μM) for 4 h. Red lines indicate the mean. (Number of cells, n=550).
Extended Data Figure 11:

A-B. U2OS cells were cultured in the presence or absence of MCF10A WT-GFP or IL-1α KO-GFP and treated with CDK9i (6 μM) (A) or CPT (20 μM) + ATMi (10 μM) (B) for 4h. The relative nuclear levels of p65 were then analyzed by immunofluorescence. Red lines indicate the mean. (Number of cells, n=550). C. Quantification of p65 nuclear levels in MCF10A IL-1α KO cells co-cultured or not with MCF10A WT-GFP and treated with CDK9i (6 μM) ± IL-1RA (250 ng/mL) for 4 h. Red lines indicate the mean. (Number of cells, n=550). D. IGROV-1 cells were cultured in the presence or absence of MCF10A WT-GFP and treated with UV (10 mJ/cm2) ± IL-1RA (250 ng/mL) for 4 h. The relative levels of nuclear p65 were measured by immunofluorescence. Red lines indicate the mean. (Number of cells, n=550). E. Quantification of p65 nuclear localization in U2OS cells co-cultured with U2OS transfected with IL-1α-GFP following the indicated treatment for 4 h. Red lines indicate the mean. (Number of cells, n=550). F. MCF10A WT or IL-1α KO cells were treated with UV (10 mJ/cm2) for 4 h. Then, the conditioned media was collected and added to U2OS naive cells for 30 min. Next, the relative nuclear levels of p65 were monitored by immunofluorescence in U2OS cells. Red lines indicate the mean. (Number of cells, n=550).
Extended Data Figure 12:
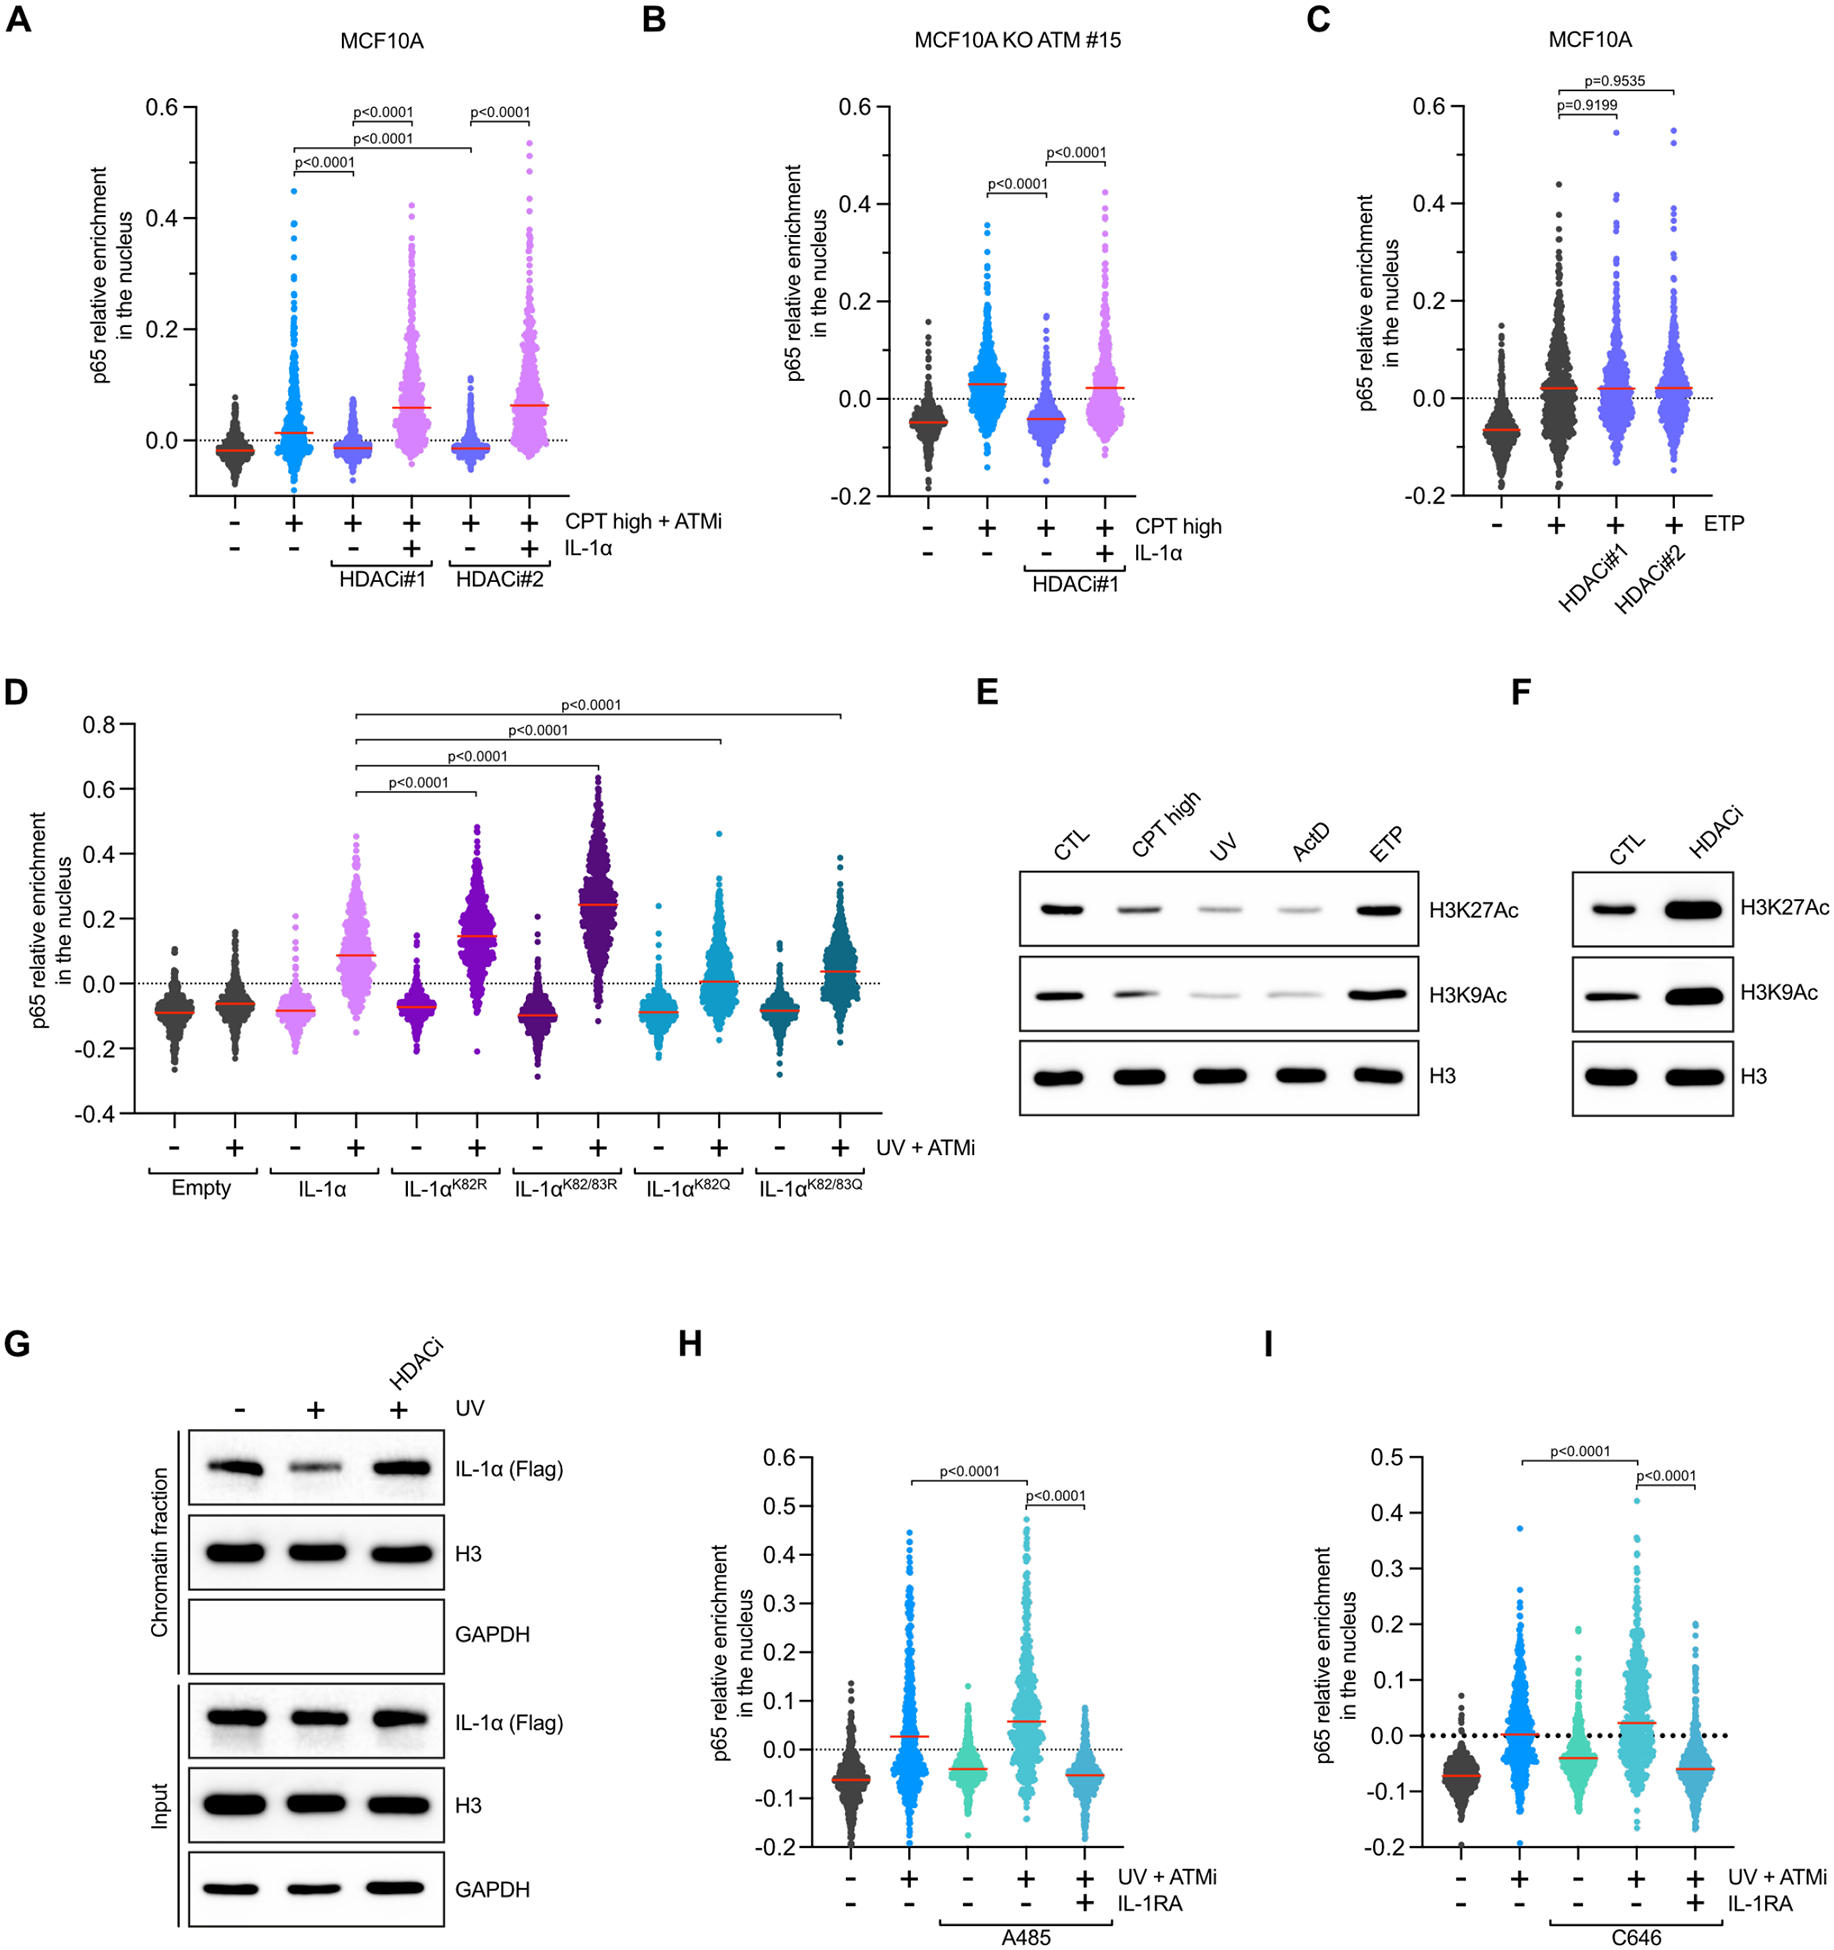
A. Quantification of relative p65 nuclear levels in MCF10A WT cells treated for 4 h with CPT+ATMi in the presence or absence of the indicated HDAC. When indicated, cells were treated were treated with recombinant human IL-1α (1.25 ng/mL), 30 min before fixation. Red lines indicate the mean. (Number of cells, n=550). B. Quantification of relative p65 nuclear levels in MCF10A ATM KO cells treated for 4 h with CPT (20 μM) in the presence or absence of the indicated HDAC inhibitors. When indicated, cells were treated were treated with recombinant human IL-1α (1.25 ng/mL), 30 min before fixation. Red lines indicate the mean. (Number of cells, n=550). C. Quantification of p65 nuclear levels in MCF10A WT cells treated with ETP (50 μM) for 4 h in the presence or absence of the indicated HDAC inhibitors. Red lines indicate the mean. (Number of cells, n=550). D. U2OS cells were transfected with indicated IL-1α-Flag constructs. Cells were subsequently treated UV (10 mJ/cm2) + ATMi (10 μM) for 4 h. Relative nuclear p65 levels were then quantified by immunofluorescence. Red lines indicate the mean. (Number of cells, n=550). E-F. MCF10A cells were treated with CPT (20 μM), UV (10 mJ/cm2), ActD (5 μM), ETP (50 μM) for 4 h (E) or HDACi#1 (10μM) (F) for 10h and the levels of H3K27ac, H3K9ac and total H3 were analyzed by western blot. G. Levels of IL-1α, H3, and GAPDH in the soluble and chromatin fractions of UV-treated cells in the presence or absence of HDACi were analyzed by western blot. H-I. MCF10A cells were treated with UV (10 mJ/cm2) + ATMi (10 μM) for 4 h in the presence or absence of IL-1RA (250 ng/mL). When indicated, cells were pre-treated with A485 (10 μM) (H) or C646 (10 μM) (I).
Extended Data Figure 13:
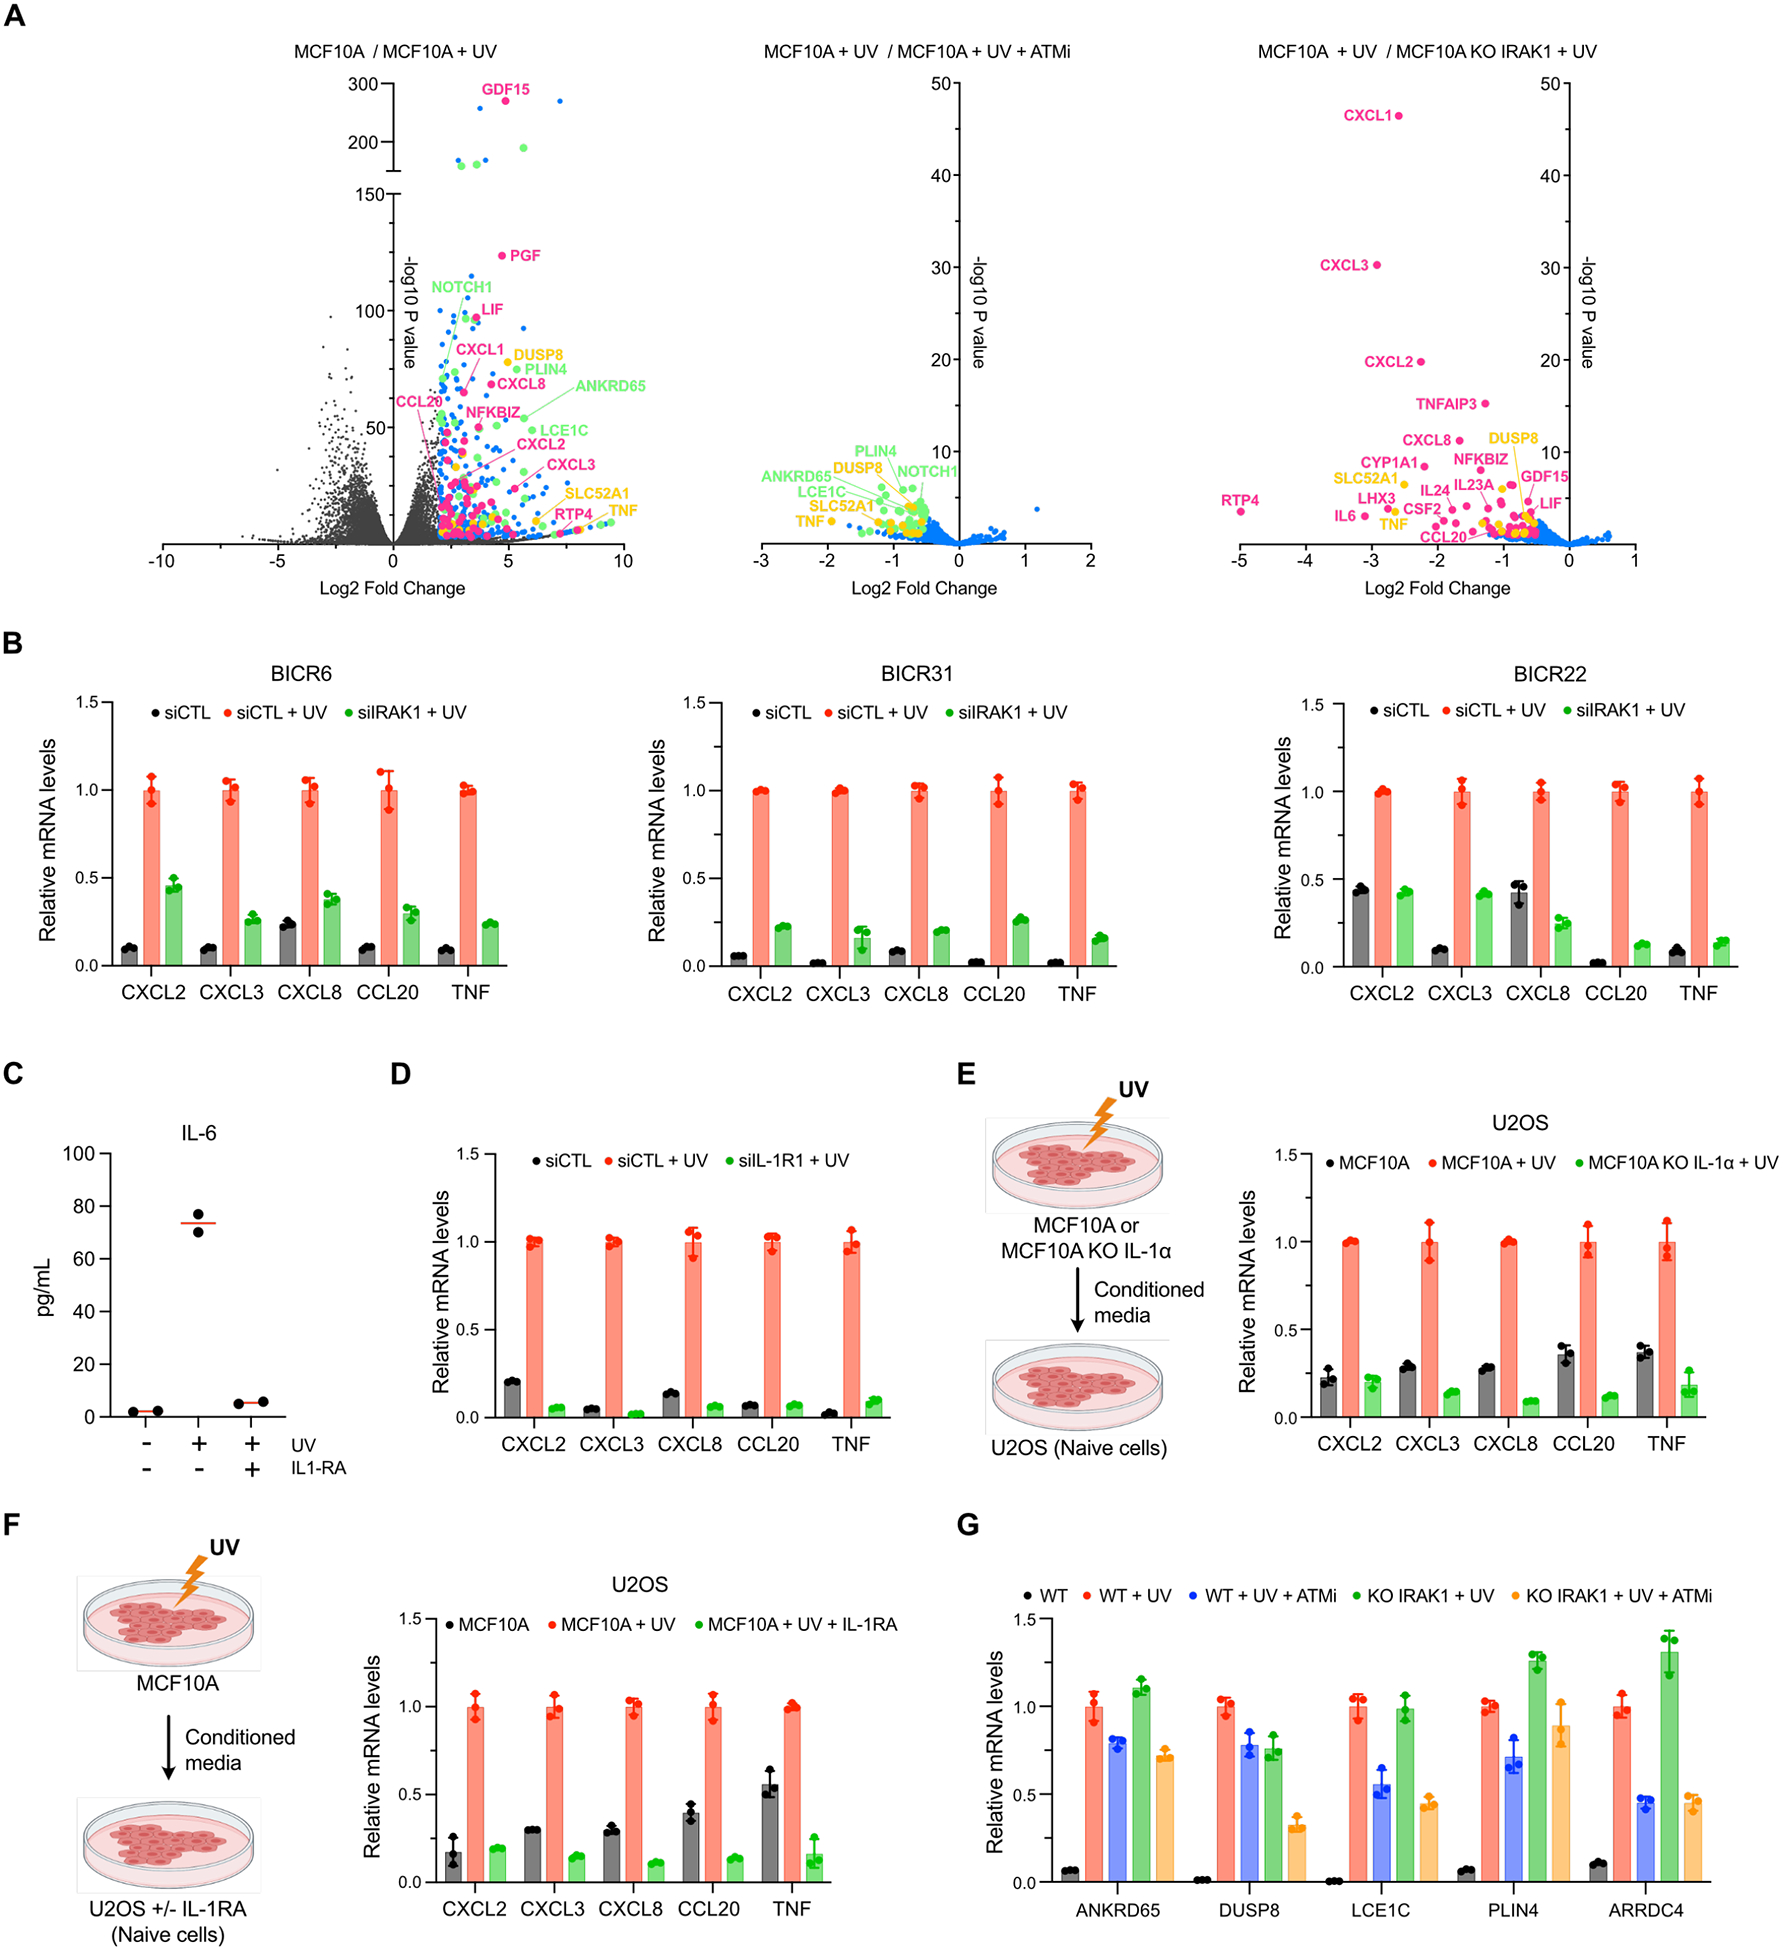
A. Volcano plots of differentially expressed genes in MCF10A WT or IRAK1 KO#7 cells treated with UV (10 mJ/cm2) for 12 h in the presence or absence of ATMi (10 μM). Data are derived from n = 2 biological replicates. B. MCF10A WT cells were treated with UV (10 mJ/cm2) ± IL-1RA (250 ng/mL). The levels of IL-6 were then analyzed in the conditioned media by ELISA. Red lines indicate the mean. C. BICR6, BICR31 and BICR22 cells were treated with UV (10 mJ/cm2) for 12h. Then CXCL2, CXCL3, CXCL8, CCL20, and TNF mRNA levels were quantified by RT-qPCR. Each target was normalized to the highest expressing condition. Mean values ± SD (n = 3). D. CXCL2, CXCL3, CXCL8, CCL20, and TNF mRNA levels were measured by RT-qPCR in MCF10A cells known-down for IL-1R1 treated with UV (10 mJ/cm2) for 12 h. Each target was normalized to the highest expressing condition. Mean values ± SD (n = 3). E. Indicated cell lines were treated with UV (10 mJ/cm2) for 4h. The conditioned media was collected and added to U2OS naive cells for 30 min. CXCL2, CXCL3, CXCL8, CCL20, and TNF mRNA levels were then measured by RT-qPCR in U2OS cells. Each target was normalized to the highest expressing condition. Mean values ± SD (n = 3). F. MCF10A cells were treated with UV (10 mJ/cm2) for 4h. The conditioned media was collected and added to U2OS naive cells for 30 min ± IL-1RA (250 ng/mL) (with 1h pretreatment). CXCL2, CXCL3, CXCL8, CCL20, and TNF mRNA levels were then monitored by RT-qPCR in U2OS cells. Each target was normalized to the highest expressing condition. Mean values ± SD (n = 3). G. The levels of ANKRD65, DUSP8, LCE1C, PLIN4, and ARRDC4 mRNA were analyzed by RT-qPCR in MCF10A WT or IRAK1 KO cells treated with UV (10 mJ/cm2) ± ATMi (10 μM) for 12 h. Each target was normalized to the MCF10A WT+UV sample. Mean values ± SD (n = 3).
Extended Data Figure 14:

A. BICR6, BICR31, and BICR22 cells were treated with CPT (2.5 μM) for 12 h. CXCL2, CXCL3, CXCL8, CCL20, and TNF mRNA levels were then quantified by RT-qPCR. Each target was normalized to the highest expressing condition. Mean values ± SD (n = 3). B-C. CXCL2, CXCL3, CXCL8, CCL20, and TNF mRNA levels were measured by RT-qPCR in MCF10A KO p65 cells (B) or MCF10A cells known-down for IL-1R1 (C) treated with CPT (2.5 μM) for 12 h. Each target was normalized to the highest expressing condition. Mean values ± SD (n = 3).
Supplementary Material
ACKNOWLEDGMENTS
We thank Dr. Junjie Chen (MD Anderson Cancer Center) for providing MCF10A MAVS KO cells, Dr. Aimee Edinger (UCI) for providing HME1 cells, and Dr. Jerry Shay (University of Texas Southwestern) for providing HBEC3-KT cells. We also thank Dr. Nicholas Pannunzio for helpful discussion, and Casey Johnson and Dr. Melanie Oakes for their technical assistance. A.S. is supported by a National Institutes of Health Research Supplements to Promote Diversity in Health-Related Research (R37-CA252081-S1). S.O. is a Dr. Lorna Calin Scholar and was supported by the Faculty Mentor Program from the University of California, Irvine. A.M. is funded by a Graduate Research Fellowship from the National Science Foundation (DGE-1839285). L.M. is supported by a Center for Virus Research Graduate Fellowship funded by the UCI Division of Graduate Studies. Salary support for P.O. was provided by a California Institute for Regenerative Medicine (CIRM) stem cell biology training grant (TG2-01152) and an EMBO Postdoctoral fellowship (ALTF 213-2023). This work was funded by support from the National Institutes of Health R37-CA252081 (R.B.), P30-AR075047 seed grant (R.B.), R01-CA244519 (S.M.), R01-CA259370 (S.M.), R01-AI168130 (I.M.), and U01-AI150748 (I.M.). R.B. was supported by a Research Scholar Grant (RSG-24-1249960-01-DMC) from the American Cancer Society, the Concern Foundation, and a University of California Cancer Research Coordinating Committee (CRCC) award grant. This work was also made possible, in part, through access to the Genomics High Throughput Facility Shared Resource of the Chao Family Comprehensive Cancer Center Support Grant (P30-CA062203). Cartoons in the graphical abstract was generated with BioRender.com
DATA AVAILABILITY
The RNA sequencing data generated in this study have been deposited in the NCBI Sequence Read Archive, using the Bioproject Accession: PRJNA1063727. https://dataview.ncbi.nlm.nih.gov/object/PRJNA1063727?reviewer=ho8sj23bk0hnmb04gl5mhh4e8m
REFERENCES
- 1.Chatterjee N, and Walker GC (2017). Mechanisms of DNA damage, repair, and mutagenesis. Environ Mol Mutagen 58, 235–263. 10.1002/EM.22087. [DOI] [PMC free article] [PubMed] [Google Scholar]
- 2.Huang R, and Zhou PK (2021). DNA damage repair: historical perspectives, mechanistic pathways and clinical translation for targeted cancer therapy. Signal Transduction and Targeted Therapy 2021 6:1 6, 1–35. 10.1038/s41392-021-00648-7. [DOI] [PMC free article] [PubMed] [Google Scholar]
- 3.Ciccia A, and Elledge SJ (2010). The DNA damage response: making it safe to play with knives. Mol Cell 40, 179–204. 10.1016/j.molcel.2010.09.019. [DOI] [PMC free article] [PubMed] [Google Scholar]
- 4.Wu J, and Chen ZJ (2014). Innate immune sensing and signaling of cytosolic nucleic acids. Annu Rev Immunol 32, 461–488. 10.1146/annurev-immunol-032713-120156. [DOI] [PubMed] [Google Scholar]
- 5.Reisländer T, Groelly FJ, and Tarsounas M (2020). DNA Damage and Cancer Immunotherapy: A STING in the Tale. Mol Cell 80, 21–28. 10.1016/J.MOLCEL.2020.07.026. [DOI] [PubMed] [Google Scholar]
- 6.Pilger D, Seymour LW, and Jackson SP (2021). Interfaces between cellular responses to DNA damage and cancer immunotherapy. Genes Dev 35, 602–618. 10.1101/GAD.348314.121. [DOI] [PMC free article] [PubMed] [Google Scholar]
- 7.Ho JSY, Mok BWY, Campisi L, Jordan T, Yildiz S, Parameswaran S, Wayman JA, Gaudreault NN, Meekins DA, Indran SV, et al. (2021). TOP1 inhibition therapy protects against SARS-CoV-2-induced lethal inflammation. Cell 184, 2618–2632.e17. 10.1016/J.CELL.2021.03.051. [DOI] [PMC free article] [PubMed] [Google Scholar]
- 8.Rialdi A, Campisi L, Zhao N, Lagda AC, Pietzsch C, Ho JSY, Martinez-Gil L, Fenouil R, Chen X, Edwards M, et al. (2016). Topoisomerase 1 inhibition suppresses inflammatory genes and protects from death by inflammation. Science 352. 10.1126/SCIENCE.AAD7993. [DOI] [PMC free article] [PubMed] [Google Scholar]
- 9.Baranello L, Wojtowicz D, Cui K, Devaiah BN, Chung HJ, Chan-Salis KY, Guha R, Wilson K, Zhang X, Zhang H, et al. (2016). RNA Polymerase II Regulates Topoisomerase 1 Activity to Favor Efficient Transcription. Cell 165, 357–371. 10.1016/J.CELL.2016.02.036. [DOI] [PMC free article] [PubMed] [Google Scholar]
- 10.Harding SM, Benci JL, Irianto J, Discher DE, Minn AJ, and Greenberg RA (2017). Mitotic progression following DNA damage enables pattern recognition within micronuclei. Nature 548, 466–470. 10.1038/nature23470. [DOI] [PMC free article] [PubMed] [Google Scholar]
- 11.Mackenzie KJ, Carroll P, Martin C-A, Murina O, Fluteau A, Simpson DJ, Olova N, Sutcliffe H, Rainger JK, Leitch A, et al. (2017). cGAS surveillance of micronuclei links genome instability to innate immunity. Nature 548, 461–465. 10.1038/nature23449. [DOI] [PMC free article] [PubMed] [Google Scholar]
- 12.Bakhoum SF, Ngo B, Laughney AM, Cavallo JA, Murphy CJ, Ly P, Shah P, Sriram RK, Watkins TBK, Taunk NK, et al. (2018). Chromosomal instability drives metastasis through a cytosolic DNA response. Nature 553, 467–472. 10.1038/nature25432. [DOI] [PMC free article] [PubMed] [Google Scholar]
- 13.Hopfner KP, and Hornung V (2020). Molecular mechanisms and cellular functions of cGAS-STING signalling. Nat Rev Mol Cell Biol 21, 501–521. 10.1038/S41580-020-0244-X. [DOI] [PubMed] [Google Scholar]
- 14.Chen J, Harding SM, Natesan R, Tian L, Benci JL, Li W, Minn AJ, Asangani IA, and Greenberg RA (2020). Cell Cycle Checkpoints Cooperate to Suppress DNA- and RNA-Associated Molecular Pattern Recognition and Anti-Tumor Immune Responses. Cell Rep 32, 108080. 10.1016/j.celrep.2020.108080. [DOI] [PMC free article] [PubMed] [Google Scholar]
- 15.Liu S, Kwon M, Mannino M, Yang N, Renda F, Khodjakov A, and Pellman D (2018). Nuclear envelope assembly defects link mitotic errors to chromothripsis. Nature 561, 551–555. 10.1038/S41586-018-0534-Z. [DOI] [PMC free article] [PubMed] [Google Scholar]
- 16.Joo YK, Black EM, Trier I, Haakma W, Zou L, and Kabeche L (2023). ATR promotes clearance of damaged DNA and damaged cells by rupturing micronuclei. Mol Cell 83. 10.1016/J.MOLCEL.2023.09.003. [DOI] [PMC free article] [PubMed] [Google Scholar]
- 17.Tang S, Stokasimov E, Cui Y, and Pellman D (2022). Breakage of cytoplasmic chromosomes by pathological DNA base excision repair. Nature 606, 930–936. 10.1038/S41586-022-04767-1. [DOI] [PMC free article] [PubMed] [Google Scholar]
- 18.Mohr L, Toufektchan E, von Morgen P, Chu K, Kapoor A, and Maciejowski J (2021). ER-directed TREX1 limits cGAS activation at micronuclei. Mol Cell 81, 724–738.e9. 10.1016/j.molcel.2020.12.037. [DOI] [PMC free article] [PubMed] [Google Scholar]
- 19.Zhou W, Mohr L, Maciejowski J, and Kranzusch PJ (2021). cGAS phase separation inhibits TREX1-mediated DNA degradation and enhances cytosolic DNA sensing. Mol Cell 81, 739–755.e7. 10.1016/J.MOLCEL.2021.01.024. [DOI] [PMC free article] [PubMed] [Google Scholar]
- 20.Kolesnichenko M, Mikuda N, Höpken UE, Kärgel E, Uyar B, Tufan AB, Milanovic M, Sun W, Krahn I, Schleich K, et al. (2021). Transcriptional repression of NFKBIA triggers constitutive IKK- and proteasome-independent p65/RelA activation in senescence. EMBO J 40. 10.15252/EMBJ.2019104296. [DOI] [PMC free article] [PubMed] [Google Scholar]
- 21.Huang TT, Wuerzberger-Davis SM, Wu ZH, and Miyamoto S (2003). Sequential Modification of NEMO/IKKγ by SUMO-1 and Ubiquitin Mediates NF-κB Activation by Genotoxic Stress. Cell 115, 565–576. 10.1016/S0092-8674(03)00895-X. [DOI] [PubMed] [Google Scholar]
- 22.Kato T, Delhase M, Hoffmann A, and Karin M (2003). CK2 is a C-terminal IκB kinase responsible for NF-κB activation during the UV response. Mol Cell 12, 829–839. 10.1016/S1097-2765(03)00358-7. [DOI] [PubMed] [Google Scholar]
- 23.Hinz M, Stilmann M, Arslan SÇ, Khanna KK, Dittmar G, and Scheidereit C (2010). A Cytoplasmic ATM-TRAF6-cIAP1 Module Links Nuclear DNA Damage Signaling to Ubiquitin-Mediated NF-κB Activation. Mol Cell 40, 63–74. 10.1016/J.MOLCEL.2010.09.008. [DOI] [PubMed] [Google Scholar]
- 24.Miyamoto S (2011). Nuclear initiated NF-κB signaling: NEMO and ATM take center stage. Preprint at Nature Publishing Group, 10.1038/cr.2010.179 [DOI] [PMC free article] [PubMed] [Google Scholar]
- 25.Blackford AN, and Jackson SP (2017). ATM, ATR, and DNA-PK: The Trinity at the Heart of the DNA Damage Response. Mol Cell 66, 801–817. 10.1016/J.MOLCEL.2017.05.015. [DOI] [PubMed] [Google Scholar]
- 26.Dunphy G, Flannery SM, Almine JF, Connolly DJ, Paulus C, Jønsson KL, Jakobsen MR, Nevels MM, Bowie AG, and Unterholzner L (2018). Non-canonical Activation of the DNA Sensing Adaptor STING by ATM and IFI16 Mediates NF-κB Signaling after Nuclear DNA Damage. Mol Cell 71, 745–760.e5. 10.1016/j.molcel.2018.07.034. [DOI] [PMC free article] [PubMed] [Google Scholar]
- 27.Wu ZH, and Miyamoto S (2008). Induction of a pro-apoptotic ATM–NF-κB pathway and its repression by ATR in response to replication stress. EMBO J 27, 1963–1973. 10.1038/EMBOJ.2008.127. [DOI] [PMC free article] [PubMed] [Google Scholar]
- 28.Wu ZH, Wong ET, Shi Y, Niu J, Chen Z, Miyamoto S, and Tergaonkar V (2010). ATM- and NEMO-dependent ELKS ubiquitination coordinates TAK1-mediated IKK activation in response to genotoxic stress. Mol Cell 40, 75–86. 10.1016/J.MOLCEL.2010.09.010. [DOI] [PMC free article] [PubMed] [Google Scholar]
- 29.Li N, Banin S, Ouyang H, Li GC, Courtois G, Shiloh Y, Karin M, and Rotman G (2001). ATM Is Required for IκB Kinase (IKK) Activation in Response to DNA Double Strand Breaks. Journal of Biological Chemistry 276, 8898–8903. 10.1074/JBC.M009809200. [DOI] [PubMed] [Google Scholar]
- 30.Wuerzberger-Davis SM, Nakamura Y, Seufzer BJ, and Miyamoto S (2007). NF-κB activation by combinations of NEMO SUMOylation and ATM activation stresses in the absence of DNA damage. Oncogene 26, 641–651. 10.1038/sj.onc.1209815. [DOI] [PubMed] [Google Scholar]
- 31.Biton S, and Ashkenazi A (2011). NEMO and RIP1 Control Cell Fate in Response to Extensive DNA Damage via TNF-α Feedforward Signaling. Cell 145, 92–103. 10.1016/J.CELL.2011.02.023. [DOI] [PubMed] [Google Scholar]
- 32.Toledo LI, Altmeyer M, Rask M-B, Lukas C, Larsen DH, Povlsen LK, Bekker-Jensen S, Mailand N, Bartek J, and Lukas J (2013). ATR prohibits replication catastrophe by preventing global exhaustion of RPA. Cell 155, 1088–1103. 10.1016/j.cell.2013.10.043. [DOI] [PubMed] [Google Scholar]
- 33.Rahmanian N, Shokrzadeh M, and Eskandani M (2021). Recent advances in γH2AX biomarker-based genotoxicity assays: A marker of DNA damage and repair. DNA Repair (Amst) 108. 10.1016/J.DNAREP.2021.103243. [DOI] [PubMed] [Google Scholar]
- 34.Nishitani H, Lygerou Z, and Nishimoto T (2004). Proteolysis of DNA Replication Licensing Factor Cdt1 in S-phase Is Performed Independently of Geminin through Its N-terminal Region. Journal of Biological Chemistry 279, 30807–30816. 10.1074/JBC.M312644200. [DOI] [PubMed] [Google Scholar]
- 35.Pommier Y (2006). Topoisomerase I inhibitors: camptothecins and beyond. Nat Rev Cancer 6, 789–802. 10.1038/NRC1977. [DOI] [PubMed] [Google Scholar]
- 36.Pommier Y, Nussenzweig A, Takeda S, and Austin C (2022). Human topoisomerases and their roles in genome stability and organization. Nat Rev Mol Cell Biol 23, 407–427. 10.1038/S41580-022-00452-3. [DOI] [PMC free article] [PubMed] [Google Scholar]
- 37.Yamamoto Y, and Gaynor RB (2004). IκB kinases: Key regulators of the NF-κB pathway. Trends Biochem Sci 29, 72–79. 10.1016/j.tibs.2003.12.003. [DOI] [PubMed] [Google Scholar]
- 38.Yazinski SA, and Zou L (2016). Functions, Regulation, and Therapeutic Implications of the ATR Checkpoint Pathway. Annu Rev Genet. 10.1146/annurev-genet-121415-121658. [DOI] [PubMed] [Google Scholar]
- 39.Maréchal A, and Zou L (2013). DNA damage sensing by the ATM and ATR kinases. Cold Spring Harb Perspect Biol 5. 10.1101/cshperspect.a012716. [DOI] [PMC free article] [PubMed] [Google Scholar]
- 40.Zhang H, Xiong Y, Su D, Wang C, Srivastava M, Tang M, Feng X, Huang M, Chen Z, and Chen J (2022). TDP1-independent pathways in the process and repair of TOP1-induced DNA damage. Nat Commun 13. 10.1038/S41467-022-31801-7. [DOI] [PMC free article] [PubMed] [Google Scholar]
- 41.Milano L, Gautam A, and Caldecott KW (2023). DNA damage and transcription stress. Mol Cell 0. 10.1016/J.MOLCEL.2023.11.014. [DOI] [PubMed] [Google Scholar]
- 42.Perry RP, and Kelley DE (1970). Inhibition of RNA synthesis by actinomycin D: characteristic dose-response of different RNA species. J Cell Physiol 76, 127–139. 10.1002/JCP.1040760202. [DOI] [PubMed] [Google Scholar]
- 43.Vispé S, DeVries L, Créancier L, Besse J, Bréand S, Hobson DJ, Svejstrup JQ, Annereau JP, Cussac D, Dumontet C, et al. (2009). Triptolide is an inhibitor of RNA polymerase I and II-dependent transcription leading predominantly to down-regulation of short-lived mRNA. Mol Cancer Ther 8, 2780–2790. 10.1158/1535-7163.MCT-09-0549/354923/P/TRIPTOLIDE-IS-AN-INHIBITOR-OF-RNA-POLYMERASE-I-AND. [DOI] [PubMed] [Google Scholar]
- 44.Kwiatkowski N, Zhang T, Rahl PB, Abraham BJ, Reddy J, Ficarro SB, Dastur A, Amzallag A, Ramaswamy S, Tesar B, et al. (2014). Targeting transcription regulation in cancer with a covalent CDK7 inhibitor. Nature 2014 511:7511 511, 616–620. 10.1038/nature13393. [DOI] [PMC free article] [PubMed] [Google Scholar]
- 45.Anshabo AT, Milne R, Wang S, and Albrecht H (2021). CDK9: A Comprehensive Review of Its Biology, and Its Role as a Potential Target for Anti-Cancer Agents. Front Oncol 11, 678559. 10.3389/FONC.2021.678559/BIBTEX. [DOI] [PMC free article] [PubMed] [Google Scholar]
- 46.Cristini A, Ricci G, Britton S, Salimbeni S, Huang S. yin N., Marinello J, Calsou P, Pommier Y, Favre G, Capranico G, et al. (2019). Dual Processing of R-Loops and Topoisomerase I Induces Transcription-Dependent DNA Double-Strand Breaks. Cell Rep 28, 3167–3181.e6. 10.1016/j.celrep.2019.08.041. [DOI] [PMC free article] [PubMed] [Google Scholar]
- 47.Tigano M, Vargas DC, Tremblay-Belzile S, Fu Y, and Sfeir A (2021). Nuclear sensing of breaks in mitochondrial DNA enhances immune surveillance. Nature 591, 477–481. 10.1038/s41586-021-03269-w. [DOI] [PubMed] [Google Scholar]
- 48.Hornung V, Ellegast J, Kim S, Brzózka K, Jung A, Kato H, Poeck H, Akira S, Conzelmann K-K, Schlee M, et al. (2006). 5’-Triphosphate RNA is the ligand for RIG-I. Science 314, 994–997. 10.1126/science.1132505. [DOI] [PubMed] [Google Scholar]
- 49.Silverman N, and Maniatis T (2001). NF-kappaB signaling pathways in mammalian and insect innate immunity. Genes Dev 15, 2321–2342. 10.1101/GAD.909001. [DOI] [PubMed] [Google Scholar]
- 50.Walsh MC, Lee J, and Choi Y (2015). Tumor necrosis factor receptor associated factor 6 (TRAF6) regulation of development, function, and homeostasis of the immune system. Immunol Rev 266, 72. 10.1111/IMR.12302. [DOI] [PMC free article] [PubMed] [Google Scholar]
- 51.Lin P, Lin C, He R, Chen H, Teng Z, Yao H, Liu S, Hoffman RM, Ye J, and Zhu G (2023). TRAF6 regulates the abundance of RIPK1 and inhibits the RIPK1/RIPK3/MLKL necroptosis signaling pathway and affects the progression of colorectal cancer. Cell Death & Disease 2022 14:1 14, 1–12. 10.1038/s41419-022-05524-y. [DOI] [PMC free article] [PubMed] [Google Scholar]
- 52.Medzhitov R, Preston-Hurlburt P, Kopp E, Stadlen A, Chen C, Ghosh S, and Janeway CA (1998). MyD88 Is an Adaptor Protein in the hToll/IL-1 Receptor Family Signaling Pathways. Mol Cell 2, 253–258. 10.1016/S1097-2765(00)80136-7. [DOI] [PubMed] [Google Scholar]
- 53.Carter DB, Deibel MR, Dunn CJ, Tomich CSC, Laborde AL, Slightom JL, Berger AE, Bienkowski MJ, Sun FF, McEwan RN, et al. (1990). Purification, cloning, expression and biological characterization of an interleukin-1 receptor antagonist protein. Nature 344, 633–638. 10.1038/344633A0. [DOI] [PubMed] [Google Scholar]
- 54.Hannum CH, Wilcox CJ, Arend WP, Joslin FG, Dripps DJ, Heimdal PL, Armes LG, Sommer A, Eisenberg SP, and Thompson RC (1990). Interleukin-1 receptor antagonist activity of a human interleukin-1 inhibitor. Nature 343, 336–340. 10.1038/343336A0. [DOI] [PubMed] [Google Scholar]
- 55.Eisenberg SP, Evans RJ, Arend WP, Verderber E, Brewer MT, Hannum CH, and Thompson RC (1990). Primary structure and functional expression from complementary DNA of a human interleukin-1 receptor antagonist. Nature 343, 341–346. 10.1038/343341A0. [DOI] [PubMed] [Google Scholar]
- 56.Dinarello CA (2018). Overview of the IL-1 family in innate inflammation and acquired immunity. Immunol Rev 281, 8. 10.1111/IMR.12621. [DOI] [PMC free article] [PubMed] [Google Scholar]
- 57.Malik A, and Kanneganti TD (2018). Function and regulation of IL-1α in inflammatory diseases and cancer. Immunol Rev 281, 124. 10.1111/IMR.12615. [DOI] [PMC free article] [PubMed] [Google Scholar]
- 58.Di Paolo NC, and Shayakhmetov DM (2016). Interleukin 1α and the inflammatory process. Nat Immunol 17, 906. 10.1038/NI.3503. [DOI] [PMC free article] [PubMed] [Google Scholar]
- 59.Lamacchia C, Rodriguez E, Palmer G, and Gabay C (2013). Endogenous IL-1α is a chromatin-associated protein in mouse macrophages. Cytokine 63, 135–144. 10.1016/J.CYTO.2013.04.010. [DOI] [PubMed] [Google Scholar]
- 60.Idan C, Peleg R, Elena V, Martin T, Cicerone T, Mareike W, Lydia B, Marina F, Gerhard M, Elisa FM, et al. (2015). IL-1α is a DNA damage sensor linking genotoxic stress signaling to sterile inflammation and innate immunity. Sci Rep 5. 10.1038/SREP14756. [DOI] [PMC free article] [PubMed] [Google Scholar]
- 61.Werman A, Werman-Venkert R, White R, Lee JK, Werman B, Krelin Y, Voronov E, Dinarello CA, and Apte RN (2004). The precursor form of IL-1alpha is an intracrine proinflammatory activator of transcription. Proc Natl Acad Sci U S A 101, 2434–2439. 10.1073/PNAS.0308705101. [DOI] [PMC free article] [PubMed] [Google Scholar]
- 62.Buryskova M, Pospisek M, Grothey A, Simmet T, and Burysek L (2004). Intracellular interleukin-1alpha functionally interacts with histone acetyltransferase complexes. J Biol Chem 279, 4017–4026. 10.1074/JBC.M306342200. [DOI] [PubMed] [Google Scholar]
- 63.Zamostna B, Novak J, Vopalensky V, Masek T, Burysek L, and Pospisek M (2012). N-Terminal Domain of Nuclear IL-1α Shows Structural Similarity to the C-Terminal Domain of Snf1 and Binds to the HAT/Core Module of the SAGA Complex. PLoS One 7. 10.1371/JOURNAL.PONE.0041801. [DOI] [PMC free article] [PubMed] [Google Scholar]
- 64.Jin Q, Yu LR, Wang L, Zhang Z, Kasper LH, Lee JE, Wang C, Brindle PK, Dent SYR, and Ge K (2011). Distinct roles of GCN5/PCAF-mediated H3K9ac and CBP/p300-mediated H3K18/27ac in nuclear receptor transactivation. EMBO J 30, 249–262. 10.1038/EMBOJ.2010.318. [DOI] [PMC free article] [PubMed] [Google Scholar]
- 65.Leoni F, Fossati G, Lewis EC, Lee J-K, Porro G, Pagani P, Modena D, Moras ML, Pozzi P, Reznikov LL, et al. (2005). The histone deacetylase inhibitor ITF2357 reduces production of pro-inflammatory cytokines in vitro and systemic inflammation in vivo. Mol Med 11, 1–15. 10.2119/2006-00005.DINARELLO. [DOI] [PMC free article] [PubMed] [Google Scholar]
- 66.Martin BJE, Brind’Amour J, Kuzmin A, Jensen KN, Liu ZC, Lorincz M, and Howe LAJ (2021). Transcription shapes genome-wide histone acetylation patterns. Nature Communications 2021 12:1 12, 1–9. 10.1038/s41467-020-20543-z. [DOI] [PMC free article] [PubMed] [Google Scholar]
- 67.Bouvier D, Ferrand J, Chevallier O, Paulsen MT, Ljungman M, and Polo SE (2021). Dissecting regulatory pathways for transcription recovery following DNA damage reveals a non-canonical function of the histone chaperone HIRA. Nature Communications 2021 12:1 12, 1–16. 10.1038/s41467-021-24153-1. [DOI] [PMC free article] [PubMed] [Google Scholar]
- 68.Liu T, Zhang L, Joo D, and Sun SC (2017). NF-κB signaling in inflammation. Signal Transduction and Targeted Therapy 2017 2:1 2, 1–9. 10.1038/sigtrans.2017.23. [DOI] [PMC free article] [PubMed] [Google Scholar]
- 69.McCool KW, and Miyamoto S (2012). DNA damage-dependent NF-κB activation: NEMO turns nuclear signaling inside out. Immunol Rev 246, 311–326. 10.1111/J.1600-065X.2012.01101.X. [DOI] [PMC free article] [PubMed] [Google Scholar]
- 70.Aragane Y, Kulms D, Luger TA, and Schwarz T (1997). Down-regulation of interferon γ-activated STAT1 by UV light. Proc Natl Acad Sci U S A 94, 11490–11495. 10.1073/PNAS.94.21.11490/ASSET/79AFAF59-23E5-41C6-B6AE-4A339E1A5A21/ASSETS/GRAPHIC/PQ2171201005.JPEG. [DOI] [PMC free article] [PubMed] [Google Scholar]
- 71.Aragane Y, Schwarz A, Luger TA, Ariizumi K, Takashima A, and Schwarz T (1997). Ultraviolet light suppresses IFN-gamma-induced IL-7 gene expression in murine keratinocytes by interfering with IFN regulatory factors. The Journal of Immunology 158, 5393–5399. 10.4049/JIMMUNOL.158.11.5393. [DOI] [PubMed] [Google Scholar]
- 72.Almine JF, O’Hare CAJ, Dunphy G, Haga IR, Naik RJ, Atrih A, Connolly DJ, Taylor J, Kelsall IR, Bowie AG, et al. (2017). IFI16 and cGAS cooperate in the activation of STING during DNA sensing in human keratinocytes. Nature Communications 2017 8:1 8, 1–15. 10.1038/ncomms14392. [DOI] [PMC free article] [PubMed] [Google Scholar]
- 73.Li Y, Shah RB, Sarti S, Belcher AL, Lee BJ, Gorbatenko A, Nemati F, Yu I, Stanley Z, Shao Z, et al. (2023). A Non-Canonical IRAK Signaling Pathway Triggered by DNA Damage. bioRxiv. 10.1101/2023.02.08.527716. [DOI] [Google Scholar]
- 74.Liu PH, Shah RB, Li Y, Arora A, Ung PMU, Raman R, Gorbatenko A, Kozono S, Zhou XZ, Brechin V, et al. (2019). An IRAK1-PIN1 signalling axis drives intrinsic tumour resistance to radiation therapy. Nat Cell Biol 21, 203–213. 10.1038/S41556-018-0260-7. [DOI] [PMC free article] [PubMed] [Google Scholar]
- 75.Chien Y, Scuoppo C, Wang X, Fang X, Balgley B, Bolden JE, Premsrirut P, Luo W, Chicas A, Lee CS, et al. (2011). Control of the senescence-associated secretory phenotype by NF-κB promotes senescence and enhances chemosensitivity. Genes Dev 25, 2125. 10.1101/GAD.17276711. [DOI] [PMC free article] [PubMed] [Google Scholar]
- 76.Xia T, Konno H, Ahn J, and Barber GN (2016). Deregulation of STING Signaling in Colorectal Carcinoma Constrains DNA Damage Responses and Correlates With Tumorigenesis. Cell Rep 14, 282–297. 10.1016/j.celrep.2015.12.029. [DOI] [PMC free article] [PubMed] [Google Scholar]
- 77.Konno H, Yamauchi S, Berglund A, Putney RM, Mulé JJ, and Barber GN (2018). Suppression of STING signaling through epigenetic silencing and missense mutation impedes DNA damage mediated cytokine production. Oncogene 37, 2037–2051. 10.1038/s41388-017-0120-0. [DOI] [PMC free article] [PubMed] [Google Scholar]
- 78.Grivennikov SI, Greten FR, and Karin M (2010). Immunity, inflammation, and cancer. Cell 140, 883–899. 10.1016/J.CELL.2010.01.025. [DOI] [PMC free article] [PubMed] [Google Scholar]
- 79.Li J, Hubisz MJ, Earlie EM, Duran MA, Hong C, Varela AA, Lettera E, Deyell M, Tavora B, Havel JJ, et al. (2023). Non-cell-autonomous cancer progression from chromosomal instability. Nature 2023 620:7976 620, 1080–1088. 10.1038/s41586-023-06464-z. [DOI] [PMC free article] [PubMed] [Google Scholar]
- 80.Diep S, Maddukuri M, Yamauchi S, Geshow G, and Delk NA (2022). Interleukin-1 and Nuclear Factor Kappa B Signaling Promote Breast Cancer Progression and Treatment Resistance. Cells 11. 10.3390/CELLS11101673. [DOI] [PMC free article] [PubMed] [Google Scholar]
- 81.Mantovani A, Barajon I, and Garlanda C (2018). IL-1 and IL-1 Regulatory Pathways in Cancer Progression and Therapy. Immunol Rev 281, 57. 10.1111/IMR.12614. [DOI] [PMC free article] [PubMed] [Google Scholar]
- 82.Feng X, Tubbs A, Zhang C, Tang M, Sridharan S, Wang C, Jiang D, Su D, Zhang H, Chen Z, et al. (2020). ATR inhibition potentiates ionizing radiation‐induced interferon response via cytosolic nucleic acid‐sensing pathways. EMBO J 39. 10.15252/embj.2019104036. [DOI] [PMC free article] [PubMed] [Google Scholar]
Associated Data
This section collects any data citations, data availability statements, or supplementary materials included in this article.
Supplementary Materials
Data Availability Statement
The RNA sequencing data generated in this study have been deposited in the NCBI Sequence Read Archive, using the Bioproject Accession: PRJNA1063727. https://dataview.ncbi.nlm.nih.gov/object/PRJNA1063727?reviewer=ho8sj23bk0hnmb04gl5mhh4e8m