

Abstract
Background
Genetic linkage studies have identified two susceptibility loci for essential tremor (ET) on chromosomes 3q13 (ETM1) and 2p24.1 (ETM2). Linkage disequilibrium studies in separate population samples from the United States and Singapore suggest an association between ET and loci at ETM2.
Methods
Fine mapping studies were conducted on multiplex and singleton US families linked to ETM2 using newly detected loci within the candidate interval to establish the minimal critical region (MCR) harboring an ET gene. The genes and transcripts within this interval were systematically analyzed by single-strand conformational polymorphism analysis and DNA sequencing.
Results
A 464-kb region between loci D2S2150 and etm1231 was defined as the MCR. The coding regions and flanking intronic splice sites of two genes and seven transcripts in this interval were evaluated for mutations. A missense mutation (828C→G) in the transcript FLJ14249 (HS1-BP3) was identified in one US family. This mutation was found in another apparently unrelated US family with ET and was absent in 150 control samples (300 chromosomes). The 828C→G mutation causes a substitution of a glycine for an alanine residue in the HS1-BP3 protein. The HS1-BP3 protein binds to proteins that are highly expressed in motor neurons and Purkinje cells and regulate the Ca2+/calmodulin-dependent protein kinase activation of tyrosine and tryptophan hydroxylase.
Conclusions
A rare variant in the HS1-BP3 gene that is associated with essential tremor (ET) in two families is reported. This finding will facilitate research on the functional role of this gene and related genes in the pathogenesis of ET.
Essential tremor (ET) is a common neurologic disorder in humans with an overall prevalence ranging between 4.1 and 39.2 cases per 1,000 persons.1 ET is a complex trait that is associated with genetic,2–7 environmental,8 and metabolic9–11 etiologies. A dominantly inherited classic form of ET is genetically linked to two loci on chromosomes 3q13 (ETM1)2,3 and 2p24.1 (ETM2)4–7 in families from different parts of the world. The ETM1 locus is reported in Icelandic2 and Tajik3 families, and the ETM2 locus is associated with US4–6 and Singaporean7 families. Other families are described that are not linked to either loci.3,12,13 In addition to being a genetically heterogeneous disorder, ET exhibits variable expression and reduced penetrance.14–16 The ET phenotype is comorbid with several other neurologic disorders including dystonia, malignant hyperthermia,17 parkinsonism,18 migraines,19 and the fragile X premutation.20 Besides inter- and intrafamilial variability, there are phenotypic differences between the sexes, with head tremor being more common in females.21,22 In the past, ET was thought to be a benign condition, but there is increasing evidence from better neuroimaging techniques that some forms may behave as a neurodegenerative disorder with involvement of the cerebellar circuitry.11,23
In an effort to identify the genes involved in families with ET genetically linked to ETM2, we have physically mapped the region,24 evaluated multiplex families for crossovers with newly detected markers from the region,6,7 and systematically analyzed the genes in the interval for mutations associated with the classic ET phenotype. In this report, we describe a gene variation in the HS1-binding protein 3 gene (HS1-BP3) that is associated with ET in two apparently unrelated families. The gene product may have functional relevance to ET as it is a binding protein that may regulate proteins encoded by other genes within the ETM1 and ETM2 candidate intervals. Furthermore, these proteins are highly expressed in the cerebellum and may modulate key enzymes in catecholamine and serotonin metabolism.
Methods
Study design and selection criteria
The Mid-Hudson Family Health Institute, the Baylor College of Medicine, and the Singapore General Hospital Institutional Review Boards approved the collection of samples for this research study. Personal identifiers were removed from all samples prior to genetic analyses. Informed consent was obtained from each individual before genetic and clinical testing. Phenotypes were assigned by the authors in accordance with the criteria established by NIH14 and the Tremor Investigation Group.25 All affected individuals had a diagnosis of definite or probable ET. The diagnosis was based on the presence of bilateral postural tremor of the hands or forearms that was visible and persistent with at least 1- to 2-cm excursions in at least one arm. Tremor assessments were made when the subjects’ arms were outstretched in front of the body or in a wing-beating position (e.g., the elbows partially flexed and the shoulders abducted in the horizontal plane). Subjects and families with other movement disorders such as parkinsonism, dystonia, myoclonus, peripheral neuropathy, or restless legs syndrome were excluded from the study. Twenty-one affected individuals with an early age at ET onset (≤30 years), each representing a white US multiplex family with at least three consecutive generations of the disorder, were initially included in the study. The study was extended to include other family members if a gene variant was present in affected representatives and not in controls. Five of the 21 US families were genetically linked to ETM2 on chromosome 2p, including four families that were published previously.5 The control group consisted of unrelated white US individuals older than age 60 without tremor and no family history of ET (n = 150). Seventy-three Singaporean individuals with ET from different families were previously found to be in linkage disequilibrium with ETM2 on chromosome 2p.7 This Singaporean sample was screened for the HS1-BP3 gene variant found in two US families shown in figures 1 and 2.
Figure 1.
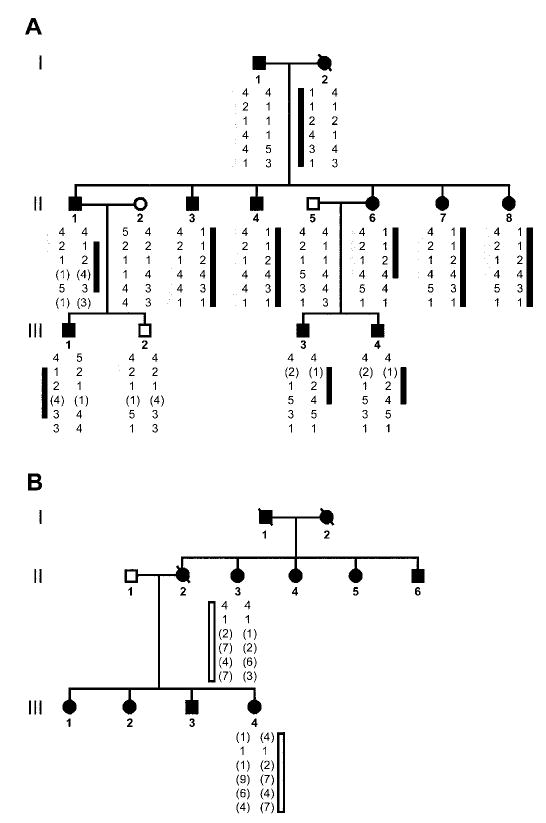
Fine mapping studies in two families with essential tremor and the 828C→G mutation in the HS1-BP3 gene. Six loci including D2S2150, rs3732149, rs11680700, etm1240, etm1231, and etm1234 were used in the analysis. (A) Haplotype analysis of the first family that was identified with 828C→G mutation in the HS1-BP3 gene. The dark bar represents the affected alleles inherited from Individual I-2. Individual II-1 shows a recombination at the first locus D2S2150. Individual II-6 shows a recombination at the fifth locus etm1231. The gray bar represents the affected alleles inherited from Individual I-1. Individual II-1 shows a recombination at either the fourth (etm1240) or the fifth (etm1231) locus. No other recombinants are found telomeric to these loci on the ETM2 candidate contig.24 (B) Haplotype analysis of the second family with the 828C→G mutation in the HS1-BP3 gene. The white bar represents the alleles shared by Individuals II-3 and III-4. The extended haplotype for the six loci are different from the haplotypes in the family members shown in figure 1A. Black circles (females) and squares (males) represent affected individuals with essential tremor. Unaffected individuals are not shaded. Each generation is represented by Roman numerals to the left of the pedigrees. An individual is identified by generation number and the numbers below the symbols. The pedigree and individual identifiers in figure 1A are the same as in figure 2B. The pedigree and individual identifiers in figure 1B are the same as figure 2C.
Figure 2.
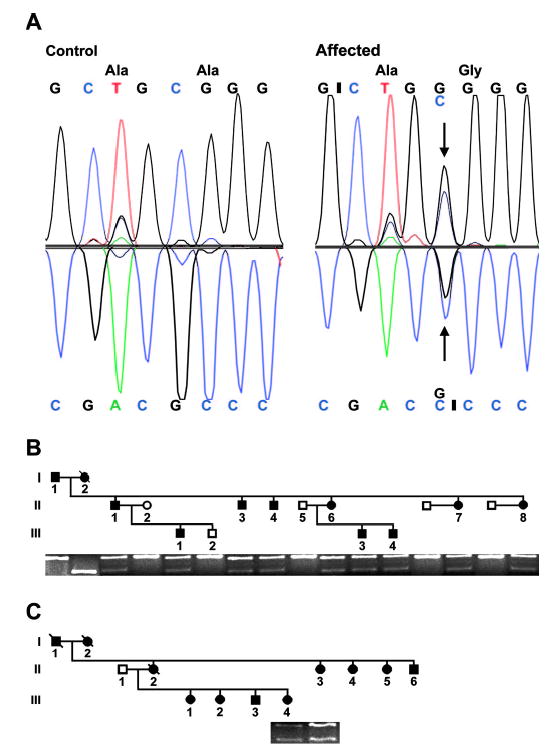
Characterization of the 828C→G variant (Gen-Bank accession no. NM_106552) in exon 7 of the HS1-binding protein 3 gene (HS1-BP3) in two families with essential tremor. (A) Direct sequencing of PCR products. (Left) The HS1-BP3 sequence between nucleotide (nt) 824 and 831 from a normal individual without tremor. (Right) An 828C→G substitution in an affected individual from the family in figure 1A. Above the nucleotide sequence is the amino acid sequence. The variant results in a substitution of a glycine (G) residue for an alanine (A) residue at codon 265 of the HS1-BP3 protein (NP_567825) (A265G). (B) A 1% agarose/0.1% ethidium bromide gel showing the BseYI restriction enzyme analysis of HS1-BP3 exon 7 in the family shown in figure 1A. The PCR products of normal individuals (open circles and squares) are cleaved by BseYI and show an upper band of 228 bp representing the wild-type allele. Affected individuals (shaded circles and squares) show a lower band of 170 bp, representing a mutant allele. Individual I-2 is homozygous for the mutant allele. (C) Affected Individuals II-3 and III-4 from the family shown in figure 1B with the presence of the 170-bp mutant allele.
Genotyping and linkage analysis
High molecular weight genomic DNA was isolated from whole-blood lysate by using the Puregene DNA extraction kit (Gentra Systems, Minneapolis, MN). Four polymorphic loci designated as D2S2150 (GenBank accession no. Z52057), etm1240 (BV012544), etm1231 (BV012542), and etm1234 (BV012543) and two single-nucleotide polymorphisms (SNPs) (rs3732149, rs1168070), were used in fine mapping studies (see figure 1). The sequences of the PCR primers at the polymorphic loci are found at http://www.ncbi.nih.gov/Genbank. Detailed information regarding the methods used to amplify these loci is described in appendix E-1 on the Neurology Web site at www.neurology.org. The PCR product containing the SNP rs3732149 (1,196A→G; NM_022460) was digested with the restriction enzyme Fnu4HI (New England BioLabs., Beverly, MA) using the manufacturer’s instructions. The PCR product was cut by Fnu4HI into equal fragments of 86 and 74 bp when the guanine (G) nucleotide was present and remained uncut at 160 bp when the adenosine (A) nucleotide was present. The PCR product containing the SNP rs11680709 (828C→G; NM_106552) was digested with the restriction enzyme BseYI (New England BioLabs, Beverly, MA) using the manufacturer’s instructions. The PCR product was cut by BseYI into three fragments (228, 60, and 36 bp) when the cytosine (C) nucleotide was present and cut into four fragments (170, 60, 58, and 36 bp) when the G nucleotide was present. Genotypes were assigned without prior knowledge of the study participant’s affection status.
Pairwise and multipoint linkage analyses were performed using the MLINK and LINKMAP programs of the FASTLINK package (version 4.1P).26–29 The lod score calculations assumed an autosomal dominant mode of inheritance, no gender differences, and a mutant gene frequency of 1/100. Allele frequencies were calculated in the control population and used in the analysis.
PCR single-strand conformational polymorphism mutational analysis
The coding regions and flanking intronic splice sites for the genes and transcripts within the interval between loci D2S2150 and etm1231 on reference sequence NT_015926 (http://www.ncbi.nlm.nih.gov) were amplified by PCR. The oligonucleotide primers and PCR conditions for each amplicon of the HS1-BP3 gene are found in table E-1 on the Neurology Web site. The PCR products were analyzed by single-strand conformational polymorphism30 (SSCP) in a panel of white affected individuals representing each of the 21 US families with ET (singletons) and compared with control samples. The SSCP method30 was modified to increase the sensitivity of the method as described in appendix E-1 on the Neurology Web site.
DNA sequencing
When differences in SSCP were found between affected singletons and control subjects, the samples were sequenced to define the nucleotide variations causing the mobility shift. M13 recognition sequences were added to the sense and antisense primers shown in table E-1 on the Neurology Web site for bidirectional DNA sequencing.
Reverse transcription PCR
Reverse transcription (RT) PCR was performed using the procedure for One Step RT-PCR provided by the manufacturer (USB Co., Cleveland, OH). This procedure was adapted to analyze the expression of HS1-BP3 by the methods described in appendix E-1 on the Neurology Web site.
Results
Fine mapping studies
Previous multipoint linkage analysis in four multiplex families suggested that an ET gene was in the 2.18-cM interval between loci D2S2150 and D2S220.5 Based on linkage disequilibrium mapping in 97 families with ET,6,7 we predicted that a gene for ET resided near locus etm1240. By analyzing crossover events in multiplex disease families with newly detected markers from the region, we were able to refine the localization of an ET gene to a minimal critical region (MCR) of 464 kb on a physical map24 between loci D2S2150 and etm1231. The lod scores were Zmax = 1.20 at θ = 0.00 for loci rs11680700 and etm1240 in the multiplex family in figure 1A. Haplotype analysis of this family suggested that individuals in the second generation were compound heterozygotes for two different ET mutations on chromosome 2p. For example, a mutation may be inherited from Individual I-2 and a separate mutation from Individual I-1 in figure 1A. Haplotype analysis of the individuals in the two families with the same rare sequence variant described below suggested that the families were not related (see figure 1).
Candidate gene mutational analysis
SSCP analysis of the two genes (ARHB, GDF7) and seven transcripts (LOC400947, LOC402070, LOC151451, LOC388928, FLJ14249, LOC440850, FLJ21820) within the 464-kb MCR identified mobility shifts in intron 4 of the transcript FLJ21820 and exon 7 of the transcript FLJ14249 that segregated with the ET phenotype. The other genes and transcripts did not show any significant changes between controls and affected singleton families. The DNA sequence analysis showed that the A allele (SNP rs2046325) in intron 4 of the transcript FLJ21820 was found in 48% of control subjects (n = 111) and 55% of affected singletons (n = 21). Two DNA sequence variants were found in exon 7 of the transcript FLJ14249. Oligonucleotide primers flanking the two coding sequence variants are found in table E-1 and labeled 7a and 7b. The 7a PCR product analyzed the sequence variant 1,196A→G (NM_022460) by an Fnu4HI restriction digest. The A allele (SNP rs3732149) was found in 87% of control subjects and 59% of affected singletons. The 7b PCR product analyzed the sequence variant 828C→G (NM_106552) by a BseYI restriction digest (figure 2A). The C allele was found in all of controls, whereas the G allele was not found in 150 controls (300 chromosomes). However, the G allele was found in 2 of the 21 affected singletons (see figure 2, B [Individual II-3] and C [Individual III-4]). The G allele variant that was found in these two individuals was identified in other affected members of their families (see figure 2, B and C). The normal C allele was present in all 73 individuals from singleton Singaporean families, but the rare variant G allele was not found in these families (146 chromosomes). The 828C→G variant causes a substitution of a glycine (G) residue for an alanine (A) residue at codon 265 of the HS1-BP3 protein (NP_567825) (A265G). DNA sequencing of the entire HS1-BP3 gene in individuals from the families in figures 1 and 2 did not show any other rare variants or mutations in the gene.
Description of FLJ14249 transcript
The FLJ14249 transcript was identified as part of a large-scale research effort to sequence human cDNA clones containing open reading frames.31 The FLJ14249 transcript is homologous to the murine Hs1-bp3 gene32 and is referred to as the human HS1-BP3 gene. The HS1-BP3 gene has seven exons with two putative alternatively spliced transcript variants that encode for distinct protein isoforms. The transcript variant 2 (NM_106552) is 1,795 bp and lacks an internal region present in the transcript variant 1 (NM_022460). The transcript variant 1 is 2,376 bp and encodes for a protein with a different C terminus. DNA sequencing was performed on 3,323 bp of the full-length transcript including each flanking splice site by using the oligonucleotide primers shown in table E-1 on the Neurology Web site. The 828C→G (NM_106552)–bp substitution that segregated with ET phenotype (see figure 2) is found in the transcript variant 2 at the C terminus. RT-PCR demonstrated abundant expression of the transcript variant 1 in normal human brain with minimal expression of the transcript variant 2. RT-PCR of human immortalized lymphocytes showed less expression of the transcript variant 2 as compared with human brain (data not shown).
Discussion
The 828C→G genetic variant in the HS1-BP3 gene that we describe was associated with ET in about 10% of the US families that we analyzed (n = 21) but was not found in Singaporeans with ET (n = 73). This rare variant was not present in 150 US control samples (300 chromosomes). This finding either suggests that the frequency of this allele is < 0.3% of normal elderly individuals without tremor or that this variant is a mutation that has an etiologic role in ET. Little is known about the HS1-BP3 gene or its functional role in the human brain. Our RT-PCR studies show that the HS1-BP3 gene and its two isoforms are expressed in the human brain, but its regional distribution and its tissue specificity need further study. The murine Hs1-bp3 gene is expressed in the brain and binds to Hs1 protein.32 Studies in humans also suggest that the HS1-BP3 gene encodes for a protein that binds to the human HS1 protein and other members of the 14-3-3 family of proteins such as hematopoetic cell-specific Lyn substrate 1 (HCLS1).33 The 14-3-3 family of proteins are highly conserved and represent 1% of the total cytosolic proteins in the human brain.34 These developmentally regulated proteins are largely expressed in Purkinje cells, motor neurons, and hippocampal pyramidal cells33,35,36 and are responsible for the Ca2+/calmodulin-dependent protein kinase activation of tyrosine and tryptophan hydroxylase.37,38 Their expression pattern and involvement in catecholamine and serotonin regulation suggest a role in the pathogenesis of tremor. It is interesting that the HS1 gene is within the ETM2 candidate interval on chromosome 2p in other families with ET5 that do not have the HS1-BP3 mutation. Mutations in the HS1 gene remain a potential cause of ET in these families and in the family in figure 1A because the locus D2S2150 is not recombinant (gray bar) and extends the candidate interval to include the HS1 gene (data not shown). In contrast, the haplotype (dark bar) inherited from Individual I-2 (see figure 1A delimits the interval between loci D2S2150 and etm1231 and excludes the HS1 gene. Another 14-3-3 gene, the HCLS1 gene (NM_005335), is a putative target for the gene product of HS1-BP3. This gene is also an excellent candidate for ET because it is found within the MCR for ETM1 on chromosome 3q13 in the Icelandic and Tajik populations.2,3 Studies are currently focused on identifying mutations within the HS1 and HCLS1 genes based on the hypothesis that these positional candidate genes may play a mechanistic role along with the HS1-BP3 gene in ET.
The pedigree structures that we describe in figures 1 and 2 are unusual for two reasons. First, both parents in the first generation transmit a highly penetrant, autosomal dominant trait to the next generation. The presence of two affected parents is not unexpected in ET because of the high prevalence of the disorder in the general population.1 The second unusual feature is that Individual I-2 (see figures 1A and 2B) is homozygous for the possible mutation. Therefore, all the children in Generation II are expected to be affected with the dominant trait. This is not expected in Generation III because the affected parent is heterozygous for the possible mutation. The situation is similar for the family shown in figures 1B and 2C except that all the individuals in Generation III are affected. These unusual pedigree structures illustrate that the variable penetrance and high prevalence of ET may complicate genetic linkage studies. For example, if one of the parents were not assigned the correct affection status or if both sides of the family lineage were not assessed, fine mapping studies would be unreliable. Unfortunately, many ET research investigators have relied on an “affecteds”-only model using a diagnosis of “definite” ET to assign the diagnosis.2–5,12,13 This model may lead to inaccurate phenotype assignment and confound genetic linkage studies on ET. If two or more physically distant, independent loci are involved and a dominant mode of inheritance is assumed, then some affected individuals in the second generation may inherit the affected allele from one (heterozygote) or both (compound heterozygote) parents. An admixture of heterozygotes and compound heterozygotes creates a situation where it is difficult to establish the inheritance of a dominant haplotype. The presence of all compound heterozygotes in the unusual pedigree in figure 1A increased the chances of identifying the segregation of the HS1-BP3 gene variant with ET. Further studies identified the same rare variant in another apparently unrelated family (see figures 1B and 2C) with a similar pedigree structure. The data suggest that digenic inheritance may be a mechanism in some families with ET.
In this article, we report the association of a rare variant in the HS1-BP3 gene on chromosome 2p with the ET phenotype in two apparently unrelated families. The functional role of the HS1-BP3 protein and related proteins such as HS1 and HCLS1 in the pathogenesis of ET is unknown, but their positions within the candidate regions for ET and their involvement in the regulation of neurotransmitter makes them attractive etiologic candidates.
Acknowledgments
The authors thank the US and Singaporean families for their participation.
Footnotes
Supported by grant no. R01 NS39353 from NIH (J.J.H.).
References
- 1.Louis ED, Ottman R, Hauser WA. How common is the most common adult movement disorder? Estimates of the prevalence of essential tremor throughout the world. Mov Disord. 1998;13:5–10. doi: 10.1002/mds.870130105. [DOI] [PubMed] [Google Scholar]
- 2.Gulcher JR, Jonsson P, Kong A, et al. Mapping of a familial essential tremor gene, FET1, to chromosome 3q13. Nat Genet. 1997;17:84–87. doi: 10.1038/ng0997-84. [DOI] [PubMed] [Google Scholar]
- 3.Illarioshkin SN, Rakhmonov RA, Ivanova-Smolenskaia IA, et al. [Molecular genetic analysis of essential tremor] Genetika. 2002;38:1704–1709. [PubMed] [Google Scholar]
- 4.Higgins JJ, Pho LT, Nee LE. A gene (ETM) for essential tremor maps to chromosome 2p22-p25. Mov Disord. 1997;12:859–864. doi: 10.1002/mds.870120605. [DOI] [PubMed] [Google Scholar]
- 5.Higgins JJ, Loveless JM, Jankovic J, Patel PI. Evidence that a gene for essential tremor maps to chromosome 2p in four families. Mov Disord. 1998;13:972–977. doi: 10.1002/mds.870130621. [DOI] [PubMed] [Google Scholar]
- 6.Higgins JJ, Jankovic J, Lombardi RQ, et al. Haplotype analysis of the ETM2 locus in familial essential tremor. Neurogenetics. 2003;4:185–189. doi: 10.1007/s10048-003-0151-2. [DOI] [PubMed] [Google Scholar]
- 7.Higgins J, Lombardi R, Tan E, Jankovic J, Pucilowska J, Rooney J. Haplotype analysis at the ETM2 locus in a Singaporean sample with familial essential tremor. Clin Genet. 2004;66:353–357. doi: 10.1111/j.1399-0004.2004.00306.x. [DOI] [PubMed] [Google Scholar]
- 8.Louis ED. Etiology of essential tremor: should we be searching for environmental causes? Mov Disord. 2001;16:822–829. doi: 10.1002/mds.1183. [DOI] [PubMed] [Google Scholar]
- 9.Louis ED, Zheng W, Jurewicz EC, et al. Elevation of blood beta-carboline alkaloids in essential tremor. Neurology. 2002;59:1940–1944. doi: 10.1212/01.wnl.0000038385.60538.19. [DOI] [PMC free article] [PubMed] [Google Scholar]
- 10.Sazci A, Ergul E, Bayulkem K. Association of the C677T and A1298C polymorphisms of methylenetetrahydrofolate reductase gene in patients with essential tremor in Turkey. Mov Disord. 2004;19:1472–1476. doi: 10.1002/mds.20254. [DOI] [PubMed] [Google Scholar]
- 11.Louis ED, Shungu DC, Chan S, Mao X, Jurewicz EC, Watner D. Metabolic abnormality in the cerebellum in patients with essential tremor: a proton magnetic resonance spectroscopic imaging study. Neurosci Lett. 2002;333:17–20. doi: 10.1016/s0304-3940(02)00966-7. [DOI] [PubMed] [Google Scholar]
- 12.Abbruzzese G, Pigullo S, Di Maria E, et al. Clinical and genetic study of essential tremor in the Italian population. Neurol Sci. 2001;22:39–40. doi: 10.1007/s100720170036. [DOI] [PubMed] [Google Scholar]
- 13.Kovach MJ, Ruiz J, Kimonis K, et al. Genetic heterogeneity in autosomal dominant essential tremor. Genet Med. 2001;3:197–199. doi: 10.1097/00125817-200105000-00009. [DOI] [PubMed] [Google Scholar]
- 14.Jankovic J. Essential tremor: clinical characteristics. Neurology. 2000;54:S21–S25. [PubMed] [Google Scholar]
- 15.Jankovic J. Essential tremor: a heterogenous disorder. Mov Disord. 2002;17:638–644. doi: 10.1002/mds.10221. [DOI] [PubMed] [Google Scholar]
- 16.Louis ED, Ford B, Frucht S, Ottman R. Mild tremor in relatives of patients with essential tremor: what does this tell us about the penetrance of the disease? Arch Neurol. 2001;58:1584–1589. doi: 10.1001/archneur.58.10.1584. [DOI] [PubMed] [Google Scholar]
- 17.Jankovic J, Beach J, Pandolfo M, Patel PI. Familial essential tremor in 4 kindreds. Prospects for genetic mapping. Arch Neurol. 1997;54:289–294. doi: 10.1001/archneur.1997.00550150047015. [DOI] [PubMed] [Google Scholar]
- 18.Yahr MD, Orosz D, Purohit DP. Co-occurrence of essential tremor and Parkinson’s disease: clinical study of a large kindred with autopsy findings. Parkinsonism. 2003;9:225–231. doi: 10.1016/s1353-8020(02)00057-3. [DOI] [PubMed] [Google Scholar]
- 19.Baloh RW, Foster CA, Yue Q, Nelson SF. Familial migraine with vertigo and essential tremor. Neurology. 1996;46:458–460. doi: 10.1212/wnl.46.2.458. [DOI] [PubMed] [Google Scholar]
- 20.Leehey MA, Munhoz RP, Lang AE, et al. The fragile X premutation presenting as essential tremor. Arch Neurol. 2003;60:117–121. doi: 10.1001/archneur.60.1.117. [DOI] [PubMed] [Google Scholar]
- 21.Bain PG, Findley LJ, Thompson PD, et al. A study of hereditary essential tremor. Brain. 1994;117:805–824. doi: 10.1093/brain/117.4.805. [DOI] [PubMed] [Google Scholar]
- 22.Louis ED, Ford B, Frucht S. Factors associated with increased risk of head tremor in essential tremor: a community-based study in northern Manhattan. Mov Disord. 2003;18:432–436. doi: 10.1002/mds.10395. [DOI] [PubMed] [Google Scholar]
- 23.Pagan FL, Butman JA, Dambrosia JM, Hallett M. Evaluation of essential tremor with multi-voxel magnetic resonance spectroscopy. Neurology. 2003;60:1344–1347. doi: 10.1212/01.wnl.0000065885.15875.0d. [DOI] [PubMed] [Google Scholar]
- 24.Higgins JJ, Lombardi RQ, Pucilowska J, Ruszczyk MU. Integrated physical map of the human essential tremor gene region (ETM2) on chromosome 2p24.3-p24.2. Am J Med Genet. 2004;127:128–130. doi: 10.1002/ajmg.b.20152. [DOI] [PubMed] [Google Scholar]
- 25.Findley LJ, Koller WC. Definitions and behavior classifications. In: Findley LJ, Koller WC, eds. Handbook of tremor disorders. New York: Marcel Dekker, 1994:1–5.
- 26.Cottingham RW, Jr, Idury RM, Schaffer AA. Faster sequential genetic linkage computations. Am J Hum Genet. 1993;53:252–263. [PMC free article] [PubMed] [Google Scholar]
- 27.Lathrop GM, Lalouel JM, Julier C, Ott J. Strategies for multilocus linkage analysis in humans. Proc Natl Acad Sci USA. 1984;81:3443–3446. doi: 10.1073/pnas.81.11.3443. [DOI] [PMC free article] [PubMed] [Google Scholar]
- 28.Lathrop GM, Lalouel JM. Easy calculations of lod scores and genetic risks on small computers. Am J Hum Genet. 1984;36:460–465. [PMC free article] [PubMed] [Google Scholar]
- 29.Lathrop GM, Lalouel JM, White RL. Construction of human linkage maps: likelihood calculations for multilocus linkage analysis. Genet Epidemiol. 1986;3:39–52. doi: 10.1002/gepi.1370030105. [DOI] [PubMed] [Google Scholar]
- 30.Orita M, Iwahana H, Kanazawa H, Hayashi K, Sekiya T. Detection of polymorphisms of human DNA by gel electrophoresis as single-strand conformation polymorphisms. Proc Natl Acad Sci USA. 1989;86:2766–2770. doi: 10.1073/pnas.86.8.2766. [DOI] [PMC free article] [PubMed] [Google Scholar]
- 31.Ota T, Suzuki Y, Nishikawa T, et al. Complete sequencing and characterization of 21,243 full-length human cDNAs. Nat Genet. 2004;36:40–45. doi: 10.1038/ng1285. [DOI] [PubMed] [Google Scholar]
- 32.Takemoto Y, Furuta M, Sato M, Kubo M, Hashimoto Y. Isolation and characterization of a novel HS1 SH3 domain binding protein, HS1BP3. Int Immunol. 1999;11:1957–1964. doi: 10.1093/intimm/11.12.1957. [DOI] [PubMed] [Google Scholar]
- 33.Malaspina A, Kaushik N, de Belleroche J. A 14-3-3 mRNA is upregulated in amyotrophic lateral sclerosis spinal cord. J Neurochem. 2000;75:2511–2520. doi: 10.1046/j.1471-4159.2000.0752511.x. [DOI] [PubMed] [Google Scholar]
- 34.Swanson KD, Dhar MS, Joshi JG. The human and bovine 14-3-3 eta protein mRNAs are highly conserved in both their translated and untranslated regions. Biochim Biophys Acta. 1993;1216:145–148. doi: 10.1016/0167-4781(93)90053-g. [DOI] [PubMed] [Google Scholar]
- 35.Toyooka K, Muratake T, Tanaka T, et al. 14-3-3 protein eta chain gene (YWHAH) polymorphism and its genetic association with schizophrenia. Am J Med Genet. 1999;88:164–167. [PubMed] [Google Scholar]
- 36.Watanabe M, Isobe T, Ichimura T, Kuwano R, Takahashi Y, Kondo H. Developmental regulation of neuronal expression for the eta subtype of the 14-3-3 protein, a putative regulatory protein for protein kinase C. Brain Res Dev Brain Res. 1993;73:225–235. doi: 10.1016/0165-3806(93)90142-w. [DOI] [PubMed] [Google Scholar]
- 37.Ichimura T, Isobe T, Okuyama T, Yamauchi T, Fujisawa H. Brain 14-3-3 protein is an activator protein that activates tryptophan 5-monooxygenase and tyrosine 3-monooxygenase in the presence of Ca2+, calmodulin-dependent protein kinase II. FEBS Lett. 1987;219:79–82. doi: 10.1016/0014-5793(87)81194-8. [DOI] [PubMed] [Google Scholar]
- 38.Ichimura T, Isobe T, Okuyama T, et al. Molecular cloning of cDNA coding for brain-specific 14-3-3 protein, a protein kinase-dependent activator of tyrosine and tryptophan hydroxylases. Proc Natl Acad Sci USA. 1988;85:7084–7088. doi: 10.1073/pnas.85.19.7084. [DOI] [PMC free article] [PubMed] [Google Scholar]