

Abstract
Fibroblasts are present throughout the body to maintain tissue homeostasis. Recent studies have identified diverse fibroblast subsets in healthy and injured tissues1,2, but the origin(s) and functional roles of injury-induced fibroblast lineages remain unclear. Here we show that lung-specialized alveolar fibroblasts take on multiple molecular states with distinct roles in facilitating responses to fibrotic lung injury. We generate a genetic tool that uniquely targets alveolar fibroblasts to demonstrate their role in providing niches for alveolar stem cells in homeostasis and show that loss of this niche leads to exaggerated responses to acute lung injury. Lineage tracing identifies alveolar fibroblasts as the dominant origin for multiple emergent fibroblast subsets sequentially driven by inflammatory and pro-fibrotic signals after injury. We identify similar, but not completely identical fibroblast lineages in human pulmonary fibrosis. TGF-β negatively regulates an inflammatory fibroblast subset that emerges early after injury and stimulates the differentiation into fibrotic fibroblasts to elicit intra-alveolar fibrosis. Blocking the induction of fibrotic fibroblasts in the alveolar fibroblast lineage abrogates fibrosis but exacerbates lung inflammation. These results demonstrate the multifaceted roles of the alveolar fibroblast lineage in maintaining normal alveolar homeostasis and orchestrating sequential responses to lung injury.
Fibroblasts provide structural support to every organ by maintaining extracellular matrix (ECM) architecture3. In response to tissue injury, new subsets of fibroblasts, including cells that produce large amounts of ECM, emerge at injured sites. These cells play an important role in normal tissue repair but have been suggested to contribute to pathologic fibrosis in the setting of chronic diseases4,5. Pro-fibrotic fibroblasts have been historically described as myofibroblasts based on increased expression of alpha-smooth muscle actin (α-SMA). We and others have identified Cthrc1 (collagen triple helix repeat containing 1) as a more specific marker of the small subset of fibroblasts that produce the highest levels of ECM proteins in pulmonary fibrosis and other fibrotic diseases1,2,6,7. However, the origin of the cells that drive fibrotic pathology remains controversial. Although trans-differentiation from other cell types such as hematopoietic, epithelial, perivascular, and endothelial cells has been suggested8,9, there is little evidence from extensive scRNA sequencing (scRNA-seq) of fibrotic tissue to support these non-fibroblast sources. Recent scRNA-seq studies identified diverse fibroblast subsets in healthy tissues with distinct transcriptional profiles and anatomical locations2,10. Using computational lineage inference, one group recently proposed that pro-fibrotic fibroblasts likely universally emerge from adventitial fibroblasts, marked by high expression of the gene encoding peptidase inhibitor 16 (Pi16)1, while our previous computational lineage analysis suggested that pro-fibrotic fibroblasts in response to alveolar lung injury arise from alveolar fibroblasts2, a fibroblast subset uniquely present in the alveolar region of the lung. Elucidating the trajectory for pro-fibrotic fibroblast development in response to lung injury could lead to new insights into therapeutic targets for pulmonary fibrosis.
Alveolar fibroblasts in homeostasis
We previously showed that healthy lungs contain multiple fibroblast subsets characterized by distinct anatomic localization in alveolar, adventitial, or peribronchial regions2. Previously reported tools to label lung fibroblasts do not adequately distinguish among these populations. For example, Pdgfra and Tcf21 are broadly expressed in fibroblasts and inadequate to distinguish fibroblast subsets1,2. To specifically label alveolar fibroblasts, we generated Scube2-CreER mice (Fig. 1a). In the mouse, Scube2 is expressed in the clusters of fibroblasts we previously showed localized to the alveolar region but not in adventitial fibroblasts, peribronchial fibroblasts, pericytes, or smooth muscle cells (Extended Data Fig. 1a, b)2. We crossed Scube2-CreER mice with Rosa26-tdTomato mice and injected tamoxifen in the steady state (Fig. 1a). Flow cytometry showed that 93.80 ± 0.73 % (n = 3, ± SEM) of tdTomato+ cells were negative for lineage markers (CD31, CD45, EpCAM, Ter119 and Mcam), and that lineage− tdTomato+ cells were essentially all Sca1−, CD9−, and Pdgfra+, which is consistent with our previous immunophenotyping of alveolar fibroblasts (Fig. 1b, c, Extended Data Fig. 1c–f)2. After two weeks of tamoxifen, labeling efficiency for lineage−, Sca1−, CD9−, and Pdgfra+ cells was 77.63 ± 3.34 % (n =3, ± SEM) (Extended Data Fig. 1g, h). We crossed Scube2-tdTomato reporter mice with Col1a1-GFP (Col-GFP) reporter mice, where all fibroblasts express GFP. By whole lung imaging, tdTomato+ signals were found diffusely throughout the alveolar region, while Col-GFP signals prominently highlighted bronchovascular bundles due to the higher cellular density of fibroblasts in adventitial and peribronchial locations (Fig. 1d). Imaging thick sections also confirmed the alveolar localization of tdTomato+ cells (Fig. 1e). Col-GFP+ cells in adventitial cuff spaces and peribronchial areas co-localized with Pi16 staining and were not labeled by tdTomato (Extended Data Fig. 1i). Scube2-CreER thus labels alveolar fibroblasts but no other fibroblast subsets.
Fig. 1. Scube2-CreER specifically labels alveolar fibroblasts and ablation of these cells leads to the loss of alveolar stem cell niches.

(a) Schematic of Scube2-CreER mouse generation and experiments. (b) Flow cytometric quantification of tdTomato+ cells in each fraction. Pdgfra+, CD9+, or Sca1+ fractions were pre-gated on lineage− cells. n = 3 mice. (c) Flow cytometric analysis of lineage− Sca1− cells. (d) Maximum projection of whole lung imaging. (e) Maximum projection of 32 z-stack images with step size 0.9 μm. aw, airway. bv, blood vessel. al, alveoli. cuff, cuff space. (f) 28 z-stack images with step size 0.5 μm shown as maximum projection (left), color-coded projection to the depth from the top (middle) or the bottom (right). (g) Time course of tamoxifen treatment. (h) Representative lung sections with proSP-C staining. (i) Histological quantification of proSP-C+ cells. n = 5 mice. (j, k) Flow cytometric counting of alveolar fibroblasts (j) or AT2 cells (k). (l) qPCR analysis of all lung cells. n = 4 (vehicle) or 5 (Tamoxifen) mice (j, k). (m) Time course of tamoxifen and bleomycin treatment. (n) IgM in BAL measured by ELISA. n = 4 (saline) or 5 (bleomycin) mice. (o) Flow cytometric quantification of neutrophils in bleomycin-treated lungs. (p) qPCR for Il17a in purified populations. (q) Flow cytometric quantification of IL-17a+ cells in bleomycin-treated lungs. (o-q) n = 4 (Rosa26-DTA/DTA) or 7 (Rosa26-WT/WT) mice. (r) Percent body weight change after bleomycin treatment. (s) Survival after bleomycin treatment. n = 10 mice (r, s). Scale bars, 1 mm (d), 100 μm (e), 10 μm (f), 50 μm (h). Data are mean ± SEM. Data are representative of at least two independent experiments. Statistical analysis was performed using unpaired two-tailed t-test (i, j, k, o), unpaired two-tailed t-test followed by Holm–Sidak’s multiple-comparisons adjustment (l), two-tailed Mann-Whitney test (n), or two-way analysis of variance (ANOVA) followed by Sidak’s multiple comparison test (p, q).
Previous work showed that Pdgfra+ lipofibroblasts in alveolar walls are closely associated with alveolar type 2 epithelial (AT2) cells and can support the growth of AT2 cells ex vivo11,12. Our previous study showed that alveolar fibroblasts that express Scube2 also express a lipid droplet marker, Plin22. We asked if Scube2-CreER-labeled alveolar fibroblasts might directly contact AT2 cells and support their maintenance in uninjured lungs. Pro-surfactant protein C (proSP-C)+ AT2 cells closely localized with the cell bodies of tdTomato+ alveolar fibroblasts (Fig. 1f, Supplementary Video 1), which extended projections around AT2 cells (Extended Data Fig. 1j). We crossed Scube2-CreER mice with Rosa26-DTA mice to ablate alveolar fibroblasts (Fig. 1g). Three days after 10-day tamoxifen treatment, the frequency of proSP-C+ cells decreased on histology (Fig. 1h, i). Flow cytometry confirmed that the number of alveolar fibroblasts decreased by 30 – 40% after ablation and that AT2 cells identified as EpCAM+ MHC class II (MHCII)+ also decreased by 30–40% (Fig. 1j, k, Extended Data Fig. 2a–c)13. The decrease of alveolar fibroblast and AT2 cell markers was also confirmed by whole lung quantitative PCR (qPCR) (Fig. 1l), although no structural abnormality was observed in the absence of injury (Extended Data Fig. 2d, e). We then asked if the decreased number of alveolar fibroblasts affects the response to lung injury induced by intratracheal bleomycin (Fig. 1m). Alveolar fibroblast ablation significantly increased weight loss and mortality with increased IgM in bronchoalveolar lavage fluid (BAL) (Fig. 1n) and neutrophil infiltration (Fig. 1o), suggesting increased vascular permeability and neutrophilic inflammation after bleomycin injury. Whole lung qPCR showed that Il17a was dramatically up-regulated after bleomycin in alveolar fibroblast-ablated lungs (Extended Data Fig. 2f). We examined γδ T cells, CD4 T cells, and innate lymphoid cells (ILC), major cell types previously reported to produce IL-17a in the lung14 (Extended Data Fig. 2g–j), and found increased γδ T cells and up-regulated Il17a expression in γδ T cells in the alveolar fibroblast-ablated group (Fig. 1p, q, Extended Data Fig. 2i). IL-17a neutralizing antibody abrogated the exaggerated weight loss and mortality in alveolar fibroblast-ablated mice (Fig. 1r, s). Together, these data provide in vivo evidence of a role for alveolar fibroblasts in maintaining a supportive niche for AT2 cells in the steady state and show that loss of this niche leads to lethal IL-17a-mediated inflammation after lung injury.
Alveolar fibroblast response to injury
To investigate the fate of alveolar fibroblasts after lung injury, we performed scRNA-seq in Scube2-CreER/Rosa26-tdTomato mice (Fig. 2a). We collected lungs on days 0 (untreated), 7, 14, and 21 with 3 biological replicates at each time point (Fig. 2a). Mesenchymal cells were purified for scRNA-seq (Fig. 2a, Extended Data Fig. 3a)2. We identified 11 clusters from 47,476 cells (Fig. 2b–e, Extended Data Fig. 3b–f). In addition to the mesenchymal subsets we found in our previous study, we found 4 distinct clusters that emerged in response to lung injury. We labeled these as fibrotic, inflammatory, stress-activated, and proliferating based on the patterns of gene expression (Extended Data Fig. 3c–f). Fibrotic fibroblasts were characterized by the expression of Cthrc1 and high expression of Col1a1 and other pathologic ECM genes (Fig. 2d, e). Inflammatory fibroblasts expressed chemokines such as Cxcl12 and were marked by specific expression of serum amyloid A3 (Saa3), lipocalin 2 (Lcn2), and interferon-responsive genes (Fig. 2d, e). Gene ontology (GO) enrichment analysis of differentially expressed genes in inflammatory fibroblasts suggested responses to inflammatory cytokines including interferons and interleukin 1 (IL-1) (Extended Data Fig. 3d, f), similar to the inflammatory fibroblast subsets reported in arthritis or cancer15,16. Stress-activated fibroblasts were characterized by the expression of the cell cycle arrest marker p21 (Cdkn1a), translation-related genes, and stress-related genes (Fig. 2d, e, Extended Data Fig. 3e, f). There were very few cells in any of these 4 emergent subsets in the absence of injury (Fig. 2c, Extended Data Fig. 3b). The frequency of inflammatory and proliferating fibroblasts peaked at day 7 and decreased at later time points (Fig. 2c). Fibrotic fibroblasts started to emerge on day 7 but their frequency increased on day 14 and 21 (Fig. 2c). To assess the contribution of alveolar fibroblasts to each of these subsets, we analyzed tdTomato expression. Although almost all cells showed at least low-level tdTomato expression due to the baseline leak at the Rosa26 locus in the tdTomato reporter line, cells that underwent CreER-mediated recombination showed much higher tdTomato expression (Extended Data Fig. 4a, b). We defined cells with normalized tdTomato levels above 3.5 as tdTomato+ cells (Fig. 2f, Extended Data Fig. 4b) and quantified tdTomato+ cells in each cluster (Fig. 2g, h). In the steady state, 70 – 80% of alveolar fibroblasts were tdTomato+ while the other subsets contained very low numbers of tdTomato+ cells (Fig. 2g). The tdTomato+ frequency for each of the 4 emergent subsets was virtually identical to the tdTomato+ frequency of alveolar fibroblasts (Fig. 2h). This pattern was consistent across all replicates (Extended Data Fig. 4c). Moreover, when we compared tdTomato+ frequencies for alveolar fibroblasts and Cthrc1+ fibrotic fibroblasts in individual replicates, all were close to the line of identity (Extended Data Fig. 4d). These data suggest that alveolar fibroblasts are the dominant origin of all the emergent fibroblasts after injury, although we cannot exclude small contributions from other fibroblast subsets.
Fig. 2. Lineage tracing by scRNA-seq reveals alveolar fibroblasts as the origin of multiple emergent fibroblast subsets.

(a) Schematic of scRNA-seq experiment design. (b) UMAP plot of the scRNA-seq data. Clusters were shown with different colors. (c) Frequency of each cluster on different time points. (d) Dot plot showing representative markers for each cluster. (e) Dot plot showing markers for subsets that emerge after injury. (f) UMAP plot showing tdTomato+ and tdTomato-negative cells. (g) Percent tdTomato+ of each subset that was present in normal lungs. (h) Percent tdTomato+ of each subset that emerged after injury. n = 3 mice (g, h). Data are mean ± SEM.
We next evaluated the emergence of fibrotic and inflammatory fibroblasts by histology and flow cytometry. Whole lung imaging showed an accumulation of Scube2-CreER-labeled cells in aggregates in alveolar regions 14 days after bleomycin treatment (Extended Data Fig. 5a, b). We previously showed that Cthrc1+ fibroblasts are enriched in a CD9+ fraction2. Some tdTomato+ cells up-regulated CD9 on day 21 after bleomycin treatment, while tdTomato+ cells from untreated mice were mostly CD9− (Extended Data Fig. 5c, d). Purified tdTomato+ CD9+ cells on day 21 expressed higher fibrotic fibroblast markers and lower alveolar fibroblast markers compared to all tdTomato+ cells or tdTomato+ cells from untreated mice (Extended Data Fig. 5e), suggesting that Scube2-CreER-labeled alveolar fibroblasts differentiated into Cthrc1+ CD9+ fibrotic fibroblasts after lung injury. We also confirmed that some Scube2-CreER-labeled cells became inflammatory fibroblasts by staining for Saa3 (Extended Data Fig. 5f, g).
To see if the alveolar fibroblast origin of emergent fibroblasts is conserved in another model of lung fibrosis, we administered intratracheal silica to Scube2-CreER/Rosa26-tdTomato mice. After intratracheal silica, tdTomato+ silicotic nodules with collagen deposition emerged in alveolar regions (Extended Data Fig. 6a–e). Immunohistochemistry revealed that approximately 80% of the fibroblasts in silicotic nodules were tdTomato+ (Extended Data Fig. 6f, g). We also observed up-regulation of fibrotic and inflammatory markers in Scube2-CreER-labeled fibroblasts (Extended Data Fig. 6h–k). These data suggest that alveolar fibroblasts are the major origin of fibroblasts that form silicotic nodules and that markers of inflammatory and fibrotic fibroblasts are induced in Scube2-CreER-labeled cells in the silicosis model as well.
Although the presence of multiple emergent fibroblast subsets has been reported in other pathologies15–18, the lineage relationships among these subsets remain unclear. To address this question, we focused on alveolar fibroblasts and the 3 largest emergent populations, inflammatory, stress-activated, and fibrotic fibroblasts, and performed pseudotime analysis (Extended Data Fig. 7a)19. This analysis suggested that stress-activated fibroblasts arose from inflammatory fibroblasts and were potentially in a terminal state (Extended Data Fig. 7a). Since fibrotic fibroblasts seemed to be the other terminal state and a trajectory went through inflammatory fibroblasts, we further focused on alveolar, inflammatory, and fibrotic fibroblasts (Fig. 3a, b). Changes in representative markers along the pseudotime showed that alveolar fibroblast markers gradually decreased along the pseudotime towards fibrotic fibroblasts (Fig. 3c, d, Extended Data Fig. 7c). Inflammatory fibroblast markers increased in the middle of the pseudotime projection, but decreased later, along with increases of fibrotic fibroblast markers (Fig. 3c, d, Extended Data Fig. 7c). Overlay of some of these markers on UMAP plots indicated heterogeneity within fibrotic fibroblasts, with Spp1 potentially expressed prior to Cthrc1 along the pseudotime (Fig. 3d, Extended Data Fig. 7c). Although Cthrc1+ cells expressed the highest levels of collagen genes, broad Col1a1 expression in Cthrc1− cells in the fibrotic fibroblast cluster suggested a potential contribution of these cells to fibrosis (Extended Data Fig. 7c). Together, these data suggest that inflammatory fibroblasts are induced early after injury and fibrotic fibroblasts emerge later. Although one trajectory through which inflammatory fibroblasts could serve as an intermediate for the eventual emergence of fibrotic fibroblasts was suggested, confidence in such a model will require additional direct experimental evidence.
Fig. 3. Alveolar fibroblasts sequentially differentiate into inflammatory and fibrotic fibroblasts in mouse and human pulmonary fibrosis.

(a) UMAP plot of scRNA-seq data subsetted into alveolar, inflammatory, and fibrotic fibroblasts. (b) UMAP plot overlaid with pseudotime. (c) Scaled expression of representative markers in pseudospace. (d) Heat map with cells arranged in pseudotemporal order showing changes in representative markers. Cluster annotations for each cell were shown above the heat map. (e, f) in vitro cytokine stimulation of primary alveolar fibroblasts. (e) Schematic of the experiment. (f) qPCR analysis for representative genes. n = 3 wells. Data are mean ± SEM. Data are representative of three experiments. (g) Schematic of re-analysis of our previous human scRNA-seq data. (h) UMAP plot after subsetting and re-clustering alveolar and pathologic clusters. (i) UMAP plots for cells from control (n = 3), scleroderma (n = 2) or IPF (n = 3) lungs. (j) Dot plot for representative markers for each subset. (k) UMAP plot overlaid with pseudotime. (l) Schematic of in situ hybridization experiment. (m) Dot plot showing ITGA8 expression can distinguish inflammatory fibroblasts from adventitial fibroblasts. (n) Joint density plots showing two markers that can highlight fibroblast subsets. (o) In situ hybridization on sequential sections from an IPF lung. Yellow squares in the left images are magnified in the right images. Arrows indicate cells expressing the markers for each subset. Yellow dashed circles indicate a fibroblastic focus. Scale bars, 50 μm (merge), 10 μm (magnified). Images are representative of 3 IPF patients. (p) Schematic of localization for fibrotic and two inflammatory fibroblast subsets.
Since the differentially expressed genes of inflammatory fibroblasts indicated activation by inflammatory cytokines, we tested if inflammatory cytokines could induce inflammatory fibroblast markers in vitro (Fig. 3e). IL-1β and TNF-α are inflammatory cytokines produced in the early phase of bleomycin injury20, while TGF-β1 is a profibrotic cytokine up-regulated in the later phase21. We stimulated freshly isolated murine alveolar fibroblasts with IL-1β, TNF-α or TGF-β1 (Fig. 3e, f). IL-1β dramatically up-regulated Saa3 and Lcn2 expression, while TGF-β1 up-regulated Col1a1 and Cthrc1 as previously described (Fig. 3f)2. TGF-β1 treatment up-regulated Col1a1 and Cthrc1 within 24 hours regardless of prior stimulation by IL-1β Extended Data Fig. 7d, e). In contrast, IL-1β-induced Saa3 and Lcn2 were down-regulated when cells were subsequently stimulated with TGF-β1 (Extended Data Fig. 7e). These data suggest that TGF-β1 antagonizes expression of inflammatory fibroblast markers and is a potent driver of the fibrotic fibroblast signature.
Alveolar fibroblast lineage in humans
We next evaluated whether a similar lineage of alveolar, inflammatory, and fibrotic fibroblasts could be inferred from scRNA-seq data from human lungs. We first used our previously reported scRNA-seq data2. We focused on alveolar and pathologic fibroblast clusters and re-clustered these to get higher resolution (Fig. 3g–j, Extended Data Fig. 8a–d). We identified two previously unrecognized clusters expressing inflammatory chemokines, which were enriched in idiopathic pulmonary fibrosis (IPF) and scleroderma samples (Fig. 3h, i, j, Extended Data Fig. 8a, b). GO enrichment analysis suggested that inflammatory cluster 1 was potentially induced by IL-1 and/or TNF, while inflammatory cluster 2 was potentially induced by interferons (Extended Data Fig. 8c, d). Transcriptomic comparison to mouse emergent clusters also supported the similarity between the mouse inflammatory cluster and human inflammatory cluster 1, as well as the similarity of fibrotic clusters and alveolar clusters from both species (Extended Data Fig. 8e). Although we did not observe a distinct cluster of stress-activated fibroblasts in humans, each of these inflammatory clusters was also enriched with GO terms related to stress responses (Extended Data Fig. 8c, d). Analysis of unique GO terms showed features for antigen presentation in inflammatory cluster 2 (Extended Data Fig. 8f), suggesting potential immune-modulating roles as has been recently described for a subset of cancer-associated fibroblasts22. Pseudotime analysis showed trajectories from alveolar fibroblasts through each inflammatory cluster toward the fibrotic cluster (Fig. 3k), consistent with the results from our mouse model. We next examined if this lineage was observed in other data sets with larger sample sizes for human pulmonary fibrosis23,24. We extracted alveolar and pathologic subsets from the publicly available data sets and merged these cells with our alveolar and pathologic fibroblast clusters (Extended Data Fig. 9a–h). We confirmed the presence of two inflammatory clusters and a fibrotic cluster in multiple lung samples from Adams et al. and Habermann et al. (Extended Data Fig. 9e–h).
We then asked if the localization of these fibroblast subsets in human pulmonary fibrosis shows any association with pathology. We selected 2 or 3 markers that can jointly identify each fibroblast subset and performed in situ hybridization on sequential IPF sections (Fig. 3l–n). We selected COL1A1 and CTHRC1 for fibrotic fibroblast, SFRP2 and CCL2 for inflammatory fibroblast 1, and SFRP4 and CXCL14 for inflammatory fibroblast 2 (Fig. 3n). Although some adventitial fibroblasts also express SFRP2 or SFRP4, expression of ITGA8 can exclude adventitial fibroblasts (Fig. 3m). IPF is characterized by the presence of fibroblastic foci as sites of ongoing fibrogenesis and adjacent fibrous areas accompanied by mild inflammation25. Consistent with previous reports, COL1A1high and CTHRC1+ fibrotic fibroblasts were enriched inside fibroblastic foci (Fig. 3o, p)2. SFRP2+, CCL2+, and ITGA8+ inflammatory fibroblasts 1 were mostly localized adjacent to fibroblastic foci (Fig. 3o, p). SFRP4+, CXCL14+, and ITGA8+ inflammatory fibroblasts 2 were present in fibroblastic foci but biased to the interstitial side (Fig. 3o, p). These data suggest that the two inflammatory fibroblast subsets are closely localized to regions of active fibrosis.
Fibrogenesis by Cthrc1+ fibroblasts
Cthrc1+ fibroblasts uniquely emerge after lung injury and localize at the leading edge of fibrogenesis in IPF2,26. To evaluate the pro-fibrotic function of Cthrc1+ fibroblasts, we generated Cthrc1-CreER mice by knocking a P2A-CreERT2-T2A-GFP sequence into the last exon of the Cthrc1 gene (Fig. 4a). Because GFP generated by this construct was not detectable by flow cytometry or tissue microscopy, we crossed Cthrc1-CreER mice with Rosa26-tdTomato mice and injected tamoxifen on days 8 – 12 after injury (Fig. 4b). tdTomato+ cells emerged and formed aggregates in bleomycin-treated lungs (Fig. 4c). Flow cytometry showed the emergence of tdTomato+ cells among lineage (CD31, CD45, EpCAM, and Ter119)− cells in bleomycin-treated lungs but not in saline-treated lungs (Extended Data Fig. 10a–c). qPCR showed that the expression of fibrotic genes was highly enriched in tdTomato+ cells compared to all mesenchymal (lineage−) cells or all lung cells (Fig. 4e). Some tdTomato+ fibroblasts showed intermediate CD9 expression on day 14, consistent with our previous study2, and the majority of tdTomato+ cells became CD9+ on day 21 (Extended Data Fig. 10d–f). Saa3 immunostaining on day 14 showed that fibrotic and inflammatory fibroblasts appeared to aggregate in adjacent but not overlapping regions as we observed in human pulmonary fibrosis (Extended Data Fig. 10g, h). To examine the association of Cthrc1+ fibroblasts with de novo fibrogenesis, we stained sequential sections for collagen 1 or Pi16. In uninjured lungs, collagen 1+ areas were mostly around Pi16+ bronchovascular bundles, reflecting normal collagen deposition in bronchovascular cuffs (Extended Data Fig. 10i). After bleomycin, de novo collagen 1+ areas emerged in alveolar areas (Extended Data Fig. 10i). Cthrc1+ fibroblasts showed close localization to collagen 1 as illustrated by mean distances of tdTomato to collagen 1, while there was no geographical association between Cthrc1+ fibroblasts and Pi16+ bronchovascular cuffs (Extended Data Fig. 10j, k). These data suggest that Cthrc1-CreER successfully targets Cthrc1+ fibroblasts at sites of de novo fibrogenesis, which are anatomically distant from adventitial cuff spaces.
Fig. 4. Cthrc1-CreER mouse demonstrates the pro-fibrotic function of Cthrc1+ fibroblasts.

(a) Schematic of Cthrc1-CreER mouse generation. (b) Time course of bleomycin and tamoxifen treatment for day 14 analysis. (c) Maximum projection of whole lung imaging. (d) qPCR analysis of all lung cells, lineage− cells, and tdTomato+ cells. n = 3 mice. (e) Collagen 1 and collagen 4 staining on day 14. Scube2-CreER mice were treated with tamoxifen as shown in Fig. 2a. Arrowheads indicate fibroblasts inside the basal lamina. Arrows indicate fibroblasts outside of the basal lamina. (f) Image quantification of mean distances between tdTomato and collagen 4. (g) Image quantification of tdTomato+ cells that are directly associated with intra-alveolar collagen 1. n= 4 mice (f, g). (h) Time course of bleomycin and tamoxifen treatment for day 28 analysis. (i, j) Ablation efficiency assessed by lineage− tdTomato+ cell number in left lobes (i) or by whole lung qPCR for Cthrc1 (j) from Cthrc1-CreER+/− Rosa26-tdTomato/WT (n = 11 mice) or Cthrc1-CreER+/− Rosa26-tdTomato/DTA (n = 12 mice). (k) Hydroxyproline assay on day 28 of Cthrc1-CreER+/− Rosa26-WT/WT (n = 16 mice for saline, n = 26 mice for bleomycin) or Cthrc1-CreER+/− Rosa26-DTA/DTA (n = 17 mice for saline, n = 31 mice for bleomycin). Scale bars, 1 mm (c), 20 μm (e). Data are representative of at least two independent experiments except (k), which is a pool from two independent experiments. Data are mean ± SEM. Statistical analysis was performed using Tukey’s multiple comparisons test after one-way ANOVA (f), unpaired two-tailed t-test (g), or two-tailed Mann-Whitney test (i, j, k).
To micro-anatomically characterize the emergence of Cthrc1+ fibroblasts, we stained lung sections for collagen 1 and collagen 4. Previous work suggested that fibroblasts migrate across the basal lamina into alveolar airspaces to form fibroblastic foci in human pulmonary fibrosis27. After bleomycin, we observed some Scube2-CreER-labeled cells within airspace lumens. Newly synthesized collagen 1 in airspace lumens, which was not present in uninjured lungs, was adjacent to these cells (Fig. 4e). The same analysis with Cthrc1-CreER mice revealed that the majority of Cthrc1-CreER-labeled cells were within alveolar lumens and associated with intra-alveolar collagen 1 (Fig. 4e–g). These results are consistent with our previous demonstration that Cthrc1+ fibroblasts are highly migratory and suggest that Cthrc1+ fibroblasts are a principal source of intraluminal collagen in pulmonary fibrosis2.
We crossed Cthrc1-CreER to Rosa26-lox-stop-lox-DTA mice and asked if ablation of Cthrc1+ cells reduces fibrosis (Fig. 4h). Ablation efficiency assessed by loss of tdTomato+ cells and Cthrc1 mRNA was approximately 50% (Fig. 4i, j). Despite this limited ablation, fibrosis measured by hydroxyproline content was significantly reduced by Cthrc1+ cell ablation (Fig. 4k). Collagen 1+ area also decreased in the ablated group (Extended Data Fig. 10l, m). Although the technical inability to more efficiently delete Cthrc1+ fibroblasts resulted in only partial protection from pulmonary fibrosis, these data demonstrate that Cthrc1+ fibroblasts do contribute to de novo fibrogenesis after alveolar injury.
Alveolar fibroblast deletion of Tgfbr2
To further evaluate the alveolar fibroblast origin of Cthrc1+ fibrotic fibroblasts and to examine the role of TGF-β signaling in the emergence of these cells, we conditionally deleted Tgfbr2 from alveolar fibroblasts (Fig. 5a). We observed nearly complete inhibition of pulmonary fibrosis assessed by hydroxyproline content and a dramatic reduction in intra-alveolar collagen 1 in Tgfbr2 conditional knockout (cKO) mice (Fig. 5 b, c, d Extended Data Fig. 11a). However, Tgfbr2 cKO mice showed more severe body weight loss and increased mortality in the inflammatory phase after bleomycin treatment (Fig. 5e, Extended Data Fig. 11b). qPCR of Scube2-CreER-labeled tdTomato+ cells showed a substantial decrease of the fibrotic fibroblast markers in Tgfbr2 cKO but an increase of inflammatory fibroblast markers (Fig. 5f, Extended Data Fig. 11c). This increase in inflammatory fibroblast markers was associated with increased alveolar permeability as evidenced by increased IgM and red blood cells in BAL (Fig. 5g, h, Extended Data Fig. 11d, e), suggesting that exaggerated lung inflammation and more severe acute lung injury in Tgfbr2 cKO mice might contribute to the body weight loss and increased mortality. Tgfbr2 cKO mice also had increased monocytes in BAL, consistent with increased expression of the monocyte chemoattractants, Ccl2 and Ccl7 (Fig. 5h, Extended Data Fig. 11d). The presence of increased numbers of inflammatory fibroblasts (detected by Saa3) and myeloid cell accumulation (detected by CD68) is also confirmed by immunohistochemistry (Extended Data Fig. 11f–h). These data suggest that, in addition to being a central driver of fibrosis, TGF-β signaling in fibroblasts plays a critical role in shutting off fibroblast-driven inflammation. These findings support the conclusion that, in response to injury, alveolar fibroblasts undergo a temporal progression to inflammatory fibroblasts and then fibrotic fibroblasts, and that fibrotic fibroblasts derived from alveolar fibroblasts are the central drivers of pulmonary fibrosis (Fig. 5i).
Fig. 5. Tgfbr2 conditional knockout in alveolar fibroblasts abrogates fibrosis but exacerbates inflammation.

(a) Schematic of Tgfbr2 conditional knockout experiments. (b) Sections after bleomycin treatment were stained for collagen 1 and collagen 4. Arrows indicate intra-alveolar collagen 1. Scale bars, 100 μm. (c) Quantification of Collagen 1+ area of whole sections. n = 3 (saline) or 6 (bleomycin) mice. (d) Hydroxyproline assays of left lobes. n = 5 (saline), 15 (bleomycin, control), or 13 (bleomycin, Tgfbr2 fl/fl) mice. (e) Percent body weight change after bleomycin. n = 15 (bleomycin, control) or 13 (bleomycin, Tgfbr2 fl/fl) mice. (f) qPCR of purified tdTomato+ cells after bleomycin showing the relative expression to the control group. n = 13 (bleomycin, control) or 11 (bleomycin, Tgfbr2 fl/fl) mice. (g) ELISA of BAL for IgM. n = 5 (saline), 13 (bleomycin, control), or 11 (bleomycin, Tgfbr2 fl/fl) mice. (h) Flow cytometric counting of myeloid populations in BAL. n = 13 (bleomycin, control), or 10 (bleomycin, Tgfbr2 fl/fl) mice. (i) Schematic of sequential differentiation of alveolar fibroblast lineage after injury. Data are representative of at least two independent experiments. Data are mean ± SEM. Statistical analysis was performed using two-tailed Mann-Whitney test (c, d, g, h) or unpaired two-tailed t-test (f). P-values were adjusted using Holm–Sidak’s multiple-comparisons adjustment (f, h).
Discussion
In this study, we show that alveolar fibroblasts, which maintain alveolar homeostasis in the steady state by providing niches for AT2 cells, are the dominant source of emergent fibroblast subsets after fibrotic lung injury. Our results suggest that alveolar fibroblasts are likely induced to differentiate into inflammatory fibroblasts by inflammatory cytokines during the initial phase of injury and that fibrotic fibroblasts are later induced by pro-fibrotic cytokines like TGF-β1. Tgfbr2 cKO using Scube2-CreER demonstrates that this sequential lineage transition is critical not only for fibrosis but also for terminating fibroblast enhancement of inflammatory responses to lung injury. The exaggerated inflammation after injury in Tgfbr2 cKO mice is consistent with the evolutionarily conserved role of TGF-β in the orderly resolution of tissue injury28. We also demonstrate that Cthrc1+ fibroblasts, which have been described to emerge in IPF2, scleroderma-associated pulmonary fibrosis2,29, SARS-CoV-2-associated lethal pneumonia7, myocardial infarction6, and cancer1,30 are significant contributors to fibrosis, although there are conflicting reports about the molecular function of Cthrc1 in acute injury and fibrosis31,32. One important limitation of our study is the partial reduction of fibrosis after Cthrc1+ fibroblast ablation. One possible explanation for this finding is the limited recombination efficiency in the Rosa26-DTA locus, which has a longer distance between the two loxp sites compared to Rosa26-tdTomato33,34. However, our scRNA-seq data also show that some cells in the fibrotic fibroblast cluster do not express high levels of Cthrc1. It thus seems likely that Cthrc1− fibrotic fibroblasts also contribute to fibrosis. Further study is required to determine whether Cthrc1 is simply a late marker of the differentiation of fibrotic fibroblasts or whether the Cthrc1− fibroblasts make unique contributions to the development of pulmonary fibrosis.
Previous efforts to trace the pro-fibrotic fibroblast lineage in pulmonary fibrosis were limited by a lack of understanding of the fibroblast subsets in the normal lung and those that emerge in lung injury and fibrosis. In this study, we developed a new mouse line, Scube2-CreER, that specifically distinguishes alveolar fibroblasts from other cells present in the normal lung. Using this line, we now clarify that previously proposed progenitors such as adventitial fibroblasts, pericytes, epithelial cells, endothelial cells, and hematopoietic cells are not major sources of the new fibroblast subsets that emerge after fibrotic injury in the lung8,9, but rather that all of these emergent subsets are principally derived from alveolar fibroblasts. However, our results do not exclude the possibility that other resting fibroblasts contribute to pathologic fibroblasts in response to injuries at other anatomic locations, such as perivascular or peri-airway fibrosis. Furthermore, whether fibrotic fibroblasts in other organs similarly arise from tissue-specific fibroblasts or other sources will need to be addressed with other tissue-specific tools. Further investigation of the mechanisms underlying the induction of these emergent populations and the functional contributions of each to progressive fibrosis or repair should lead to new therapeutic strategies targeting a wide array of diseases characterized by tissue inflammation and fibrosis.
Methods
Mice
Rosa26-lox-stop-lox-tdTomato (Stock No. 007914), Rosa26-lox-stop-lox-DTA (Stock No. 009669), and Tgfbr2 fl/fl (Stock No. 012603) mice were obtained from the Jackson Laboratory. Col-GFP mice were obtained from Dr. David Brenner at University of California, San Diego35. Mice between the ages of 8 and 16 weeks old were used for the experiments. Male mice were used for the Scube2-CreER scRNA-seq experiment. Both male and female mice were used in the other experiments. Heterozygous Cthrc1-CreER mice were used for experiments to avoid potential impact on fibrosis by altered Cthrc1 expression31. Homozygous Scube2-CreER mice were used for experiments to achieve higher recombination efficiency. No obvious phenotype of lung structure or fibrosis was observed in homozygous Scube2-CreER mice. Mice with homozygous Rosa26-tdTomato or Rosa26-DTA alleles were used for experiments unless specified. For fibrosis induction, mice were treated with bleomycin in 75 μl saline by oropharyngeal aspiration. Since male mice develop more severe fibrosis36, we used 2.5 U/kg bleomycin for male mice and 3 U/kg bleomycin for female mice, which were determined by induction of 7–9% body weight loss on day 7 and approximately 10% mortality rate. Male and female mice showed similar degrees of fibrosis measured by hydroxyproline with these doses. For Scube2-CreER Tgfbr2 fl/fl mice, we used 1.7 U/kg for male mice and 2 U/kg for female mice to avoid mortality due to the exaggerated inflammation during the early phase after bleomycin treatment. For the silica-induced lung fibrosis model, silica (MIN-U-SIL5, US Silica) was heated in 1N hydrochloric acid at 110 °C for 1 hour. Silica was then washed with sterile water twice, followed by drying at 110 °C overnight. Dried silica was resuspended in saline and 400 mg/kg body weight silica was intratracheally instilled by oropharyngeal aspiration. Tamoxifen (Millipore Sigma) was dissolved in olive oil (Millipore Sigma) at 20 mg/ml, and 2 mg was intraperitoneally injected once a day. For labeling Cthrc1+ cells, tamoxifen was injected on days 8–12 after bleomycin treatment in most experiments. For ablating Cthrc1+ cells, tamoxifen was injected on days 8, 9, 11, 12, 15, 16, 18, 19, 22, 23, 25, and 26 after bleomycin treatment. Scube2-CreER mice were treated with tamoxifen for 2 weeks and used for experiments at least 1 week after the last tamoxifen injection unless specified. BAL was collected with 800 μl PBS from right lungs after dissecting left lungs for dissociation. IgM concentration in BAL was measured using the Mouse IgM ELISA Kit (Millipore Sigma). For IL-17 blocking experiments, mice intraperitoneally received 15 μg of anti-IL-17a neutralizing antibody (R&D, MAB421) on day 1 after bleomycin treatment and subsequently received 7.5 μg of anti-IL-17a neutralizing antibody on days 3, 5, 7, 9, and 11 after bleomycin treatment. Mice were maintained in the UCSF specific pathogen-free animal facility in accordance with guidelines established by the Institutional Animal Care and Use Committee and Laboratory Animal Resource Center. All animal experiments were in accordance with protocols approved by the University of California, San Francisco Institutional Animal Care and Use Committee.
Generation of Cthrc1-CreER and Scube2-CreER mice
The Cthrc1-CreER mouse strain was generated by homology-directed repair at the endogenous Cthrc1 locus aided by CRISPR/Cas9 endonuclease activity in C57BL/6 mice. Briefly, target sequence (5’-atatattggaatgccattac-3’), which had an adjacent PAM sequence, for guide RNA was selected to induce double-strand breaks within the 3’UTR, and crRNA with input sequence GTAATGGCATTCCAATATAT and tracrRNA were obtained from IDT. A 2.38kb 5’homology arm was amplified from C57BL/6 mouse genomic DNA with forward primer 5’-GAGCTGAATGTTCAGGACCTCTTC-3’ and reverse primer 5’-TTTCGGTAGTTCTTCAATGATGAT-3’. A 2.15kb 3’ homology arm was amplified with forward primer 5’-CATTACAGTATTTAGTATTTCCTTCT-3’ and reverse primer 5’-ATTTGTTTGTTCCTAGGAGCTCTATAC-3’. A targeting vector with P2A-CreERT2-T2A-GFP-stop codon-rabbit beta globin polyA sequence flanked by 5’ and 3’ homology arms was generated using NEBuilder HiFi DNA Assembly (NEB) and cloned into a pKO2 backbone plasmid. The targeting vector was linearized at SalI (NEB) and NotI (NEB) sites flanking the donor DNA sequence and the linearized donor DNA was purified by agarose gel electrophoresis with GeneJet Gel Extraction kit (Thermo Fisher). Linearized donor DNA and CRISPR/Cas9 complex were injected into C57BL/6 fertilized zygotes, which were then implanted into the oviducts of pseudopregnant female mice. 215 embryos were implanted and 17 pups were born. Three founders were identified by genotyping. We used one founder to expand the colony. The Scube2-CreER mouse strain was generated by a similar process, inserting P2A-CreERT2-rabbit beta globin polyA into the 3’UTR of endogenous Scube2 locus. The target sequence of guide RNA for endogenous Scube2 3’UTR locus was 5’-GTGACTCGTCAGAGTTCAGT-3’ and the input sequence for crRNA was ACTGAACTCTGACGAGTCAC. A 2.79 kb 5’homology arm was amplified with forward primer 5’-TGGCCTTGACTGTGTACACTTACATTA-3’ and reverse primer 5’- TTTGTAAGGCCTCAGAAACCTTGACACTTT-3’. A 2.24kb 3’homology arm was amplified with forward primer 5’-TTTTATAGACAATACAGATATCTTGA-3’ and reverse primer 5’- TGTGTGAGAATACATGTGTACCACA-3’. A targeting vector with P2A-CreERT2-stop codon- rabbit beta globin polyA sequence flanked by 5’ and 3’ homology arms was generated and linearized for injection. 220 embryos were implanted and 22 pups were born. 5 founders were identified and we used one of them to expand the colony.
Tissue dissociation
Mouse lungs were harvested after perfusion through the right ventricle with 5 ml PBS. After mincing with scissors, the tissue was suspended in protease solution [0.25 % Collagenase A (Millipore Sigma), 1 U/ml Dispase II (Millipore Sigma), 2000 U/ml Dnase I (Millipore Sigma) in Hanks’ Balanced Salt Solution (Thermo Fisher)], except the experiments for analyzing IL-17 production from lymphocytes where lungs were dissociated without Dispase II to avoid degradation of some surface markers for immune cells. The suspension was incubated at 37°C for 60 min with trituration by micropipette every 20 min. Then the cells were passed through a 70 μm cell strainer (BD Biosciences), washed with PBS, and suspended in PBS with 0.5 % bovine serum albumin (BSA) (Fisher BioReagents).
Flow cytometry
After tissue dissociation, 1 × 10⁶ cells were used for flow cytometry. Cells were resuspended in PBS with 0.5% BSA-containing antibodies. For identifying lineage+ cells, cells were first stained with biotin-labeled antibodies for lineage markers, followed by washing and staining with other antibodies and streptavidin-A488 or APC/Cy7. DAPI (Thermo Fisher) was used at 0.1 μg/ml to identify dead cells. Flow cytometric cell count was performed using CountBright Plus Absolute Counting Beads (Invitrogen). The following antibodies were used at 1:200 unless specified: anti-CD9 (clone MZ3, FITC, APC/Fire750, biotin; BioLegend), anti-CD31 (clone 390, A488, biotin; BioLegend), anti-CD45 (clone 30F-11, PE/Cy7, BV421, biotin; BioLegend), anti-Mcam (clone ME-9F1, biotin; BioLegend), anti-Pdgfra (clone APA5, APC; BioLegend), anti-Epcam (clone G8.8, PE, APC/Cy7, biotin; BioLegend), anti-I-A/I-E (MHC class II) (clone M5/114.15.2, APC/Cy7; BioLegend), anti-Sca1 (clone D7, PE/Cy7, biotin; BioLegend), anti-CD3 (clone 17A2, PE/Cy7; BioLegend), anti-CD4 (clone GK1.5, FITC; BioLegend), anti-B220 (clone RA3–6B2, FITC; BioLegend), anti-CD11b (clone M1/70, Alexa 488; BD Pharmingen), anti-CD11c (clone N418, BV786; BD Bioscience), anti-Ly6c (HK1.4, APC; BioLegend), anti-Ly6g (clone 1A8, APC/Cy7, BV605; BioLegend), anti-SiglecF (clone S17007L, PE/Cy7; BioLegend) anti-CD90.2 (clone 30-H12, BV605; BioLegend), anti-TCR β chain (clone H57–597, BV650; BioLegend), anti-TCR γ/δ (clone GL3, APC/Fire 750; BioLegend), anti-IL-17a (clone TC11–18H10.1, APC; BioLegend), streptavidin-APC/Cy7 (BioLegend), streptavidin-A488 (1:1000, Thermo Fisher). Data acquisition or cell sorting was performed using FACS Aria III or Aria Fusion (BD Biosciences) using BD FACSDIVA Sfotware Version 8.0.1.1. Flow cytometry data were analyzed using FlowJo v10 (Becton Dickinson).
Hydroxyproline assay
Fibrosis after bleomycin treatment was assessed by hydroxyproline assay of tissue lysates as described previously37. Briefly, left lobes were homogenized and precipitated with trichloroacetic acid. Following baking at 110°C overnight in HCl, samples were reconstituted in 1 ml water, and hydroxyproline content was measured by a colorimetric chloramine T assay.
scRNA-seq library preparation and sequencing
Scube2-CreER, Rosa26-tdTomato double homozygous mice were treated with tamoxifen for two weeks. Bleomycin treatment was performed 2 weeks after the last tamoxifen treatment. Three biological replicates from day 0 (non-bleomycin-treated), 7, 14, and 21 samples were collected on the same day, and tamoxifen/bleomycin treatment was scheduled accordingly. After harvesting and dissociating left lobes, mesenchymal cells were enriched by magnetic negative selection with anti-CD31, CD45, EpCAM, and Ter119-biotin antibodies (1:200) and Dynabeads MyOne Streptavidin T1 (40 μl / sample, Invitrogen). After magnetic negative selection, cells were stained with Streptavidin-APC/Cy7 (1:200) and DAPI (0.1 μg/ml). Approximately 2 × 10⁵ lineage-APC/Cy7-negative cells were sorted for each sample. The sorted cells were counted and labeled with oligonucleotide tags for multiplexing using 10x Genomics 3’ CellPlex Kit Set A. Tag assignment was as follows; day 0 (301, 302, 303), day 7 (304, 305, 306), day 14 (307, 308, 309), and day 21 (310, 311, 312). All 12 samples were pooled and 30,000 cells/lane were loaded onto 4 lanes of Chromium Next GEM Chip (10x Genomics). Chromium Single Cell 3’ v3.1 (10x Genomics) reagents were used for library preparation according to the manufacturer’s protocol. The libraries were sequenced on an Illumina NovaSeq 6000 S4 flow cell.
Sequencing data processing
Fastq files were uploaded to the 10x Genomics Cloud Analysis website (https://www.10xgenomics.com/products/cloud-analysis) and reads were aligned to a custom reference of mouse genome mm10 with tdTomato-WPRE-polyA transcript sequence using Cell Ranger version 6.1.1. tdTomato-WPRE-polyA sequence was obtained from the sequence of the targeting vector for the Ai9 mouse (Addgene plasmid #22799) since the Ai9 mouse shares the same sequence for tdTomato-WPRE-polyA with the Ai14 mouse used in this study34. The data were demultiplexed and multiplets identified by the presence of multiple oligonucleotide tags were removed using the 10x Genomics cloud analysis function with default parameters. Raw count matrices were imported to the R package Seurat v4.1.038 and cells with fewer than 200 detected genes, larger than 7500 detected genes, or larger than 15% percent mitochondria genes were excluded. We used the DoubletFinder package39 for individual samples to remove doublets that were not detected upon alignment using an estimated multiple rate of 2%. We then merged all the sample objects, identified the top variable genes using the Seurat implementation FindVariableGenes, and integrated the samples using the RunFastMNN40 function of the SeuratWrappers R package. For visualization, the RunUMAP function of Seurat was performed using MNN dimensional reduction. Nineteen clusters were initially identified using FindNeighbors and FindClusters functions of Seurat with resolution = 0.8 from a total of 47,809 cells. Cluster 17 (168 cells) was a cluster mixed with a small number of lineage (CD31, CD45, and EpCAM)+ cells that were not removed by FACS sorting. Cluster 18 (165 cells) showed up in two different locations on the UMAP embedding, one close to alveolar fibroblasts and the other close to peribronchial fibroblasts. Cluster 18 cells expressed both alveolar and peribronchial fibroblast markers, suggesting that they were doublets that were not removed by prior processing. We excluded clusters 17 and 18, and re-clustered the remaining 47,476 cells with FindVariableGenes, RunFastMNN, RunUMAP, FindNeighbors, and FindClusters functions with clustering resolution = 0.3. Differentially expressed genes for each cluster were identified using the FindAllMarkers function of Seurat focusing on genes expressed by more than 25% of cells (either within or outside of a cluster) and with a log fold change greater than 0.25. tdTomato+ cells were defined by natural log-normalized tdTomato expression level greater than 3.5. The metadata including cluster, sample, and tdTomato+ annotations was exported for quantifying the tdTomato+ frequency in each cluster. Gene ontology enrichment analysis for the differentially expressed genes was performed using DAVID (Database for Annotation, Visualization, and Integrated Discovery) Bioinformatic Resources software version 2021, or using one-sided Fisher’s exact tests implemented in gsfisher R package (https://github.com/sansomlab/gsfisher/). We performed pseudotime analysis on the UMAP embeddings using Monocle 3 v1.0.019, specifying cells on day 0 as roots of the pseudotime. Scaled expression of representative markers along the pseudotime was visualized using ggplot2 v3.3.6 (Fig. 3c). A heatmap with cells arranged in pseudotemporal ordering (Fig. 3d) was generated using Slingshot v2.2.041 and ComplexHeatmap R package 2.10.0, specifying starting cluster as “Alveolar” and ending cluster as “Fibrotic”.
Human scRNA-seq data processing
We used our previous human scRNA-seq data set of pulmonary fibrosis (GSE132771)2. We subsetted alveolar and pathologic fibroblast clusters from our mesenchymal cell data, and re-clustered them using FindVariableGenes, RunFastMNN, RunUMAP, FindNeighbors, and FindClusters functions of Seurat with clustering resolution = 0.3. Cluster markers were identified using the FindAllMarkers function of Seurat with min.pct = 0.25 and logfc.threshold = 0.25. For comparison between human and mouse emergent clusters, the average expression of the clusters was exported from scaled data of Seurat objects, and human genes were converted to mouse orthologs using the biomaRt R package, followed by calculation of Spearman’s correlation coefficient by cor function of R. Pseudotime analysis was performed on the UMAP embeddings using Monocle 3, specifying cells from control lungs as roots of the pseudotime. Joint density plots were generated using the scCustomize package42. For integrating alveolar and pathologic fibroblasts from Adams et al.23 and Habermann et al.24, we obtained their data sets from GSE147066 and GSE135893, respectively. The raw count matrix of mesenchymal cells of control and IPF lungs from Adams et al. was batch-corrected using the RunFastMNN function of Seurat, and visualized by RunUMAP, FindNeighbors, and FindClusters functions of Seurat. Alveolar and pathologic fibroblast clusters were identified by examining markers such as INMT, NPNT, TCF21, CTHRC1, COL1A1, and POSTN. For Habermann et al., mesenchymal cells annotated by the original authors were subsetted from the Seurat object containing all cells. By examining markers for alveolar and pathologic fibroblasts, a cluster the authors annotated as myofibroblasts was identified as cells containing both alveolar and pathologic fibroblasts. We subsetted those alveolar and pathologic fibroblast clusters from Adams et al. and Habermann et al. data sets, merged all with our alveolar and pathologic fibroblast clusters, and integrated these data sets using the RunFastMNN function of Seurat by splitting the object by individual patients or donors. After UMAP visualization and clustering, there were two minor clusters of which cells originated only from Adams et al.. One of these clusters was characterized by unusually high numbers of genes and read counts. The other cluster was characterized by high mitochondrial gene proportions. Since these two clusters were only seen in Adams et al. and seemed to be driven by technical artifacts but the other clusters from Adams et al. merged well with the other two data sets, we excluded these two clusters. We re-clustered the remaining cells and annotated the clusters based on the overlap with cells from our data set, which had transferred cluster annotations as shown in Fig. 3h.
Histology, immunohistochemistry, and imaging
For histology, lungs were inflated with 4% PFA and immersed in 4% PFA overnight at 4°C. The lungs were then immersed in 30% sucrose for 24 hours at room temperature, and then embedded in OCT. 12 μm sections for thin section histology or 100 μm sections for thick section histology were made using a cryostat CM1850 (Leica). Thin sections were attached to Superfrost Plus microscope slides (Fisher). For Sirius Red staining, sections were incubated with 0.1% Sirius Red in Saturated Picric Acid (Electron Microscopy Sciences) with 0.125% w/v Fast Green FCF (Fisher) for 1 hour, except Extended Data Fig. 6c, d, which were stained with Sirius red without Fast Green FCF. Thick sections were processed as floating sections in buffers. Thick sections were cleared using a CUBIC method43. Sections were stained with anti-Pi16 (5 μg/ml, R&D, AF4929), anti-proSP-C (1:5000, Sigma-Aldrich, AB3786) anti-collagen 1 (1:200, Southern Biotech, 1310–01), anti-collagen 4 (1:5000, LSL, LSL-LB-1403), anti-Pdgfra (5 μg/ml, R&D, AF1062), anti-CD68 (5 μg/ml, R&D, MAB10114) or anti-Saa3 (1:100, Abcam, JOR110A) followed by donkey anti-rabbit IgG-Alexa 488 or 647 (1:1000, Thermo Fisher, A-21206, A-21245), donkey anti-goat IgG-Alexa 647 (1:1000, Thermo Fisher, A-21447), or donkey anti-rat IgG-Alexa 647 (1:1000, Thermo Fisher, A78947). Thick sections were then treated with CUBIC-R+(M) (TCI), placed in a well of glass bottom plate with sections covered with CUBIC-R+(M), and imaged by an inverted Crest LFOV spinning disk confocal microscope (Nikon Ti2). Images were processed using Image J version 1.53q. Distance to collagen 1 or Pi16 from tdTomato was measured by the “Co-localization by Cross-Correlation” plugin of Image J. For collagen 1+ area quantification, we first iteratively selected two auto threshold methods of Image J for the collagen 1 channel, which can distinguish background autofluorescence and antibody-specific collagen 1 signal. An auto threshold method “Mean” highlighted all of the tissue areas including autofluorescence of tissue. We generated a binary image with the “Mean” method to mask all of the tissue areas that excluded airspaces and empty spaces for quantification. We then applied an auto threshold method “Triangle”, which highlighted antibody-specific collagen 1+ area, to the masked original images to measure % collagen 1+ area. We measured the % collagen 1+ area from images of whole sections for each mouse. For Saa3 and CD68 area quantification, approximately 1 mm × 1 mm alveolar areas excluding large airways and visceral pleura were selected. % area of the signal was measured after applying the “Triangle” auto threshold on Image J. 3D reconstruction of z-stack images was performed using Icy version 2.0. For whole lung imaging, 4% PFA-fixed lungs were cleared with CUBIC-L and treated with CUBIC-R+(M), followed by imaging with Mounting Solution (RI 1.520, TCI) using a Nikon AZ100 microscope configured for light sheet microscopy. Autofluorescence signal in the GFP channel was used to visualize the lung structure except Fig. 1d. Maximum projection images were generated using Image J.
Human Lung Tissue
The studies described in this paper were conducted according to the principles of the Declaration of Helsinki. Written informed consent was obtained from all subjects, and the study was approved by the University of California, San Francisco Institutional Review Board. Fibrotic lung tissues were obtained at the time of lung transplantation from patients with a diagnosis of usual interstitial pneumonia.
In situ hybridization
In situ hybridization was performed by using the RNAscope Multiplex Fluorescent Reagent kit v2 (ACD). Explanted IPF tissues were fixed with 4% PFA overnight and cryoprotected with 30% sucrose for 24 hours, followed by embedding in OCT for frozen blocks. 12 μm sections were attached to Superfrost Plus microscope slides. Target retrieval was performed by heating in a steamer for 15 min. After target retrieval, we photochemically bleached autofluorescence by exposing the sections to LED light as previously described44. Sections were then treated with Protease III (ACD), followed by in situ hybridization according to the manufacturer’s protocol. Probe channels used are as follows: COL1A1-C1 (TSA Vivid 650), CTHRC1-C3 (TSA Vivid 570), SFRP2-C1 (TSA Vivid 650), CCL2-C2 (TSA Vivid 570), SFRP4-C1 (TSA Vivid 650), CXCL14-C2 (TSA Vivid 570), ITGA8-C3 (TSA Vivid 520).
Quantitative Real-Time PCR analysis
Approximately 2000 cells were directly sorted into TRIzol reagent (Thermo Fisher), and RNA was isolated according to the manufacturer’s protocol. The RNA was reverse-transcribed using a Super Script IV VILO Master Mix with ezDNase Enzyme kit (Thermo Fisher). Quantitative Real-Time PCR was performed using PowerUp SYBR Green Master Mix (Thermo Fisher) with a Quant Studio 4 (Applied Biosystems). Primer sequences are listed in Supplementary Table 1.
In vitro stimulation of primary alveolar fibroblasts
Alveolar fibroblasts were isolated by magnetic negative selection for CD31, CD45, EpCAM, Ter119, Sca1, and CD9. 2 × 10⁵ cells were seeded into 48 well plates and initially cultured in DMEM (Corning) with 2% FBS (Gibco) and 1% penicillin-streptomycin (Gibco) for 24 hr. Then the medium was changed to serum-free DMEM with 1% penicillin/streptomycin for 24 hr. After serum starvation, the medium was changed to serum-free DMEM with 1% penicillin/streptomycin, containing 1 ng/ml IL-1β (R&D, 401-ML), 1 ng/ml TGF-β1 (R&D, 7754-BH), or 10 ng/ml TNF-α (R&D, 210-TA). For sequential stimulation, the medium was changed to serum-free DMEM with 1% penicillin/streptomycin containing 1 ng/ml IL-1β, 1 ng/ml TGF-β1, or both for 24 hr. After the cytokine stimulations, cells were lysed by directly adding 400 μl Trizol into the wells. Cell culture was performed under standard conditions (37 °C, 5% CO2).
Data analysis
The mean linear intercept was quantified as described previously45. scRNA-seq data analysis was performed in R version 4.1.3. Statistical tests were performed in GraphPad Prism version 9.4.0.
Extended Data
Extended Data Fig. 1. Scube2-CreER specifically labels alveolar fibroblasts, which provide a niche to support AT2 cells.

(a) UMAP plots of all lung cells from scRNA-seq data of Tsukui et al. 2020, for cell types (left) and Scube2 expression (right). (b) UMAP plots of Col1a1+ cells from scRNA-seq data of Tsukui et al. 2020, for cell types (left) and Scube2 expression (right). (c-f) Gating strategy to evaluate the specificity of tdTomato+ cells for lineage (CD31, CD45, EpCAM, Mcam, Ter119), Sca1, and CD9. (g) Gating strategy for alveolar fibroblasts. (h) Flow cytometric quantification for percent tdTomato+ of alveolar fibroblasts. n = 3 mice. (i) Pi16 staining of a lung section from Scube2-CreER/Rosa26-tdTomato Col-GFP mouse. tdTomato is shown in magenta. Col-GFP is shown in green. Pi16 is shown in grey. DAPI is shown in blue. aw, airway. (j) Three representative planes from z-stack images with z-positions are shown below the images. tdTomato is shown in red. proSP-C is shown in cyan. Asterisks indicate the same proSP-C+ cell. Arrows point to projections extending from alveolar fibroblasts. Scale bars, 200 μm (i) or 5 μm (j). Data are mean ± SEM. Data are representative of at least two independent experiments.
Extended Data Fig. 2. Scube2-CreER-labeled alveolar fibroblasts provide a niche to support AT2 cells.

(a, b) Gating strategy for alveolar fibroblast-ablation experiments with Scube2-CreER/Rosa26-DTA mice. (a) Gating strategy for EpCAM+ subpopulations. (b) Gating strategy for fibroblast subsets. Lineage markers include CD31, CD45, EpCAM, and Ter119. (c) Flow cytometric cell count for each population, normalized to means of vehicle groups. n = 4 (tamoxifen) or 5 (vehicle) mice. (d) Representative images of H&E staining of lung sections from alveolar fibroblast-ablation experiments. Scale bars, 200 μm. (e) Quantification of mean linear intercept of alveolar regions. n = 4 (tamoxifen) or 5 (vehicle) mice. (f) qPCR analysis of whole lung cells 6 days after bleomycin treatment. n = 5 mice. (g) Gating strategy for CD4 and γδ T cells. (h) Gating strategy for ILCs. (i) Flow cytometric quantification in bleomycin-treated lungs. n = 4 (Rosa26-DTA/DTA) or 7 (Rosa26-WT/WT) mice. (j) Gating strategy for IL-17a+ cells. Data are mean ± SEM. Data are representative of at least two experiments. Statistical analysis was performed using unpaired two-tailed t-test followed by Holm–Sidak’s multiple-comparisons adjustment (f) or two-way ANOVA followed by Sidak’s multiple comparison test (i).
Extended Data Fig. 3. Longitudinal scRNA-seq reveals multiple fibroblast subsets that emerge after lung injury.

(a) Gating strategy for purifying lineage (CD31, CD45, EpCAM, Ter119)− mesenchymal cells for scRNA-seq. (b) UMAP plots for cells obtained before (day 0) or at various time points after bleomycin treatment. (c) Dot plots showing the top differentially expressed genes for each cluster. (d) GO enrichment analysis by DAVID for differentially expressed genes of inflammatory fibroblasts. (e) GO enrichment analysis by DAVID for differentially expressed genes of stress-activated fibroblasts. (f) GO over-representation analysis with the Fisher test for all clusters.
Extended Data Fig. 4. Lineage tracing by scRNA-seq reveals alveolar fibroblasts as the origin of multiple pathologic fibroblast subsets.

(a) UMAP plot with tdTomato expression. (b) Violin plot for tdTomato shows peaks for tdTomatolow or tdTomatohigh cells. The threshold for tdTomato+ cells was defined as an expression level > 3.5. (c) UMAP plots with tdTomato expression split by biological replicates. (d) Plot showing percent tdTomato+ of alveolar fibroblasts (x-axis) versus percent tdTomato+ of fibrotic fibroblasts (y-axis) for each biological replicate.
Extended Data Fig. 5. Scube2-CreER-labeled alveolar fibroblasts differentiate into fibrotic or inflammatory fibroblasts after lung injury.
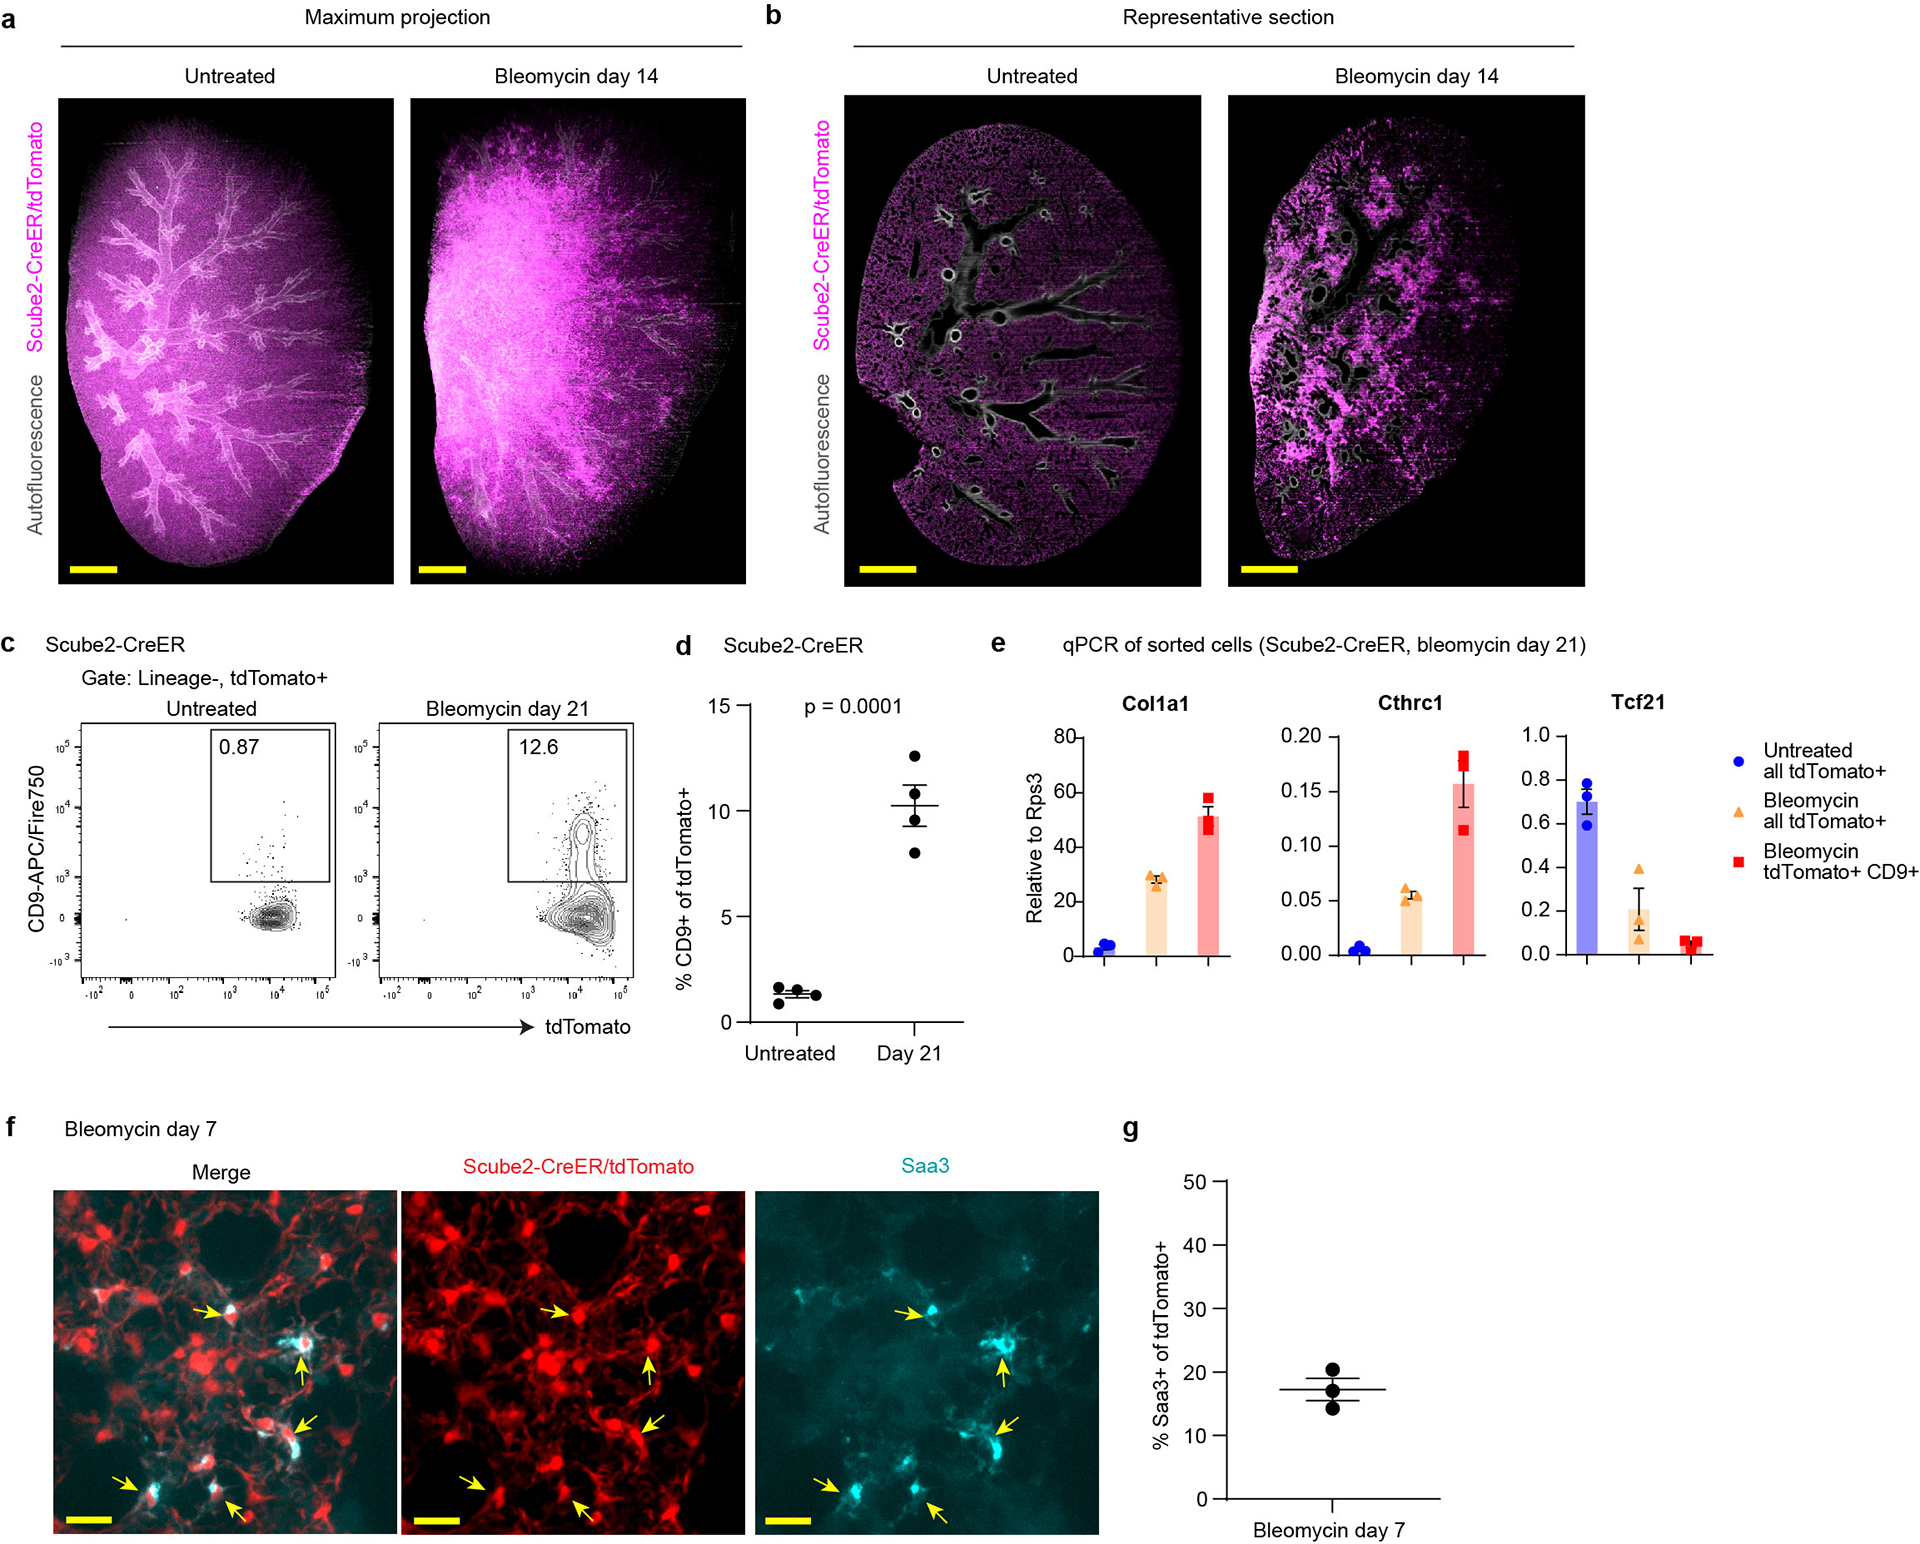
(a) Maximum projection of whole lung imaging for untreated or bleomycin day 14 Scube2-CreER/Rosa26-tdTomato mice. (b) Representative optical sections from whole lung imaging. tdTomato is shown in magenta. Autofluorescence is shown in grey (a, b). (c) Flow cytometry plots showing the increase of CD9+ cells among Scube2-CreER-labeled (tdTomato+) cells on day 21 after bleomycin treatment. (d) Flow cytometric quantification of percent CD9+ of tdTomato+ cells. n = 4 mice. Statistical analysis was performed using unpaired two-tailed t-test. (e) qPCR analysis of sorted cells from Scube2-CreER/Rosa26-tdTomato mice. All lineage (CD31, CD45, EpCAM, Ter119)− tdTomato+ cells (untreated or bleomycin day 21) or lineage− tdTomato+ CD9+ cells (bleomycin day 21) were sorted. The y-axis is the relative expression level to the housekeeping gene Rps3. n = 3 mice. (f) Saa3 staining in sections from Scube2-CreER/Rosa26-tdTomato mice 7 days after bleomycin treatment. Arrows indicate tdTomato and Saa3 double-positive cells. (g) Quantification of percent Saa3+ of tdTomato+ cells. n = 3 mice. tdTomato is shown in red. Saa3 is shown in cyan. DAPI is shown in blue. Collagen 4 is shown in grey. Data are mean ± SEM. Data are representative of at least two independent experiments. Scale bars, 1mm (a, b), 20 μm (f).
Extended Data Fig. 6. Alveolar fibroblasts up-regulated activation markers and formed silicotic nodules in the silicosis model.
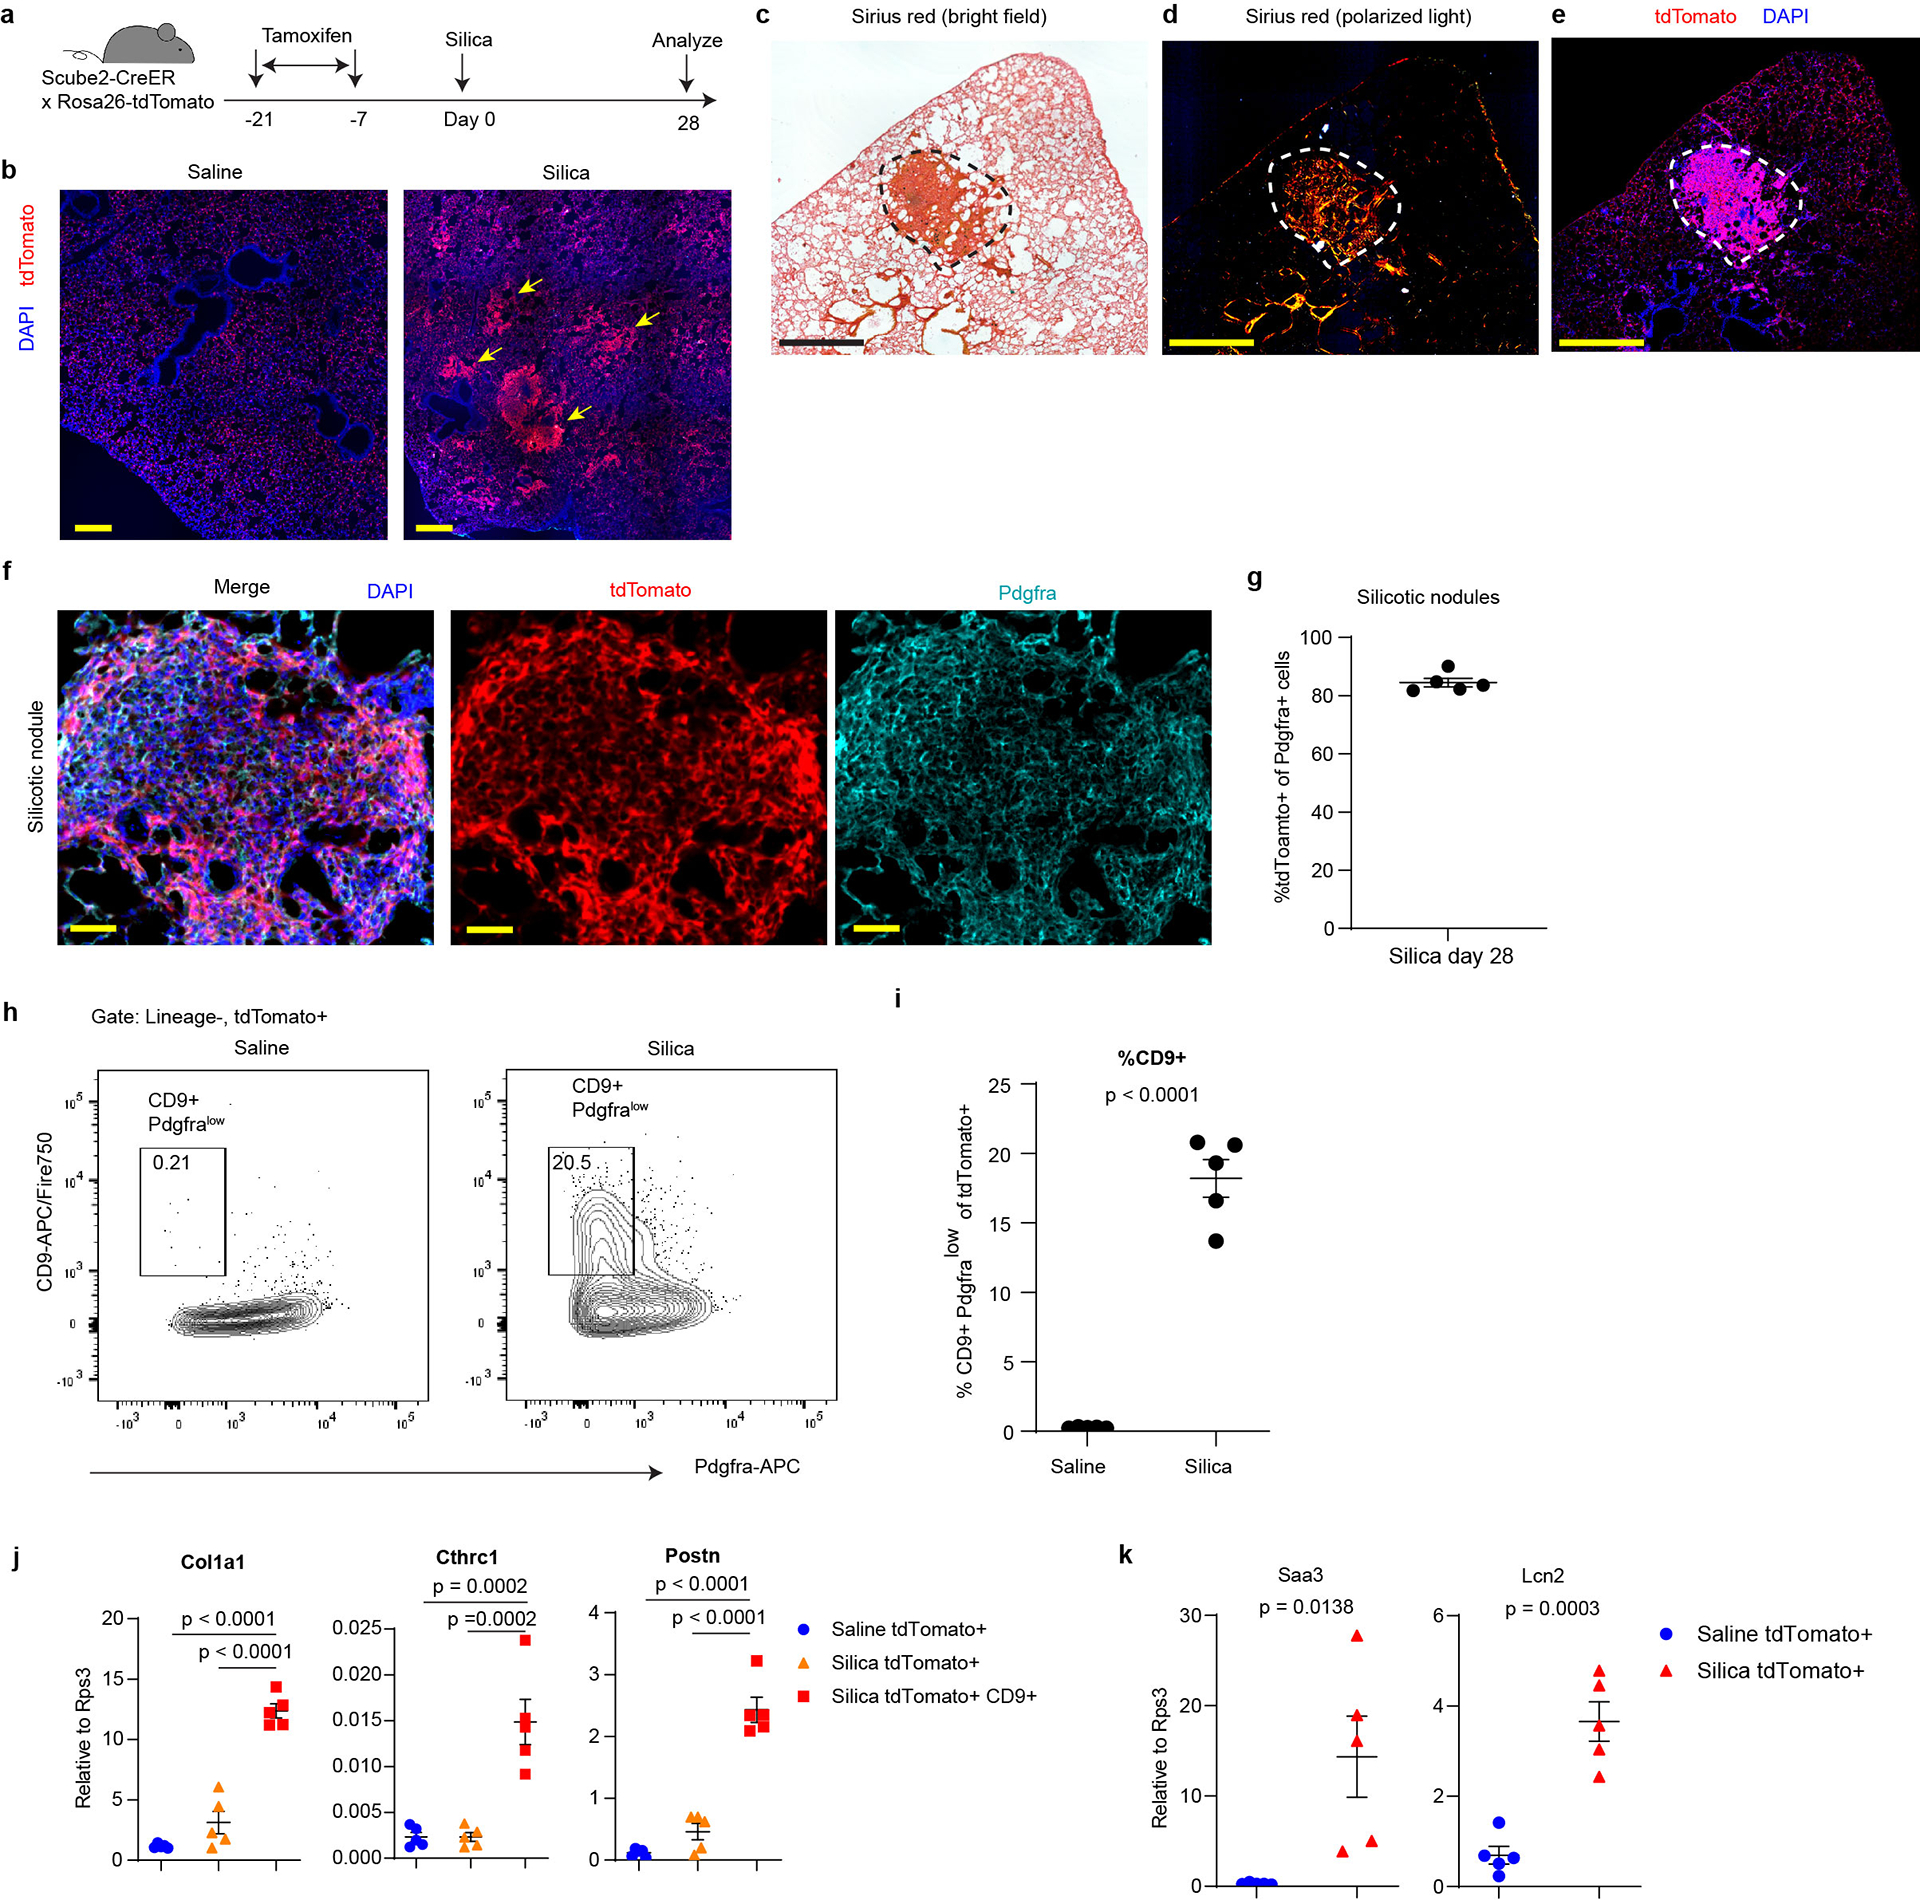
(a) Time course of tamoxifen and silica treatment. (b) Representative lung sections of saline or silica-treated mice. (c, d) Sirius red staining of silica-treated lung section imaged as bright field (c) or polarized light (d). (e) Fluorescence imaging of a sequential section of (c, d). (f) Representative images of silicotic nodules. (g) Histological quantification of % tdTomato+ cells of Pdgfra+ cells inside silicotic nodules. n = 5 mice. (h) Flow cytometric analysis of Pdgfra and CD9 on tdTomato+ cells from saline or silica-treated lungs. (i) Flow cytometric quantification of %CD9+ Pdgfra-low cells of tdTomato+ cells. n = 5 mice. (j, k) qPCR analysis of purified populations. The y-axis is the relative expression level to the housekeeping gene Rps3. n = 5 mice. Scale bars, 200 μm (b), 500 μm (c-e), 50 μm (f). Data are mean ± SEM. Data are representative of at least two independent experiments. Statistical analysis was performed using unpaired two-tailed t-test (i, k) or Tukey’s multiple comparisons test after one-way ANOVA (j).
Extended Data Fig. 7. TGF-β1 antagonizes inflammatory marker expression induced by IL-1β and induces fibrotic markers.

(a) Pseudotime analysis of tdTomato+ clusters suggests that both stress-activated fibroblasts and fibrotic fibroblasts can emerge from inflammatory fibroblasts. (b) UMAP plots of re-clustered alveolar, inflammatory, and fibrotic lineage split by days after bleomycin treatment. (c) Expression of selected markers on UMAP plots. (d) Schematic of sequential cytokine stimulations for primary alveolar fibroblasts. (e) qPCR analysis after sequential cytokine stimulations. Group names indicate (first stimulation) → (second stimulation). DMEM means medium-only control. The y-axis is the relative expression level to the housekeeping gene Rps3. n = 3 wells. Data are mean ± SEM. Data are representative of two independent experiments.
Extended Data Fig. 8. Re-analysis of our publicly available scRNA-seq data from human pulmonary fibrosis reveals inflammatory and fibrotic clusters.

(a) UMAP plots of re-clustered pathologic and alveolar clusters shown for individual patients or donors (control). (b) Dot plot showing top differentially expressed genes for each cluster. (c) GO enrichment analysis by DAVID for differentially expressed genes in inflammatory fibroblast 1 cluster. (d) GO enrichment analysis by DAVID for differentially expressed genes in inflammatory fibroblast 2 cluster. (e) Heat map showing Spearman’s correlation coefficients of average gene expression from mouse and human emergent clusters. (f) GO over-representation analysis with the Fisher test for all clusters.
Extended Data Fig. 9. Combined analysis of publicly available scRNA-seq data sets from human pulmonary fibrosis from 3 groups reveals conserved inflammatory and fibrotic clusters.

(a) UMAP plot of mesenchymal cells from Adams et al. (b) Expression levels of selected genes on UMAP plot of Adams et al. mesenchymal cells show alveolar and pathologic fibroblast clusters. (c) UMAP plot of mesenchymal cells from Habermann et al. (d) Expression levels of selected genes on UMAP plot of Habermann et al. mesenchymal cells show that “Myofibroblasts” cluster contains alveolar and pathologic fibroblasts. (e) UMAP plot after combining alveolar and pathologic fibroblasts from Adams et al., Habermann et al., and Tsukui et al. (f) UMAP plots of combined data split by original data set. (g) UMAP plots shown for each data set and colored by samples. (h) Expression levels of selected markers for fibrotic (COL1A1, CTHRC1), inflammatory1 (SFRP2, CXCL12), inflammatory2 (SFRP4, CXCL14) and alveolar fibroblasts (NPNT, TCF21) on UMAP plots.
Extended Data Fig. 10. Cthrc1-CreER mouse demonstrates the pro-fibrotic function of Cthrc1+ fibroblasts.

(a) Gating strategy for cell size, singlet, and live cells. (b) Flow cytometry plots show an increase in lineage− tdTomato+ cells on day 14 after bleomycin treatment. (c) Flow cytometric cell count of lineage (CD31, CD45, EpCAM, Ter119)− tdTomato+ cells on day 14. n = 3 (Saline-Vehicle) or 5 (Saline-Tamoxifen, Bleo-Tamoxifen) mice. (d) Flow cytometry plots show CD9 expression on tdTomato+ lineage− cells increases between day 14 and 21. (e) Flow cytometric quantification of percent CD9+ of tdTomato+ lineage− cells. n = 5 mice. (f) Mean fluorescence intensity (MFI) of CD9 on tdTomato+ lineage− cells. n = 5 mice. (g) Saa3 staining in sections from Cthrc1-CreER/Rosa26-tdTomato mice 14 days after bleomycin treatment with tamoxifen injected on days 8 –12. tdTomato is shown in red. Saa3 is shown in cyan. Collagen 4 is shown in grey. DAPI is shown in blue. (h) Schematic for localization of inflammatory and fibrotic fibroblasts. (i) Representative images of sequential lung sections from Cthrc1-CreER/Rosa26-tdTomato mice stained for collagen 1 or Pi16 (shown in grey). tdTomato is shown in red. DAPI is shown in blue. (j, k) Image quantifications of the mean distance to collagen 1 or Pi16 from tdTomato or DAPI on the sections. n = 4 mice. (l) Representative images of lung sections stained for collagen 1 (shown in grey) from ablation experiments using Cthrc1-CreER/Rosa26-DTA mice. DAPI is shown in blue. (m) Image quantification of % collagen 1+ area on the sections. n = 3 (saline), 8 (bleomycin, Rosa26-WT/WT), or 10 (bleomycin, Rosa26-DTA/DTA) mice. Data are mean ± SEM. Data are representative of at least two independent experiments. Scale bars, 20 μm (g), 1 mm (i, l). Statistical analysis was performed using unpaired two-tailed t-test (j, k) or two-way ANOVA followed by Sidak’s multiple comparison test (m).
Extended Data Fig. 11. Tgfbr2 conditional knockout in alveolar fibroblasts abrogates fibrosis but exacerbates inflammation.

(a) Representative images of whole sections stained for collagen 1 (magenta) and collagen 4 (green). Arrows indicate regions of intra-alveolar collagen 1. (b) Survival after bleomycin treatment. n = 15 mice. (c) qPCR of purified tdTomato+ cells from saline-treated mice showed no difference for fibrotic and inflammatory genes between control and Tgfbr2 cKO. (d) Flow cytometric counting of myeloid populations in BAL from saline-treated mice showed no difference between control and Tgfbr2 cKO. n = 5 mice (c, b). (e) Gating strategy for myeloid populations in BAL. (f) Representative images of sections from bleomycin-treated lungs stained for Saa3 (magenta) and CD68 (green). tdTomato is shown in blue. Magnified single-channel images of yellow rectangles are shown on the right. (g, h) Image quantification of Saa3 (g), or CD68 (h). n = 5 (control) or 6 (Tgfbr2 fl/fl) mice. Data are representative of at least two independent experiments. Data are mean ± SEM. Statistical analysis was performed using unpaired two-tailed t-test (g, h). Scale bars, 1 mm (a), 100 μm (f, wide), or 20 μm (f, magnified).
Supplementary Material
Acknowledgments
We thank Dr. Junli Zhang at Gladstone Institute for support with the generation of knockin mice, Dr. Walter Eckalbar at UCSF for support with computational analysis, and Dr. Christopher Molina at UCSF for assistance with experiments. T.T. was supported by the Japan Society for the Promotion of Science (JSPS Overseas Research Fellowship), the Uehara Memorial Foundation, the Mochida Memorial Foundation for Medical and Pharmaceutical Research, and the Frontiers in Medical Research Fellowship from the California Foundation for Molecular Biology. This work was supported by HL155786 (T.T.), HL142568 (D.S.), a sponsored research agreement from AbbVie (D.S.), and the Nina Ireland Program for Lung Health (P.J.W.). We thank UCSF core facilities: Laboratory for Cell Analysis supported by P30CA082103, Center for Advanced Light Microscopy supported by S10 Shared Instrumentation grant (1S10OD017993-01A1), and UCSF PBBR, Gladstone Transgenic Gene Targeting Core, Gladstone Genomics core, and Center for Advanced Technology supported by UCSF PBBR, RRP IMIA, and 1S10OD028511-01.
Competing interests
D.S. is a founder of Pliant Therapeutics and has received research funding from Abbvie, Pfizer, and Pliant Therapeutics. D.S. serves on the Scientific Review Board for Genentech and on the Inflammation Scientific Advisory Board for Amgen. P.J.W. received research funding from Boehringer Ingelheim, Pliant Therapeutics, and Genentech.
Footnotes
Code availability
The codes used in the scRNA-seq analysis are available on GitHub (https://github.com/TatsuyaTsukui/AlveolarLineage)
Data availability
The scRNA-seq data generated in this study are deposited in Gene Expression Omnibus (GEO) (GSE210341). Human scRNA-seq data analyses were performed using publicly available data, GSE132771, GSE147066, and GSE135893.
Reference
- 1.Buechler MB et al. Cross-tissue organization of the fibroblast lineage. Nature 593, 575–579 (2021). [DOI] [PubMed] [Google Scholar]
- 2.Tsukui T et al. Collagen-producing lung cell atlas identifies multiple subsets with distinct localization and relevance to fibrosis. Nat Commun 11, 1920 (2020). [DOI] [PMC free article] [PubMed] [Google Scholar]
- 3.Plikus MV et al. Fibroblasts: Origins, definitions, and functions in health and disease. Cell 184, 3852–3872 (2021). [DOI] [PMC free article] [PubMed] [Google Scholar]
- 4.Hinz B & Lagares D Evasion of apoptosis by myofibroblasts: a hallmark of fibrotic diseases. Nat Rev Rheumatol 16, 11–31 (2020). [DOI] [PMC free article] [PubMed] [Google Scholar]
- 5.Henderson NC, Rieder F & Wynn TA Fibrosis: from mechanisms to medicines. Nature 587, 555–566 (2020). [DOI] [PMC free article] [PubMed] [Google Scholar]
- 6.Ruiz-Villalba A et al. Single-Cell RNA Sequencing Analysis Reveals a Crucial Role for CTHRC1 (Collagen Triple Helix Repeat Containing 1) Cardiac Fibroblasts After Myocardial Infarction. Circulation 142, 1831–1847 (2020). [DOI] [PMC free article] [PubMed] [Google Scholar]
- 7.Melms JC et al. A molecular single-cell lung atlas of lethal COVID-19. Nature 595, 114–119 (2021). [DOI] [PMC free article] [PubMed] [Google Scholar]
- 8.Pakshir P et al. The myofibroblast at a glance. Journal of Cell Science 133, jcs227900 (2020). [DOI] [PubMed] [Google Scholar]
- 9.Friedman SL, Sheppard D, Duffield JS & Violette S Therapy for Fibrotic Diseases: Nearing the Starting Line. Science Translational Medicine 5, 167sr1–167sr1 (2013). [DOI] [PubMed] [Google Scholar]
- 10.Narvaez del Pilar O, Gacha Garay MJ & Chen J Three-axis classification of mouse lung mesenchymal cells reveals two populations of myofibroblasts. Development 149, dev200081 (2022). [DOI] [PMC free article] [PubMed] [Google Scholar]
- 11.McGowan SE & Torday JS The pulmonary lipofibroblast (lipid interstitial cell) and its contributions to alveolar development. Annu Rev Physiol 59, 43–62 (1997). [DOI] [PubMed] [Google Scholar]
- 12.Barkauskas CE et al. Type 2 alveolar cells are stem cells in adult lung. J Clin Invest 123, 3025–3036 (2013). [DOI] [PMC free article] [PubMed] [Google Scholar]
- 13.Hasegawa K et al. Fraction of MHCII and EpCAM expression characterizes distal lung epithelial cells for alveolar type 2 cell isolation. Respiratory Research 18, 150 (2017). [DOI] [PMC free article] [PubMed] [Google Scholar]
- 14.Gurczynski SJ & Moore BB IL-17 in the lung: the good, the bad, and the ugly. Am J Physiol Lung Cell Mol Physiol 314, L6–L16 (2018). [DOI] [PMC free article] [PubMed] [Google Scholar]
- 15.Croft AP et al. Distinct fibroblast subsets drive inflammation and damage in arthritis. Nature 570, 246–251 (2019). [DOI] [PMC free article] [PubMed] [Google Scholar]
- 16.Öhlund D et al. Distinct populations of inflammatory fibroblasts and myofibroblasts in pancreatic cancer. Journal of Experimental Medicine 214, 579–596 (2017). [DOI] [PMC free article] [PubMed] [Google Scholar]
- 17.Boyd DF et al. Exuberant fibroblast activity compromises lung function via ADAMTS4. Nature 587, 466–471 (2020). [DOI] [PMC free article] [PubMed] [Google Scholar]
- 18.Korsunsky I et al. Cross-tissue, single-cell stromal atlas identifies shared pathological fibroblast phenotypes in four chronic inflammatory diseases. Med 0, (2022). [DOI] [PMC free article] [PubMed] [Google Scholar]
- 19.Cao J et al. The single-cell transcriptional landscape of mammalian organogenesis. Nature 566, 496–502 (2019). [DOI] [PMC free article] [PubMed] [Google Scholar]
- 20.Liu W et al. Antiflammin-1 attenuates bleomycin-induced pulmonary fibrosis in mice. Respiratory Research 14, 101 (2013). [DOI] [PMC free article] [PubMed] [Google Scholar]
- 21.Strobel B et al. Time and phenotype-dependent transcriptome analysis in AAV-TGFβ1 and Bleomycin-induced lung fibrosis models. Sci Rep 12, 12190 (2022). [DOI] [PMC free article] [PubMed] [Google Scholar]
- 22.Elyada E et al. Cross-Species Single-Cell Analysis of Pancreatic Ductal Adenocarcinoma Reveals Antigen-Presenting Cancer-Associated Fibroblasts. Cancer Discovery 9, 1102–1123 (2019). [DOI] [PMC free article] [PubMed] [Google Scholar]
- 23.Adams TS et al. Single-cell RNA-seq reveals ectopic and aberrant lung-resident cell populations in idiopathic pulmonary fibrosis. Science Advances 6, eaba1983 (2020). [DOI] [PMC free article] [PubMed] [Google Scholar]
- 24.Habermann AC et al. Single-cell RNA sequencing reveals profibrotic roles of distinct epithelial and mesenchymal lineages in pulmonary fibrosis. Science Advances 6, eaba1972 (2020). [DOI] [PMC free article] [PubMed] [Google Scholar]
- 25.Katzenstein A-LA & Myers JL Idiopathic Pulmonary Fibrosis. Am J Respir Crit Care Med 157, 1301–1315 (1998). [DOI] [PubMed] [Google Scholar]
- 26.Barratt SL, Creamer A, Hayton C & Chaudhuri N Idiopathic Pulmonary Fibrosis (IPF): An Overview. J Clin Med 7, 201 (2018). [DOI] [PMC free article] [PubMed] [Google Scholar]
- 27.Kuhn C et al. An immunohistochemical study of architectural remodeling and connective tissue synthesis in pulmonary fibrosis. Am Rev Respir Dis 140, 1693–1703 (1989). [DOI] [PubMed] [Google Scholar]
- 28.Massagué J & Sheppard D TGF-β signaling in health and disease. Cell 186, 4007–4037 (2023). [DOI] [PMC free article] [PubMed] [Google Scholar]
- 29.Valenzi E et al. Single-cell analysis reveals fibroblast heterogeneity and myofibroblasts in systemic sclerosis-associated interstitial lung disease. Annals of the Rheumatic Diseases 78, 1379–1387 (2019). [DOI] [PMC free article] [PubMed] [Google Scholar]
- 30.Dominguez CX et al. Single-Cell RNA Sequencing Reveals Stromal Evolution into LRRC15+ Myofibroblasts as a Determinant of Patient Response to Cancer Immunotherapy. Cancer Discovery 10, 232–253 (2020). [DOI] [PubMed] [Google Scholar]
- 31.Binks AP, Beyer M, Miller R & LeClair RJ Cthrc1 lowers pulmonary collagen associated with bleomycin-induced fibrosis and protects lung function. Physiol Rep 5, e13115 (2017). [DOI] [PMC free article] [PubMed] [Google Scholar]
- 32.Li J et al. Autocrine CTHRC1 activates hepatic stellate cells and promotes liver fibrosis by activating TGF-β signaling. EBioMedicine 40, 43–55 (2019). [DOI] [PMC free article] [PubMed] [Google Scholar]
- 33.Voehringer D, Liang H-E & Locksley RM Homeostasis and effector function of lymphopenia-induced ‘memory-like’ T cells in constitutively T cell-depleted mice. J Immunol 180, 4742–4753 (2008). [DOI] [PMC free article] [PubMed] [Google Scholar]
- 34.Madisen L et al. A robust and high-throughput Cre reporting and characterization system for the whole mouse brain. Nat Neurosci 13, 133–140 (2010). [DOI] [PMC free article] [PubMed] [Google Scholar]
- 35.Yata Y et al. DNase I-hypersensitive sites enhance alpha1(I) collagen gene expression in hepatic stellate cells. Hepatology 37, 267–276 (2003). [DOI] [PubMed] [Google Scholar]
- 36.Redente EF et al. Age and sex dimorphisms contribute to the severity of bleomycin-induced lung injury and fibrosis. American Journal of Physiology-Lung Cellular and Molecular Physiology 301, L510–L518 (2011). [DOI] [PMC free article] [PubMed] [Google Scholar]
- 37.Henderson NC et al. Targeting of αv integrin identifies a core molecular pathway that regulates fibrosis in several organs. Nat Med 19, 1617–1624 (2013). [DOI] [PMC free article] [PubMed] [Google Scholar]
- 38.Hao Y et al. Integrated analysis of multimodal single-cell data. Cell 184, 3573–3587.e29 (2021). [DOI] [PMC free article] [PubMed] [Google Scholar]
- 39.McGinnis CS, Murrow LM & Gartner ZJ DoubletFinder: Doublet Detection in Single-Cell RNA Sequencing Data Using Artificial Nearest Neighbors. cels 8, 329–337.e4 (2019). [DOI] [PMC free article] [PubMed] [Google Scholar]
- 40.Haghverdi L, Lun ATL, Morgan MD & Marioni JC Batch effects in single-cell RNA-sequencing data are corrected by matching mutual nearest neighbors. Nat Biotechnol 36, 421–427 (2018). [DOI] [PMC free article] [PubMed] [Google Scholar]
- 41.Street K et al. Slingshot: cell lineage and pseudotime inference for single-cell transcriptomics. BMC Genomics 19, 477 (2018). [DOI] [PMC free article] [PubMed] [Google Scholar]
- 42.Marsh S, Salmon M & Hoffman P samuel-marsh/scCustomize: Version 1.1.1. Zenodo 10.5281/zenodo.7534950 (2023). [DOI]
- 43.Susaki EA et al. Versatile whole-organ/body staining and imaging based on electrolyte-gel properties of biological tissues. Nat Commun 11, 1982 (2020). [DOI] [PMC free article] [PubMed] [Google Scholar]
- 44.Meeker AK, Heaphy CM, Davis CM, Roy S & Platz EA Photochemical pre-bleaching of formalin-fixed archival prostate tissues significantly reduces autofluorescence to facilitate multiplex immunofluorescence staining. 2021.11.09.467916 Preprint at 10.1101/2021.11.09.467916 (2021). [DOI]
- 45.Crowley G et al. Quantitative lung morphology: semi-automated measurement of mean linear intercept. BMC Pulm Med 19, 206 (2019). [DOI] [PMC free article] [PubMed] [Google Scholar]
Associated Data
This section collects any data citations, data availability statements, or supplementary materials included in this article.
Supplementary Materials
Data Availability Statement
The scRNA-seq data generated in this study are deposited in Gene Expression Omnibus (GEO) (GSE210341). Human scRNA-seq data analyses were performed using publicly available data, GSE132771, GSE147066, and GSE135893.