

Abstract
In many lab-on-chip applications, it is necessary to remove bubbles from the flow stream. Existing bubble removal strategies have various drawbacks such as low degassing efficiency, long degassing time, large dead volumes, sensitivity to surfactants, and the need for an external vacuum or pressure source. We report on a novel, simple, robust, passive, nozzle-type, membrane-based debubbler that can be readily incorporated into microfluidic devices for rapid degassing. The debubbler is particularly suitable to operate with microfluidic systems made with plastic. The debubbler consists of a hydrophobic, porous membrane that resembles a normally closed valve, which is forced open by the working fluid’s pressure. To illustrate the operation of the debubbler, we describe its use in the context of a chip containing a bead array for immunoassays. Our debubbler was able to completely filter gas bubbles out of a segmented flow at rates up to 60 μl/s/mm2 of membrane area.
Introduction
In many microfluidic applications, unwanted bubbles inadvertently introduced into the microfluidic system can significantly and negatively affect device operation and experimental outcomes.1–5 For example, occurrence of air bubbles in microfluidic devices can obstruct fluidic paths and distort flows,1 damage cells at a liquid–gas interface,2,3 reduce PCR amplification efficiency,4 and interfere with bead array-based assays.5 A great deal of care is required to operate and fill these devices without bubbles. Bubbles are usually formed at interconnects, are introduced when switching reagents during sequential flow, and can often be produced during heating.
Traditional bubble traps are often ineffective for microfluidic applications, as they require relatively large dead volumes. An in-line microfluidic debubbler is highly desirable. Numerous debubblers have been explored for trapping and removing gas bubbles from microfluidic devices.6–11 The debubblers generally fall into two major categories: (i) active debubblers, which usually use pneumatics or vacuum to trap and dissipate bubbles and (ii) passive debubblers, which mainly rely on buoyancy or surface tension. For example, Skelley and Voldman successfully demonstrated an active debubbler, which could trap and remove air bubbles from a continuous flow in a microfluidic device using a thin, gas-permeable, PDMS membrane as a degassing matrix material.6 Sung and Shuler incorporated a PDMS membrane-based debubbler into their microfluidic chip for cell culture.7 However, the reported gas removal rates were relatively low (typically 1×10⁻⁴ μl/s/mm2) and required at least several minutes of degassing time.7 In addition, active methods require an external vacuum source, which is particularly inconvenient for portable, point-of-care, integrated microfluidic devices. In contrast, passive debubblers offer a simpler degassing method. Zheng et al. reported two types of integrated bubble traps (IBT) for on-chip cell culture. Their bubble trap chamber captures bubbles by utilizing the buoyancy of air bubbles in a liquid and provides a space for the upward floated bubbles.8 The chambers (diameters and heights ranging from 3 mm to 5 mm), however, introduce large dead volumes, which is not suitable for microfluidic devices involving multiple reaction steps and often costly reagents. Alternatively, a hydrophobic, porous membrane can be used to achieve gas/liquid separation. For example, Meng and Kim demonstrated micropumping by directionally controlling bubble growth and subsequent removal through a hydrophobic venting membrane.9 Xu et al. designed a hydrophobic, porous membrane-based microchannel for bubble removal from pure water.10 Unfortunately, in many cases, hydrophobic membrane-based debubblers do not provide sufficiently fast degassing. Additionally, many of the existing reports do not address the degassing of real biological reagents, which often contain surfactants, proteins, and salts. The existence of these components in solution makes bubble removal more difficult because their presence both reduces the contact angle and renders bubbles more difficult to break.12
To address these concerns, we present here a simple, robust, nozzle-type, passive microfluidic strategy for rapid and efficient removal of air bubbles from liquid solutions, even when the liquids contain various surfactants. The unique feature of our debubbler is that it resembles a normally closed valve which is opened when subjected to the pressure of the working liquid. The debubbler is appropriate for use in applications when an adequate pressure source is available. To evaluate the applicability and compatibility of our debubbler with microfluidic applications, we integrated the debubbler into an agarose bead array-based microfluidic cassette. The performance of the integrated cassette was examined by detecting haptenized PCR amplicons of B. Cereus bacteria in a sequential flow.
Experimental
The debubbler
Fig. 1 depicts schematically the cross-section and the degassing principle of the debubbler. The debubbler consists of two essential components: a hydrophobic, porous, poly(tetrafluoro ethylene) (PTFE) venting membrane for rapid bubble removal and a conduit (nozzle) to direct the bubble-laden liquid towards the membrane. For our experiments, we fabricated a device with poly(methyl methacrylate) (PMMA). The 100 μm long, 330 μm inner diameter (ID), 1000 μm outer diameter (OD) nozzle was milled with a precision computer-controlled (CNC) milling machine (HAAS Automation Inc., Oxnard, CA).13 The PTFE membrane (5 μm pore size, Sterlitech Corporation, USA) was cut to a diameter of 2.5 mm with a Harris punch cutter (American MasterTech Scientific, Inc., Lodi, CA). The membrane was bonded against the nozzle with 100 μm thick, double-sided adhesive tape (3M Co., St. Paul, MN, USA) that was patterned with a CO2 laser (Universal Laser Systems Inc., USA). The suspended diameter of the membrane (D) in Fig. 1a is 1.2 mm.
Fig. 1:
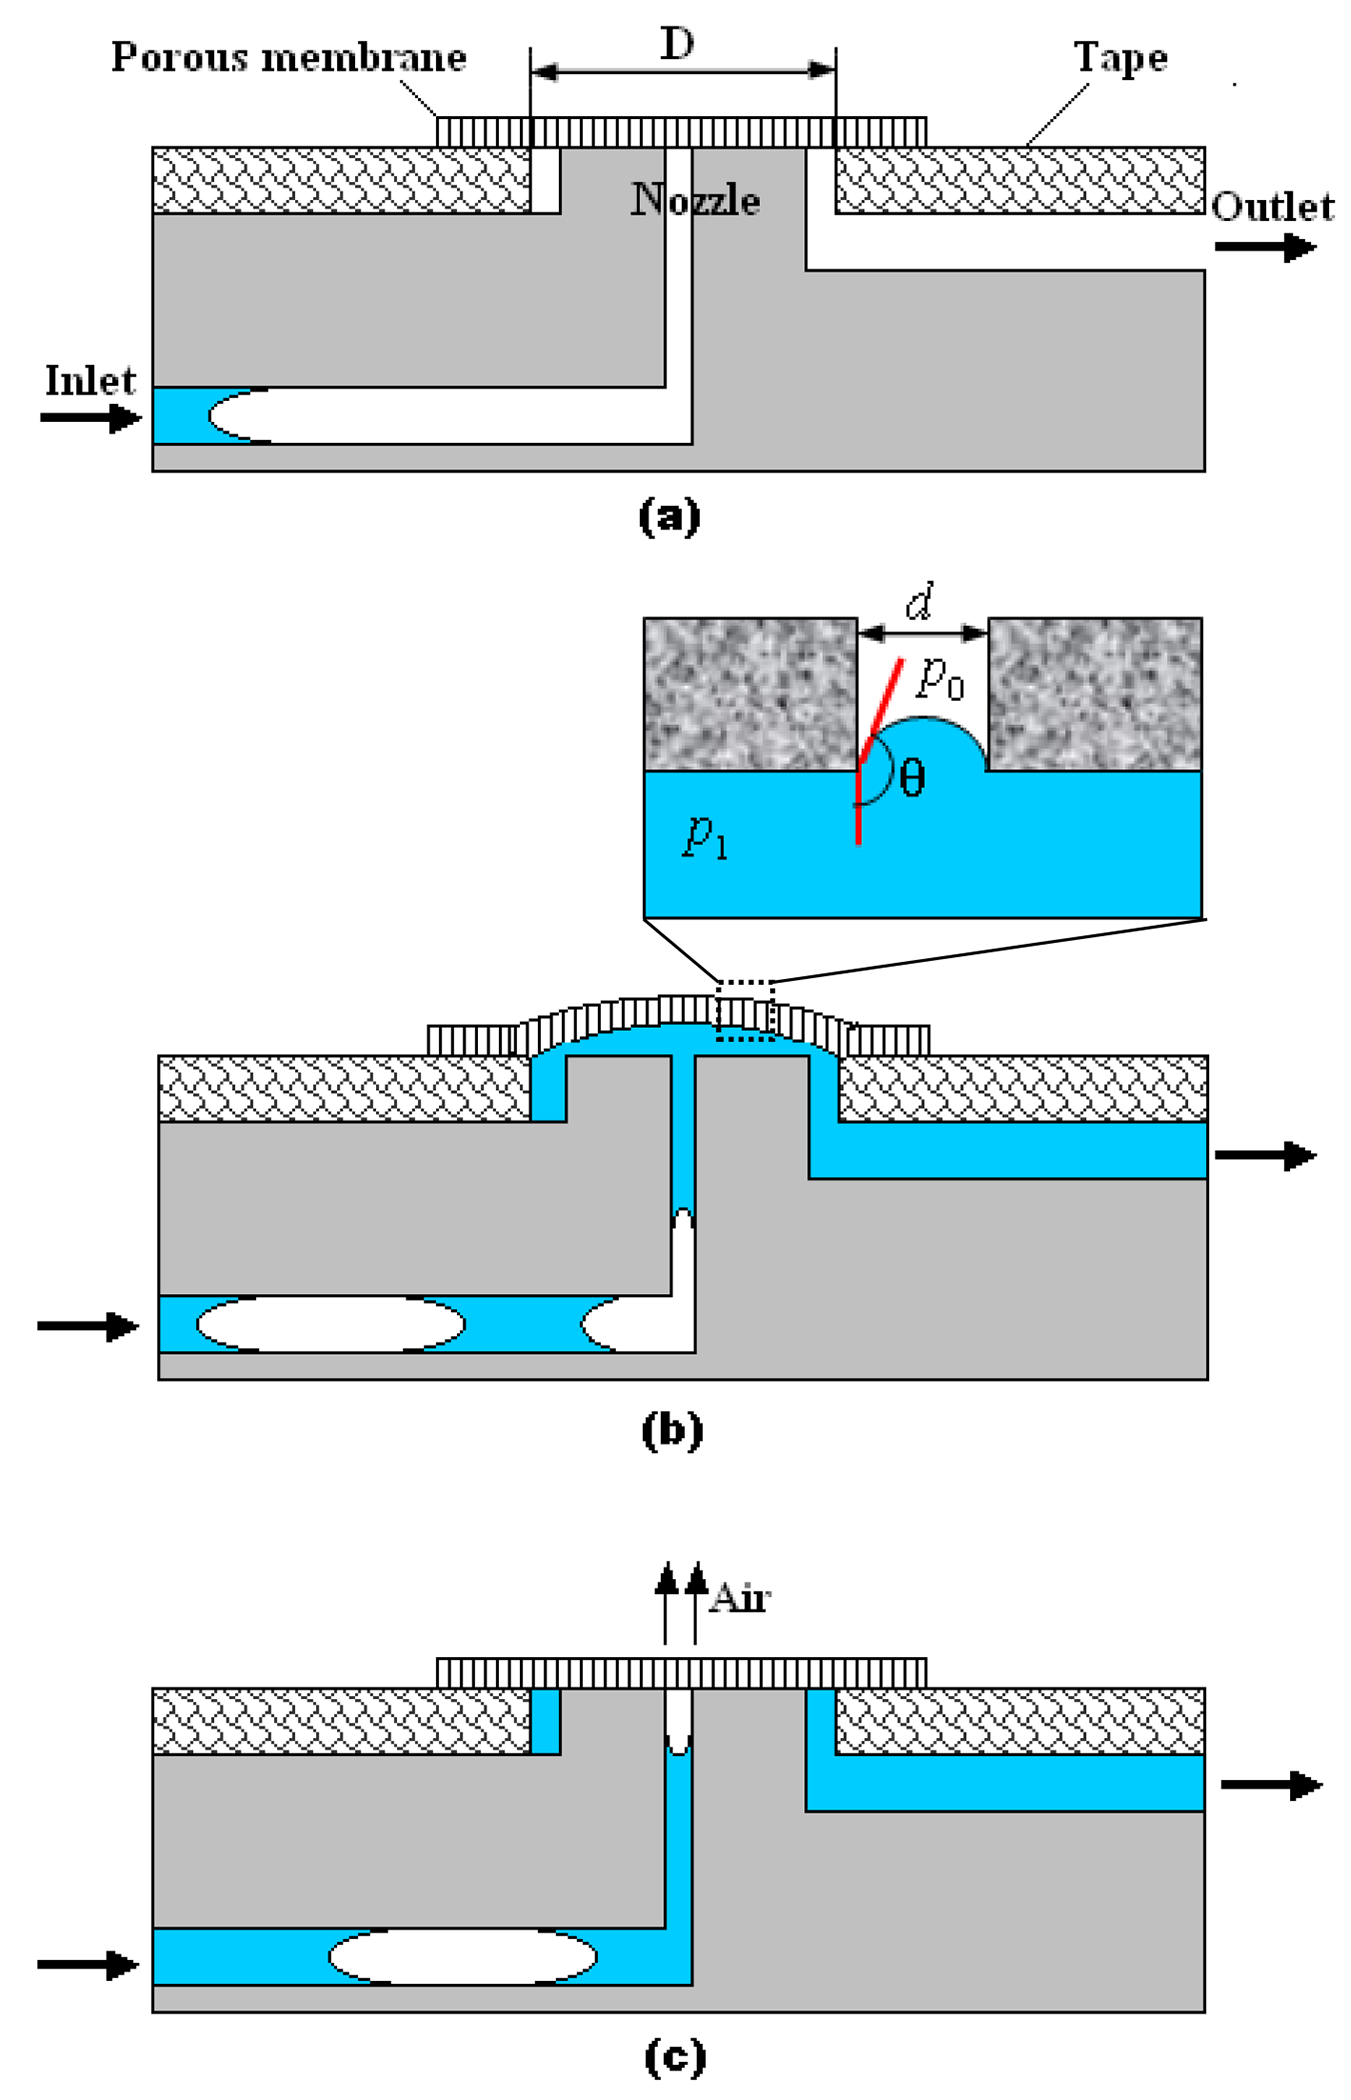
A schematic depiction of the debubbler and its degassing principle: (a) Initial, closed state before liquid has entered the debubbler. (b) Open state with liquid in the debubbler. The inset shows an air–liquid meniscus which is pinned at the pore’s entrance; surface tension maintains the pressure difference across the meniscus and prevents liquid from leaking through the pore. (c) Closed state with air bubble in the debubbler. The bubble was forced to discharge through the hydrophobic pore of the PTFE membrane.
Before the start of the degassing operation, the porous membrane pushes tightly against the nozzle’s opening, and only air can flow freely through the membrane’s pores (Fig. 1a). When liquid is delivered into the debubbler through its inlet, the air in the microchannel is discharged through the porous membrane to the ambient. When liquid pushes against the membrane (Fig. 1b), the membrane deforms and allows the passage of gas-free liquid beneath it and into the device. As long as the liquid pressure is not too high, the membrane is impermeable to liquid flow. We denote the minimal pressure needed to deform the membrane as . When air bubbles migrate towards the membrane, the gas cannot maintain the pressure popen and the porous membrane recovers its closed, undeformed stage. The liquid pressure upstream forces the bubble to discharge through the pore of the hydrophobic membrane (Fig. 1c).
Debubbler performance
We tested the debubbler’s efficiency by introducing colored deionized (DI) water or phosphate buffered saline (PBS) blocking buffer (pH 7.4 3% (w/v) bovine serum albumin (BSA) and 0.1% Tween 20) into the microfluidic channel upstream of the debubbler and seeding the liquid with air bubbles (Fig. 1c). The bubble volume was estimated from the bubble’s length and the known internal diameter of the tubing. The driving force was provided with a syringe pump (Model PHD 2000, Harvard Apparatus, Holliston, MA). Time-lapse images were recorded with a portable Sony digital camera (DCR-PC330, Japan). The time when the bubble entered the debubbler was set as t = 0. To evaluate the pressure loss through the membrane-based debubbler, the liquid pressure at the debubbler’s inlet was measured with a pressure sensor (model 26PC01K0D6A, Sensortechnics Inc., USA) and the flow rate was calculated by measuring the volume discharged at the outlet within a preset time interval.
Bead array-based cassette integrated with debubbler
To evaluate the reliability, applicability, and compatibility of the debubbler for microfluidic applications, we integrated our debubbler with an agarose bead array-based microfluidic cassette and used the cassette to detect haptenized PCR amplicons of B. Cereus bacteria. Fig. 2a, Fig. S1 (in ESI), and Fig. 2b are, respectively, an exploded view, cross-sectional view, and a photograph of the integrated cassette. This 46 mm × 36 mm × 3.4 mm cassette has two major functional domains: a degassing unit and an agarose bead array unit for the capture of target analytes. All features, including nozzles, bead wells, and microchannels, were milled in the cassette’s body using a CNC machine. The base of the cassette body was solvent-bonded to a 250 μm thick PMMA film at the room temperature. The degassing unit consists of five debubblers, each connected to an independent linear microchannel leading downstream to the bead array unit (Fig. 2b).
Fig. 2:
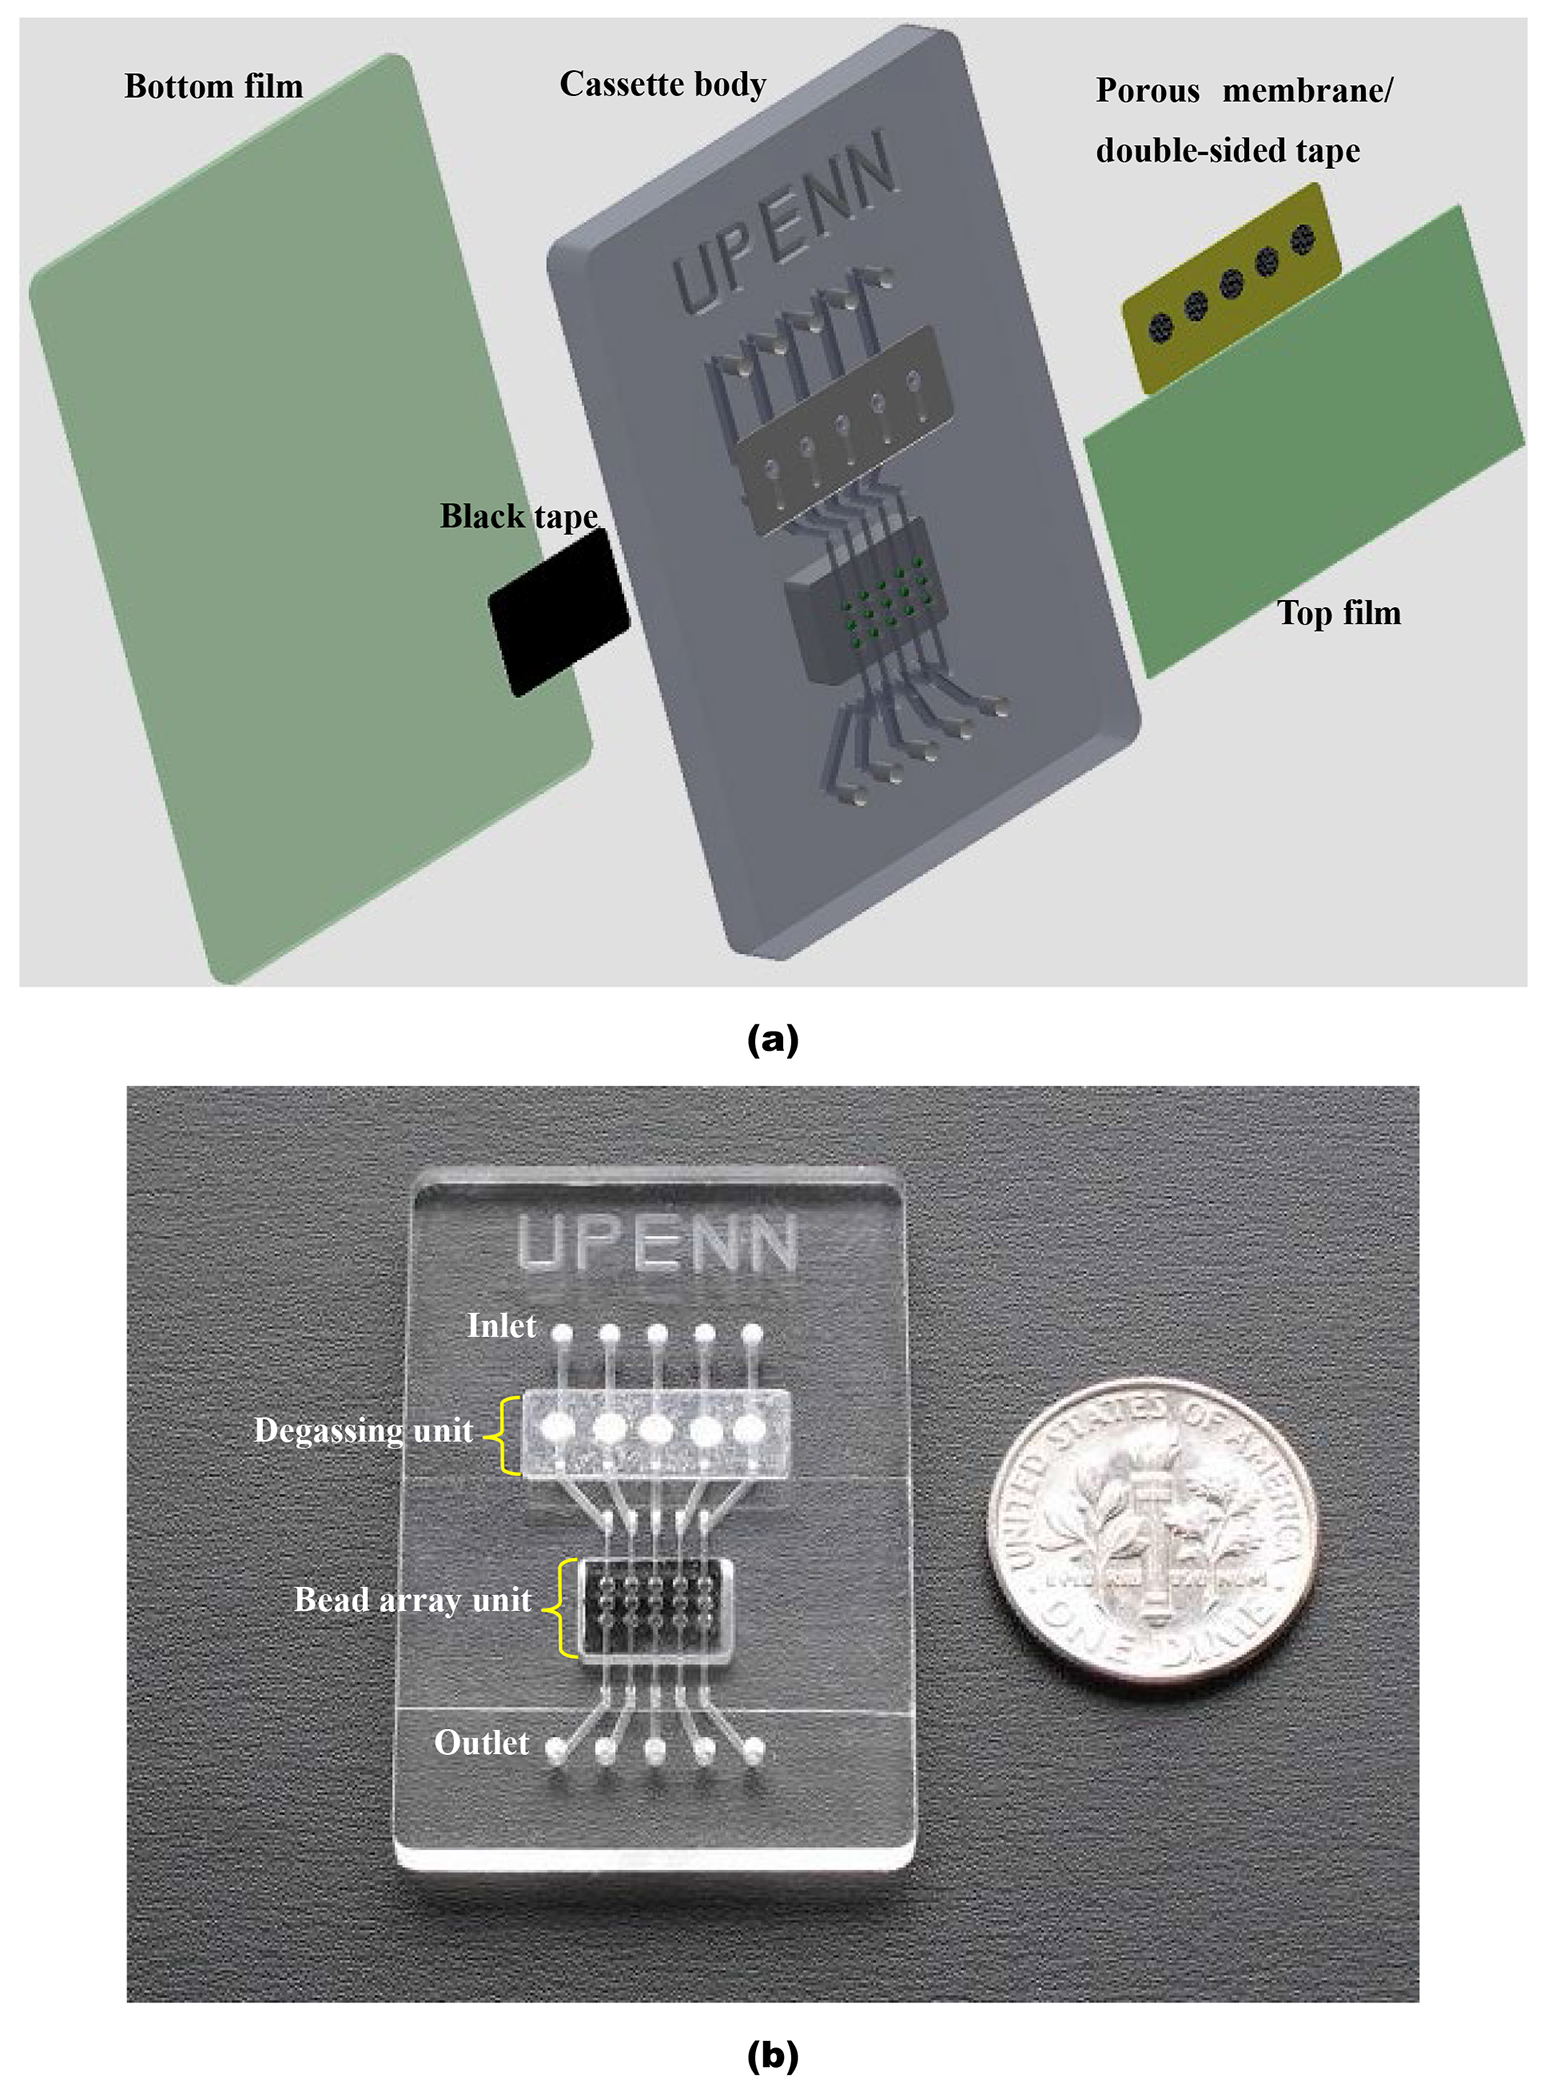
Bead array-based microfluidic cassette with integrated debubbler. (a) Exploded view of integrated cassette. The cassette consists of a top PMMA film, porous membranes within double-sided tape, a PMMA cassette body, agarose beads, black tape, and a bottom PMMA film. All microstructure features including nozzles, microchannels, and the 5 × 3 well array are milled in the PMMA cassette’s body. (b) A photograph of the assembled cassette.
Each bead array unit has three wells (600 μm diameter × 650 μm deep) along each of five adjacent channels (330 μm width × 300 μm depth). Each microfabricated well holds a single, 500 μm diameter, streptavidin-coated agarose bead. The plastic substrate beneath the beads was thinned down and coated with a carbon black tape to minimize background fluorescent emission (Fig. S1 in ESI). When sample or buffer was introduced into the cassette from the inlet, it was first degassed by the upstream debubbler, and then delivered to the beads where targets could be captured and imaged.
Detection of PCR products of B. cereus bacteria
Bacillus cereus is a Gram-positive bacteria that produces toxins, which may cause food poisoning.14 As a model analyte, the double-labeled amplicons of B. cereus genomic DNA templates were detected in our bead array-based microfluidic cassette with the integrated debubblers. Streptavidin docking sites were coupled to the aldehyde moiety of a glyoxylated agarose bead (BioScience Bead Division of CSS, West Warwick, RI) via reductive amination.16 The DNA assay on the streptavidin-coated agarose beads consisted of five sequential steps: (i) a sample containing haptenized DNA amplicons suspended in PBS buffer was delivered into the cassette at a flow rate of 10 μl/min for 2 min and incubated with the beads for 3 min at room temperature. The method of haptenizing the amplicons has been described previously.15 (ii) The beads were washed with 0.3 mL of PBS buffer at a flow rate of 30 μl/min to remove any unbound DNA. (iii) The beads were blocked with PBS blocking buffer containing 3% BSA and 0.1% Tween-20 for 10 min at a flow rate of 30 μl/min. (iv) Anti-digoxigenin-fluorescein complex suspended in PBS buffer (1:50 dilution in PBS) (Roche Diagnostics, Indianapolis, IN) was injected into the cassette at a flow rate of 10 μl/min for 3 min and incubated for 10 min with the beads. (v) The beads were washed with 0.3 mL of PBS buffer at a flow rate of 30 μl/min to remove any unbound anti-digoxigenin-fluorescein complex. The flow rates and incubation times were not optimized. This particular assay was selected for study because the numerous switching among various solutions provide ample opportunity for bubble entrapment.
Fluorescent images of the bead array were acquired with an Olympus BX51 microscope, equipped with various objectives, a filter cube (480 nm excitation, 505 long-pass beam splitter dichroic mirror, and 535±25 nm emission), a charge-coupled device (CCD) camera (PCO imaging, Germany), and a mercury discharge lamp light source. Areas of interest in the array were selected to monitor emission intensities. The data was analyzed with ImageJ analysis software (National Institutes of Health, Bethesda, MD).
Results and Discussion
Characterization of the debubbler
In our experiment, we selected PTFE as the degassing membrane due to its excellent flexibility and high hydrophobicity. In its closed state, the membrane pushes tightly against the debubbler’s nozzle. As long as the liquid pressure does not exceed a certain value, the membrane acts as a semi-permeable valve.
There are two pressures that control the operation of the debubbler. is the minimal pressure difference between the liquid pressure (p1) and the ambient pressure (p0) that is needed to deflect the membrane and allow the liquid to flow from the inlet conduit to the outlet conduit (Fig. 1b). As long as , liquid cannot reach the outlet conduit of the debubbler. The magnitude of is dictated by the suspended diameter (D), thickness, pretension, and elastic properties of the membrane, and the nozzle diameter. For our debubbler, we measured .
Once the liquid contacts the porous membrane in the debubbler, a meniscus forms at the entrance corner of a hydrophobic venting pore (see inset of Fig. 1b). This meniscus can change shape to accommodate the applied pressure difference. Although liquid will not enter spontaneously into the hydrophobic pore, external pressure may force it to enter. At equilibrium, according to the Laplace–Young equation:10
| (1) |
where d is the diameter of the pore, is the surface tension at the liquid-air interface ( for pure water), and is the angle between the meniscus and the pore’s surface. As p1 increases, increases until it exceeds the critical value . Once is exceeded, the liquid will leak through the pore. Therefore, the maximum pressure difference that the hydrophobic capillary can withstand (leakage onset pressure ) is:
| (2) |
where the maximum value is equal to the advancing contact angle , which is 115° between pure water and PTFE. When the PTFE membrane pore’s diameter is 5 μm and the working fluid is DI water, the theoretical leakage onset pressure is 24.6 kPa. In our experiments, we measured a leakage pressure of 25.2 ±4.3 kPa (n=5), which is in good agreement with the theoretical estimate.
For proper operation of the debubbler, gas must be vented without any liquid leakage; that is, we require (p1–p0)<pleak. The leakage onset pressure of 25 kPa was adequate for our application. Larger leakage onset pressures can be attained with membranes having a smaller pore diameter d. As it passes through the debubbler, the liquid is, of course, subject to evaporation at the liquid/air interface, but the rate of evaporation is deemed negligible given the small cross-sectional area of the pores.
In many microfluidic experiments, surfactants, proteins, and salts are often contained in the liquid. The presence of surfactants and proteins can not only reduce the contact angle of the liquid, but also stabilize the bubble film, rendering bubble removal more difficult.12 Here, we tested the debubbler using both DI water (Movie S1, ESI) and PBS blocking buffer (3% BSA and 0.1% Tween-20) (Movie S2, ESI), which is used in our bead array-based assay. We evaluated the efficacy of our device by watching out for the presence of air bubbles in the outlet of the debubbler. The image sequence in Fig. 3(a) demonstrates the bubble dynamics in DI water during the removal process when the flow rate is 200 μl/min. An air bubble enters the debubbler (Fig. 3a i) and migrates towards the degsassing membrane (Fig. 3a ii). Once the air bubble reaches the membrane (Fig. 3a iii), it permeates through the membrane. Downstream of the membrane, the fluid is completely bubble-free (Fig. 3a iv). Leakage of DI water and PBS blocking buffer through the membrane was found to occur, respectively, at flow rates of 310 ±21 μl/min (n=5) and 275 ±17 μl/min (n=5). Complete gas extraction was achieved for a maximum degassing rate of about 60 μl/s/mm2 in DI water with our 5 μm pore-sized PTFE membrane. This venting rate is more than eight times higher than previously reported for a hydrophobic, porous membrane-based degassing microchannel.10
Fig. 3:
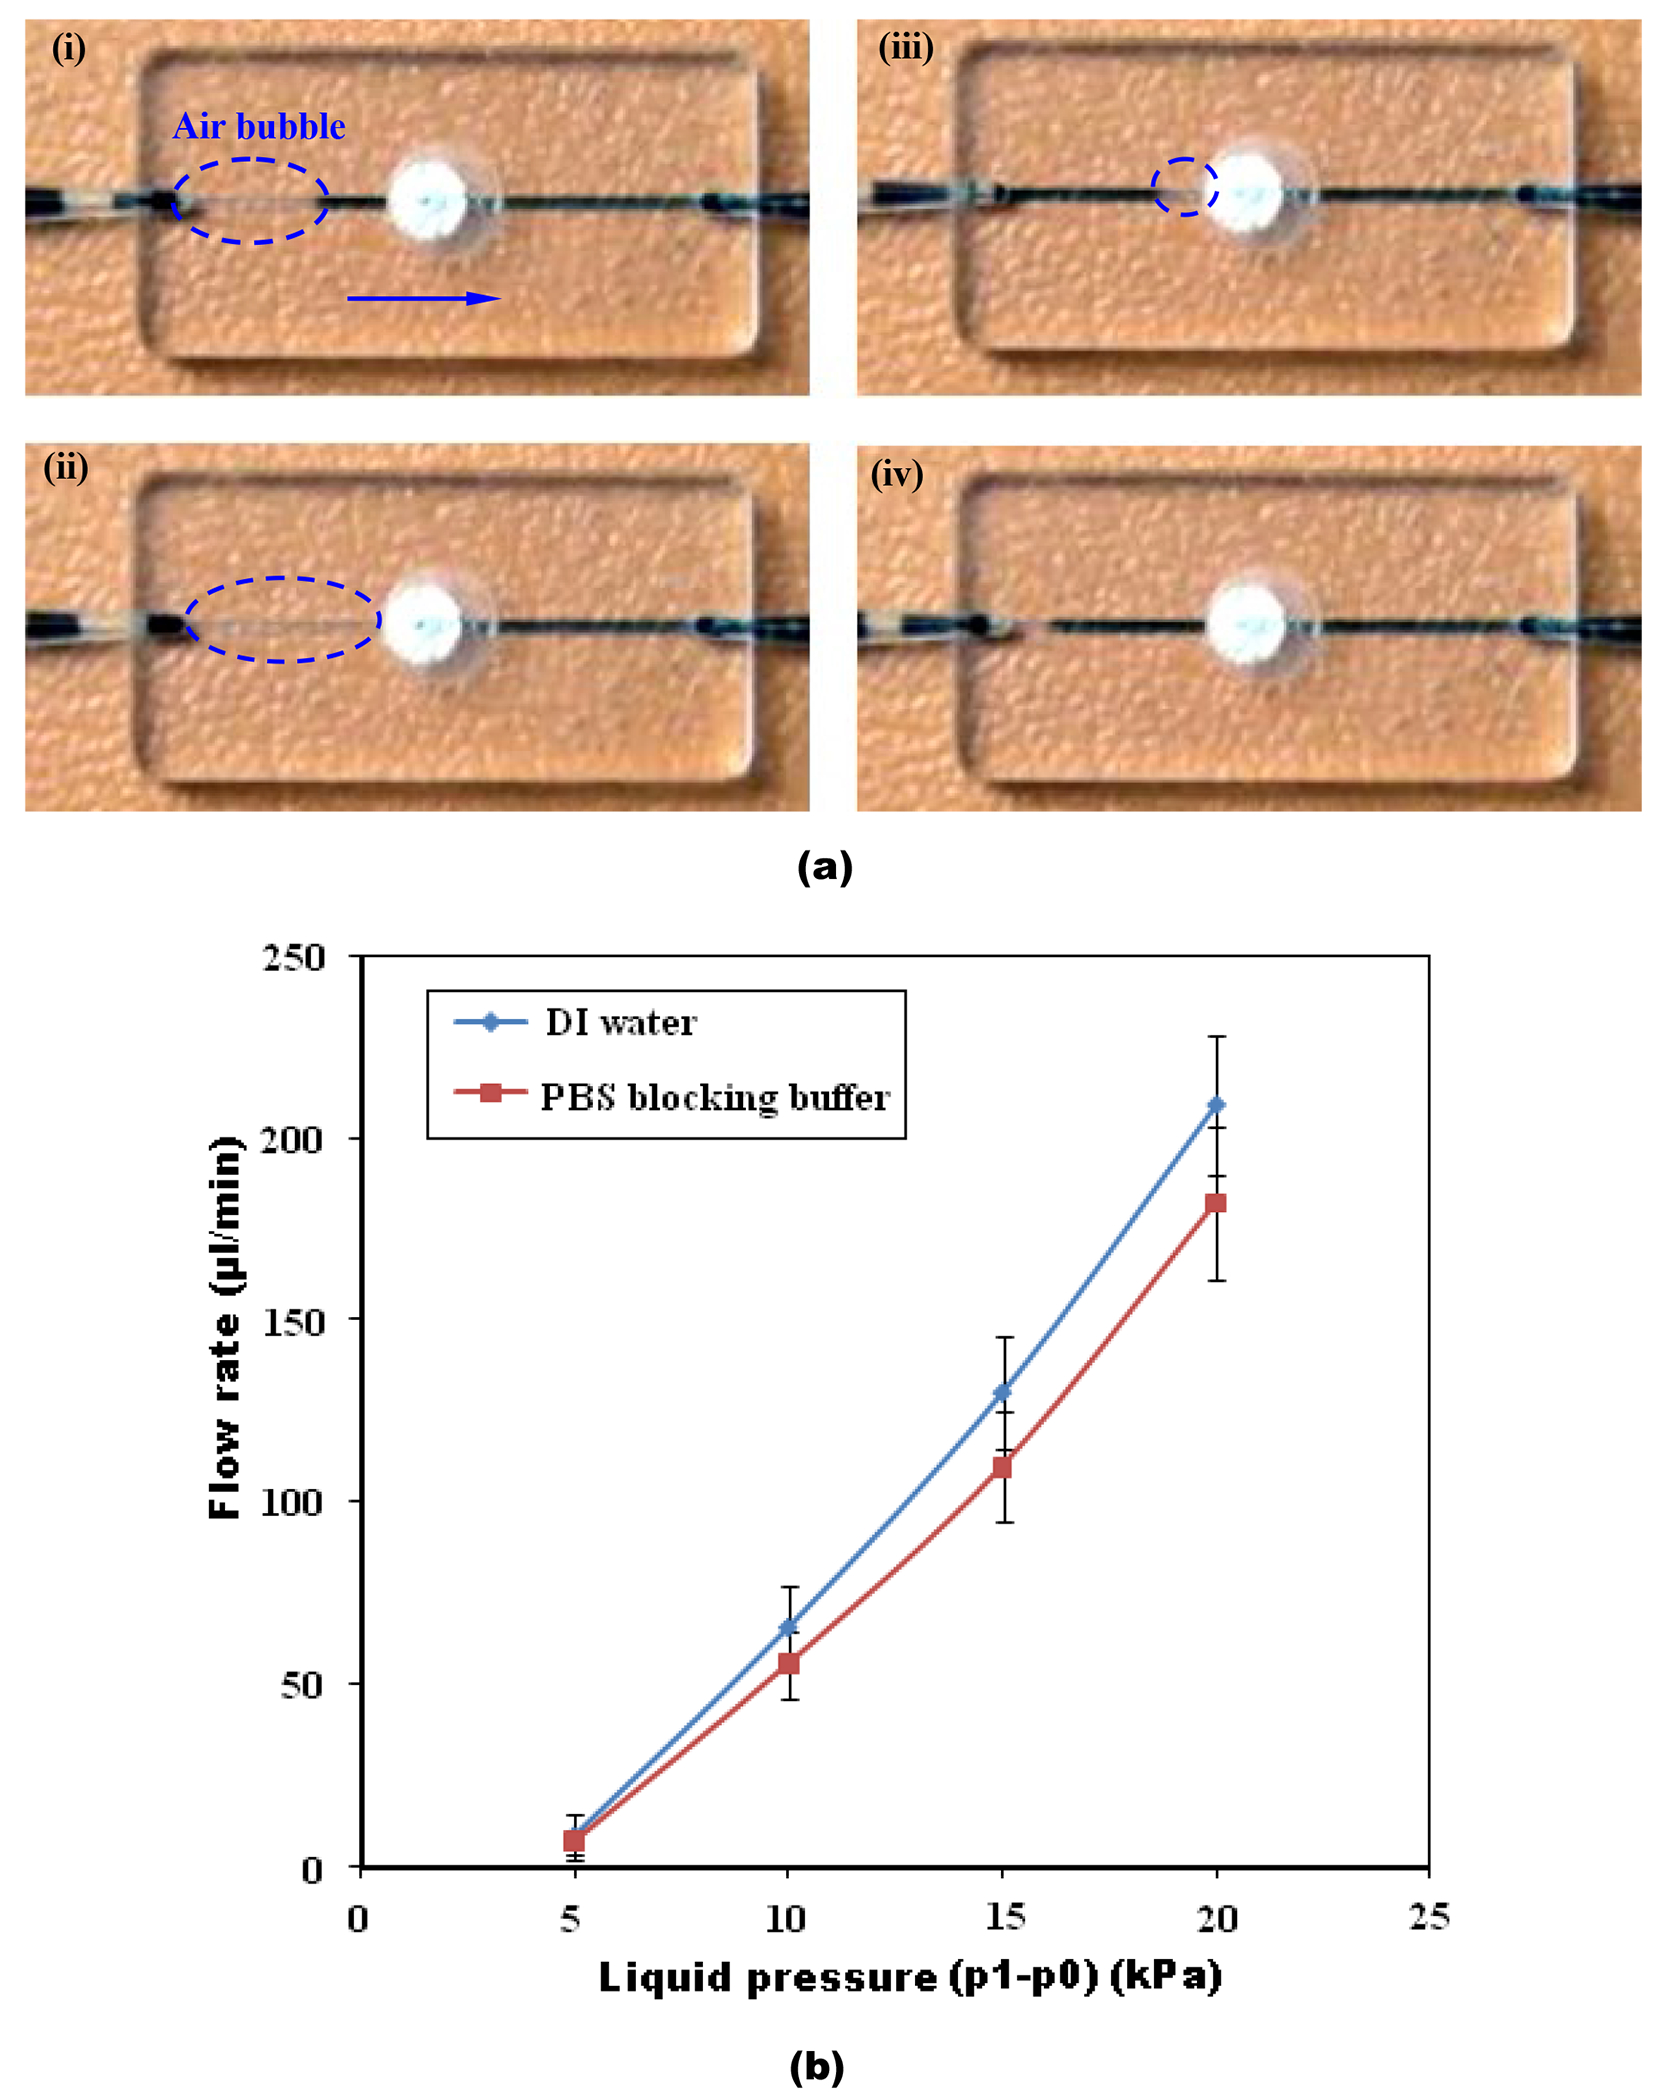
(a) A sequence of images illustrating the bubble removal process from DI water in the membrane-based debubbler. Bubbles traveling from left to right at a flow rate of 200 μl/min are completely removed from the liquid stream through the porous membrane. (i) 0 s. A bubble enters the debubbler. (ii) 0.1 s. The bubble enters the membrane region. (iii) 0.2 s. The bubble is vented. (iv) 0.3 s. The liquid downstream of the membrane is completely free of bubbles. (b) The flow rates of DI water and PBS blocking buffer through the debubbler as functions of liquid pressure (p1–p0) at the debubbler’s inlet. The error bars correspond to the scatter of the data obtained in three experiments.
We also measured the pressure loss in the debubbler. Fig. 3(b) depicts the flow rates of DI water and PBS blocking buffer through the debubbler as functions of liquid pressure (p1–p0) at the debubbler’s inlet. As long as the inlet pressure is below the threshold pressure, the membrane acts as a normally closed valve and there is no flow through the debubbler. Once the threshold pressure is exceeded, the flow rate increases slightly faster than linearly.
DNA detection on integrated cassette
Bead array-based microfluidic chips have been widely used in many bioanalytical applications due to their high throughput, low consumption of samples and reagents, and high sensitivity.17–24 These devices contain, however, wells and features that can easily trap air bubbles. Once trapped, the air bubbles accumulate, adversely affect device performance, and are very difficult to remove. To address this problem, Li et al. pumped fluids continuously at high flow rates.22 However, too high a flow rate not only wastes expensive biological reagents, but also may deform the soft agarose beads as well as adversely affect biological interactions. Sohn et al. reported a bead array-based chemical sensor using capillary-based sample introduction.5 Here, we directly incorporate our debubbler into a bead array-based cassette for rapid bubble removal under normal microfluidic operation.
Fig. S2(a) in ESI shows a fluorescent image of an agarose bead for DNA detection in our bead array-based cassette integrated with debubblers. Any air bubbles introduced upstream were successfully prevented from migrating into the bead wells, verifying the efficiency of our debubbler. In contrast, in the absence of a debubbler, a large bubble was trapped in the bead well, which interfered with the fluorescent signal acquisition as well as reagent transport to the bead surface (Fig. S2(b) in ESI).
In our experiments, background fluorescence emitted by the PMMA cassette body itself was of concern because high background fluorescence may seriously interfere with fluorescence detection and reduce detection sensitivity. Our experience indicates that the thinner the PMMA material, the lower the background emission. Accordingly, we reduced the thickness of the PMMA substrate to 0.8 mm without sacrificing the structural integrity of the cassette by milling a 8 mm long × 5 mm wide × 2.2 mm deep chamber beneath the agarose bead array (Fig. S1 in ESI). To further reduce interference from external sources, a black, low background fluorescence, carbon, double-sided adhesive tape was attached to the milled chamber (Fig. S3 in ESI).
To demonstrate the effectiveness of the bead array with the integrated bubbler, we used the array to detect PCR-amplified B. Cereus DNA sequences of 305-bp length. To this end, we haptenized the primers with biotin and digoxigenin (dig). As a result, the PCR amplification products were functionalized with biotin and dig. The B. Cereus DNA amplicons bonded to the streptavidin-coated agarose bead in the cassette through their biotin functionalization and the label bonded to the amplicon via the dig functionalization. Fig. S4 in ESI depicts the operating principle of the streptavidin-coated agarose bead assay. The fluorescent signal depended on the amount of the bound fluorescein complexes. Fig. 4a is a sequence of fluorescent images of the beads with different PCR amplicon concentrations obtained from samples containing B. Cereus DNA templates ranging in mass from 0 to 10 ng. In the presence of the upstream debubbler, no air bubbles were observed in the bead wells. Fig. 4b depicts the measured fluorescent intensity of the beads as a function of the B. Cereus DNA template concentration (prior to amplification). Bars 1, 2, 3, 4, 5 correspond, respectively, to DNA template of masses of 10, 1, 0.1, 0.01, and 0 (negative control) ng (n=6). Fig. 4c is a gel electropherogram of the various PCR amplicons. Lane M is the DNA marker VIII (Roche Diagnostics). Lanes 1-5 should be cross-referenced with columns 1-5 in Fig. 4b. Fig. 4 clearly demonstrates that the accumulation of bubbles was successfully prevented. In our experiments, the cassette could detect amplicons of 10 pg DNA template of B. Cereus, which exceeds the detection ability of conventional gel electrophoresis by approximately a factor of 10.
Fig. 4:
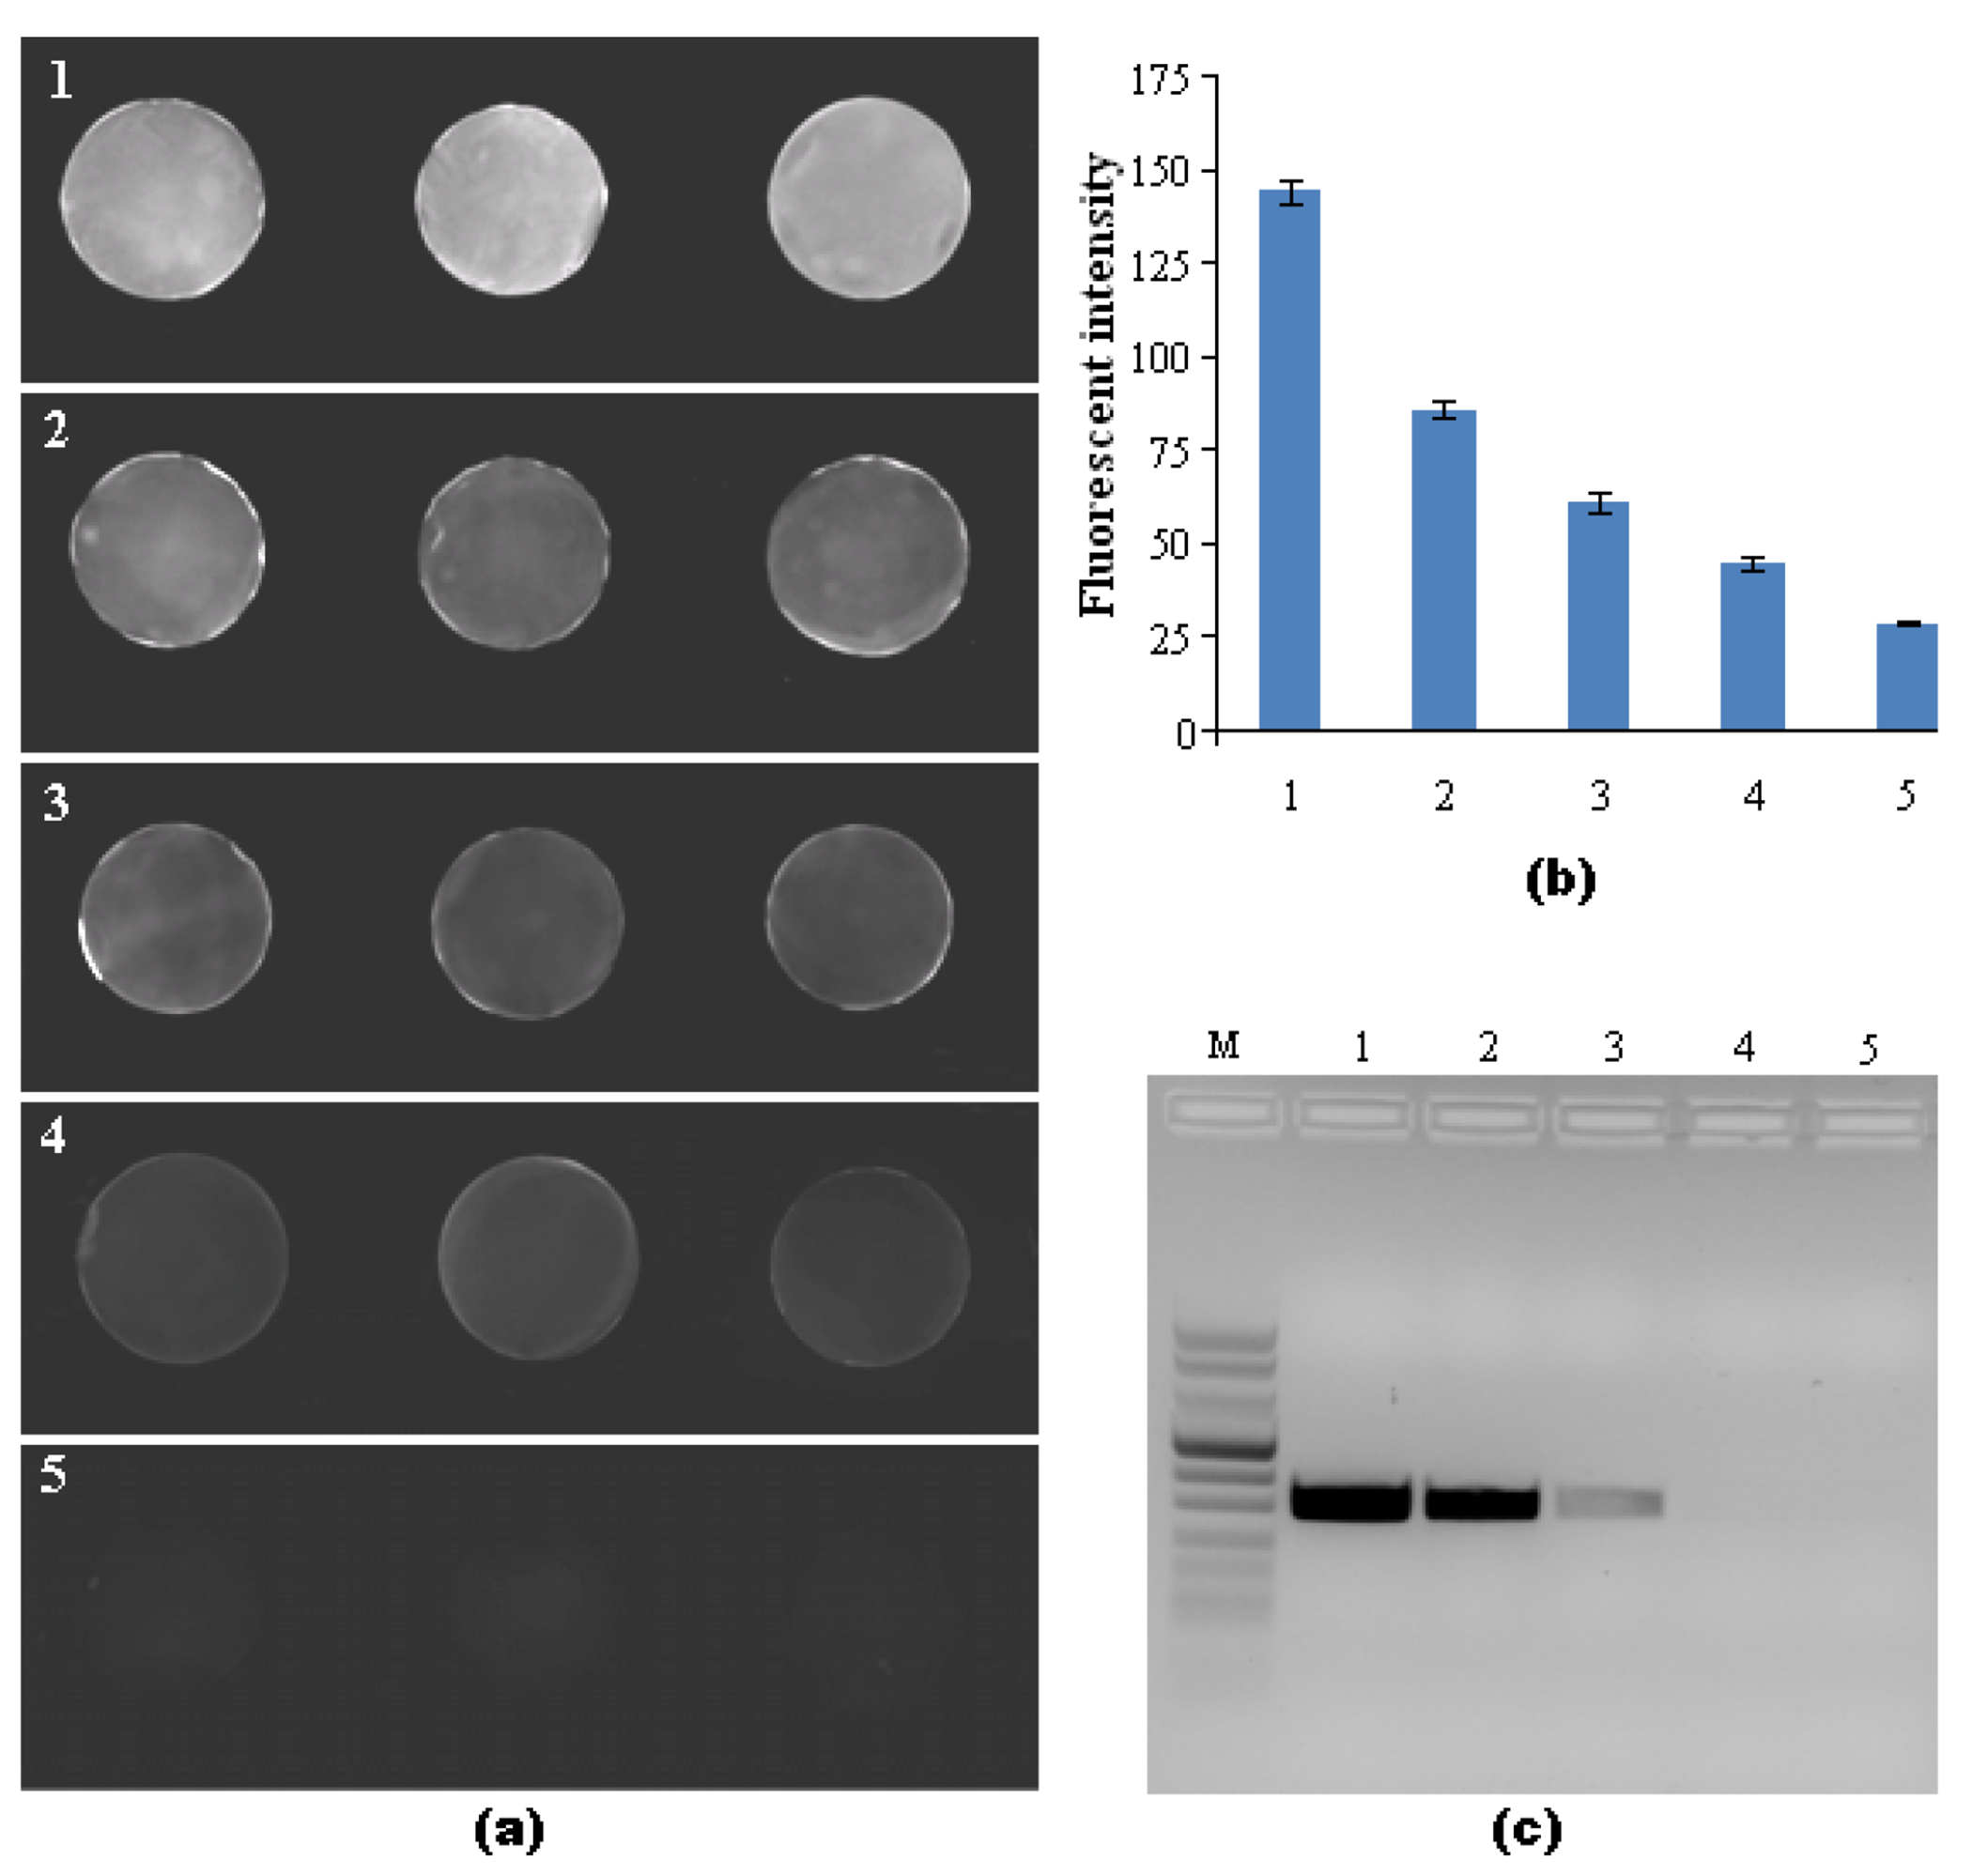
Detection of PCR amplicons of B. Cereus genomic DNA: (a) A fluorescent image of three streptavidin-coated beads at different DNA concentrations in the integrated microfluidic debubbler cassette. Groups 1, 2, 3, 4 and 5 correspond, respectively, to template masses of 10, 1, 0.1, 0.01 and 0 ng (negative control) of DNA. (b) Measured intensity of agarose beads at different PCR amplicon concentrations obtained from 0 to 10 ng template. The various samples are cross-referenced with (a). The error bars correspond to the scatter of the data obtained in six agarose beads. (c) Agarose gel (2.0%) electrophoresis images of PCR products amplified from B. Cereus genomic DNA. The various lanes are cross-referenced with (a). Lane M is the DNA Marker VIII ladder.
Conclusion and Outlook
We have presented a simple, robust, efficient, low dead volume, nozzle-type, passive, membrane-based debubbler that can be readily integrated upstream of bubble-sensitive, microfluidic modules. This allows the modules to operate properly even when the flow stream entering the device is laden with gas bubbles. The debubbler allows for rapid and complete degassing. The device requires a pressure source, and can operate with pure water as well as with buffers containing surfactants.
To demonstrate the debubblers’ usefulness, the debubbler was incorporated into a bead array-based microfluidic cassette, which we used to detect haptenized PCR amplicons of B. Cereus bacteria. The bead array outperformed conventional gel electrophoresis. The proposed debubbler can also work as an independent or integrated module in a variety of other microfluidic flow devices.25
Supplementary Material
Acknowledgments
This work was supported, in part, by NIH Grant U01DE017855 to the University of Pennsylvania.
References
- 1.Meng DD, Cubaud T, Ho C-M and Kim C-J, J. Microelectromech. Syst, 2007, 16, 1403–1410. [Google Scholar]
- 2.Leclerc E, Sakai Y and Fujii T, Biomed. Microdevices, 2003, 5, 109–114. [Google Scholar]
- 3.Kim L, Vahey MD, Lee H-Y and Voldman J, Lab Chip, 2006, 6, 394–406. [DOI] [PubMed] [Google Scholar]
- 4.Nakayama T, Hiep HM, Furui S, Yonezawa Y, Saito M, Takamura Y, Tamiya E, Anal. Bioanal. Chem, 2010, 396, 457–464. [DOI] [PubMed] [Google Scholar]
- 5.Sohn YS, Goodey A, Anslyn EV, McDevitt JT, Shear JB, Neikirk DP, Biosens Bioelectron., 2005, 21, 303–312. [DOI] [PubMed] [Google Scholar]
- 6.Skelley AM and Voldman J, Lab Chip, 2008, 8, 1733–1737. [DOI] [PubMed] [Google Scholar]
- 7.Sung JH and Shuler ML, Biomed. Microdevices, 2009, 11, 731–738. [DOI] [PubMed] [Google Scholar]
- 8.Zheng W, Wang Z, Zhang W and Jiang X, Lab chip, 2010, 10, 2906–2910. [DOI] [PubMed] [Google Scholar]
- 9.Meng DD and Kim CJ, Lab Chip, 2008, 8, 958–968. [DOI] [PubMed] [Google Scholar]
- 10.Xu J, Vaillant R and Attinger D, Microfluid. Nanofluid, 2010, 9, 9:765–772. [Google Scholar]
- 11.Cheng D and Jiang H, Applied Physics Letters, 2009, 95, 214103 [Google Scholar]
- 12.Wang Z, Narsimhan G and Kim D, Food Sci. Technol, 2008, 41, 1232–1238 [Google Scholar]
- 13.Liu C, Qiu X, Ongagna S, Chen D, Chen Z, Abrams WR, Malamud D, Corstjens PLAM and Bau HH, Lab chip, 2009, 9, 768–776. [DOI] [PMC free article] [PubMed] [Google Scholar]
- 14.Fricker M, Messelhäußer U, Busch U, Scherer S and Ehling-Schulz M, Appl. Environ. Microbiol, 2007, 73, 1892–1898. [DOI] [PMC free article] [PubMed] [Google Scholar]
- 15.Liu C, Schrlau MG and Bau HH, Biosens. Bioelectron 2009, 25, 809–814. [DOI] [PMC free article] [PubMed] [Google Scholar]
- 16. http://www.bioscience-beads.com/techsupport.htm [Google Scholar]
- 17.Floriano PN, Christodoulides N, Miller CS, Ebersole JL, Spertus J, Rose BG, Kinane DF, Novak MJ, Steinhubl S, Acosta S, Mohanty S, Dharshan P, Yeh CK, Redding S, Furmaga W, McDevitt JT, Clin Chem. 2009, 55, 1530–1538. [DOI] [PMC free article] [PubMed] [Google Scholar]
- 18.Wen J, Yang X, Wang K , Tan W, Zhou L, Zuo X, Zhang H and Chen Y, Biosens Bioelectron., 2007, 22, 2759–2762. [DOI] [PubMed] [Google Scholar]
- 19.Barbee KD, Hsiao AP, Heller MJ and Huang X, Lab Chip, 2009, 9, 3268–3274 [DOI] [PMC free article] [PubMed] [Google Scholar]
- 20.Barbee KD, Hsiao AP, Roller EE and Huang X, Lab Chip, 2010, 10, 3084–3093 [DOI] [PMC free article] [PubMed] [Google Scholar]
- 21.Christodoulides N, Mohanty S, Miller CS, Langub MC, Floriano PN, Dharshan P, Ali MF, Bernard B, Romanovicz D, Anslyn E, Fox PC and McDevitt JT, Lab Chip, 2005, 5, 261–269. [DOI] [PubMed] [Google Scholar]
- 22.Li S, Floriano PN, Christodoulides N, Fozdar DY, Shao D, Ali MF, Dharshan P, Mohanty S, Neikirk D, McDevitt JT, Chen S, Biosens. Bioelectron, 2005, 21, 574–580. [DOI] [PubMed] [Google Scholar]
- 23.Thompson JA and Bau HH, J. Chromatogr. B, 2010, 878, 228–236. [DOI] [PMC free article] [PubMed] [Google Scholar]
- 24.Thompson JA, Du X, Grogan JM, Schrlau MG, Bau HH, J. Micromech. Microeng, 2010, 20, 115107. [DOI] [PMC free article] [PubMed] [Google Scholar]
- 25.Liu C, Cui D and Li H, Biosens. Bioelectron, 2010, 26, 255–261. [DOI] [PubMed] [Google Scholar]
Associated Data
This section collects any data citations, data availability statements, or supplementary materials included in this article.