

Abstract
The effects of triglyceride-glucose (TyG) related indices on cardiometabolic disease (CMD) are still unclear. Our study aimed to investigate the relationship between the TyG-related indices and CMD risk among midlife women. This retrospective observational cohort study utilized data from the 2020 SWAN participants. The TyG index was computed as Ln [fasting triglyceride (mg/dL) × fasting glucose (mg/dL)/2]. Modified TyG indices were created by integrating TyG with body mass index (BMI), waist circumference (WC), and waist-to-height ratio (WHtR). Multivariate Cox proportional hazards regression and receiver operating characteristic (ROC) analyses were conducted to assess the associations and predictive capacities of TyG and its related indices with CMD incidences. The mean age of participants was 45.7 years, comprising 420 (20.8%) Black, 184 (9.1%) Chinese, 225 (11.1%) Japanese, and 1191 (58.9%) Caucasian or Hispanic women. Over a 10-year follow-up, 837 women (41.4%) developed CMD. Compared to the lowest quartile, the adjusted hazard ratios (95% confidence intervals) for incident CMD in the highest quartile for TyG, TyG-BMI, TyG-WC, and TyG-WHtR were 1.78 (1.41–2.25), 3.26 (2.51–4.24), 3.13 (2.41–4.06), and 3.19 (2.47–4.12), respectively. The area under the ROC curve for modified TyG indices was significantly higher than that for the TyG index alone. Both the TyG and modified TyG indices were significantly associated with new-onset CMD, with modified TyG indices showing superior performance in identifying individuals at risk for CMD.
Subject terms: Cardiology, Endocrine system and metabolic diseases
Introduction
Cardiometabolic diseases (CMDs), including cardiovascular disease (CVD) and type 2 diabetes, are leading causes of morbidity and mortality among adults worldwide1. According to estimates from the Global Burden of Disease Study 2021, the prevalence of cardiometabolic-based chronic diseases—including hypertension, type 2 diabetes, and CVD phenotypes—is rapidly increasing globally2,3. CMDs continue to place a heavy burden on the healthcare system, responsible for about 31% of global deaths1. It also accounts for 15% of total healthcare spending, significantly straining healthcare resources4. Growing evidence suggests that the range of symptoms associated with metabolic disorders not only elevates the short and long-term risks for chronic metabolic diseases but also contributes to premature mortality later in life5,6. Identifying early biomarkers and risk factors for these conditions is critical for timely intervention and prevention, particularly among midlife women who experience significant metabolic changes due to aging and menopausal transition7,8.
Insulin resistance (IR) has been recognized as an independent risk factor and contributes to the onset and progression of CMDs9. Triglyceride-glucose (TyG) index, a surrogate indicator of IR and evaluating CVD risks, demonstrated significant potential in forecasting the onset and progression of various metabolic diseases10. Recent evidence also indicates that the TyG index, when combined with adiposity indicators such as body mass index (BMI), waist circumference (WC), and waist-to‐height ratio (WHtR), exhibits superior predictive performance compared to the TyG index alone in the prediction of various health outcomes in the general population11..
Midlife women are vulnerable to cardiometabolic disturbances due to shifts in body fat distribution, increased IR, and alterations in lipid metabolism which occur during aging and the menopausal transition12. While previous studies provide valuable insights in TyG in predicting CMD risk among the general population, evidence from these studies may not fully capture the nuances of cardiometabolic risk in midlife women. Research focusing on this demographic can offer tailored strategies for early intervention and prevention, ultimately improving health outcomes and reducing the burden of CMDs.
In this prospective cohort study, we aim to investigate the association between TyG-related indices and the incidence of CMDs in midlife women in the US. By leveraging multiethnic longitudinal data, we seek to elucidate whether these indices can serve as reliable markers for cardiometabolic risk in midlife women, thereby informing targeted prevention strategies and improving health outcomes in this demographic.
Methods
Study design and population
We used data from the Study of Women’s Health Across the Nation (SWAN). The detailed SWAN study protocol and design have been described previously13. Briefly, SWAN is an ongoing prospective and cohort study of midlife women conducted in 7 cities in the United States (Boston, Massachusetts; Chicago, Illinois; Detroit, Michigan; Los Angeles, California; Newark, New Jersey; Oakland, California; and Pittsburgh, Pennsylvania). It was co-sponsored by the National Institute on Aging, the National Institute of Nursing Research, the National Institutes of Health, Office of Research on Women’s Health, and the National Center for Complementary and Alternative Medicine13. This study followed the Strengthening the Reporting of Observational Studies in Epidemiology (STROBE) reporting guideline14.
Baseline eligibility criteria of study participants included: (1) aged 42–52 years; (2) having a uterus and at least 1 ovary; (3) not being pregnant or breastfeeding; (4) not using oral contraceptives or hormone therapy, and (5) having at least 1 menstrual cycle in the previous 3 months. The SWAN study protocols were approved by the institutional review boards at each site and written informed consent was obtained from each participant at each visit15. This study was reviewed by the ethical review board of the Beijing Anzhen Hospital and was considered exempt.
The baseline and first 10 annual follow-ups of the SWAN study were used in our study. A total of 3302 women were recruited in the SWAN cohort at baseline. We excluded individuals with (1) CMD at baseline (n = 960), (2) missing information on triglyceride (TG), fasting blood glucose (FBG), BMI, WC, and height (n = 211), (3) lost follow-up (n = 111). After exclusion, 2020 women were included in the present study.
Assessment of TyG-related indices
In this study, we included four TyG-related indices of interest including TyG, TyG-BMI, TyG-WC, TyG-WHtR16,17. The TyG-related indices were calculated according to previous literature as follows:
 |
 |
 |
 |
TG and FBG were measured by peripheral blood test at baseline. Blood samples were collected after overnight fasting and frozen at − 20 °C after centrifugation. All samples were sent by dry ice to the Medical Research Laboratories. Triglyceride concentrations were measured by enzymatic methods (Hitachi 747 analyzer; Boehringer Mannheim Diagnostics)18. Glucose was measured in serum by automated enzymatic assay on a Hitachi 747–200 chemistry analyzer using the hexokinase reaction and Roche Diagnostic reagents18. Height, weight, and WC were measured by physical measurement and BMI was calculated as weight in kilograms divided by square of height in meters.
Covariates
Age, race/ethnicity (Black, Chinese, Japanese, Caucasian, or Hispanic), income (≤ $19,999, $20,000-$49,999, $50,000-$99,999, or ≥ $100,000), smoking (current, former, or never), and menopause (early period, or pre-menopausal) status were collected by standardized questionnaires. Blood pressure (BP) was measured by three seated measurements and the second and third readings were averaged as the results. Blood samples measured low-density lipoprotein cholesterol (LDL-C), high-density lipoprotein cholesterol (HDL-C), C-reactive protein (CRP), estradiol, and follicle-stimulating hormone (FSH) were also included as potential confounders.
Primary outcomes
The definition of CMD in this study was a composite of 4 cardiometabolic outcomes including hypertension, isolated systolic hypertension (ISH), IR, and Type 2 diabetes19. Participants with at least one of the four categories were considered to have CMD. Hypertension was assessed as systolic BP ≥ 140 mm Hg or diastolic BP ≥ 90 mm Hg, and/or by use of antihypertensive medication20. ISH was assessed as systolic BP ≥ 140 mm Hg and diastolic BP < 90 mm Hg, and/or by use of antihypertensive medication19. Insulin was measured using a solid-phase radioimmunoassay in fasting blood samples. Individuals with homeostasis model assessment for insulin resistance (HOMA-IR) ≥ 5.92 or having self-reported insulin-treated diabetes (verified by reviewers) were considered to have IR. Type 2 diabetes was determined by having 1 or more of the following conditions: fasting serum glucose ≥ 126 mg/dL, use of insulin or oral antidiabetic medication (verified by review), or physician diagnosis. The duration of follow-up was defined as the interval from the baseline interview date to the date of outcome incidence or through the last follow-up interview, for participants without event.
Statistical analysis
The baseline characteristics were reported as mean (standard deviation, SD) for continuous variables with normal distribution, median [interquartile range, IQR] for continuous variables with skewed distribution or number (percentage) for categorical variables and were compared using t-tests, standard nonparametric tests, and χ2 tests as appropriate. Kaplan–Meier curves were applied to estimate the survival function for each quartile group of TyG-related indices. Cox proportional hazard models were used to determine hazard ratios (HRs) and corresponding 95% confidence intervals (CIs) for the associations of the TyG-related indices values and quartile groups with the CMD incidence. Schoenfeld residuals were used to test the proportional hazards assumption, and no obvious violation was observed21. We constructed 3 Cox models in this study: 1). Unadjusted model; 2). Multivariate model 1 adjusted for age, race, income, smoking status, and menopause status; and 3). Multivariate model 2 additionally adjusted for LDL-C, HDL-C, CRP, estradiol, and FSH. The nonlinear dose–response relationships between TyG-related indices and CMD were explored by using restricted cubic spline (RCS) regression. Receiver Operating Characteristic (ROC) curves and the area under the curve (AUC) were performed to evaluate the ability to predict CMD incidence of different TyG-related indices. The difference in AUC was compared using the DeLong test. To assess the robustness of the main findings, 2 sensitivity analyses were conducted. First, CMD was redefined based on a stricter hypertension definition (130/80 mm Hg). Second, participants who developed CMD within 2 years of follow-up were excluded to reduce the potential for reverse causation bias. Statistical tests were 2-sided, and statistical significance was set at P < 0.05. Statistical analyses were conducted using R software, version 4.3.0 (R Core Team, Vienna, Austria).
Results
Baseline characteristics
A total of 2020 midlife women (mean age, 45.7 years [SD 2.7]) were included in this cohort study. 420 (20.8%) were Black, 184 (9.1%) were Chinese, 225 (11.1%) were Japanese, and 1191 (58.9%) were Caucasian or Hispanic. During the median follow-up period of 9.73 years, 837 women (41.4%) had CMD incidents. Compared to women having CMD incidents, women without CMD incidents were younger, less likely to be Black and Hispanic, and had higher incomes (p < 0.01). Current smokers (17.8% vs. 11.9%) and pre-menopausal (59.7% vs. 51.6%) were more prevalent in the CMD group (p < 0.01). The participants with CMD incidents had higher BMI, WC, systolic BP, diastolic BP, triglycerides, glucose, insulin, LDL-C, CRP, FSH, and related indices levels while lower HDL-C and estradiol levels (p < 0.05; Table 1).
Table 1.
Baseline characteristics of the study population*.
| Characteristic | Overall N = 2020 |
No CMD incident (N = 1183) |
CMD incident (N = 837) |
p |
|---|---|---|---|---|
| Age, mean (SD), years | 45.7 (2.7) | 45.5 (2.6) | 45.9 (2.7) | < 0.01 |
| Race/ethnicity % | < 0.01 | |||
| Black | 420 (20.8) | 149 (12.6) | 271 (32.4) | |
| Chinese | 184 (9.1) | 130 (11.0) | 54 (6.5) | |
| Japanese | 225 (11.1) | 137 (11.6) | 88 (10.5) | |
| Caucasian | 1073 (53.1) | 705 (59.6) | 368 (44.0) | |
| Hispanic | 118 (5.8) | 62 (5.2) | 56 (6.7) | |
| Income, % | < 0.01 | |||
| ≤ $19,999 | 203 (10.3) | 85 (7.3) | 118 (14.6) | |
| $20,000-$49,999 | 658 (33.5) | 375 (32.4) | 283 (35.1) | |
| $50,000-$99,999 | 772 (39.3) | 481 (41.6) | 291 (36.1) | |
| ≥ $100,000 | 331 (16.9) | 216 (18.7) | 115 (14.3) | |
| Smoking status | < 0.01 | |||
| Current smoker | 288 (14.3) | 140 (11.9) | 148 (17.8) | |
| Former smoker | 520 (25.9) | 313 (26.6) | 207 (24.9) | |
| Never smoker | 1199 (59.7) | 723 (61.5) | 476 (57.3) | |
| Menopause status | < 0.01 | |||
| Early period | 871 (43.5) | 470 (40.2) | 401 (48.3) | |
| Pre-menopausal | 1127 (56.4) | 698 (59.7) | 429 (51.6) | |
| BMI, mean (SD), kg/m2 | 26.3 (5.8) | 24.8 (4.8) | 28.4 (6.6) | < 0.01 |
| WC, mean (SD), cm | 81.8 (13.0) | 78.5 (10.9) | 86.4 (14.1) | < 0.01 |
| Height, mean (SD), cm | 162.3 (6.7) | 162.4 (6.7) | 162.1 (6.7) | 0.21 |
| SBP, mean (SD), mmHg | 110.2 (10.5) | 106.6 (9.2) | 115.4 (10.2) | < 0.01 |
| DBP, mean (SD), mmHg | 72.1 (8.1) | 70.2 (7.5) | 74.8 (8.1) | < 0.01 |
| Triglycerides, median (IQR), mg/dL | 84.0 [63.0, 117.0] | 80.0 [61.5, 108.0] | 92.0 [65.0, 132.0] | < 0.01 |
| Glucose, mean (SD), mg/dL | 90.6 (8.7) | 89.6 (8.2) | 92.2 (9.3) | < 0.01 |
| Insulin, mean (SD), uIU/mL | 8.6 (4.0) | 7.7 (3.4) | 9.8 (4.6) | < 0.01 |
| LDL-C, mean (SD), mg/l | 114.0 (29.9) | 112.0 (30.0) | 117.0 (29.4) | < 0.01 |
| HDL-C mean (SD), mg/l | 57.8 (14.1) | 59.4 (13.9) | 55.6 (14.0) | < 0.01 |
| CRP, mean (SD), mg/l | 1.1 [0.5, 3.0] | 0.9 [0.4, 2.3] | 1.6 [0.6, 4.6] | < 0.01 |
| Estradiol, median [IQR], pg/mL | 55.1 [33.5, 87.1] | 58.9 [35.2, 88.3] | 52.2 [31.4, 84.2] | < 0.01 |
| FSH, median [IQR], mIU/mL | 16.1 [11.1, 26.1] | 15.2 [11.0, 25.4] | 16.7 [11.2, 26.9] | 0.12 |
| TyG, mean (SD) | 8.3 (0.5) | 8.2 (0.5) | 8.4 (0.5) | |
| TyG-BMI, mean (SD) | 219.2 (54.4) | 204.9 (44.0) | 239.3 (60.9) | < 0.01 |
| TyG-WC, mean (SD) | 680.7 (129.4) | 647.6 (108.4) | 727.4 (141.7) | < 0.01 |
| TyG-WHtR, mean (SD) | 4.2 (0.8) | 4.0 (0.7) | 4.5 (0.9) | < 0.01 |
* The percentage may not sum to 100% because of missing data.
Abbreviations: CMD, cardiometabolic disease; SD, standard deviation; BMI, body mass index; WC, waist circumference; SBP, systolic blood pressure; DBP, diastolic blood pressure; HOMA-IR, the homeostasis model assessment for insulin resistance; LDL-C, low-density lipoprotein; HDL-C, high-density lipoprotein; CRP, C-reactive protein; FSH, Follicle-stimulating hormone; TyG, triglyceride-glucose index, WHtR, waist-to-height ratio.
Association of TyG related indices with CMD incident
The Kaplan–Meier curves indicated that women at the low quartile levels of the TyG and TyG-related indices group showed significantly higher probabilities of CMD incidence compared with those in high quartile groups during the follow-up period (Fig. 1).
Fig. 1.

Kaplan–Meier survival curves for cardiometabolic disease incidence of midlife women with different quartile levels of TyG (A), TyG-BMI (B), TyG-WC (C), and TyG-WHtR (D) indices. Abbreviations: TyG, triglyceride-glucose index, BMI, body mass index, WC, waist circumference. WHtR, waist-to-height ratio.
In the fully adjusted Cox proportional hazard model (multivariable model 2), compared to participants with the lowest quartile TyG, individuals with the highest quartile TyG had significantly increased risk of CMD incidents (HR, 1.78; 95% CI, 1.41–2.25), and each 1 SD increase in TyG was associated with a 31% increased risk of CMD incident (HR, 1.31; 95% CI, 1.20–1.42; Table 2). A similar relationship was also observed in TyG-WHtR (Table 2). In the case of the TyG-BMI, compared with women in the Q1 group, women in Q2, Q3, and Q4 groups had significantly increased risk of CMD incident (HR for Q2, 1.41; 95% CI, 1.10–1.81; HR for Q3, 1.99; 95% CI, 1.55–2.56; HR for Q4, 3.26; 95% CI, 2.51–4.24; Table 2). In addition, a continuous increase in TyG-BMI was also significantly associated with CMD risk (HR for each 1 SD increase, 1.61; 95% CI, 1.52–1.70). A similar relationship was also observed in TyG-WC (Table 2).
Table 2.
Association between triglyceride-glucose related indices and cardiometabolic disease incidence among midlife women.
| Unadjusted model | Multivariable model 1† | Multivariable model 2‡ | ||||
|---|---|---|---|---|---|---|
| HR (95% CI) | p value | HR (95% CI) | p value | HR (95% CI) | p value | |
| TyG | ||||||
| Q1 | 1 (Reference) | / | 1 (Reference) | / | 1 (Reference) | / |
| Q2 | 0.95 (0.77–1.17) | 0.61 | 0.98 (0.79–1.22) | 0.87 | 0.93 (0.74–1.16) | 0.51 |
| Q3 | 1.15 (0.94–1.40) | 0.17 | 1.18 (0.96–1.45) | 0.12 | 1.08 (0.87–1.35) | 0.48 |
| Q4 | 1.96 (1.63–2.36) | < 0.01 | 2.03 (1.66–2.47) | < 0.01 | 1.78 (1.41–2.25) | < 0.01 |
| Per 1 SD increase | 1.33 (1.24–1.41) | < 0.01 | 1.32 (1.23–1.41) | < 0.01 | 1.31 (1.20–1.42) | < 0.01 |
| TyG-BMI | ||||||
| Q1 | 1 (Reference) | / | 1 (Reference) | / | 1 (Reference) | / |
| Q2 | 1.52 (1.20–1.92) | < 0.01 | 1.45 (1.14–1.85) | < 0.01 | 1.41 (1.10–1.81) | 0.01 |
| Q3 | 2.32 (1.86–2.89) | < 0.01 | 2.09 (1.66–2.64) | < 0.01 | 1.99 (1.55–2.56) | < 0.01 |
| Q4 | 3.98 (3.23–4.92) | < 0.01 | 3.53 (2.80–4.44) | < 0.01 | 3.26 (2.51–4.24) | < 0.01 |
| Per 1 SD increase | 1.61 (1.52–1.70) | < 0.01 | 1.55 (1.46–1.65) | < 0.01 | 1.52 (1.41–1.63) | < 0.01 |
| TyG-WC | ||||||
| Q1 | 1 (Reference) | / | 1 (Reference) | / | 1 (Reference) | / |
| Q2 | 1.75 (1.39–2.20) | < 0.01 | 1.62 (1.28–2.06) | < 0.01 | 1.57 (1.23–2.00) | < 0.01 |
| Q3 | 2.24 (1.79–2.81) | < 0.01 | 1.88 (1.49–2.38) | < 0.01 | 1.78 (1.38–2.29) | < 0.01 |
| Q4 | 3.95 (3.19–4.88) | < 0.01 | 3.41 (2.72–4.27) | < 0.01 | 3.13 (2.41–4.06) | < 0.01 |
| Per 1 SD increase | 1.60 (1.51–1.70) | < 0.01 | 1.56 (1.46–1.67) | < 0.01 | 1.54 (1.43–1.67) | < 0.01 |
| TyG-WHtR | ||||||
| Q1 | 1 (Reference) | / | 1 (Reference) | / | 1 (Reference) | / |
| Q2 | 1.42 (1.13–1.80) | < 0.01 | 1.34 (1.05–1.70) | < 0.01 | 1.31 (1.02–1.67) | 0.51 |
| Q3 | 2.20 (1.77–2.74) | < 0.01 | 1.80 (1.43–2.27) | < 0.01 | 1.76 (1.37–2.26) | 0.48 |
| Q4 | 3.92 (3.18–4.82) | < 0.01 | 3.33 (2.68–4.15) | < 0.01 | 3.19 (2.47–4.12) | < 0.01 |
| Per 1 SD increase | 1.63 (1.54–1.73) | < 0.01 | 1.58 (1.49–1.69) | < 0.01 | 1.57 (1.46–1.70) | < 0.01 |
†Adjusted for age, race, income, smoking status, and menopause status.
‡Additionally adjusted for low-density lipoprotein, high-density lipoprotein, C-reactive protein, estradiol, and follicle-stimulating hormone.
Abbreviation: HR, hazard ratio; CI, confidence interval, TyG, triglyceride-glucose index, BMI, body mass index, WC, waist circumference. WHtR, waist-to-height ratio.
The RCS analyses were applied to interpret the dose–response relationships of TyG and its related parameters with CMD risk (Fig. 2). After adjustment for potential confounders, the HRs of CMD increased nonlinearly with increasing TyG and TyG-BMI levels (p for nonlinearity < 0.05), while TyG-WC and TyG-WHtR increasment were linearly associated with increased CMD onset (p for nonlinearity > 0.05, Fig. 2).
Fig. 2.

Dose–response relationships between triglyceride-glucose related indices and cardiometabolic disease incidence among midlife women. HRs (solid lines) and 95% confidence intervals (shaded areas) were calculated as increase in TyG (A), TyG-BMI (B), TyG-WC (C), TyG-WHtR (D) and were adjusted for age, race, income, smoking status, and menopause status low-density lipoprotein, high-density lipoprotein, C-reactive protein, estradiol, and follicle-stimulating hormone. Abbreviations: HR, hazard ratio;. TyG, triglyceride-glucose index, BMI, body mass index, WC, waist circumference. WHtR, waist-to-height ratio.
In the sensitivity analyses, the results largely remained unchanged when we redefined the CMD using the redefined hypertension (≥ 130/80 mm Hg; Table 3). Consistent results were demonstrated after excluding participants who suffered from CMD within the first 2-year follow-up period (Table 3).
Table 3.
Sensitivity analysis.
| Sensitivity analysis 1a | Sensitivity analysis 2b | |||
|---|---|---|---|---|
| HR (95% CI) | p value | HR (95% CI) | p value | |
| TyG | ||||
| Q1 | 1 (Reference) | / | 1 (Reference) | / |
| Q2 | 0.96 (0.76–1.21) | 0.73 | 0.98 (0.76–1.26) | 0.88 |
| Q3 | 1.14 (0.90–1.44) | 0.26 | 1.06 (0.82–1.38) | 0.65 |
| Q4 | 1.79 (1.39–2.3) | < 0.01 | 1.66 (1.25–2.19) | < 0.01 |
| Per 1 SD increase | 1.30 (1.19–1.43) | < 0.01 | 1.26 (1.13–1.39) | < 0.01 |
| TyG-BMI | ||||
| Q1 | 1 (Reference) | / | 1 (Reference) | / |
| Q2 | 1.42 (1.10–1.83) | 0.01 | 1.51 (1.14–2.01) | < 0.01 |
| Q3 | 1.88 (1.44–2.45) | < 0.01 | 1.89 (1.41–2.54) | < 0.01 |
| Q4 | 3.24 (2.46–4.27) | < 0.01 | 3.05 (2.24–4.15) | < 0.01 |
| Per 1 SD increase | 1.55 (1.43–1.68) | < 0.01 | 1.54 (1.40–1.69) | < 0.01 |
| TyG-WC | ||||
| Q1 | 1 (Reference) | / | 1 (Reference) | / |
| Q2 | 1.61 (1.25–2.08) | < 0.01 | 1.58 (1.20–2.09) | < 0.01 |
| Q3 | 1.78 (1.37–2.33) | < 0.01 | 1.58 (1.18–2.13) | < 0.01 |
| Q4 | 3.19 (2.42–4.20) | < 0.01 | 2.99 (2.21–4.05) | < 0.01 |
| Per 1 SD increase | 1.57 (1.44–1.70) | < 0.01 | 1.56 (1.41–1.71) | < 0.01 |
| TyG-WHtR | ||||
| Q1 | 1 (Reference) | / | 1 (Reference) | / |
| Q2 | 1.31 (1.02–1.69) | 0.04 | 1.24 (0.94–1.63) | 0.14 |
| Q3 | 1.75 (1.34–2.27) | < 0.01 | 1.60 (1.19–2.13) | < 0.01 |
| Q4 | 3.19 (2.44–4.17) | < 0.01 | 2.87 (2.13–3.87) | < 0.01 |
| Per 1 SD increase | 1.61 (1.48–1.75) | < 0.01 | 1.60 (1.45–1.76) | < 0.01 |
All models adjusted for age, race, income, smoking status, and menopause status, low-density lipoprotein, high-density lipoprotein, C-reactive protein, estradiol, and follicle-stimulating hormone.
aAnalysis was performed by including individuals with age ≤ 80.
bAnalysis was performed by using a stricter definition of hypertension.
cAnalysis was performed by excluding incident CMD within 2 years of follow-up.
Abbreviation: HR, hazard ratio; CI, confidence interval, TyG, triglyceride-glucose index, BMI, body mass index, WC, waist circumference. WHtR, waist-to-height ratio.
Predictive capacity comparison
The ROC curve for the ability of TyG and its related parameters to predict 10-year risk of CMD is shown in Fig. 3. The TyG performed the lowest AUROC (0.587, 95% CI 0.562–0.6124), compared with TyG-BMI (0.677, 95% CI 0.653–0.701, pairwise DeLong test p < 0.01), TyG-WC (0.673, 95% CI 0.649–0.700, pairwise DeLong test p < 0.01), and TyG-WHtR (0.678, 95% CI 0.654–0.701, pairwise DeLong test p < 0.01). However, no significant difference was observed in the predictive capacity comparison among 3 TyG-related indices (pairwise DeLong test p > 0.05; Fig. 3).
Fig. 3.
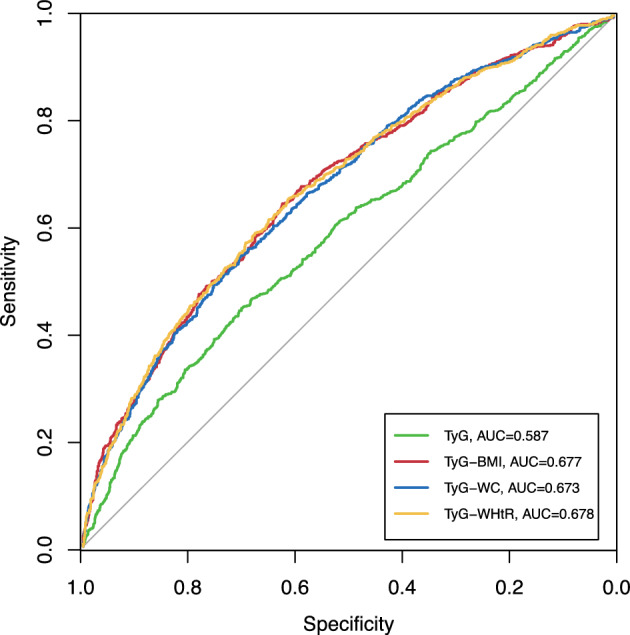
Receiver operating characteristic analysis for triglyceride-glucose related indices in predicting 10-year cardiometabolic disease incidence. Pairwise DeLong’s test: TyG vs. TyG-BMI, p < 0.01; TyG vs. TyG-WC, p < 0.01; TyG vs. TyG-WHtR, p < 0.01; TyG-BMI vs. TyG-WC, p = 0.42; TyG-BMI vs. TyG-BMI, p = 0.88; TyG-WC vs. TyG-WHtR, p = 0.12. Abbreviations: TyG, triglycerides-glucose; AUC, area under curves; BMI, body mass index; WC, waist circumference; WHtR, waist-to-height ratio.
Discussion
In this national longitudinal cohort study based on US midlife women, we comprehensively investigated the associations between the TyG index and several modified TyG indices with new-onset CMD and compared the predictive capacity of different TyG indices with 10-year CMD incidents. Overall, TyG and its related index were independent risk factors for CMD onset among midlife women, and different relationship patterns between TyG-derived indices and CMD incidents. TyG and TyG-BMI were linearly associated with increased CMD risk, while relationships of TyG-WC and TyG-WHtR with CMD were nonlinear. TyG-derived indices have higher predictive capacities for CMD risk compared with TyG and no difference in predictive capacities was observed among TyG-related indices.
Despite decades of efforts to reduce CVD, it remains a leading cause of death among women8. Alarmingly, the U.S. presents a 7% increase in CVD rates among middle-aged women from 2013 to 2017, potentially due to rising cardiometabolic risk factors22. Women face unique challenges in CVD development, including disparities in traditional risk factors, female-specific risks, and female-predominant high-risk conditions23. Previous evidence illustrated that women with diabetes had higher rates of CVD-related mortality, myocardial infarction, heart failure, and stroke compared to male counterparts24. Hypotheses for this disparity have been proposed including obesity, greater systemic inflammation, poorer glycemic control, and a more severe risk profile at the time of diabetes diagnosis in women24. Therefore, early identification and management of potential risk and prognostic factors of CMD is crucial for reducing morbidity and mortality while enhancing overall women’s health and bring cost-saving effects on the management of this particular population25,26..
IR plays a crucial role in atherosclerosis and CVD, as evidenced by mechanistic, epidemiological, and genetic studies27. Current evidence indicates that chronic IR is pivotal in the onset of CMD. Consequently, biomarkers related to IR are observed in the metabolic disorders of affected populations. Given insulin is not widely measured, there are several surrogate markers of IR. TyG, derived from fasting glucose and triglyceride levels, has become a popular substitute for measuring insulin resistance due to its simple calculation and high sensitivity and specificity28,29..
Large-scale, population-based studies have demonstrated that the TyG and TyG-related indices significantly predict the prevalence of CVD across diverse populations and ethnicities30,31. Brito et al. pooled results from the UK Korea, Mexico, Brazil, and Iran and concluded that the TyG index positively correlates with other IR indicators and demonstrated advantages in predicting IR risk and cardiometabolic risk factors in children and adolescents32. Several studies established the correlation of the TyG index with CVD and cardiometabolic risk factors among the elderly population33,34..
There was also evidence indicating sex differences in the correlation of TyG indices with CVD. Dang et al. found that TyG, TyG-WC, TyG-WHtR, and TyG-BMI showed stronger correlations with CVD mortality in men. However, TyG-WC and TyG-WHtR correlated more strongly with CVD mortality in women35. However, a limited number of studies investigated the TyG and TyG-related indices and CMD among women. To our knowledge, this is the first study that determined the independent correlation and prognostic capacity of the TyG-derived indices with CMD among the midlife female population. Our study filled this important research gap and provided further insights into the prognosis and predictive role of the TyG indices on the female population.
Previous studies also provided controversial evidence in the predictive capacity of modified TyG indices including TyG-BMI, TyG-WC, and TyG-WHtR in predicting different diseases. In a cross-sectional survey of an elderly population, Ke et al. found that combining the TyG index with BMI, WC, and WHtR did not enhance the predictive performance in identifying diabetes risk36. Conversely, Zhang et al. reported that TyG-WC was more strongly associated with prediabetes and diabetes prevalence, demonstrating the highest prediction accuracy37. Kuang et al., using a cohort design, found that the TyG index combined with BMI, WC, and WHtR improved diabetes risk prediction38. Li et al. indicated that TyG-WHtR and TyG-BMI outperformed the TyG index alone in predicting new-onset diabetes39. Lee et al. highlighted a sex-specific relationship between modified TyG indices and hypertension incidence40. Another cohort study concluded that that TyG index alone is most strongly associated with the incidence of coronary heart disease, stroke, and the composite outcome. The TyG index also outperformed other modified TyG indices in predicting the future cardiovascular risk41..
In our study, TyG combined with BMI, WC, and WHtR presented stronger association and higher predictive capacity with CMD among women compared with TyG index. Previous studies also demonstrated the relationship between other composite metabolic-related indices and anomalies in CMD, offering insights into the multifaceted relationship between metabolic markers and CMD42,43. BMI is a simple, easily available measurement that accounts for height-adjusted weight. However, recent studies have highlighted the paradox of BMI in reflecting obesity and mortality risk44. Notably, a large-scale epidemiological study found that a significant proportion of the U.S. population (nearly 30% of males and 50% of females) had abdominal obesity despite having a healthy BMI45. In contrast, enlarged WC often predicts increased fat mass accumulation, effectively reflecting the true burden of central obesity46. WHtR is another useful tool for assessing central obesity, adjusted for stature47. The clinical utility of these obesity indicators supports the superior role of modified TyG indices in predicting the onset of CMD. However, further studies were needed to further elucidate the underlying mechanism of the CMD prognosis and predictive capacity of TyG and its related indices.
Strengths and limitations
The present study has several noteworthy strengths. Firstly, it is the first to comprehensively evaluate the associations between TyG-related indices and CMD incidents among midlife women. Our results highlight the promising application of TyG-related indices in the clinical management of CMD. Secondly, the prospective, population-based study design provides robust evidence of the link between the TyG index and CMD. However, several limitations should be acknowledged. First, due to the observational study design, we cannot establish a causal relationship between the TyG index and CMD. Further genetic studies and clinical trials are needed to validate our findings. Second, CMD onset data is self-reported, which might introduce information bias; however, there is high consistency between self-reported diagnoses and medical records for cardiovascular events48. Third, there may be residual or unmeasured confounding factors. Additionally, as our study population consisted of midlife women in the US, further research is needed to confirm our findings in other regions.
Conclusion
In conclusion, our study suggests that high TyG and its related indices are linked to a greater risk of developing CMD among midlife women. The findings indicate that TyG indices could serve as simple and effective markers for early identification of high-risk individuals in this demographic. Additionally, our results support the superiority of modified TyG indices, which incorporate obesity-related parameters, over the TyG index alone for risk stratification and prediction of future CMD. This highlights the potential application of TyG-related indices in managing midlife women during long-term follow-up, aiding clinicians in providing better care. Future longitudinal studies are needed to validate these findings.
Acknowledgements
We thank the SWAN participants and staff for their valuable contributions.
Abbreviations
- CMD
Cardiometabolic disease
- CVD
Cardiovascular disease
- IR
Insulin resistance
- TyG
Triglyceride-glucose
- BMI
Body mass index
- WC
Waist circumference
- WHtR
Waist-to‐height ratio
- SWAN
Study of women’s health across the nation
- TG
Triglyceride
- FBG
Fasting blood glucose
- BP
Blood pressure
- LDL-C
Low-density lipoprotein cholesterol
- HDL-C
High-density lipoprotein cholesterol
- CRP
C-reactive protein
- FSH
Follicle-stimulating hormone
- ISH
Isolated systolic hypertension
- HOMA-IR
Homeostasis model assessment for insulin resistance
- SD
Standard deviation
- IQR
Interquartile range
- HR
Hazard ratio
- CI
Confidence intervals
- RCS
Restricted cubic spline
- ROC
Receiver operating characteristic
- AUC
Area under the curve
Author contributions
Concept and design: Duo Yang, Xiang Li, Chao Qu, Jiayi Yi, Hai Gao. Acquisition, analysis, or interpretation of data: Duo Yang, Xiang Li, Chao Qu, Jiayi Yi, Hai Gao. Writing—original draft: Duo Yang. Writing—review & editing: Duo Yang, Xiang Li, Chao Qu, Jiayi Yi, Hai Gao. Formal analysis: Jiayi Yi. Funding acquisition: Hai Gao. Supervision: Hai Gao.
Funding
This work was supported by the Capital’s Funds for Health Improvement and Research (CFH 2022–1-2062).
Data availability
SWAN data are publicly available at https://www.swanstudy.org. Secondary data and codes for generating results of this study were available from the corresponding author upon reasonable request.
Declarations
Competing interests
The authors have no relevant financial or non-financial interests to disclose.
Ethics approval
This study was reviewed by the Anzhen Hospital institutional review board and considered exempt. The SWAN study was conducted following the Declaration of Helsinki. Informed consent was taken from all individuals who were willing to participate in the study.
Footnotes
Publisher’s note
Springer Nature remains neutral with regard to jurisdictional claims in published maps and institutional affiliations.
References
- 1.Attaye, I., Pinto-Sietsma, S. J., Herrema, H. & Nieuwdorp, M. A crucial role for diet in the relationship between gut microbiota and cardiometabolic disease. Annu. Rev. Med.71, 149–161. 10.1146/annurev-med-062218-023720 (2020). [DOI] [PubMed] [Google Scholar]
- 2.Global incidence, prevalence, years lived with disability (YLDs), disability-adjusted life-years (DALYs), and healthy life expectancy (HALE) for 371 diseases and injuries in 204 countries and territories and 811 subnational locations, 1990–2021: a systematic analysis for the Global Burden of Disease Study 2021. Lancet (London, England)403, 2133–2161, 10.1016/s0140-6736(24)00757-8 (2024). [DOI] [PMC free article] [PubMed]
- 3.Global burden of 288 causes of death and life expectancy decomposition in 204 countries and territories and 811 subnational locations, 1990–2021: a systematic analysis for the Global Burden of Disease Study 2021. Lancet (London, England)403, 2100–2132, 10.1016/s0140-6736(24)00367-2 (2024). [DOI] [PMC free article] [PubMed]
- 4.Tahir, U. A. & Gerszten, R. E. Molecular biomarkers for cardiometabolic disease: Risk assessment in young individuals. Circ. Res.132, 1663–1673. 10.1161/circresaha.123.322000 (2023). [DOI] [PMC free article] [PubMed] [Google Scholar]
- 5.Mottillo, S. et al. The metabolic syndrome and cardiovascular risk a systematic review and meta-analysis. J. Am. Coll. Cardiol.56, 1113–1132. 10.1016/j.jacc.2010.05.034 (2010). [DOI] [PubMed] [Google Scholar]
- 6.Cornier, M. A. et al. The metabolic syndrome. Endocr. Rev29, 777–822. 10.1210/er.2008-0024 (2008). [DOI] [PMC free article] [PubMed] [Google Scholar]
- 7.Gerdts, E. & Regitz-Zagrosek, V. Sex differences in cardiometabolic disorders. Nat. Med.25, 1657–1666. 10.1038/s41591-019-0643-8 (2019). [DOI] [PubMed] [Google Scholar]
- 8.Rajendran, A. et al. Sex-specific differences in cardiovascular risk factors and implications for cardiovascular disease prevention in women. Atherosclerosis384, 117269. 10.1016/j.atherosclerosis.2023.117269 (2023). [DOI] [PMC free article] [PubMed] [Google Scholar]
- 9.Luo, E. et al. High triglyceride-glucose index is associated with poor prognosis in patients with acute ST-elevation myocardial infarction after percutaneous coronary intervention. Cardiovasc. Diabetol.18, 150. 10.1186/s12933-019-0957-3 (2019). [DOI] [PMC free article] [PubMed] [Google Scholar]
- 10.Tahapary, D. L. et al. Challenges in the diagnosis of insulin resistance: Focusing on the role of HOMA-IR and tryglyceride/glucose index. Diabetes Metab. Syndr.16, 102581. 10.1016/j.dsx.2022.102581 (2022). [DOI] [PubMed] [Google Scholar]
- 11.Wei, X., Min, Y., Song, G., Ye, X. & Liu, L. Association between triglyceride-glucose related indices with the all-cause and cause-specific mortality among the population with metabolic syndrome. Cardiovasc. Diabetol.23, 134. 10.1186/s12933-024-02215-0 (2024). [DOI] [PMC free article] [PubMed] [Google Scholar]
- 12.Jeong, H. G. & Park, H. Metabolic disorders in menopause. Metabolites10.3390/metabo12100954 (2022). [DOI] [PMC free article] [PubMed] [Google Scholar]
- 13.Sowers, M. et al. SWAN: A Multicenter, multiethnic, community-based cohort study of women and the menopausal transition. Sybil L. Crawford (2000).
- 14.von Elm, E. et al. The strengthening the reporting of observational studies in epidemiology (STROBE) statement: Guidelines for reporting observational studies. The Lancet370, 1453–1457. 10.1016/S0140-6736(07)61602-X (2007). [DOI] [PubMed] [Google Scholar]
- 15.El Khoudary, S. R. et al. The menopause transition and women’s health at midlife: a progress report from the Study of Women’s Health Across the Nation (SWAN). Menopause26, 1213–1227. 10.1097/gme.0000000000001424 (2019). [DOI] [PMC free article] [PubMed] [Google Scholar]
- 16.Yan, F. et al. Association between triglyceride glucose index and risk of cerebrovascular disease: systematic review and meta-analysis. Cardiovasc. Diabetol.21, 226. 10.1186/s12933-022-01664-9 (2022). [DOI] [PMC free article] [PubMed] [Google Scholar]
- 17.Ding, Z., Ge, M., Tan, Y., Chen, C. & Hei, Z. The triglyceride-glucose index: a novel predictor of stroke and all-cause mortality in liver transplantation recipients. Cardiovasc. Diabetol.23, 27. 10.1186/s12933-023-02113-x (2024). [DOI] [PMC free article] [PubMed] [Google Scholar]
- 18.Thurston, R. C. et al. Trajectories of sleep over midlife and incident cardiovascular disease events in the study of women’s health across the nation. Circulation149, 545–555. 10.1161/circulationaha.123.066491 (2024). [DOI] [PMC free article] [PubMed] [Google Scholar]
- 19.Reeves, A. et al. Study selection bias and racial or ethnic disparities in estimated age at onset of cardiometabolic disease among midlife women in the uS. JAMA Netw. Open5, e2240665. 10.1001/jamanetworkopen.2022.40665 (2022). [DOI] [PMC free article] [PubMed] [Google Scholar]
- 20.Whelton, P. K. et al. 2017 ACC/AHA/AAPA/ABC/ACPM/AGS/APhA/ASH/ASPC/NMA/PCNA Guideline for the prevention, detection, evaluation, and management of high blood pressure in adults: Executive summary: A report of the american college of cardiology/american heart association task force on clinical practice guidelines. Hypertension71, 1269–1324. 10.1161/hyp.0000000000000066 (2018). [DOI] [PubMed] [Google Scholar]
- 21.Yi, J., Wang, L., Guo, X. & Ren, X. Association of Life’s essential 8 with all-cause and cardiovascular mortality among US adults: A prospective cohort study from the NHANES 2005–2014. Nutr. Metab. Cardiovasc. Dis10.1016/j.numecd.2023.01.021 (2023). [DOI] [PubMed] [Google Scholar]
- 22.Tsao, C. W. et al. Heart disease and stroke statistics-2023 update: A report from the american heart association. Circulation147, e93–e621. 10.1161/cir.0000000000001123 (2023). [DOI] [PMC free article] [PubMed] [Google Scholar]
- 23.O’Kelly, A. C. et al. Pregnancy and reproductive risk factors for cardiovascular disease in women. Circ. Res.130, 652–672. 10.1161/circresaha.121.319895 (2022). [DOI] [PMC free article] [PubMed] [Google Scholar]
- 24.Broni, E. K. et al. The diabetes-cardiovascular connection in women: Understanding the known risks, outcomes, and implications for care. Curr. Diab. Rep.22, 11–25. 10.1007/s11892-021-01444-x (2022). [DOI] [PubMed] [Google Scholar]
- 25.Holtzman, J. N., Kaur, G., Hansen, B., Bushana, N. & Gulati, M. Sex differences in the management of atherosclerotic cardiovascular disease. Atherosclerosis384, 117268. 10.1016/j.atherosclerosis.2023.117268 (2023). [DOI] [PubMed] [Google Scholar]
- 26.Antza, C. et al. Prevention of cardiovascular disease in young adults: Focus on gender differences. A collaborative review from the EAS young fellows. Atherosclerosis384, 117272. 10.1016/j.atherosclerosis.2023.117272 (2023). [DOI] [PubMed] [Google Scholar]
- 27.Wang, T. et al. Association between insulin resistance and cardiovascular disease risk varies according to glucose tolerance status: A nationwide prospective cohort study. Diabetes Care45, 1863–1872. 10.2337/dc22-0202 (2022). [DOI] [PMC free article] [PubMed] [Google Scholar]
- 28.Khan, S. H. et al. Metabolic clustering of risk factors: evaluation of Triglyceride-glucose index (TyG index) for evaluation of insulin resistance. Diabetol. Metab. Syndr.10, 74. 10.1186/s13098-018-0376-8 (2018). [DOI] [PMC free article] [PubMed] [Google Scholar]
- 29.Guerrero-Romero, F. et al. The product of triglycerides and glucose, a simple measure of insulin sensitivity. comparison with the euglycemic-hyperinsulinemic clamp. J. Clin. Endocrinol. Metab.95, 3347–3351. 10.1210/jc.2010-0288 (2010). [DOI] [PubMed] [Google Scholar]
- 30.Son, D. H., Lee, H. S., Lee, Y. J., Lee, J. H. & Han, J. H. Comparison of triglyceride-glucose index and HOMA-IR for predicting prevalence and incidence of metabolic syndrome. Nutr. Metab. Cardiovasc. Dis.32, 596–604. 10.1016/j.numecd.2021.11.017 (2022). [DOI] [PubMed] [Google Scholar]
- 31.Li, Y. et al. Predicting metabolic syndrome by obesity- and lipid-related indices in mid-aged and elderly Chinese: A population-based cross-sectional study. Front. Endocrinol. (Lausanne)14, 1201132. 10.3389/fendo.2023.1201132 (2023). [DOI] [PMC free article] [PubMed] [Google Scholar]
- 32.Brito, A. D. M. et al. Predictive capacity of triglyceride-glucose (TyG) index for insulin resistance and cardiometabolic risk in children and adolescents: A systematic review. Crit. Rev. Food Sci. Nutr.61, 2783–2792. 10.1080/10408398.2020.1788501 (2021). [DOI] [PubMed] [Google Scholar]
- 33.Huo, R. R., Zhai, L., Liao, Q. & You, X. M. Changes in the triglyceride glucose-body mass index estimate the risk of stroke in middle-aged and older Chinese adults: A nationwide prospective cohort study. Cardiovasc. Diabetol.22, 254. 10.1186/s12933-023-01983-5 (2023). [DOI] [PMC free article] [PubMed] [Google Scholar]
- 34.Niu, Z. J. et al. The effect of insulin resistance in the association between obesity and hypertension incidence among Chinese middle-aged and older adults: data from China health and retirement longitudinal study (CHARLS). Front. Public Health12, 1320918. 10.3389/fpubh.2024.1320918 (2024). [DOI] [PMC free article] [PubMed] [Google Scholar]
- 35.Dang, K. et al. The association between triglyceride-glucose index and its combination with obesity indicators and cardiovascular disease: NHANES 2003–2018. Cardiovasc. Diabetol.23, 8. 10.1186/s12933-023-02115-9 (2024). [DOI] [PMC free article] [PubMed] [Google Scholar]
- 36.Ke, P. et al. Comparison of obesity indices and triglyceride glucose-related parameters to predict type 2 diabetes mellitus among normal-weight elderly in China. Eat Weight Disord.27, 1181–1191. 10.1007/s40519-021-01238-w (2022). [DOI] [PubMed] [Google Scholar]
- 37.Zheng, S. et al. Triglyceride glucose-waist circumference, a novel and effective predictor of diabetes in first-degree relatives of type 2 diabetes patients: cross-sectional and prospective cohort study. J. Transl. Med.14, 260. 10.1186/s12967-016-1020-8 (2016). [DOI] [PMC free article] [PubMed] [Google Scholar]
- 38.Kuang, M. et al. Assessing temporal differences in the predictive power of baseline TyG-related parameters for future diabetes: An analysis using time-dependent receiver operating characteristics. J Transl Med21, 299. 10.1186/s12967-023-04159-7 (2023). [DOI] [PMC free article] [PubMed] [Google Scholar]
- 39.Li, X. et al. Predictive effect of triglyceride glucose-related parameters, obesity indices, and lipid ratios for diabetes in a Chinese population: A prospective cohort study. Front. Endocrinol. (Lausanne)13, 862919. 10.3389/fendo.2022.862919 (2022). [DOI] [PMC free article] [PubMed] [Google Scholar]
- 40.Lee, J. H., Heo, S. J. & Kwon, Y. J. Sex-specific comparison between triglyceride glucose index and modified triglyceride glucose indices to predict new-onset hypertension in middle-aged and older adults. J. Am. Heart Assoc.12, e030022. 10.1161/jaha.123.030022 (2023). [DOI] [PMC free article] [PubMed] [Google Scholar]
- 41.Cui, C. et al. Comparison of triglyceride glucose index and modified triglyceride glucose indices in prediction of cardiovascular diseases in middle aged and older Chinese adults. Cardiovasc. Diabetol.23, 185. 10.1186/s12933-024-02278-z (2024). [DOI] [PMC free article] [PubMed] [Google Scholar]
- 42.Ren, Y. et al. Dose-response association of Chinese visceral adiposity index with comorbidity of hypertension and diabetes mellitus among elderly people. Front Endocrinol (Lausanne)14, 1187381. 10.3389/fendo.2023.1187381 (2023). [DOI] [PMC free article] [PubMed] [Google Scholar]
- 43.Ren, Y. et al. Association between ideal cardiovascular health and abnormal glucose metabolism in the elderly: Evidence based on real-world data. BMC Geriatr.24, 414. 10.1186/s12877-023-04632-4 (2024). [DOI] [PMC free article] [PubMed] [Google Scholar]
- 44.Strulov Shachar, S. & Williams, G. R. The obesity paradox in cancer-moving beyond BMI. Cancer Epidemiol. Biomarkers Prev.26, 13–16. 10.1158/1055-9965.Epi-16-0439 (2017). [DOI] [PMC free article] [PubMed] [Google Scholar]
- 45.Dybala, M. P., Brady, M. J. & Hara, M. Disparity in adiposity among adults with normal body mass index and waist-to-height ratio. Iscience21, 612–623. 10.1016/j.isci.2019.10.062 (2019). [DOI] [PMC free article] [PubMed] [Google Scholar]
- 46.Kahn, B. B. & Flier, J. S. Obesity and insulin resistance. J. Clin. Invest.106, 473–481. 10.1172/jci10842 (2000). [DOI] [PMC free article] [PubMed] [Google Scholar]
- 47.Ashwell, M. & Hsieh, S. D. Six reasons why the waist-to-height ratio is a rapid and effective global indicator for health risks of obesity and how its use could simplify the international public health message on obesity. Int. J. Food Sci. Nutr.56, 303–307. 10.1080/09637480500195066 (2005). [DOI] [PubMed] [Google Scholar]
- 48.Valtorta, N. K., Kanaan, M., Gilbody, S. & Hanratty, B. Loneliness, social isolation and risk of cardiovascular disease in the english longitudinal study of ageing. Eur. J. Prev. Cardiol.25, 1387–1396. 10.1177/2047487318792696 (2018). [DOI] [PubMed] [Google Scholar]
Associated Data
This section collects any data citations, data availability statements, or supplementary materials included in this article.
Data Availability Statement
SWAN data are publicly available at https://www.swanstudy.org. Secondary data and codes for generating results of this study were available from the corresponding author upon reasonable request.