Abstract
Eukaryotic transcriptional activators have been proposed to function, for the most part, by promoting the assembly of preinitiation complex through the recruitment of the RNA polymerase II transcriptional machinery to the promoter. Previous studies have shown that transcriptional activation is critically dependent on transcription factor IIH (TFIIH), which functions during promoter opening and promoter escape, the steps following preinitiation complex assembly. Here we have analyzed the role of TFIIH in transcriptional activation and show that the excision repair cross-complementing (ERCC) 3 helicase activity of TFIIH plays a regulatory role to stimulate promoter escape in activated transcription. The stimulatory effect of the ERCC3 helicase is observed until ≈10-nt RNA is synthesized, and the helicase seems to act throughout the entire course of promoter escape. Analyses of the early phase of transcription show that a majority of the initiated complexes abort transcription and fail to escape the promoter; however, the proportion of productive complexes that escape the promoter apparently increases in response to activation. Our results establish that promoter escape is an important regulatory step stimulated by the ERCC3 helicase activity in response to activation and reveal a possible mechanism of transcriptional synergy.
Transcription by RNA polymerase II (RNAPII) is a multistep process that includes preinitiation complex (PIC) assembly, promoter opening, promoter escape, and elongation (1–4). Numerous in vivo and in vitro studies have revealed that the promotion of PIC assembly is a major step of regulation by transcriptional activators (5, 6); however, several studies have indicated that activators also may function after PIC assembly (7–12). The steps after PIC assembly can be divided into promoter opening, promoter escape, and elongation steps. After PIC assembly, promoter opening ensues as the region from −9 to +2 becomes melted, followed by the formation of the first phosphodiester bond (13, 14). As RNAPII elongates the initiated transcript, the melted region extends gradually from the −9/+2 region to the −9/+9 region, which abruptly shifts to the +3/+11 region when promoter escape is complete (13, 14). Promoter escape is a rate-limiting step in basal transcription in vitro (4, 15), and RNAPII may abort and reinitiate transcription during promoter escape to release short transcripts (14, 16, 17).
In basal transcription, promoter opening and promoter escape require general transcription factor IIH (TFIIH) and βγ hydrolysis of (d)ATP on linear templates (18). TFIIH consists of nine subunits including excision repair cross-complementing (ERCC) 3 (XPB), ERCC2 (XPD), and MO15, which have 3′-5′ helicase, 5′-3′ helicase, and C-terminal domain kinase activities, respectively (19, 20). Both promoter opening and promoter escape require the ERCC3 helicase activity and (d)ATP hydrolysis (21, 22), which can be circumvented by the negative supercoiling of the template DNA (18). In addition to the role in basal transcription, TFIIH is critically important for activated transcription. Indeed, TFIIH is essential for efficient transcriptional activation in vitro by various activators (23–25) and seems to suppress promoter proximal pausing in activated transcription (25). Moreover, negative regulator of activated transcription (NAT) and FBP interacting repressor (FIR) specifically repress activated transcription through TFIIH (26–28). Finally, activated transcription is affected dramatically in the presence of nonhydrolyzable ATP analogues (29). Thus, various transcriptional regulators may control transcription by regulating the enzymatic activities of TFIIH that require the hydrolysis of ATP.
Here we show that the ERCC3 helicase activity of TFIIH increases the efficiency of promoter escape in activated transcription. The helicase activity acts throughout the entire course of promoter escape and apparently increases the fraction of productive transcriptional complex in response to activation. The presence of at least two steps (PIC assembly and promoter escape) that are stimulated by activation suggests a possible mechanism for transcriptional synergy.
Materials and Methods
Purification of TFIIH Mutants.
Oligonucleotide-mediated mutagenesis was used to introduce a lysine-to-alanine mutation in ERCC3, RECC2, and MO15 cDNAs. Each mutated cDNA was subcloned into the baculovirus expression vector, pAcAB3 (PharMingen), with other TFIIH subunits as described (29). Production of recombinant baculoviruses as well as the purification of recombinant TFIIH mutants were done essentially as described (29).
DNA Templates.
For preparing 560-bp premelted templates, the region including the GAL4-binding sites, core promoter, and G-less cassette of pG5HMC2AT was amplified by PCR. The amplified DNA fragment was subcloned into the SmaI site of either M13mp18RF or M13mp19RF, which produced the nontemplate or template strand, respectively, when isolated as single-stranded DNA (ssDNA). The M13mp18 ssDNA was used to create mutated nontemplate strands by oligonucleotide-mediated mutagenesis. The ssDNAs from M13mp18 or -19 derivatives were cut with SmaI after annealing with a set of 30-mer oligonucleotides complementary to each ssDNA encompassing SmaI sites. Pairs of the SmaI-cut 560-nt ssDNA fragments corresponding to the template and nontemplate strands were annealed and then purified by 5% PAGE. The isolated double-stranded DNA templates were sequenced directly on both strands to confirm the mismatch.
PCR-based methods were used to create a series of pG5HMC2AT+nG or pG5HMC2AT+nA, which has the first G or A residue, respectively, at the nth position. EagI and HindIII sites were first created immediately upstream of the initiation site and at the 3′ end of the G-less cassette, respectively. Then, EagI-HindIII fragments containing appropriate mutations were prepared and used to replace the EagI-HindIII region of pG5HMC2AT. All the adenine residues between the +1 and +n positions, when present, were changed into thymidine residues. All templates were sequenced entirely to confirm correct mutagenesis and showed indistinguishable transcriptional activities from the original pG5HMC2AT except the template 6A, which reproducibly showed 20% less activity. However, the template 6A showed the same level of activation.
In Vitro Transcription Assays.
Transcription assays were carried out essentially as described (29) with the SmaI-linearized templates except for that shown in Fig. 1D, in which negatively supercoiled templates were used. In all reactions, the template and factors were preincubated at 30°C for 50 min before the addition of nucleotides, and the reaction was incubated further for 15 min, or as diagramed in the figures. The levels of transcription were quantified by using Fujix Bas 2000. For transcription using the premelted templates, 10 ng of premelted template was supplemented with 160 ng of linearized pUC19 to adjust the total amount of DNA, and wild-type PC4 was replaced with a mutant form of PC4, W89A, which has alanine in place of tryptophan at the 89th residue. The mutant PC4 has a reduced binding to ssDNA but can support activation as efficiently as wild-type PC4 (30).
Figure 1.
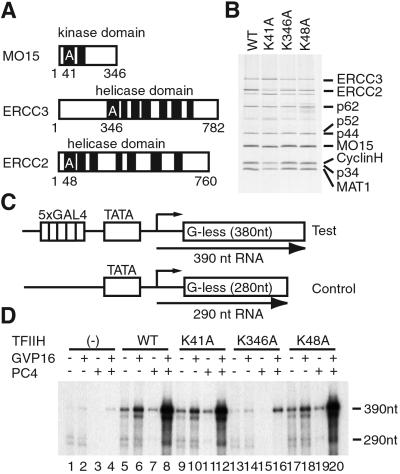
TFIIH mutants and their transcriptional activities. (A) Mutations of ATP-binding sites in the MO15, ERCC3, and ERCC2 subunits of TFIIH. The lysine residues mutated to alanine are indicated. (B) Silver-stained gel of purified TFIIH mutants. The positions of TFIIH subunits are indicated on the right. WT, wild type. (C) Test (pG5HMC2AT) and control (pMLΔ53C2AT) templates used for in vitro transcription. (D) Activated transcription assays in the presence of TFIIH mutants. The positions of the transcripts from the test (390-nt) and control (290-nt) templates are indicated on the right.
Analysis of Transcripts Terminated by 3′-O-methylguanosine 5′-Triphosphate (3′-O-methyl GTP).
For the analyses of the short transcripts from pG5HMC2AT+nG templates, transcription reactions were done essentially as described except that the reactions contained 1 μM CTP to obtain clearly visible transcripts. The reactions were stopped by heat treatment at 68°C for 3 min and then treated with 5 units of calf intestinal alkaline phosphatase at 37°C for 1 h. The RNA products were separated on a denaturing 23% polyacrylamide gel in 1× TBE (89 mM Tris-borate, 20 mM EDTA), pH 8.8, in which short transcripts were resolved better than 1× TBE, pH 8.3. pH 8.3.
Kinetic Analyses of Promoter Escape.
Transcription reactions were set up in a 250-μl reaction, and 25-μl aliquots were withdrawn at the indicated time points. The reaction included 400 μCi (1 Ci = 37 GBq) of [α-32P]CTP for each reaction (four times the amount of radioactivity than standard in vitro transcription reactions) to measure the level of transcription accurately. The levels of transcripts at each time point were quantified and analyzed by nonlinear regression using GraphPad PRISM software (San Diego) to obtain the rate constants.
Results
Requirement of the ERCC3 Helicase Activity for Activated Transcription.
To test the roles of three enzymatic activities of TFIIH in activated transcription, we created three recombinant TFIIH mutants, hereafter termed K41A, K346A, and K48A, each of which has a lysine-to-alanine substitution at the 41st, 346th, or 48th residues within the ATP-binding sites of MO15, ERCC3, or ERCC2, respectively (Fig. 1 A and B; ref. 29). Each TFIIH mutant then was analyzed in in vitro transcription assays containing GAL4-VP16 and a coactivator, PC4. The reactions included pG5HMC2AT, which contained five GAL4-binding sites upstream of the core promoter and pMLΔ53C2AT as an internal control (Fig. 1C; refs. 23 and 29), both in a negatively supercoiled form that obviates the requirement of TFIIH in basal transcription. In the absence of TFIIH, only little activation was observed (Fig. 1D, lanes 1 and 4); however, in the presence of wild-type TFIIH, K41A, and K48A, ≈15-fold activation was observed (Fig. 1D, lanes 5 and 8, lanes 9 and 12, and lanes 17 and 20). By contrast, K346A mediated a markedly reduced activation (4-fold; Fig. 1D, lanes 13 and 16). The low level of activation observed with K346A is unlikely to be caused by the reduced recruitment of TFIIH to the promoter, because K346A interacted with VP16 as efficiently as wild-type TFIIH (data not shown; ref. 31). In addition, the ERCC3 helicase activity stimulates transcription not by counteracting the repressive activity of PC4 but by acting in conjunction with the coactivator activity of PC4, because the effect of the ERCC3 helicase activity in activated transcription is observed even with a mutated PC4, W89A, which has much reduced repressive activity (data not shown; ref. 30). Together these results indicate that the ERCC3 helicase activity, but neither the MO15 kinase nor the ERCC2 helicase activity, plays an important role for activated transcription.
Effect of the ERCC3 Helicase Activity on Premelted Templates in Activated Transcription.
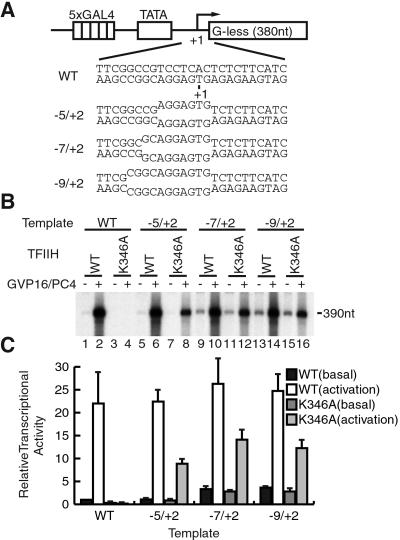
Because the ERCC3 helicase is required for promoter opening and promoter escape in basal transcription (21, 22), we next determined which of the two steps (i.e., promoter opening and promoter escape) is enhanced by the ERCC3 helicase during activated transcription. To this end, we created the templates in which bases −5 to +2, −7 to +2, or −9 to +2 were mismatched (Fig. 2A). The mismatch between −5 and +2 is a minimal region that obviates the requirement of TFIIH for basal transcription on a linear template (13), and the mismatch between −9 and +2 corresponds to the promoter region melted immediately before initiation (14). As shown in Fig. 2B and quantified in Fig. 2C, transcription occurred in the absence of the ERCC3 helicase activity and was stimulated by GAL4-VP16 and PC4 on the templates −5/+2, −7/+2, and −9/+2 (Fig. 2 B and C, lanes 7 and 8, lanes 11 and 12, and lanes 15 and 16) but not on the wild-type template (Fig. 2 B and C, lanes 3 and 4). Importantly, basal transcription showed only a minor reduction (Fig. 2 B and C, lanes 5, 7, 9, 11, 13, and 15), whereas activated transcription showed a 50–60% reduction on the premelted templates in the absence of the ERCC3 helicase activity (Fig. 2B, lanes 6, 8, 10, 12, 14, and 16). Thus, in addition to the essential role on linear templates (18), the ERCC3 helicase activity is important for stimulating transcription and is implicated in enhancing the steps other than promoter opening in activated transcription, most likely the promoter escape step.
Figure 2.
Activated transcription from the premelted templates. (A) Premelted templates used for transcription. The DNA sequences of the premelted regions and the position of the initiation site (+1) are indicated. (B) Basal (−) or activated (+) transcription from the premelted templates in the presence of wild-type TFIIH (WT) or TFIIH with a mutated ERCC3 (K346A), respectively. (C) Quantification of the relative levels of transcription. The data from three independent experiments are represented as means ± SD. The unit for transcriptional levels is arbitrary.
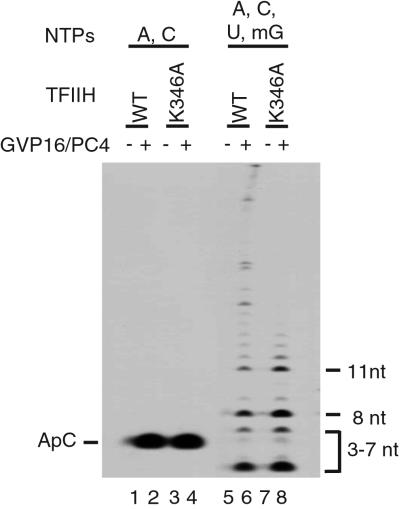
To ensure that promoter escape is enhanced by the ERCC3 helicase activity in activated transcription, we examined the effect of K346A on the short transcripts produced during promoter escape. When transcription initiation was allowed on the template −9/+2 with only ATP and CTP, the ERCC3 helicase activity did not affect the activation of initiation (ApC formation; Fig. 3, lanes 1–4), which is likely to reflect the recruitment of PIC by GAL4-VP16. When four nucleotides were included to elongate ApC, short transcripts from 2 to 11 nt appeared in addition to the full-length transcript (Fig. 3, lanes 5–8). Notably, in activated transcription, the short transcripts accumulated more in the absence (Fig. 3, lane 8) than in the presence of the ERCC3 helicase activity (Fig. 3, lane 6), indicating that in response to activation the helicase stimulates the extension of these short transcripts into longer ones, the step that corresponds to promoter escape. This reduced efficiency of promoter escape in the absence of the ERCC3 helicase activity accounts for the reduction of the full-length transcript in activated transcription (Fig. 2B, lanes 14 and 16). Together these results show that the ERCC3 helicase activity is required for efficient extension of the short transcripts produced during promoter escape in response to activation.
Figure 3.
Effect of ERCC3 on promoter escape from premelted templates. Transcription reactions were performed by using the template −9/+2 in the presence of ATP and CTP (lanes 1–4), or ATP, CTP, UTP, and 3′-O-methyl GTP (lanes 5–8). The position of the initiation product (ApC) is indicated on the left, and the short transcripts are indicated on the right. WT, wild type.
Promoter Escape on Nonpremelted Templates in Activated Transcription.
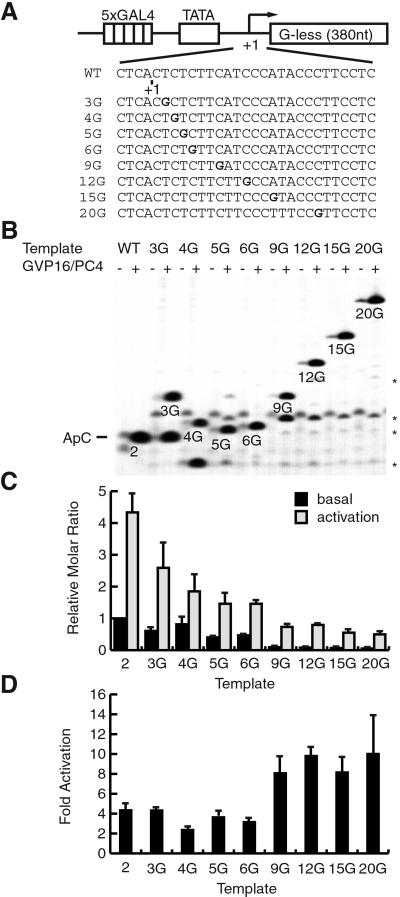
Although the results discussed above strongly suggest that promoter escape is stimulated in activated transcription, the stimulation can possibly be caused by the intrinsic inefficiency of promoter escape on the premelted templates, the ssDNA region of which may impede promoter escape artificially by holding back RNAPII (32). To rule out this possibility, we used nonpremelted templates and systematically analyzed the effect of activation on the early phase of transcription. Each template contained a guanine (G) residue at a defined position within the G-less cassette (Fig. 4A), on which transcription terminates at the G residue by incorporating 3′-O-methyl GTP (14). After PIC was assembled, transcription was allowed by adding ATP and CTP, or ATP, CTP, UTP, and 3′-O-methyl GTP (Fig. 4B). Short transcripts were separated on a 23% denaturing polyacrylamide gel, and after the levels of transcription were quantified, the fold activation was determined for each pair of the short transcripts.
Figure 4.
Effect of GAL4-VP16 on promoter escape from nonpremelted templates. (A) DNA sequences of pG5HMC2AT+nG templates. The G residue in bold indicates the position at which transcription terminates by 3′-O-methyl GTP. WT, wild type. (B) Short transcripts in the early phase of basal and activated transcription. The positions of transcripts terminated at the G residue are indicated. Asterisks indicate the transcripts from 3 to 11 nt in length that correspond to the same transcripts indicated in Fig. 3. (C) Quantification of the short transcripts. The values are means ± SD of the relative molar amount of each transcript from three independent experiments. (D) Fold activation for each pair of basal and activated transcription. The values are means ± SD from three independent experiments.
As shown in Fig. 4C, the short transcripts less than 9 nt in length (lanes 2–6G) were produced in far excess of those equal to or longer than 9 nt (lanes 9G-20G), consistent with the fact that RNAPII can abort and reinitiate before the +9 position (14). More importantly, when fold activation was quantified for each transcript, 2-, 3-, 4-, 5-, and 6-nt transcripts were stimulated by 2–4-fold, whereas 9-, 12-, 15-, and 20-nt transcripts were stimulated by ≈10-fold in activated transcription (Fig. 4D), indicating that promoter escape is stimulated in response to activation. The values of fold stimulation for transcripts equal to or longer than 9 nt were only slightly less than those of 390-nt transcripts (Fig. 1D, lanes 5 and 8), indicating a very small effect, if any, of GAL4-VP16 on the elongation step in our assays. These results confirm the conclusion from the premelted templates that transcriptional activation involves the facilitation of promoter escape.
Careful inspection of the autoradiogram reveals that in addition to the G-terminated transcript, short transcripts that range from 2 to 8 nt are present also (Fig. 4B). Quantification of these transcripts in the transcription reactions using the template 20G, for example, has revealed that the molar ratio of the short transcripts to the 20G transcript is ≈20:1 in basal transcription and ≈5:1 in activated transcription. The results indicate that even when all nucleotides are present to allow the formation of the 20G transcript, a majority of the initiated complexes abort transcription prematurely, producing the short transcripts in far more excess than the 20G transcript. However, the proportion of the active complexes that escape the promoter and produce the 20G transcript clearly increases in response to activation.
Requirement of the ERCC3 Helicase Activity Throughout the Entire Promoter Escape for Activation.
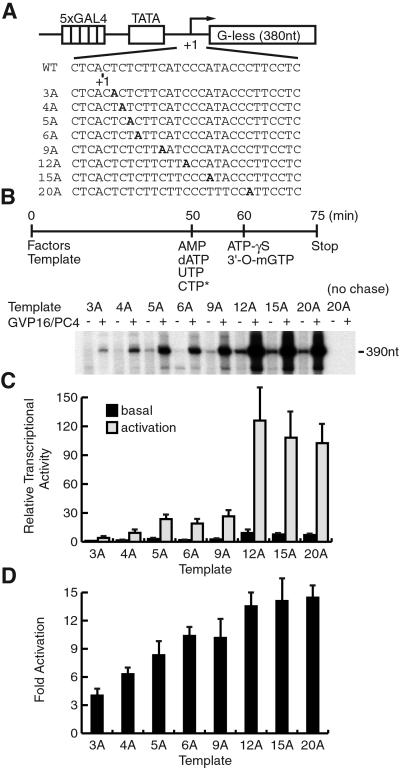
Recent studies show that once the initiation occurs, ATP hydrolysis (and hence the ERCC3 helicase) is required only during escape commitment that corresponds from the initiation to 3-nt RNA synthesis (4, 14). We therefore tested whether the ERCC3 helicase activity was required for activation only during escape commitment or rather throughout the entire promoter escape. To this end, we devised an experiment in which adenosine 5′-O-(3-thiotriphosphate) (ATP-γS) was added to inhibit the ERCC3 helicase activity at defined points during promoter escape. We used similar templates as that for Fig. 4 except that each G residue was replaced with an adenine (A) residue so that transcription could be stalled before the A residue in the absence of ATP (Fig. 5A). These templates showed essentially the same levels of transcription in standard transcription reactions using ATP, although the template 6A showed 20% less transcription levels with essentially the same level of fold activation (data not shown), indicating that the effect of the altered A residues on transcription is minimal. After PIC was assembled on each template, transcription was stalled at a defined position during the incubation in the presence of AMP, dATP, UTP, and CTP (Fig. 5B). At this stage, AMP served as the initiating nucleotide of transcription, and dATP provided βγ hydrolysis for the ERCC3 helicase; however, neither nucleotides could be incorporated into elongating RNA. Little read-through transcription occurred during the stall, as evidenced by the absence of the 390-nt transcript (Fig. 5B, no chase). Then, ATP-γS and 3′-O-methyl GTP were added to elongate RNA into the 390-nt full-length transcript (Fig. 5B). Because ATP-γS was added in a 20-fold molar excess over dATP, transcription resumed in the absence of βγ hydrolysis of dATP.
Figure 5.
Hydrolyzable βγ bond of ATP is required throughout promoter escape in activated transcription. (A) DNA sequences of pG5HMC2AT+nA templates. The first A residue in the G-less cassette is indicated in bold. WT, wild type. (B) Diagram illustrating the experimental design for stalling RNAPII before each A residue in transcription reactions. The templates, transcription factors, and nucleotides were added at the indicated time points. Transcription was performed on each template in the absence (−) or presence (+) of GAL4-VP16 and PC4. (C) Quantification of transcripts. The values are means ± SD from three independent experiments. (D) Fold activation for each template. The values are means ± SD from three independent experiments.
When RNAPII was stalled at or before the +8 position, further elongation of transcript was inhibited markedly by ATP-γS (Fig. 5 B and C). Interestingly, the inhibition was more pronounced for RNAPII stalled at the +2 and +3 positions, which corresponds to escape commitment (4), than that stalled at the +4, +5, and +8 positions. By contrast, when RNAPII was stalled at the +11 position and beyond, further elongation proceeded efficiently without dATP hydrolysis (Fig. 5 B and C). The same sets of experiments were done by using the TFIIH mutants, K41A and K48A, in place of wild-type TFIIH, and essentially the same results were obtained (data not shown), indicating that the effect of ATP-γS is solely due to the inhibition of the ERCC3 helicase activity. We then quantified the effect of ATP-γS during promoter escape by calculating fold activation for each template (Fig. 5D). Transcription stalled at the +2 and +3 positions increased by 3–5-fold, and that stalled at the +4, +5, and +8 positions increased by 8–10-fold in response to activation. By contrast, transcription stalled at the +11, +14, or +19 positions, where RNAPII has already escaped the promoter, increased by 12–14-fold. Thus, the effect of the ERCC3 helicase is not necessarily limited to escape commitment but seems to persist throughout the entire course of promoter escape.
Kinetics of Promoter Escape in Activated Transcription.
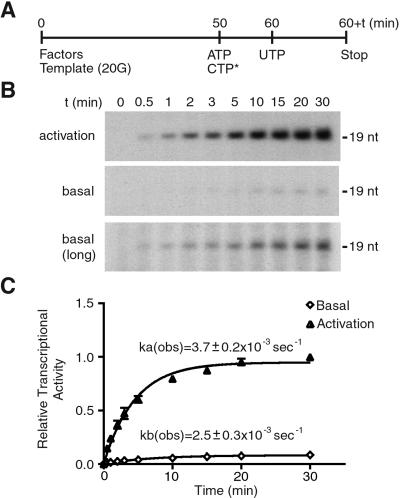
Because promoter escape is a rate-limiting step in basal transcription (4, 15), we determined whether the rate constant of promoter escape is increased in activated transcription by measuring the time course of a single round of promoter escape. PIC was assembled on the template 20G, and ATP and CTP were added to initiate transcription. Then, UTP was added to allow RNAPII to transcribe to the +19 position in the absence of GTP for a defined period (Fig. 6A). At the +19 position, RNAPII had escaped the promoter but had not moved far enough to allow another RNAPII to reinitiate transcription on the same template, thus enabling the measurement of a single round of promoter escape. Consistent with the previous results (4, 12, 15), the promoter escape step was found to be slow; the level of the 19-nt transcript increased gradually and reached near plateau only after 10–15 min (Fig. 6B). The relative levels of the 19-nt transcript then were plotted against time, and the rate constants were determined (Fig. 6C). The observed rate constant for basal transcription was 2.5 ± 0.3 × 10⁻³ s−1, whereas that for activated transcription was 3.7 ± 0.2 × 10⁻³ s−1. Thus, the observed rate constant of promoter escape is not influenced greatly by activation, indicating that promoter escape is enhanced by extent rather than rate in response to activation.
Figure 6.
Kinetic analysis of promoter escape in activated transcription. (A) Diagram illustrating the experimental design for in vitro transcription reactions. Ten-fold scales of transcription reactions were performed by using pG5HMC2AT+20G (template 20G), and aliquots were withdrawn at the indicated time points (60 + t). (B) Time course of promoter escape in the presence (activation, Top) or absence (basal, Middle and Bottom) of GAL4-VP16 and PC4. The Bottom (basal, long) indicates the 4-fold longer exposure of the Middle. The position of the 19-nt transcript is indicated. (C) Quantification of the time course of promoter escape. ka(obs) and kb(obs) indicate the observed rate constants for activated transcription and basal transcription, respectively. The values (means ± SD) at each time point from three independent experiments are plotted.
Discussion
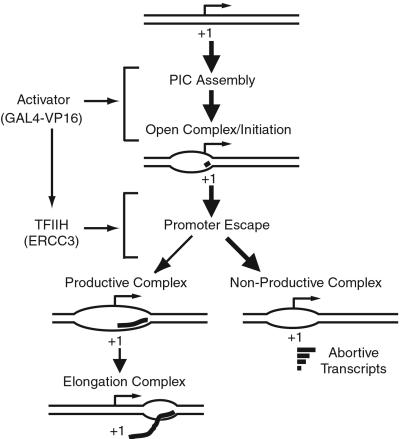
Based on our observations here, we propose a model for transcriptional activation by GAL4-VP16 (Fig. 7). GAL4-VP16 together with PC4 stimulates at least two steps for transcriptional activation; first, the steps before initiation (PIC assembly, promoter opening, and initiation; refs. 5, 6, and 33) and second, promoter escape that corresponds to a transient step, from initiation to ≈10-nt RNA synthesis, until RNAPII adopts a stable elongation complex. The stimulation of promoter escape in activated transcription is mediated via the ERCC3 helicase, the activity of which is required throughout the entire course of promoter escape for maximal activation (Fig. 5).
Figure 7.
Model for transcriptional activation by GAL4-VP16. GAL4-VP16, together with PC4, stimulates the steps before initiation and the promoter escape step. The stimulation of promoter escape occurs through the ERCC3 helicase activity of TFIIH, possibly by directing nonproductive transcription complexes into the productive pathway. The productive complexes enter into elongation and produce the full-length transcript, whereas the nonproductive complexes may only produce abortive transcripts.
We infer from the kinetic studies (Fig. 6) that the transcription pathway branches into productive and nonproductive pathways during promoter escape (Fig. 7). As discussed previously (15), the discrepancy between the increase in the observed rate constant (1.5-fold) and that in promoter escape (3–4-fold; Figs. 4 and 5) together with the low ratio of productive to total initiation complexes (estimated to be ≈5% for basal transcription and ≈20% for activation) suggests that the promoter escape step consists of a branched pathway (Fig. 7). Thus, transcriptional activation may occur by apparently diverting a higher proportion of PICs to the productive pathway. Although we have not determined the exact branch point, the presence of the aborted transcripts from 3 to 8 nt in length (Figs. 3 and 4) suggests that RNAPII could branch into the nonproductive pathway at any point of promoter escape, which is consistent also with the requirement of ATP until RNAPII has moved to the ≈+10 position.
The mechanism by which GAL4-VP16 stimulates promoter escape via the ERCC3 helicase of TFIIH remains unknown. Despite the direct interaction between TFIIH and GAL4-VP16 (31), we did not observe the stimulation of the ERCC3 helicase activity by GAL4-VP16 using a standard helicase assay (data not shown). This result may not be surprising, however, given the recent observation that TFIIH does not interact with the melted promoter region and therefore is unlikely to act as a conventional helicase (34). Thus, to stimulate the ERCC3 helicase activity, GAL4-VP16 may need to interact with TFIIH within PICs in a stereo-specific manner. Understanding how GAL4-VP16 interacts with TFIIH within PICs and effects the stimulation of the helicase activity requires further studies.
The presence of at least two sequential steps that are regulated by activators readily explains transcriptional synergy (35, 36). It is widely known that transcriptional synergy occurs even with a single type of activator such as GAL4-VP16 if bound multiply on a promoter (37, 38), at which each activator is presumed to contact a different target within each PIC and to stimulate a distinct step of the transcriptional pathway (1, 39, 40). This phenomenon seems to be the case in the current transcription system in which two distinct steps are stimulated in activated transcription (namely, the steps before initiation by 3–5-fold and the promoter escape step by 3–4-fold, respectively), resulting in the stimulation of overall transcription by 15–20-fold (Figs. 4 and 5). The mechanism for transcriptional synergy described here also conforms to a preassembled holoenzyme model (41, 42) needs not invoke sequential recruitment of individual general transcription factors (43); activators would effect transcriptional synergy by stimulating first the recruitment of holoenzyme and then promoter escape. In agreement with this notion, holoenzymes bound on a promoter but not actively transcribing the gene are found on a subset of promoters in yeast (44).
Finally, our results provide an added significance to the previous studies that describe the direct interaction of TFIIH with several transcription factors. Hence, the regulation of transcription during promoter escape via TFIIH may be more widespread than is thought currently. Our model here (Fig. 7) should provide a conceptual framework for analyzing those interactions mechanistically.
Acknowledgments
We thank C.-M. Chiang for a HeLa cell line, F. C. P. Holstege for advice on the analyses of short transcripts, and M. Suganuma for technical assistance. A.F. is a Research Fellow of the Japan Society for the Promotion of Science. This work was supported by grants-in-aid from the Ministry of Education, Science, Sports, and Culture of Japan and grants from Core Research for Evolutional Science and Technology (to Y.N. and K.H.).
Abbreviations
- RNAPII
RNA polymerase II
- PIC
preinitiation complex
- TFIIH
transcription factor IIH
- ERCC
excision repair cross-complementing
- ssDNA
single-stranded DNA
- 3′-O-methyl GTP
3′-O-methylguanosine 5′-triphophate
- ATP-γS
adenosine 5′-O-(3-thiotriphophate)
References
- 1.Triezenberg S J. Curr Opin Genet Dev. 1995;5:190–196. doi: 10.1016/0959-437x(95)80007-7. [DOI] [PubMed] [Google Scholar]
- 2.Roeder R G. Trends Biochem Sci. 1996;21:327–335. [PubMed] [Google Scholar]
- 3.Orphanides G, Lagrange T, Reinberg D. Genes Dev. 1996;10:2657–2683. doi: 10.1101/gad.10.21.2657. [DOI] [PubMed] [Google Scholar]
- 4.Kugel J F, Goodrich J A. J Biol Chem. 2000;275:40483–40493. doi: 10.1074/jbc.M006401200. [DOI] [PubMed] [Google Scholar]
- 5.Ptashne M, Gann A. Nature (London) 1997;386:569–577. doi: 10.1038/386569a0. [DOI] [PubMed] [Google Scholar]
- 6.Struhl K. Cell. 1999;98:1–4. doi: 10.1016/S0092-8674(00)80599-1. [DOI] [PubMed] [Google Scholar]
- 7.Rougvie A E, Lis J T. Mol Cell Biol. 1990;10:6041–6045. doi: 10.1128/mcb.10.11.6041. [DOI] [PMC free article] [PubMed] [Google Scholar]
- 8.Yankulov K, Blau J, Purton T, Roberts S, Bentley D L. Cell. 1994;77:749–759. doi: 10.1016/0092-8674(94)90058-2. [DOI] [PubMed] [Google Scholar]
- 9.Akhtar A, Faye G, Bentley D L. EMBO J. 1996;15:4654–4664. [PMC free article] [PubMed] [Google Scholar]
- 10.Krumm A, Hickey L B, Groudine M. Genes Dev. 1995;9:559–572. doi: 10.1101/gad.9.5.559. [DOI] [PubMed] [Google Scholar]
- 11.Chen J, Ding M, Pederson D S. Proc Natl Acad Sci USA. 1994;91:11909–11901. doi: 10.1073/pnas.91.25.11909. [DOI] [PMC free article] [PubMed] [Google Scholar]
- 12.Narayan S, Widen S G, Beard W A, Wilson S H. J Biol Chem. 1994;269:12755–12763. [PubMed] [Google Scholar]
- 13.Holstege F C, van der Vliet P C, Timmers H T. EMBO J. 1996;15:1666–1677. [PMC free article] [PubMed] [Google Scholar]
- 14.Holstege F C, Fiedler U, Timmers H T. EMBO J. 1997;16:7468–7480. doi: 10.1093/emboj/16.24.7468. [DOI] [PMC free article] [PubMed] [Google Scholar]
- 15.Kugel J F, Goodrich J A. Proc Natl Acad Sci USA. 1998;95:9232–9237. doi: 10.1073/pnas.95.16.9232. [DOI] [PMC free article] [PubMed] [Google Scholar]
- 16.Luse D S, Jacob G A. J Biol Chem. 1987;262:14990–14997. [PubMed] [Google Scholar]
- 17.Luse D S, Kochel T, Kuempel E D, Coppola J A, Cai H. J Biol Chem. 1987;262:289–297. [PubMed] [Google Scholar]
- 18.Goodrich J A, Tjian R. Cell. 1994;77:145–156. doi: 10.1016/0092-8674(94)90242-9. [DOI] [PubMed] [Google Scholar]
- 19.Coin F, Egly J M. Cold Spring Harbor Symp Quant Biol. 1998;63:105–110. doi: 10.1101/sqb.1998.63.105. [DOI] [PubMed] [Google Scholar]
- 20.Tirode F, Busso D, Coin F, Egly J M. Mol Cell. 1999;3:87–95. doi: 10.1016/s1097-2765(00)80177-x. [DOI] [PubMed] [Google Scholar]
- 21.Dvir A, Conaway R C, Conaway J W. Proc Natl Acad Sci USA. 1997;94:9006–9010. doi: 10.1073/pnas.94.17.9006. [DOI] [PMC free article] [PubMed] [Google Scholar]
- 22.Moreland R J, Tirode F, Yan Q, Conaway J W, Egly J M, Conaway R C. J Biol Chem. 1999;274:22127–22130. doi: 10.1074/jbc.274.32.22127. [DOI] [PubMed] [Google Scholar]
- 23.Wu S Y, Kershnar E, Chiang C M. EMBO J. 1998;17:4478–4490. doi: 10.1093/emboj/17.15.4478. [DOI] [PMC free article] [PubMed] [Google Scholar]
- 24.Haile D T, Parvin J D. J Biol Chem. 1999;274:2113–2117. doi: 10.1074/jbc.274.4.2113. [DOI] [PubMed] [Google Scholar]
- 25.Kumar K P, Akoulitchev S, Reinberg D. Proc Natl Acad Sci USA. 1998;95:9767–9772. doi: 10.1073/pnas.95.17.9767. [DOI] [PMC free article] [PubMed] [Google Scholar]
- 26.Sun X, Zhang Y, Cho H, Rickert P, Lees E, Lane W, Reinberg D. Mol Cell. 1998;2:213–222. doi: 10.1016/s1097-2765(00)80131-8. [DOI] [PubMed] [Google Scholar]
- 27.Akoulitchev S, Chuikov S, Reinberg D. Nature (London) 2000;407:102–106. doi: 10.1038/35024111. [DOI] [PubMed] [Google Scholar]
- 28.Liu J, He L, Collins I, Ge H, Libutti D, Li J, Egly J M, Levens D. Mol Cell. 2000;5:331–341. doi: 10.1016/s1097-2765(00)80428-1. [DOI] [PubMed] [Google Scholar]
- 29.Fukuda A, Yamauchi J, Wu S-Y, Chiang C-M, Muramatsu M, Hisatake K. Genes Cells. 2001;6:707–719. doi: 10.1046/j.1365-2443.2001.00456.x. [DOI] [PubMed] [Google Scholar]
- 30.Werten S, Langen F W, van Schaik R, Timmers H T, Meisterernst M, van der Vliet P C. J Mol Biol. 1998;276:367–377. doi: 10.1006/jmbi.1997.1534. [DOI] [PubMed] [Google Scholar]
- 31.Xiao H, Pearson A, Coulombe B, Truant R, Zhang S, Regier J L, Triezenberg S J, Reinberg D, Flores O, Ingles C J, et al. Mol Cell Biol. 1994;14:7013–7024. doi: 10.1128/mcb.14.10.7013. [DOI] [PMC free article] [PubMed] [Google Scholar]
- 32.Keene R G, Luse D S. J Biol Chem. 1999;274:11526–11534. doi: 10.1074/jbc.274.17.11526. [DOI] [PubMed] [Google Scholar]
- 33.Wang W, Carey M, Gralla J D. Science. 1992;255:450–453. doi: 10.1126/science.1310361. [DOI] [PubMed] [Google Scholar]
- 34.Kim T K, Ebright R H, Reinberg D. Science. 2000;288:1418–1422. doi: 10.1126/science.288.5470.1418. [DOI] [PubMed] [Google Scholar]
- 35.Herschlag D, Johnson F B. Genes Dev. 1993;7:173–179. doi: 10.1101/gad.7.2.173. [DOI] [PubMed] [Google Scholar]
- 36.Wang J, Ellwood K, Lehman A, Carey M F, She Z S. J Mol Biol. 1999;286:315–325. doi: 10.1006/jmbi.1998.2489. [DOI] [PubMed] [Google Scholar]
- 37.Lin Y S, Carey M, Ptashne M, Green M R. Nature (London) 1990;345:359–361. doi: 10.1038/345359a0. [DOI] [PubMed] [Google Scholar]
- 38.Lin Y S, Green M R. Cell. 1991;64:971–981. doi: 10.1016/0092-8674(91)90321-o. [DOI] [PubMed] [Google Scholar]
- 39.Ptashne M. Nature (London) 1988;335:683–689. doi: 10.1038/335683a0. [DOI] [PubMed] [Google Scholar]
- 40.Carey M, Lin Y S, Green M R, Ptashne M. Nature (London) 1990;345:361–364. doi: 10.1038/345361a0. [DOI] [PubMed] [Google Scholar]
- 41.Koleske A J, Young R A. Trends Biochem Sci. 1995;20:113–116. doi: 10.1016/s0968-0004(00)88977-x. [DOI] [PubMed] [Google Scholar]
- 42.Halle J P, Meisterernst M. Trends Genet. 1996;12:161–163. doi: 10.1016/0168-9525(96)30035-8. [DOI] [PubMed] [Google Scholar]
- 43.Choy B, Green M R. Nature (London) 1993;366:531–536. doi: 10.1038/366531a0. [DOI] [PubMed] [Google Scholar]
- 44.Kuras L, Struhl K. Nature (London) 1999;399:609–613. doi: 10.1038/21239. [DOI] [PubMed] [Google Scholar]


