

ABSTRACT
Chinese hamster ovary (CHO) cells are widely used in recombinant biopharmaceutical production; yet, yields remain low, leading to high market prices. Improving product yield and quality has heavily relied on empirical characterization with limited insight into internal molecular dynamics. RNA‐seq offers a powerful alternative to understand intracellular responses to process changes through gene expression measurement. In this study, three RNA‐seq datasets across three CHO cell lines and four industrially relevant treatments were integrated to characterize the global transcriptome changes, construct a weighted gene co‐expression network, assess the impact on recombinant anti‐interleukin 8 (anti‐IL8) immunoglobulin heavy and light chain transcript abundance, and expression of glycosylation genes. Treatments included adaptation to serum‐free medium, low temperature, low pH, and low glucose concentration in the medium. The findings suggest upregulation of cholesterol biosynthesis is critical for serum‐free medium adaptation, and the rate‐limiting enzymes in the sterol regulatory element‐binding protein pathway (Insig1 and Srebf2) could be targeted to accelerate adaptation. Temperature‐induced cell cycle suppression was likely mediated by p53 activation, consistent with previous reports, with the p53‐targets, Zmat3 and Btg2, identified as key hub genes. Conversely, glucose and pH were observed to have negligible impacts on the transcriptome. This study uniquely identifies novel genes mediating temperature‐induced cell cycle arrest, distinct glycosylation‐related gene responses impacting product quality, and new stable housekeeping genes for accurate gene expression normalization in CHO cells.
Keywords: cholesterol metabolism, co‐expression analysis, gene expression, RNA‐Seq, sterol regulatory element‐binding proteins
Graphical Abstract and Lay Summary
Transcriptomic analysis of CHO cells exposed to different industrially relevant conditions identified cholesterol and p53‐related genes with differential expression and several new housekeeping genes.

Abbreviations
- CHO
Chinese hamster ovary
- CV
coefficient of variation
- DEG
differentially expressed gene
- DHFR
dihydrofolate reductase
- FC
Fold change
- GO
gene ontology
- HKG
housekeeping gene
- LFC
log‐fold change
- MCC
maximum clique centrality
- MFC
maximum fold change
- qP
specific productivity rate
- SREBP
sterol regulatory element‐binding proteins
- VCD
viable cell density
- WGCNA
weighted gene co‐expression network analysis
1. Introduction
Chinese hamster ovary (CHO) cells are widely used in biopharmaceutical production due to well‐established expression systems, scalability, and ability to produce human‐compatible glycoproteins [1]. Historically, the CHO/DHFR system was widely used for recombinant CHO cell line development. However, the glutamine synthetase (GS) selection system has become more prevalent in recent years due to advantages in selection stringency, stability, and reduced regulatory concerns [2]. Most CHO cell genetic manipulations have been conducted in the presence of animal serum, yet serum poses significant regulatory concerns due to batch variability and potential presence of contaminants like prions and viruses [3]. Consequently, there is strong preference for chemically defined, serum‐free formulations in industrial production processes, which requires adapting new clones to serum‐free media. The adaptation process is time‐consuming where some clones are lost [4, 5, 6, 7]. Hence, efforts have been made to expedite adaptation through rational media design [8], exogenous additives [8, 9], cell line engineering [10, 11], and the use of serum‐free adapted host cell lines.
Process conditions including temperature, pH, and glucose concentration, are tightly controlled in CHO cell cultures to improve productivity and quality outcomes. While culture temperatures are generally maintained at 37°C, temperature downshifts are frequently employed in fed‐batch CHO cell processes to slow cell metabolism, arrest cell growth, and increase product yields and quality [12, 13, 14]. Interestingly, the impact on productivity and quality can vary by cell line and product. Several research groups have reported transcriptional responses to sub‐physiological culture temperatures [15, 16, 17]. Similarly, pH is a critical environmental factor that significantly influences cell growth, metabolism, productivity, and product quality [12, 18]. While traditionally maintained between pH 6.9–7.3, low culture pH (<7.0) has often been reported to result in improved cell viability, prolonged cultivation time, and enhanced recombinant protein yield [12, 18]. Yet, there are industrial anecdotes that indicate pH 7.1 can be optimal. Another process parameter with mixed reports is the glucose concentration. Typically, glucose is maintained between 2–6 g/L (∼10–30 mM) in production cultures; however, recent studies using pH‐control [19] or Raman [20] have shown controlled glucose (1–2 g/L) enhances productivity. Additionally, glucose is well known to affect growth rates, glucose consumption and lactate production rates, and oxygen uptake rates [19, 20].
Transcriptomics is one of the most cost‐effective omics methodologies and provides mechanistic insights into cellular responses at the gene expression level. Prior to the release of the CHO cell genome in 2011 [21], DNA microarrays were the primary method for quantifying gene expression in CHO cells. However, with the availability of a reference genome, RNA‐seq has emerged as a superior alternative, offering multiple advantages over DNA microarrays [22, 23]. Several studies have integrated RNA‐seq to study the biological mechanisms driving cellular responses and phenotypic traits in CHO cells [16]. Generally, transcriptomic studies investigate differential expression of genes, gene sets, and/or pathways; yet, weighted gene co‐expression network analysis (WGCNA) is a powerful approach that is much less utilized. WGCNA identifies modules of correlated “guilty‐by‐association” genes and offers a holistic view of gene interactions and regulatory networks. Others have leveraged this tool in CHO cell research to identify key mediators and gene clusters associated with ER stress [24], productivity [25, 26], and other culture traits such as growth rate and peak viable cell density (VCD) [25].
In this study, multiple datasets were integrated across several cell lines and treatments to characterize global impacts on the transcriptome. One dataset followed the adaptation to serum‐free media for a host cell line (CHO dhFr‐) and a recombinant cell line (rCHO DP‐12). A second dataset explored the effects of glucose concentration (10 and 30 mM) on rCHO DP‐12. The third dataset examined the normal (37°C) and sub‐physiological (33°C) temperatures in combination with two pH levels (pH 6.70 and 6.95) on the CHO‐K1 host and rCHO DP‐12. The rationale for combining multiple datasets into a single integrated transcriptomic analysis was to uncover common regulatory networks and conserved gene expression patterns across different, but industrially relevant bioprocess conditions. By leveraging weighted gene co‐expression network analysis (WGCNA), we aimed to identify robust transcriptional responses and regulatory modules that transcend specific treatment conditions, ultimately providing novel targets for cell engineering and improved bioprocess control. Finally, these datasets were used to identify housekeeping genes that could be leveraged for quantitative gene expression assays, such as quantitative PCR (qPCR).
2. Materials and Methods
2.1. CHO Cell Lines and Off‐Line Measurements
Three CHO cell lines referred to as rCHO DP‐12, CHO dhFr‐, and CHO K1‐PF were used. The recombinant cell line rCHO DP‐12 clone #1934 (ATCC CRL‐12445) produces a human monoclonal antibody (IgG1) against Interluekin‐8 (IL‐8); CHO dhFr‐ (ATCC CRL‐9096) is a non‐recombinant host cell line and the parental cell line of rCHO DP‐12, and; CHO K1‐PF (Sigma 00102307) is a non‐recombinant host cell line derived from CHO‐K1 and previously adapted to the Sigma CHO protein‐free medium [2, 27]. Cell lineages have been described elsewhere [27].
Cell concentrations were measured using a Scepter 2.0 Handheld Automated Cell Counter (Millipore, MA, USA) or Bio‐Rad TC20 Automated Cell Counter (Bio‐Rad Laboratories, CA, USA). Glucose and lactate were measured with a Yellow Springs Instruments (YSI) 2900 Biochemistry Analyzer (Yellow Springs, OH, USA). Duplicate cultures were conducted for all conditions (N = 2). Statistical analysis of the growth rates was performed in JMP (SAS Institute, NC, USA).
2.2. Individual Dataset Culture Conditions
2.2.1. Adaptation Process to Serum‐Free Medium
The rCHO DP‐12 and CHO dhFr‐ cell lines were initially cultured in Dulbecco's Modified Eagle medium (DMEM) (Life Technologies, NY, USA) with 4.5 g/L glucose, 10% v/v fetal bovine serum (FBS) (Life Technologies, NY, USA), 5 mM L‐glutamine (Life technologies, NY, USA), and 10 µg/mL ciprofloxacin‐HCl (Mediatech Inc., VA, USA). For serum‐free media adaptation, CD CHO medium (Life technologies, NY, USA) supplemented with 5 mM L‐glutamine (Life Technologies, NY, USA), 10 µg/mL ciprofloxacin‐HCl (Mediatech Inc., VA, USA), and 1:250 anti‐clumping agent (Life Technologies, NY, USA) was used. Both DMEM and CD CHO media were additionally supplemented with 0.1 mM hypoxanthine, 0.016 mM thymidine, 0.002 mg/mL recombinant human insulin (MilliporeSigma, MA, USA), and 0.2 mM methotrexate (MTX). Cells were grown in 25 cm2 flasks (Corning Inc., NY, USA) in an incubator maintained at 37°C and humidified 5% CO2 atmosphere. The 5% and all 0% serum suspension cultures were shaken at 120 rpm. Both cell lines were gradually shifted to lower serum concentrations by increasing the proportion of CD CHO medium relative to the DMEM media at 2.5%. Adherent cultures were seeded at 1 × 10⁶ cells/cm2. Suspension cultures were seeded at 0.2 × 10⁶ cells/mL. The cultures were considered to be adapted to a serum concentration when three criteria were met for at least three passages: (1) ≥90% cell viability, (2) viable cell densities (VCD) ≥ 1.5 × 10⁶ cells/mL, and (3) cell doubling times < 24 h. Stock cultures were prepared and frozen for adapted cultures. Process was repeated until the cultures had adapted to the serum‐free medium or the cells would not adapt to a lower serum concentration.
2.2.2. Glucose Culture Conditions
Briefly, rCHO DP‐12 cultured at normal (30 mM) and low (10 mM) initial glucose concentrations was included in the analysis (N = 2 each) [28]. Cells were seeded at 0.2 × 10⁶ cells/mL and incubated at 37°C in a humidified 5% CO2 atmosphere, shaken at 120 rpm.
2.2.3. Temperature and pH Culture Conditions
The serum‐free adapted rCHO DP‐12 and CHO K1‐PF cell lines were cultured in CD CHO medium, 5 mM glutamine, and 1:250 anti‐clumping agent (Life technologies, NY, USA). A two‐level factorial design was used with temperatures 37°C and 33°C and initial pH 6.95 and 6.70. Cultures were seeded at ∼9 × 10⁴ cells/mL in 75 cm2 flasks (Corning Inc., NY, USA) and maintained in humidified incubators at 37°C or 33°C with 5% CO2 atmosphere. The initial pH and the pH at the time of RNA extraction was measured using a Denver Instruments UltraBasic benchtop pH meter UB‐10 (Denver Instruments, CO, USA). For the cultures at pH 6.70, the initial media pH was reduced using 1.2 N HCl (Thermo Fisher Scientific, NC, USA). An initial principal component analysis (PCA) revealed library contamination in the CHO K1‐PF 37°C, pH 6.70 replicates. Insufficient material was available to reanalyze, so an unbalanced design was used.
2.3. RNA Isolation
Total RNA was extracted from cells in mid‐exponential growth phase. RNAprotect cell reagent (Qiagen, Valencia, CA) was added to harvested samples immediately. Total RNA extraction was performed with the RNeasy Plus Mini kit (Qiagen) according to the manufacturer's protocol. Quality and integrity were validated on a NanoDrop 8000 UV‐Vis spectrophotometer (Thermo Scientific, MA, USA) and Agilent 2100 Bioanalyzer System (Agilent, Santa Clara, CA) with RNA 6000 Nano kit (Agilent), respectively. All samples had RNA integrity numbers (RIN) values greater than nine.
2.4. Library Synthesis, Sequencing, and Reference Mapping
RNA samples were normalized to a standard input concentration (1 µg of total RNA) and an Illumina compatible sequencing library was prepared with the TruSeq RNA sample preparation v2.0 kit (Illumina, San Diego, CA) following the manufacturer's instructions. The resulting cDNA libraries were quality validated on an Agilent 2100 Bioanalyzer System to ensure proper fragment distribution (∼260 bp) and effective removal of adapter dimers. Sequence libraries were multiplexed and sequence data collected on two lanes of a HiSeq 2500 (Illumina, San Diego, CA) at the Genomics division of David H. Murdock Research Institute (Kannapolis, NC) using a 2 × 101 bp, paired end read type, targeting at least 20 million read pairs per sample. Raw sequence reads were demultiplexed on the instrument and reads ≥36 bp were cleaned of adapter and low quality bases (<Phred 15) with the Trimmomatic (v0.39) software package [29]. Trimmed reads were aligned with the STAR (v2.7.9a) software package [30] to the PICRH Chinese hamster reference genome [31] (NCBI GCF_003668045.3_CriGri‐PICRH‐1.0) appended with the heavy and light chain nucleotide sequence for the anti‐IL8 monoclonal antibody [32]. The locally aligned sequences were then passed through samtools [33] (v1.10) to be converted to BAM files for gene quantification using HTSeq [34] (v0.11.2) with default settings. The external dataset (GSE75094) was run through the same pipeline for single‐read types [9]. Raw datasets have been deposited into the Sequence Read Archive (SRA) under BioProject number PRJNA1130622. The SRA accession numbers are: (1) serum‐free medium adaptation dataset: SAMN42212550–SAMN42212559; (2) temperature and pH dataset: SAMN42212532–SAMN42212545; and (3) glucose dataset: SAMN42212546–SAMN42212549.
2.5. Differential Gene Expression Analysis
The DESeq2 R/Bioconductor package [35] (v1.40.2) was used for differential gene expression analysis. Raw data was mapped to a total of 32,818 protein‐coding genes from the appended reference file, of which 12,965 genes were considered to have measurable expression (mean base expression >10 counts). Batch effects were analyzed through the SVA R package [36]. Two identified surrogate variables were appended to the dds object, and the DESeq function was re‐run. The DESeq2 likelihood ratio test (LRT) was used to determine significant genes across treatments in an ANOVA‐like analysis and returned 11,131 genes (false discovery rate (FDR) ≤ 10−4). Post‐hoc Wald tests were used to identify differentially expressed genes (DEGs) (FDR ≤ 0.01; absolute fold change (|FC|) ≥ 1.5). The variance‐stabilized transformations (VST) of the top 2500 most variant of the 11,131 genes were used for principal component analysis (PCA). Results were visualized in mean‐abundance (MA) plots following log‐fold change (LFC) shrinkage by the ashr package [37]. The external dataset (GSE75094) was mapped to the same reference file [9]. A total of 12,651 genes had measurable expression (mean base expression ≥ 10 counts), and 2,914 genes were significant by the LRT (FDR ≤ 0.01).
2.6. Gene Ontology (GO) Enrichment Analysis and Differentially Expressed Pathway (DEP) Analysis
The goseq R/Bioconductor package was used for gene ontology (GO) analysis with a target and background list [38]. A custom reference list was made from mouse, Chinese hamster, and CHO cell annotations [39]. REVIGO was used for term reduction [40]. The GAGE R/Bioconductor package was used for threshold‐free differentially expressed pathway (DEP) analysis of individual contrast arguments [41]. Upregulated, downregulated, or non‐directional, perturbed pathways were returned for each contrast, and essential groupsets were compared.
2.7. Weighted Gene Co‐Expression Network Analysis (WGCNA)
The signed, weighted gene co‐expression network was constructed from the 12,965 genes with measurable expression using the WGCNA R package [42]. A soft‐threshold power of 24 was set to obtain scale‐free R2 > 0.8 with sufficiently high mean connectivity (Figure S1). A cut height of 0.3 and a minimum module size of 30 were used. Eighteen modules were built and automatically assigned arbitrary colors (Figure S2). Cytoscape was used for visualization [43]. The edge‐weight threshold value was calculated and plotted as nodes or edges that successfully imported into Cytoscape (Figure S3). The segmented R package was used to fit a generalized linear model (GLM) and identify elbows [44]. Values of 0.084 and 0.102 were identified from the node and edge plots, respectively. A more conservative, rounded‐down value of 0.08 was selected, and 7131 genes were obtained. The grey and grey60 modules did not have connections at this threshold and were excluded from further analysis. The tan and light cyan modules only contained <20 nodes and <10 edges and were also removed to leave 14 modules.
2.8. Hub Gene Identification
Serum‐ and temperature‐sensitive DEGs were subsetted from the full network of 7131 genes to construct two DEG subnetworks. Additionally, non‐DEGs with ≥20 and ≥10 connections to DEGs were included for the serum and temperature subnetworks, respectively. For the serum analysis, the top 20 hub genes were identified through Cytohubba by the maximum clique centrality (MCC) algorithm [45]. For improved network coverage, hub genes were also identified within highly interconnected regions returned by MCODE (MCODE scores >4 and >5 nodes) [46]. All candidate hub genes within the serum DEG subnetwork were further screened for consistent expression patterns between rCHO DP‐12 and the external CHO‐K1 from GSE75094 [9]. For the temperature analysis, the subnetwork was considerably smaller and more densely connected than the serum DEG subnetwork; therefore, only the top 10 hub genes were identified through Cytohubba by the MCC algorithm. MCODE was used for improved network coverage.
2.9. Housekeeping Gene Identification
Potential CHO cell housekeeping genes (HKGs) were identified through ranking of the maximum fold change multiplied by the coefficient of variation (MFC‐CV) of the normalized DESeq2 counts from least to greatest. CV was calculated as the standard deviation divided by the mean for each normalized gene. MFC was calculated as the maximum expression divided by the minimum expression for each normalized gene. The MFC, CV, and MFC‐CV values of the externally sourced HKGs were calculated using this study's gene expression values.
3. Results and Discussion
To characterize global transcriptional responses under bioprocess‐relevant conditions, we integrated three internal datasets and one external dataset. The first dataset tracked serum‐free adaptation for two CHO cell lines, rCHO DP‐12 and CHO dhFr, from 10% to 0% serum. Additionally, an external dataset (GSE75094) was analyzed that followed CHO‐K1 (ATCC‐CCL‐61) serum‐free adaptation across 10 passages [9]. This external dataset was included since the CHO dhFr‐ culture was unable to adapt below 5% serum in this work. The second internal dataset investigated the effects of normal (30 mM) and low (10 mM) initial glucose on rCHO DP‐12 and was previously published [28]. The third internal dataset evaluated responses to temperature reduction (37°C–33°C) and culture pH variation (6.95 vs. 6.70) in rCHO DP‐12 and CHO K1‐PF cells. In total, RNA from 14 bioprocess conditions (N = 2 replicates each) was analyzed (Table S1).
3.1. Cell Growth and Metabolism
Viable cell density (VCD), glucose, and lactate time profiles for all conditions are shown in Figure 1. As a reduction in serum concentration from 10% to 5% or lower induces a phenotypic transition from adherent to suspension cultures, VCD is reported as cells/cm2 for cultures maintained in 10% serum and as cells/mL for cultures in 5% serum or lower. Cells were seeded at low concentrations for the temperature/pH study so pH would remain relatively constant. At the RNA harvest timepoints, all cultures were in exponential growth, had sufficient glucose, and had non‐inhibitory lactate levels. The exponential growth was similar for all the 37°C cultures (serum and glucose dataset included) and clearly shown in Figure 1 by the parallel growth profiles and highlighted in Table S2. As expected, lower growth rates were observed for both rCHO DP‐12 and CHO K1‐PF at culture temperatures of 33°C (p ≤ 0.05). Interestingly, rCHO DP‐12 had slightly higher growth rates than the CHO K1‐PF cultures under the same growth conditions. As expected, the low pH cultures (pH 6.70) had slightly lower lactate accumulation relative to the normal pH cultures for both cell lines at both 37°C and 33°C (p ≤ 0.05), yet none were inhibitory concentrations. These profiles demonstrated good growth control and waste product control to enable transcriptomic comparison without confounding effects.
FIGURE 1.
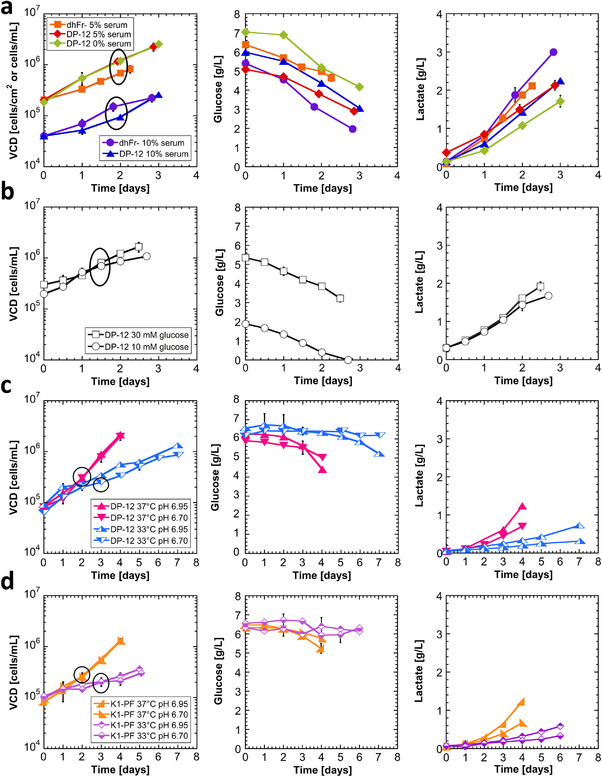
Culture growth and metabolite profiles for (a) serum‐free adaptation dataset, (b) glucose dataset, (c) DP‐12 temperature/pH dataset, (d) K1‐PF temperature/pH dataset. Circled data represent RNA extraction timepoints. Error bars represent the standard deviation of biological replicates (N = 2). To facilitate visual comparisons, the same symbols and colors are used in both Figures 1 and 2.
3.2. Transcriptome Overview
Principal component analysis (PCA) was used to assess the impact of each treatment across the 28 samples (14 conditions) on the transcriptome. The PCA plot demonstrated tight clustering of the biological replicates for all conditions (Figure 2). The greatest variance (41%) was primarily attributed to the cell lines, as rCHO DP‐12, CHO dhFr‐, and CHO K1‐PF are well separated in PC1. The second highest variance (31%) was primarily due to serum, as the 10% and 5% serum culture for both rCHO DP‐12 and CHO dhFr‐ are well separated from the serum‐free cultures in PC2. Temperature effects were observed in both principal components, as the 33°C and 37°C cultures for both rCHO DP‐12 and CHO K1‐PF shifted similarly. As shown previously, the initial glucose concentration was insignificant [28]. Similarly, culture pH was insignificant and therefore removed as a factor from the model. PCA was able to clearly indicate that cell line and serum adaptation had the greatest effect on the transcriptome, with temperature demonstrating a lesser impact, whereas glucose and pH had negligible effects.
FIGURE 2.
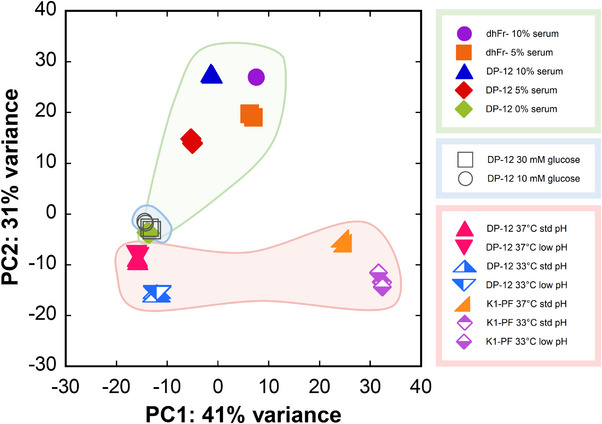
Principal component analysis (PCA) for the three datasets representing 14 conditions (N = 2). To facilitate visual comparisons, the same symbols and colors are used in both Figures 1 and 2.
3.3. Network Construction
The three datasets were combined to identify gene modules and hub genes using WGCNA. A total of 7131 genes had at least one edge (edge weight threshold > 0.08) and were clustered into 18 modules. Low connectivity modules (<20 nodes and <10 edges) were not considered meaningful and disregarded, leaving 14 of the 18 modules (Figure 3). Modules were broadly grouped into five bins by the module eigengene (ME) expression patterns to represent modules sensitive to serum, cell line, and temperature, in addition to cell‐line differences in CHO dhFr‐ expression and differences in the glucose dataset.
FIGURE 3.
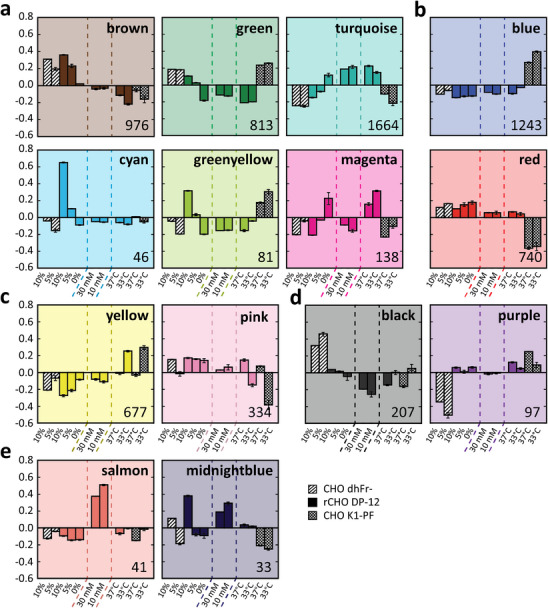
Module eigengene plots of the three datasets. The y‐axes represent the eigengene expression levels. (a) serum‐sensitive modules, (b) cell line modules, (c) temperature‐sensitive modules, (d) differences in CHO dhFr‐ expression, (e) differences in glucose samples expression. Dashed lines delineate the serum adaptation, glucose, and temperature datasets, respectively. Diagonal filled bars represents CHO dhFr‐, solid filled bars represents rCHO DP‐12, and cross‐hatched bars represents CHO K1‐PF. Number of genes within respective module provided in lower right corner. Error bars represent standard deviation of module eigengenes (N = 2).
3.4. Serum‐Free Medium Adaptation Effects on the Transcriptome
The aim of the serum‐free medium adaptation study was to understand the critical genes and gene families necessary for successful adaptation to serum‐free medium. Additionally, these results were used to identify potential engineering targets to accelerate the adaptation. The rCHO DP‐12 culture was successfully adapted to serum‐free medium (0% serum) within 65 days; however, the non‐recombinant host CHO dhFr‐ was only successfully adapted to 5% serum by 65 days. Further attempts to adapt to lower serum levels below 5% failed, even after 120 days. Thus, a secondary objective of this investigation was to determine why CHO dhFr‐ failed to adapt below 5% serum. To complete the analysis, RNA samples were extracted from rCHO DP‐12 cultures grown in 10%, 5%, and 0% serum media, and CHO dhFr‐ cultures grown in 10% and 5% serum media.
Differentially expressed genes (DEGs) sensitive to the serum‐free adaptation process were identified. From three pairwise contrast arguments for rCHO DP‐12 (5/10, 0/5, 0/10) and one contrast for the host CHO dhFr‐ (5/10), a total of 2072 unique DEGs were identified within at least one of these four contrasts (FDR ≤ 0.01; |FC| ≥ 1.5) (Figure S4). In agreement with the PCA plot, the rCHO DP‐12 cultures had a greater number of DEGs compared to the CHO dhFr‐ cultures (Figure S5). Because the CHO dhFr‐ cell line was unable to adapt below 5% serum, an external dataset (GSE75094) was cross‐compared to further screen for critical genes and pathways related to serum‐free medium adaptation [9]. In this external study, CHO‐K1 cells were adapted for 10 passages in SFM4CHO (N = 2), and RNA was extracted on passages 0, 2, 4, 6, and 10. A total of 2914 DEGs were identified by a likelihood‐ratio test (FDR ≤ 0.01) within GSE75094. The intersection of both datasets returned 703 DEGs considered to be critical for serum‐free medium adaptation.
Gene ontology (GO) analysis of the 703 DEGs returned numerous overrepresented GO terms that supported the phenotypic shift from adherent to suspension cultures (q ≤ 10−4). These included extracellular matrix (GO:0031012), plasma membrane (GO:0005886), and cell adhesion (GO:0007155) (Table S3). Notably, genes associated with steroid (GO:0006694), cholesterol (GO:0006695), and isoprenoid biosynthesis (GO:0008299), collectively referred to as the mevalonate pathway, were significantly upregulated in the cultures that successfully adapted to serum‐free medium (rCHO DP‐12 and the external CHO‐K1 from GSE75094). Interestingly, these lipogenic genes, many of which clustered within the turquoise module (Figure 3), were unchanged in CHO dhFr‐. Furthermore, lipogenic gene expression was considerably lower in the CHO dhFr‐ cultures relative to the serum‐free cultures within the temperature/pH and glucose datasets, suggesting overexpression of these genes may be required for serum‐free medium adaptation.
Orthogonally, threshold‐free differentially expressed pathway (DEP) analysis was performed for each of the four pairwise contrasts and GSE75094 (Table 1). Glutathione metabolism was upregulated in all cell lines within both datasets, while steroid biosynthesis and oxidative phosphorylation were only upregulated in rCHO DP‐12 and the external CHO‐K1 (q ≤ 10−4). Additionally, rCHO DP‐12 and the external CHO‐K1 had significant perturbations in the PI3K‐Akt signaling pathway, extracellular matrix (ECM)‐receptor interaction, and regulation of actin cytoskeleton KEGG pathways. Numerous downregulated pathways were exclusively observed in CHO dhFr‐ including cell cycle, ribosome, and other genetic information processing pathways.
TABLE 1.
Differential gene expression for KEGG designated pathways (q ≤ 10−4) relative to the 10% serum culture for each strain for serum‐free adaption and the 37°C culture for each strain for the temperature reduction, for example, lipid metabolism genes had higher expression for rCHO DP‐12 cells in 0% serum compared to 10% serum. Up, down, and dual arrows, represent upregulated, downregulated, and perturbed in both directions, respectively. Ext. CHO K1 represents external dataset GSE75094. Red shading indicates downregulated and green shading indicates upregulated relative to the 10% serum culture for each strain, or relative to the 37*C culture for each strain.
| Category | Sub‐category | KEGG pathway | Serum‐free adaptation | Temperature reduction | |||
|---|---|---|---|---|---|---|---|
|
CHO dhFr‐ |
rCHO DP‐12 |
Ext. CHO‐K1 |
rCHO DP‐12 |
CHO K1‐PF | |||
| Metabolism | Metabolism of other amino acids | Glutathione metabolism | ↑ | ↑ | ↑ | — | — |
| Lipid metabolism | Steroid biosynthesis | — | ↑ | ↑ | — | ↓ | |
| Amino acid metabolism | Valine, leucine & isoleucine degradation | — | ↑ | — | — | — | |
| Energy metabolism | Oxidative phosphorylation | — | ↑ | ↑ | — | — | |
| Global & overview maps | Carbon metabolism | ↓/↑ | ↓/↑ | — | — | — | |
| Carbohydrate metabolism | Citrate cycle (TCA cycle) | — | ↑ | — | — | — | |
| Environmental information processing | Signal transduction | PI3K‐Akt signaling pathway | — | ↓/↑ | ↓/↑ | — | — |
| Signaling molecules & interaction | ECM‐receptor interaction | — | ↓/↑ | ↓/↑ | — | — | |
| Signaling molecules & interaction | Cytokine‐cytokine receptor interaction | — | ↓/↑ | — | — | — | |
| Signal transduction | Rap1 signaling pathway | ↓ | ↓ | — | — | — | |
| Cellular processes | Cell motility | Regulation of actin cytoskeleton | — | ↓ | ↓/↑ | — | — |
| Cellular community—eukaryotes | Focal adhesion | ↓ | ↓ | — | — | — | |
| Cellular community—eukaryotes | Tight junction | ↓ | — | — | — | — | |
| Transport & catabolism | Lysosome | ↑ | — | — | — | ↑ | |
| Transport & catabolism | Peroxisome | ↑ | — | ↑ | — | — | |
| Cell growth & death | p53 signaling pathway | — | — | ↓/↑ | ↓/↑ | ||
| Cell growth & death | Cell cycle | ↓ | — | ↑ | ↓ | ↓ | |
| Genetic information processing | Replication & repair | DNA replication | — | — | ↑ | ↓ | ↓ |
| Replication & repair | Mismatch repair | — | — | — | ↓ | ↓ | |
| Transcription | Spliceosome | ↓ | — | ↑ | ↓ | ↓ | |
| Translation | Ribosome | ↓ | ↑ | — | — | — | |
| Translation | Ribosome biogenesis in eukaryotes | — | — | — | ↓ | ↓ | |
| Translation | Nucleocytoplasmic transport | ↓ | — | — | ↓ | ↓ | |
| Translation | mRNA surveillance pathway | ↓ | — | — | ↓ | ↓ | |
Cholesterol and other mevalonate derivatives play crucial roles in regulating membrane fluidity and permeability [47], mediating cell signaling pathways [48], and serving as precursors for the synthesis of bioactive molecules [49]. Cholesterol and other lipids are abundantly present in serum, transported within lipoproteins, which carry these hydrophobic molecules through circulation. Consequently, cells cultured in serum‐depleted medium must rely on de novo lipid synthesis to fulfill metabolic needs. Upregulation of lipogenic genes observed in this study aligns with prior microarray analyses in CHO‐K1 cells, where exogenous lipid supplementation accelerated adaptation to reduced‐serum conditions [8], as well as with studies demonstrating enhanced growth in serum‐free media following cholesterol supplementation [6]. Notably, activation of the mevalonate pathway—central to cholesterol biosynthesis—is also a hallmark of various aggressive cancer types [50, 51], which share metabolic features with CHO cells [52]. Collectively, these observations suggest that upregulation of the mevalonate pathway is likely critical for the adaptation to serum‐free medium and may represent a rational target for future cell line engineering efforts.
WGCNA was used to identify hub genes that could be manipulated to accelerate adaptation to serum‐free medium. The full network was subsetted with the 703 serum‐sensitive DEGs and highly connected first neighbors. A total of 35 hub genes were identified, many of which were clustered within the green, turquoise, and brown modules (Figures 3 and S6). In agreement with GO and KEGG pathway analysis, numerous hub genes were related to cholesterol biosynthesis and clustered within the turquoise module, including the genes encoding the two rate‐limiting enzymes, 3‐hydroxy‐3‐methylglutaryl‐CoA reductase (HMGCR) and squalene epoxidase (SQLE), as well as hydroxysteroid 17‐beta dehydrogenase 7 (HSD17B7). Others have demonstrated that upregulating HSD17B7 expression increases cholesterol biosynthesis in NS0 mouse myeloma cells, thus reverting the cholesterol auxotrophy [53]. Additionally, stearoyl‐CoA desaturase 2 (Scd2) was also identified as a hub gene. SCD2 catalyzes the rate‐limiting step in monounsaturated fatty acid synthesis, and its products serve as a source of energy, integral membrane components, and act as signaling molecules [54]. Interestingly, Scd2 had the absolute highest expression in the pre‐adapted CHO K1‐PF relative to all genes and all other cell lines (>300,000 normalized counts). Moreover, Scd2 was upregulated in rCHO DP‐12 and the external CHO‐K1, suggesting the elevated enzyme activity could be instrumental in adaptation to serum‐free medium.
While upregulating these lipogenic hub genes could enhance cholesterol biosynthesis, a more effective approach could be to target these genes’ transcriptional regulators, referred to as sterol regulatory element‐binding proteins (SREBPs). As known master regulators of cholesterol biosynthesis, sterol regulatory element binding transcription factor 2 (Srebf2) and insulin‐induced gene 1 (Insig1) were found to connect to many identified hub genes and thus were included in the serum‐free medium adaptation subnetwork. However, Srebf2 and Insig1 were not identified by the hub analysis. Srebf2, which encodes SREBP2, is the predominant isoform regulating cholesterol biosynthesis and was the highest expressed of the SREBP isoforms. Conversely, Insig1 is a negative regulator of the SREBP pathway, which prevents SREBP2 processing. While there are limited reports of genetic engineering of CHO cell lipid metabolism, overexpression of sterol regulatory element binding factor 1 (Srebf1) and stearoyl‐CoA desaturase 1 (Scd1) has been reported to enhance recombinant protein production via an expanded endoplasmic reticulum (ER) [55]. Alternatively, transcriptional inactivation of Insig1 via microRNA increased cholesterol synthesis and Golgi volume thereby improving product yield [56]. Importantly, these studies reported minimal cytotoxicity and increased cellular secretory capacity by overexpression of lipogenic genes, which resulted in enhanced titer yields.
The positive correlation between increased cholesterol biosynthesis, secretory capacity, and productivity could partly account for the faster adaptation of recombinant CHO cell lines to serum‐free medium compared to non‐recombinant CHO cell lines, irrespective of expression system [3, 4]. During the clonal selection process, the preferential isolation of high‐producing clones may indirectly favor clones with upregulated cholesterol biosynthesis and elevated secretory capacity. Furthermore, this correlation may be further extended to include glutathione metabolism, as increased glutathione pools have been previously correlated with high‐producing cell lines [57, 58]. A recent report suggests that cholesterol biosynthesis may be the missing link in this correlation due to its role in redox homeostasis and mitochondrial glutathione transport [59, 60]. Consistent with these findings, glutathione metabolism exhibited significant upregulation through serum‐free medium adaptation. Further, many of the glutathione synthesis genes predominantly clustered within the turquoise modules (Figure 3), similar to the cholesterol biosynthesis genes, and displayed significant interconnectivity to these lipogenic genes. Importantly, beyond a suitable target to accelerate serum‐free medium adaptation, overexpression of cholesterol biosynthesis pathways could improve product yields with minimal cell toxicity.
3.5. Glucose Effects on Transcriptome
The published glucose dataset documented relatively few genes with significant differences, with many considered not biologically relevant [28]. This dataset was included in the analysis to increase power for network construction and provide comprehensive understanding of global gene expression changes. Notably, the salmon and midnightblue modules with only 41 and 33 genes, respectively, had higher expression for both glucose conditions relative to the other conditions (Figure 3). Due to the high glucose concentration (6 g/L) in CD CHO media, it was diluted with DMEM with 10% Cell‐Ess serum replacement, a protein free, serum‐free media additive, to allow for a low initial glucose concentration (2 g/L). The differences in ME expressions between the glucose conditions and all other conditions within these two modules was likely due to the different media and the serum‐replacement supplement. Both modules contained genes that predominantly localize to the plasma membrane and are associated with cell‐adhesion, transcription regulation, growth factor response, and signaling cascades such as the ERK1/2 cascade. These GO terms are consistent with the expected transcriptional changes by serum‐free medium adaptation, suggesting the serum replacement has an impact on the transcriptome, albeit to a minimal extent.
3.6. Temperature and pH Effects on Gene Expression
In this study, both rCHO DP‐12 and CHO K1‐PF were cultured in a two‐level factorial design with two levels for temperature (37°C and 33°C) and two levels for pH (pH 6.95 and 6.70). Due to sample preparation issues, the CHO K1‐PF samples at 37°C and pH 6.70 were discarded. Additionally, culture pH was shown to have a negligible impact by PCA. Thus, samples were combined to remove pH as a factor, resulting in four conditions: rCHO DP‐12 at 37°C and 33°C (N = 4 each), and CHO K1‐PF at 37°C (N = 2) and 33°C (N = 4).
A total of 954 unique DEGs were identified as temperature‐sensitive in either cell line with 181 genes significant in both CHO K1‐PF and rCHO DP‐12 (FDR ≤ 0.01; |FC| ≥ 1.5) (Figure S7). Consistent with the PCA plot, the CHO K1‐PF cell line had a greater number of DEGs compared to the rCHO DP‐12 cell line, suggesting a higher sensitivity to temperature reduction. Moreover, the majority of these DEGs had upregulated expression in the mildly hypothermic conditions as shown by the MA plots (Figure S8), likely from increased mRNA stability.
Temperature downshifts are commonly employed in bioprocessing to enhance product yields and prolong the stationary phase, primarily through cell cycle arrest in the G0/G1 phase [61, 62]. Consistent with these reports and the observed decrease in growth rates, GO analysis of temperature‐sensitive DEGs returned numerous cell‐cycle related GO terms such as cell division (GO:0051301), chromosome segregation (GO:0007059), and DNA replication (GO:0006260) (q ≤ 0.001) (Table S4). Additionally, sterol (GO:0016126) and cholesterol biosynthesis (GO:0006695) were significantly downregulated and clustered within the turquoise module (Figure 3). Consistent with the observed GO terms, numerous KEGG pathways related to genetic information processing were downregulated in both cell lines (Table 1). These include cell cycle, DNA replication, and ribosome biogenesis in eukaryotes (q ≤ 10−4). Notably, the p53 signaling pathway was found to be significantly perturbed, with many of the p53 target genes upregulated and clustered within the yellow module (Figure 3). This aligns with multiple reports across various mammalian cell lines, which attribute cell cycle arrest under mild hypothermia to p53 activation via the ATR–p53–p21 signaling pathway [63, 64, 65]. As expected, the tumor protein 53 gene (Tp53) encoding the p53 protein did not exhibit differential expression [14], as p53 activation is primarily regulated post‐transcriptionally. However, its transcriptional target gene, tumor protein 53‐induced nuclear protein 1 (Tp53inp1), displayed a 9‐fold increase in expression in both cell lines. TP53INP1 has been shown to lead to cell cycle arrest in G1 by enhancing the transcriptional activity and protein stability of p53 [66, 67]. These findings collectively suggest both cell lines underwent partial G0/G1 phase arrest via p53 activation due to reduced culture temperatures, in agreement with previous reports [14, 65].
Finally, WGCNA was used to identify hub genes that may be key mediators of cell cycle suppression in response to reduced culture temperatures. The tightly orchestrated network of activators and inhibitors within the cell cycle makes it an ideal candidate for WGCNA. To isolate key mediators and upstream regulators, the gene co‐expression network was first subsetted with the 181 overlapping temperature‐sensitive DEGs and highly connected first neighbors. A total of 23 unique hub genes were identified between the top 10 hub genes of the subnetwork and 2 MCODE clusters, many of which were clustered within the yellow and pink modules (Figure S9). Notably, hub analysis identified the p53 target genes, B‐cell translocation gene anti‐proliferation factor 2 (Btg2) and zinc finger matrin‐type 3 (Zmat3). Btg2 was upregulated 3‐fold in rCHO DP‐12 and 20‐fold in CHO K1‐PF. This anti‐proliferation gene has been demonstrated to inhibit G1/S and G2/M transition through downregulation of cyclin D1 and cyclin E [68, 69, 70]. Interestingly, Btg2 was identified as the most upstream hub gene by the yFiles hierarchical layout in Cytoscape, consistent with its role as an instantaneous early response gene. Finally, Zmat3 demonstrated a 3‐fold and 5‐fold upregulation in rCHO DP‐12 and CHO K1‐PF, respectively. ZMAT3 regulates alternative splicing and controls p53 regulators, including the p53 inhibitors MDM4 and MDM2 [71]. As an important tumor suppressor, ZMAT3 expression alone has been demonstrated to be sufficient to inhibit proliferation in p53‐deficient cells [72].
3.7. Impact to Recombinant Gene Expression
The rCHO DP‐12 clone produces the recombinant anti‐IL8 mAb with a documented low cell specific productivity rate (qP) of 1.2 pg/cell/day [73]; therefore, antibody quantification was not feasible at the RNA harvest timepoints. However, others have demonstrated a direct correlation between titer yields and mRNA expression of the heavy and light chains, providing an indicator for estimating productivity changes [11]. Therefore, the anti‐IL8 heavy and light chain expression changes were analyzed for the rCHO DP‐12 cultures. Relatively high mean expression levels were observed in the heavy chain sequence (44,134 counts) and the light chain sequence (75,169 counts) as the 12th and 2nd highest expressed transcripts in rCHO DP‐12, respectively (Figure 4). Both the light and heavy chain transcripts were significantly increased from 10% to 5% serum adaptation (FDR ≤ 0.01, |FC| ≥ 1.5) and remained high in all serum‐free rCHO DP‐12 cultures relative to rCHO DP‐12 in 10% serum. This suggested serum removal enhanced productivity, contrary to previous reports [74], and that high producing subpopulations were not “washed out” through serum‐free adaptation [75, 76]. The anti‐IL8 heavy and light chain transcripts were not significantly different between other conditions, including by reduced culture temperatures (FDR > 0.01). While the unchanged product gene expression at 33°C is consistent with others, mild hypothermia has also been reported to enhance recombinant product transcription and qP [12, 16, 62, 77]. These mixed reports on the productivity response to temperature have been demonstrated to be product and cell line specific [61].
FIGURE 4.
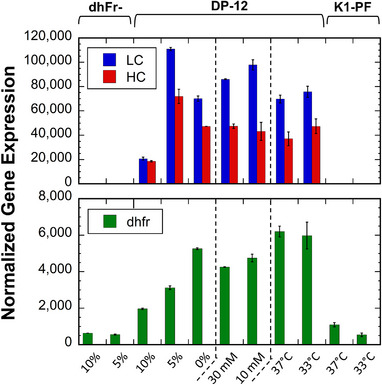
Relative gene expression levels for the product genes and the selection gene. Normalized counts of the transfected heavy chain (HC), light chain (LC), and dhfr genes in the rCHO DP‐12 clone, shown for the three CHO cell lines across the 11 unique conditions. Dashed lines delineate the serum adaptation, glucose, and temperature datasets, respectively. Error bars represent standard deviation of biological replicates (N = 2).
The transfected gene cassette included a functional copy of dhfr. In rCHO DP‐12, dhfr expression was significantly higher for the serum‐free culture compared to the 10% serum culture (FDR ≤ 0.01, |FC| ≥ 1.5) (Figure 4). Additionally, >2‐fold increase in dhfr was observed in the external CHO‐K1 dataset, suggesting upregulation of the DHFR pathway may be required for serum‐free medium adaption [9]. CHO dhFr‐, the parental host cell line of rCHO DP‐12, carries a deletion on one allele of the wild‐type dhfr and a point mutation on the other [6]. As expected, CHO dhFr‐ exhibited the lowest dhfr expression of all the 37°C cultures; however, its expression was comparable to that of CHO K1‐PF cultures at 33°C. CHO K1‐PF, which contains two functional copies of the wild‐type dhfr, had significantly lower dhfr gene expression at 33°C (FDR ≤ 0.01, |FC| ≥ 1.5).
3.8. Failure to Adapt CHO dhFr‐
The CHO dhFr‐ cell line may exhibit sensitivity to serum‐withdrawal due to the abrogation of the dhfr gene. While some groups have successfully adapted these cells to serum‐free medium [6], others have observed reversion of CHO dhFr‐ cells back to dhFr+ even with sufficient hypoxanthine and thymidine (HT) supplementation [78, 79]. In a more recent study, it was found that HT supplementation alone was insufficient in fully restoring the growth of the parental CHO dhFr‐ culture to match that of the recombinant clone in serum‐free media [80]. However, reintroducing a functional copy of dhfr in CHO dhFr‐ produced comparable growth rates in a dose‐dependent manner. Gandor et al. [78] hypothesized that certain DHFR‐dependent intermediates present in complete serum, particularly N‐formylmethionine, may be critical for supporting the growth and survival of CHO dhFr‐ in serum‐depleted medium [78]. These results suggest HT is required but not sufficient to support growth. Notably, the purple module demonstrated significant downregulation and lower base expression values in CHO dhFr‐ in regulation of purine biosynthesis (GO:0009168) and phosphatidylinositol metabolism (GO:0046488) (Figure 3).
Most notably, CHO dhFr‐ had lower expression of mevalonate pathway genes relative to the successfully serum‐free adapted cell lines, suggesting de novo lipid synthesis is critical for serum‐free medium adaptation. Cholesterol and other mevalonate derivatives provide critical metabolites for cell proliferation, and inhibition of cholesterol synthesis has been reported to abrogate proliferation [49]. The well‐established crosstalk between the cell cycle and cholesterol biosynthesis is largely mediated by p53, as p53 has been reported to suppress the mevalonate pathway by inhibiting SREBP2 maturation [49, 81]. Accordingly, substantial overlap was observed between temperature reduction, particularly within CHO K1‐PF, and the adaptation of CHO dhFr‐ to 5% serum, suggesting similar cell cycle suppression mechanisms. Specifically, cell cycle genes and numerous genetic information processing KEGG pathways were similarly downregulated (Table 1), and similar expression changes were observed in the pink, black, and purple modules (Figure 3). Moreover, lipogenic gene expression was comparable between CHO K1‐PF at 33°C and CHO dhFr‐ as shown within the turquoise module. Collectively, it remains unclear whether CHO dhFr‐ was unable to adapt below 5% serum due to the lack of dhfr, insufficient lipogenic gene expression, or a combination thereof. Interestingly, others have reported both HT and lipid supplementation in combination could accelerate adaption in CHO‐K1 suggesting both may be required [8].
3.9. Glycosylation Gene Expression Changes
3.9.1. Serum‐Free Medium Adaptation
The 2072 serum‐ and 954 temperature‐sensitive DEGs were cross‐referenced to 371 known glycosylation genes to evaluate the potential impact on product quality [20, 82]. Several studies have documented the impact of serum‐free medium adaptation on the glycosylation patterns of recombinant proteins [83, 84]. However, changes in glycosylation gene expression have not been explored in CHO cell cultures. A total of 32 glycosylation genes were differentially expressed due to serum‐free medium adaptation. Twelve of these glycosylation genes only alter the sugar moieties on proteoglycans and glycosaminoglycans and thus are not likely to impact protein glycosylation patterns of a mAb. The remaining 20 glycosylation genes could be considered more industrially relevant for glycoproteins and mAb. Notably, sialylation‐related genes (Neu2, St3gal2, St3gal3, St6galnac6) and fucosylation‐related genes (Fuca1, Fut8, Pofut2) were differentially expressed (Table 2) due to serum‐free adaptation.
TABLE 2.
Glycosylation genes with differential expression that were sensitive to the serum concentration and/or temperature that directly impact critical product quality attributes for recombinant glycoproteins. Fold change (FC) is the gene expression ratio for conditions in brackets, for example, Gbgt1 had 1.8‐fold higher expression for rCHO DP‐12 cells at 33°C compared to 37°C. Blue indicates higher expression and red indicates lower expression for the pair of conditions. FC values denote significant differential expression (FDR ≤ 0.01; |FC| ≥ 1.5). Blanks indicate the FC observed was not significant for the pair of conditions.
| CHO strain | |||||||
|---|---|---|---|---|---|---|---|
| (Serum/Serum) or (Temperature/Temperature) | |||||||
| Gene symbols | Gene family | dhFr‐ | DP‐12 [5/10] | DP‐12 [0/5] | DP‐12 [0/10] | DP‐12 [33/37] | K1‐PF [33/37] |
| [5/10] | |||||||
| Fold change (FC) | |||||||
| Alg6 | Glucosyltransferases | 1.2 | 1.8 | 1.3 | 2.3 | −1.2 | −1.2 |
| Alg8 | Glucosyltransferases | 1.2 | 1.3 | 1.2 | 1.6 | −1.3 | 1.8 |
| Cmah | Sialic acid biosynthesis | −1.8 | −9.5 | — | −9.1 | −2.0 | 1.5 |
| Cmas | Nucleotide Synthesis | −1.5 | −3.0 | −1.4 | −4.3 | −1.1 | −1.1 |
| Fuca1 | Fucosidases | −1.3 | −2.4 | −1.1 | −2.5 | — | 1.6 |
| Fut8 | Fucosyltransferases | −1.4 | −1.4 | −2.0 | −2.8 | 1.2 | 1.1 |
| Galnt1 | GalNAc‐transferases | −1.3 | −4.5 | −1.3 | −5.7 | — | −1.1 |
| Galnt10 | GalNAc‐transferases | 1.2 | 1.2 | 1.9 | 2.2 | — | −1.2 |
| Galnt7 | GalNAc‐transferases | −1.2 | 1.2 | 2.2 | 2.6 | 1.8 | 1.3 |
| Gbgt1 | GalNAc‐transferases | 1.9 | — | 1.2 | 1.3 | 1.5 | 2.7 |
| Hk1 | Nucleotide Synthesis | −1.4 | −1.4 | −1.3 | −1.8 | 1.1 | — |
| Hk2 | Nucleotide Synthesis | 1.1 | — | −2.9 | −3 | −1.7 | −1.2 |
| Man1a2 | Mannosidase | −1.3 | −1.4 | −1.9 | −2.6 | — | −1.1 |
| Man2b2 | Mannosidase | 1.3 | — | −1.2 | −1.2 | 1.6 | 1.9 |
| Naga | Lysosomal Enzymes | 2.0 | 1.1 | −1.3 | −1.2 | 1.6 | 1.6 |
| Nagpa | Lysosomal Enzymes | −1.1 | −1.6 | −1.7 | −2.7 | — | −1.2 |
| Neu1 | Sialidases | 1.8 | −1.5 | — | −1.6 | 1.7 | 2.3 |
| Neu2 | Sialidases | −3.6 | −9.9 | −30 | −295 | −3.6 | −3.2 |
| Pofut2 | Fucosyltransferases | — | −1.3 | −1.4 | −1.9 | −1.1 | 1.1 |
| Slc35a3 | Nuc. Sugars Transporters | −1.7 | −1.6 | −1.7 | −2.7 | −1.2 | −1.1 |
| Slc35d1 | Nuc. Sugars Transporters | — | 1.2 | −1.3 | −1.1 | 2.0 | 1.9 |
| Slc35d2 | Nuc. Sugars Transporters | 1.6 | −1.2 | 1.1 | −1.1 | 2.0 | 3.4 |
| St3gal2 | Sialyltransferases | −1.3 | −1.7 | −1.3 | −2.2 | 1.3 | 1.4 |
| St3gal3 | Sialyltransferases | 1.6 | 1.4 | 1.5 | 2.1 | 1.4 | 1.4 |
| St6galnac6 | Sialyltransferases | 1.6 | 1.2 | 1.8 | 2.2 | 1.1 | 1.3 |
| Uggt2 | Glucosyltransferases | 1.1 | 1.2 | −2.2 | −1.8 | 1.9 | 2.1 |
| Ugp2 | Nucleotide Synthesis | 1.6 | 1.2 | 1.8 | 2.2 | 1.3 | 1.2 |
The sialidase gene, Neu2, encodes an enzyme that cleaves sialic acid residues from glycoproteins [85], and its expression was significantly decreased 300‐fold through serum‐free medium adaptation in rCHO DP‐12. Moreover, the expression levels of the sialyltransferase genes, St3gal3 and St6galnac6, increased during the adaptation process, whereas St3gal2 levels decreased. Sialyltransferases attach terminal sialic acid monosaccharides to galactose in α2,3‐, α2,6‐, or α2,8‐linkages, thus increase total sialic acid content [86]. The presence of terminal sialic acids can improve the half‐life and efficacy of glycoproteins and can promote an anti‐inflammatory response [87, 88]. Collectively, the overall increase in sialyltransferase gene expression and significant decrease in Neu2 expression during serum‐adaptation, could improve the sialylation of the protein. Studies have reported increase in sialylation under serum‐free medium conditions [84, 89].
Additionally, the fucosylation‐related genes, Fuca1, Fut8, and Pofut2, all decreased expression through the adaptation process. Notably, the lack of core fucose in antibodies has been observed to enhance efficacy through antibody‐dependent cell‐mediated cytotoxicity (ADCC) [90]. The decrease in expression of the fucosyltransferases, Fut8 and Pofut2, could potentially lead to decreased or absent fucose residues on the glycoprotein, but the decrease in expression of the fucosidase, Fuca1, may negate this outcome. Others have observed the lowest, and therefore most favorable, levels of core fucose generally occurred within the intermediate stages of serum‐free medium adaptation; yet, these changes were lost in the final stages of adaptation [83]. Other potentially bioprocess‐relevant glycosylation families include genes responsible for nucleotide synthesis and transport (Hk1, Hk2, Ugp2, Slc35a3), O‐linked GalNAc transferases (Galnt1, Galnt7, Galnt10), cleavage of GalNAc residues (Naga, Nagpa), glucosyltransferase (Alg6), and mannosylation (Man1a2) are shown in Table S5.
3.9.2. Temperature Reduction
Reducing the culture temperature has been observed to improve product quality, particularly the glycosylation profiles, of recombinant proteins [12, 14, 91]. A total of 19 glycosylation genes were temperature‐sensitive (Table S5); however, only nine of these genes are likely to impact mAb glycosylation (Table 2). These include the sialidase genes (Neu1, Neu2), solute carrier family members (Slc35d1, Slc35d2), and glucosyltransferase gene (Uggt2). Of these, Neu2, Slc35d1, and Uggt2 were differentially expressed in both cell lines (FDR ≤ 0.01; |FC| ≥ 1.5).
At 33°C, Neu2 had significantly lower expression in both cell lines, while Neu1 only had significantly higher expression in CHO K1‐PF. Neu3 increased expression in both cell lines due to the temperature decrease, though this change was not statistically significant by this fold change criterion. Neu4 was not expressed. Conversely, others have observed Neu1 and Neu2 as upregulated through temperature reduction [14]. These enzymes reportedly have lower activity at reduced temperatures [77], potentially confounding the direct correlation of sialylation‐related gene expression and terminal sialic acid content. The literature has mixed reports of increased [12, 91], decreased [11, 77], or unchanged [11] sialylation of recombinant glycoproteins resulting from reduced culture temperatures.
Additionally, mild hypothermia resulted in the overexpression of Slc35d1 in both cell lines and Slc35d2 in CHO K1‐PF. Slc35d1 and Slc35d2 encode nucleotide sugar transporters, which transport numerous nucleotide substrates for glycosylation into the endoplasmic reticulum (ER) and Golgi [92, 93]. The overexpression of SLC35D1 in yeast cells has been demonstrated to increase the intracellular nucleotide sugar pools [93] and reproducibly increase galactose incorporation in an IgG produced in CHO cells [94]. This is in agreement with the documented increase in galactosylation levels at sub‐physiological culture temperatures [95].
Finally, Uggt2 was upregulated nearly 2‐fold in both cell lines. Its paralog, Uggt1, exhibited approximately 10‐fold higher expression; however, it did not show differential expression in this study, although it has been reported to be downregulated elsewhere [14]. These enzymes are reportedly central gatekeepers for ER quality control of glycoproteins [96], but impact on mAb glycosylation and temperature response remain unclear. Both Galnt7 and Neu2 were differentially expressed in the serum‐adaptation and temperature study, suggesting these genes may have higher sensitivity to media and process changes.
3.10. Newly Identified CHO Cell Housekeeping Genes
Quantitative RT‐qPCR is a commonly used method for gene expression analysis due to its sensitivity and accuracy; however, accurate interpretation of RT‐qPCR requires normalization using reference genes, which are typically housekeeping genes (HKGs). These HKGs can vary in suitability between experiments, and inappropriate selection can lead to misleading conclusions. Hence, an ideal candidate reference gene has moderately high expression and low variability between experimental conditions, media types, treatments, and cell lines [24]. Since there are no universally applicable reference genes, this study aimed to identify reliable HKGs for CHO cell research by analyzing gene expression data from three CHO cell lines under the examined conditions. Genes were ranked by maximum fold change multiplied by the coefficient of variation (MFC‐CV) from least to greatest. Ten candidate housekeeping genes (HKGs) were identified, exhibiting significantly lower variations compared to 11 traditionally used HKGs [from Qiagen (https://www.qiagen.com/us/resources/)] and 18 HKGs previously reported for CHO cells (Figure 5) [24, 97–99]. Since all RNA samples were obtained from mid‐exponential cultures with sufficient glucose and non‐inhibitory lactate levels, these HKG might have limited utility under highly stressful cell culture conditions [24, 95]. Nonetheless, these 10 newly identified HKGs correspond to proteins with diverse functions and minimal co‐regulation and thus may be stable across many conditions beyond the datasets used in this work (Table S6).
FIGURE 5.
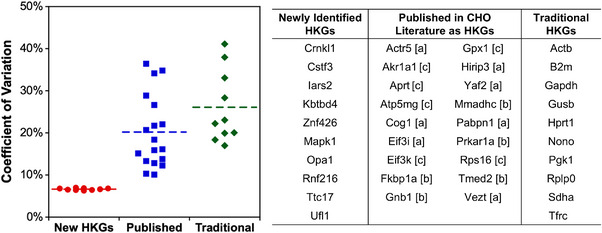
Identification of new housekeeping genes for CHO cells. The coefficient of variation (CV) of gene expression was compared across the 14 conditions. Dashed lines represent average CV. Ten newly identified genes (red circles) had significantly lower CV than previously identified genes in the CHO cell literature (blue squares) or traditional (green diamonds) housekeeping genes (HKGs) within this dataset. (a) Bahr et al. [98], (b) Brown et al. [99], and (c) Ma et al. [97].
4. Conclusion
RNA‐seq offers a powerful approach to understand intracellular responses to process changes. Herein, the transcriptomes of multiple CHO cell lines were combined to understand the transcriptional changes of serum‐free medium adaptation, temperature reduction, low pH, and low glucose. The analysis indicated lipogenic gene expression, specifically cholesterol biosynthesis and the mevalonate pathway, could be critical for serum‐free adaptation. Hub genes identified by WGCNA indicated the rate‐limiting enzymes HMGCR and SQLE, and the transcriptional regulators of the SREBP pathway, Srebf2 and Insig1, as candidate targets to accelerate serum‐free medium adaptation. However, this study did not experimentally validate these associations. Direct manipulation of these candidate genes through genetic editing (e.g., CRISPR‐mediated knockout or overexpression) would be required to conclusively determine their causal roles in serum‐free adaptation. Conversely, the temperature‐induced cell cycle suppression was likely mediated by p53 activation, consistent with previous reports, with Zmat3 and Btg2 identified as key hub genes. Finally, 10 newly identified HKG were identified that could improve RT‐qPCR analysis of CHO cell cultures. Overall, this global investigation provides potential gene engineering targets that could accelerate serum‐free medium adaptation or regulate the cell cycle.
Author Contributions
Benjamin F. Synoground: conceptualization (equal); data curation (equal); formal analysis (lead); writing ‐ original draft (lead). Yogender Gowtham: conceptualization (equal); data curation (equal); investigation (lead); methodology (lead); visualization (lead); writing – review and editing (equal). Timothy Lindquist: data curation (supporting); formal analysis (supporting); methodology (supporting); visualization (equal); writing ‐ review and editing (supporting). Junessa Pressley: data curation (supporting), formal analysis (supporting), methodology (supporting), visualization (supporting), writing – review & editing (supporting). Derrick C. Scott: conceptualization (supporting), project administration (supporting), writing ‐ review & editing (supporting). Christopher S. Saski: conceptualization (equal), data curation (equal), formal analysis (equal), investigation (equal), methodology (equal), supervision (supporting), visualization (lead), writing ‐ original draft (supporting). Sarah W. Harcum: conceptualization (equal), funding acquisition (lead), supervision (lead), writing ‐ review & editing (lead).
Conflicts of Interest
The authors declare no conflicts of interest.
Supporting information
Supporting File 1: biot70055‐sup‐0001‐SuppMat.pdf.
Acknowledgments
This work was supported by the US National Science Foundation grants CBET‐1218345, OIA‐1736123, IIP‐1624641, and EEC‐2100442. We would like to acknowledge Clemson University for generous allotment of computational resources on the Palmetto cluster. The authors thank Dr. Rooksana Noorai and Dr. Vijay Shankar for their bioinformatics expertise.
Funding: This work was supported by the US National Science Foundation grants CBET‐1218345, OIA‐1736123, IIP‐1624641, and EEC‐2100442.
Contributor Information
Christopher S. Saski, Email: saski@clemson.edu.
Sarah W. Harcum, Email: harcum@clemson.edu.
Data Availability Statement
The data that support the findings of this study are available from the corresponding author upon reasonable request.
References
- 1. Walsh G. and Walsh E., “Biopharmaceutical Benchmarks 2022,” Nature Biotechnology 40 (2022): 1722–1760. [DOI] [PMC free article] [PubMed] [Google Scholar]
- 2. Dahodwala H. and Lee K. H., “The Fickle CHO: A Review of the Causes, Implications, and Potential Alleviation of the CHO Cell Line Instability Problem,” Current Opinion in Biotechnology 60 (2019): 128–137. [DOI] [PubMed] [Google Scholar]
- 3. Lim U. M., Yap M. G. S., Lim Y. P., Goh L.‐T., and Ng S. K., “Identification of Autocrine Growth Factors Secreted by CHO Cells for Applications in Single‐Cell Cloning Media,” Journal of Proteome Research 12 (2013): 3496–3510. [DOI] [PubMed] [Google Scholar]
- 4. Baik J. Y., Ha T. K., Kim Y. H., and Lee G. M., “Proteomic Understanding of Intracellular Responses of Recombinant Chinese Hamster Ovary Cells Adapted to Grow in Serum‐Free Suspension Culture,” Biotechnology Progress 27 (2011): 1680–1688. [Google Scholar]
- 5. Rodrigues M. E., Costa A. R., Henriques M., et al., “Advances and Drawbacks of the Adaptation to Serum‐Free Culture of CHO‐K1 Cells for Monoclonal Antibody Production,” Applied Biochemistry and Biotechnology 169 (2013): 1279–1291. [DOI] [PubMed] [Google Scholar]
- 6. Sinacore M. S., Drapeau D., and Adamson S., “Adaptation of Mammalian Cells to Growth in Serum‐Free Media,” Molecular Biotechnology 15 (2000): 249–257. [DOI] [PubMed] [Google Scholar]
- 7. Schroder M., Matischak K., and Friedl P., “Serum‐ and Protein‐Free Media Formulations for the Chinese Hamster Ovary Cell Line DUKXB11,” Journal of Biotechnology 108 (2004): 279–292. [DOI] [PubMed] [Google Scholar]
- 8. Wu S., Rish A. J., Skomo A., et al., “Rapid Serum‐Free/Suspension Adaptation: Medium Development Using a Definitive Screening Design for Chinese Hamster Ovary Cells,” Biotechnology Progress 37 (2021): 3154. [DOI] [PubMed] [Google Scholar]
- 9. Shridhar S., Klanert G., Auer N., et al., “Transcriptomic Changes in CHO Cells After Adaptation to Suspension Growth in Protein‐Free Medium Analysed by a Species‐Specific Microarray,” Journal of Biotechnology 257 (2017): 13–21. [DOI] [PubMed] [Google Scholar]
- 10. Lee N., Shin J., Park J. H., et al., “Targeted Gene Deletion Using DNA‐Free RNA‐Guided Cas9 Nuclease Accelerates Adaptation of CHO Cells to Suspension Culture,” ACS Synthetic Biology 5 (2016): 1211–1219. [DOI] [PubMed] [Google Scholar]
- 11. Dai X., Miao Y., Han P., et al., “PABPC1 Enables Cells With the Suspension Cultivation Feature,” ACS Synthetic Biology 10 (2021): 309–317. [DOI] [PubMed] [Google Scholar]
- 12. Trummer E., Fauland K., Seidinger S., et al., “Process Parameter Shifting: Part I. Effect of DOT, pH, and Temperature on the Performance of Epo‐Fc Expressing CHO Cells Cultivated in Controlled Batch Bioreactors,” Biotechnology and Bioengineering 94 (2006): 1033–1044. [DOI] [PubMed] [Google Scholar]
- 13. Rodriguez J., Spearman M., Tharmalingam T., et al., “High Productivity of Human Recombinant Beta‐Interferon From a Low‐Temperature Perfusion Culture,” Journal of Biotechnology 150 (2010): 509–518. [DOI] [PubMed] [Google Scholar]
- 14. Bollati‐Fogolin M., Forno G., Nimtz M., et al., “Temperature Reduction in Cultures of hGM‐CSF‐Expressing CHO Cells: Effect on Productivity and Product Quality,” Biotechnology Progress 21 (2005): 17–21. [DOI] [PubMed] [Google Scholar]
- 15. Bedoya‐Lopez A., Estrada K., Sanchez‐Flores A., et al., “Effect of Temperature Downshift on the Transcriptomic Responses of Chinese Hamster Ovary Cells Using Recombinant Human Tissue Plasminogen Activator Production Culture,” PLoS ONE 11 (2016), 10.1371/journal.pone.0151529. [DOI] [PMC free article] [PubMed] [Google Scholar]
- 16. Fomina‐Yadlin D., Mujacic M., Maggiora K., et al., “Transcriptome Analysis of a CHO Cell Line Expressing a Recombinant Therapeutic Protein Treated With Inducers of Protein Expression,” Journal of Biotechnology 212 (2015): 106–115. [DOI] [PubMed] [Google Scholar]
- 17. Kantardjieff A., Jacob N. M., Yee J. C., et al., “Transcriptome and Proteome Analysis of Chinese Hamster Ovary Cells Under Low Temperature and Butyrate Treatment,” Journal of Biotechnology 145 (2010): 143–159. [DOI] [PubMed] [Google Scholar]
- 18. Borys M. C., Linzer D. I., and Papoutsakis E. T., “Culture pH Affects Expression Rates and Glycosylation of Recombinant Mouse Placental Lactogen Proteins by Chinese Hamster Ovary (CHO) Cells,” Bio/Technology 11 (1993): 720–724. [DOI] [PubMed] [Google Scholar]
- 19. Gagnon M., Hiller G., Luan Y. T., et al., “High‐End pH‐Controlled Delivery of Glucose Effectively Suppresses Lactate Accumulation in CHO Fed‐Batch Cultures,” Biotechnology and Bioengineering 108 (2011): 1328–1337. [DOI] [PubMed] [Google Scholar]
- 20. Matthews T. E., Berry B. N., Smelko J., et al., “Closed Loop Control of Lactate Concentration in Mammalian Cell Culture by Raman Spectroscopy Leads to Improved Cell Density, Viability, and Biopharmaceutical Protein Production,” Biotechnology and Bioengineering 113 (2016): 2416–2424. [DOI] [PubMed] [Google Scholar]
- 21. Xu X., Nagarajan H., Lewis N. E., et al., “The Genomic Sequence of the Chinese Hamster Ovary (CHO)‐K1 Cell Line,” Nature Biotechnology 29 (2011): 735–741. [DOI] [PMC free article] [PubMed] [Google Scholar]
- 22. Marioni J. C., Mason C. E., Mane S. M., Stephens M., and Gilad Y., “RNA‐Seq: An Assessment of Technical Reproducibility and Comparison With Gene Expression Arrays,” Genome Research 18 (2008): 1509–1517. [DOI] [PMC free article] [PubMed] [Google Scholar]
- 23. Fu X., Fu N., Guo S., et al., “Estimating Accuracy of RNA‐Seq and Microarrays With Proteomics,” BMC Genomics 10 (2009): 1–9. [DOI] [PMC free article] [PubMed] [Google Scholar]
- 24. Tzani I., Herrmann N., Carillo S., et al., “Tracing Production Instability in a Clonally Derived CHO Cell Line Using Single‐Cell Transcriptomics,” Biotechnology and Bioengineering 118 (2021): 2016–2030. [DOI] [PubMed] [Google Scholar]
- 25. Clarke C., Doolan P., Barron N., et al., “Large Scale Microarray Profiling and Coexpression Network Analysis of CHO Cells Identifies Transcriptional Modules Associated With Growth and Productivity,” Journal of Biotechnology 155 (2011): 350–359. [DOI] [PubMed] [Google Scholar]
- 26. Novak N., Baumann M., Friss A., et al., “LncRNA Analysis of mAb Producing CHO Clones Reveals Marker and Engineering Potential,” Metabolic Engineering 78 (2023): 26–40. [DOI] [PubMed] [Google Scholar]
- 27. Puck T. T., Cieciura S. J., and Robinson A., “Genetics of Somatic Mammalian Cells. III. Long‐Term Cultivation of Euploid Cells From Human and Animal Subjects,” Journal of Experimental Medicine 108 (1958): 945–956. [DOI] [PMC free article] [PubMed] [Google Scholar]
- 28. Gowtham Y. K., Saski C. A., and Harcum S. W., “Low Glucose Concentrations Within Typical Industrial Operating Conditions Have Minimal Effect on the Transcriptome of Recombinant CHO Cells,” Biotechnology Progress 33 (2017): 771–785. [DOI] [PubMed] [Google Scholar]
- 29. Bolger A. M., Lohse M., and Usadel B., “Trimmomatic: A Flexible Trimmer for Illumina Sequence Data,” Bioinformatics 30 (2014): 2114–2120. [DOI] [PMC free article] [PubMed] [Google Scholar]
- 30. Dobin A., Davis C. A., Schlesinger F., et al., “STAR: Ultrafast Universal RNA‐Seq Aligner,” Bioinformatics 29 (2013): 15–21. [DOI] [PMC free article] [PubMed] [Google Scholar]
- 31. Hilliard W., MacDonald M. L., and Lee K. H., “Chromosome‐Scale Scaffolds for the Chinese Hamster Reference Genome Assembly to Facilitate the Study of the CHO Epigenome,” Biotechnology and Bioengineering 117 (2020): 2331–2339. [DOI] [PubMed] [Google Scholar]
- 32. Gonzalez T. N., Leong S. R., Presta L. G., and Patents G., Humanized anti‐IL‐8 Monoclonal Antibodies, US Patent 6, 117, 980, Current Assignee: Genentech Inc (2000).
- 33. Li H., Handsaker B., Wysoker A., et al., “The Sequence Alignment/Map Format and SAMtools,” Bioinformatics 25 (2009): 2078–2079. [DOI] [PMC free article] [PubMed] [Google Scholar]
- 34. Anders S., Pyl P. T., and Huber W., “HTSeq—A Python Framework to Work With High‐Throughput Sequencing Data,” Bioinformatics 31 (2015): 166–169. [DOI] [PMC free article] [PubMed] [Google Scholar]
- 35. Love M. I., Huber W., and Anders S., “Moderated Estimation of Fold Change and Dispersion for RNA‐Seq Data With DESeq2,” Genome Biology 15 (2014): 550. [DOI] [PMC free article] [PubMed] [Google Scholar]
- 36. Leek J. T., Johnson W. E., Parker H. S., Jaffe A. E., and Storey J. D., “The sva Package for Removing Batch Effects and Other Unwanted Variation in High‐Throughput Experiments,” Bioinformatics 28 (2012): 882–883. [DOI] [PMC free article] [PubMed] [Google Scholar]
- 37. Stephens M., “False Discovery Rates: A New Deal,” Biostatistics (Oxford, England) 18 (2017): 275–294. [DOI] [PMC free article] [PubMed] [Google Scholar]
- 38. Young M. D., Wakefield M. J., Smyth G. K., and Oshlack A., “Gene Ontology Analysis for RNA‐Seq: Accounting for Selection Bias,” Genome Biology 11 (2010): R14. [DOI] [PMC free article] [PubMed] [Google Scholar]
- 39. Kremkow B. G., Baik J. Y., MacDonald M. L., and Lee K. H., “CHOgenome.org 2.0: Genome Resources and Website Updates,” Biotechnology Journal 10 (2015): 931–938. [DOI] [PubMed] [Google Scholar]
- 40. Supek F., Bošnjak M., Škunca N., and Šmuc T., “REVIGO Summarizes and Visualizes Long Lists of Gene Ontology Terms,” PLoS ONE 6 (2011): 21800. [DOI] [PMC free article] [PubMed] [Google Scholar]
- 41. Luo W., Friedman M. S., Shedden K., Hankenson K. D., and Woolf P. J., “GAGE: Generally Applicable Gene Set Enrichment for Pathway Analysis,” BMC Bioinformatics 10 (2009): 161. [DOI] [PMC free article] [PubMed] [Google Scholar]
- 42. Langfelder P. and Horvath S., “WGCNA: An R Package for Weighted Correlation Network Analysis,” BMC Bioinformatics 9 (2008): 559. [DOI] [PMC free article] [PubMed] [Google Scholar]
- 43. Shannon P., Markiel A., Ozier O., et al., “Cytoscape: A Software Environment for Integrated Models of Biomolecular Interaction Networks,” Genome Research 13 (2003): 2498–2504. [DOI] [PMC free article] [PubMed] [Google Scholar]
- 44. Muggeo V. M., “Estimating Regression Models With Unknown Break‐Points,” Statistics in Medicine 22 (2003): 3055–3071. [DOI] [PubMed] [Google Scholar]
- 45. Chin C.‐H., Chen S.‐H., Wu H.‐H., et al., “cytoHubba: Identifying Hub Objects and Sub‐Networks From Complex Interactome,” BMC Systems Biology 8 (2014): S11. [DOI] [PMC free article] [PubMed] [Google Scholar]
- 46. Bader G. D. and Hogue C. W. V., “An Automated Method for Finding Molecular Complexes in Large Protein Interaction Networks,” BMC Bioinformatics 4 (2003): 2. [DOI] [PMC free article] [PubMed] [Google Scholar]
- 47. Purdy P. H., Fox M. H., and Graham J. K., “The Fluidity of Chinese Hamster Ovary Cell and Bull Sperm Membranes After Cholesterol Addition,” Cryobiology 51 (2005): 102–112. [DOI] [PubMed] [Google Scholar]
- 48. Sezgin E., Levental I., Mayor S., and Eggeling C., “The Mystery of Membrane Organization: Composition, Regulation and Roles of Lipid Rafts,” Nature Reviews Molecular Cell Biology 18 (2017): 361–374. [DOI] [PMC free article] [PubMed] [Google Scholar]
- 49. Lasunción M. A., Martínez‐Botas J., Martín‐Sánchez C., Busto R., and Gómez‐Coronado D., “Cell Cycle Dependence on the Mevalonate Pathway: Role of Cholesterol and Non‐Sterol Isoprenoids,” Biochemical Pharmacology 196 (2022): 114623. [DOI] [PubMed] [Google Scholar]
- 50. Parrales A., Thoenen E., and Iwakuma T., “The Interplay Between Mutant p53 and the Mevalonate Pathway,” Cell Death & Differentiation 25 (2018): 460–470. [DOI] [PMC free article] [PubMed] [Google Scholar]
- 51. Göbel A., Rauner M., Hofbauer L. C., and Rachner T. D., “Cholesterol and Beyond‐The Role of the Mevalonate Pathway in Cancer Biology,” Biochimica Et Biophysica Acta (BBA)‐Reviews on Cancer 1873 (2020): 188351. [DOI] [PubMed] [Google Scholar]
- 52. Mackinnon W. B., Dyne M., Hancock R., et al., “Malignancy‐Related Characteristics of Wild Type and Drug‐Resistant Chinese Hamster Ovary Cells,” Pathology 25 (1993): 268–276. [DOI] [PubMed] [Google Scholar]
- 53. Seth G., McIvor R. S., and Hu W. S., “17Beta‐Hydroxysteroid Dehydrogenase Type 7 (Hsd17b7) Reverts Cholesterol Auxotrophy in NS0 Cells,” J. Biotechnol. 2006, 121, 241–252. [DOI] [PubMed] [Google Scholar]
- 54. O'Neill L. M., Guo C.‐A., Ding F., et al., “Stearoyl‐CoA Desaturase‐2 in Murine Development, Metabolism, and Disease,” International Journal of Molecular Sciences 21 (2020): 8619. [DOI] [PMC free article] [PubMed] [Google Scholar]
- 55. Budge J. D., Knight T. J., Povey J., et al., “Engineering of Chinese Hamster Ovary Cell Lipid Metabolism Results in an Expanded ER and Enhanced Recombinant Biotherapeutic Protein Production,” Metabolic Engineering 57 (2020): 203–216. [DOI] [PMC free article] [PubMed] [Google Scholar]
- 56. Loh W. P., Yang Y., and Lam K. P., “miR‐92a Enhances Recombinant Protein Productivity in CHO Cells by Increasing Intracellular Cholesterol Levels,” Biotechnology Journal 12 (2017): 1600488. [DOI] [PubMed] [Google Scholar]
- 57. Chong W. P. K., Thng S. H., Hiu A. P., et al., “LC‐MS‐Based Metabolic Characterization of High Monoclonal Antibody‐Producing Chinese Hamster Ovary Cells,” Biotechnology and Bioengineering 109 (2012): 3103–3111. [DOI] [PubMed] [Google Scholar]
- 58. Orellana C. A., Marcellin E., Schulz B. L., et al., “High‐Antibody‐Producing Chinese Hamster Ovary Cells Up‐Regulate Intracellular Protein Transport and Glutathione Synthesis,” Journal of Proteome Research 14 (2015): 609–618. [DOI] [PubMed] [Google Scholar]
- 59. Chevallier V., Schoof E. M., Malphettes L., Andersen M. R., and Workman C. T., “Characterization of Glutathione Proteome in CHO Cells and Its Relationship With Productivity and Cholesterol Synthesis,” Biotechnology and Bioengineering 117 (2020): 3448–3458. [DOI] [PMC free article] [PubMed] [Google Scholar]
- 60. Ribas V., García‐Ruiz C., and Fernández‐Checa J. C., “Mitochondria, Cholesterol and Cancer Cell Metabolism,” Clinical and Translational Medicine 5 (2016): 1–24. [DOI] [PMC free article] [PubMed] [Google Scholar]
- 61. Yoon S. K., Hong J. K., Choo S. H., et al., “Adaptation of Chinese Hamster Ovary Cells to Low Culture Temperature: Cell Growth and Recombinant Protein Production,” Journal of Biotechnology 122 (2006): 463–472. [DOI] [PubMed] [Google Scholar]
- 62. Al‐Fageeh M. B. and Smales C. M., “Control and Regulation of the Cellular Responses to Cold Shock: The Responses in Yeast and Mammalian Systems,” Biochemical Journal 397 (2006): 247–259. [DOI] [PMC free article] [PubMed] [Google Scholar]
- 63. Matijasevic Z., Snyder J. E., and Ludlum D. B., “Hypothermia Causes a Reversible, p53‐Mediated Cell Cycle Arrest in Cultured Fibroblasts,” Oncology Research 10 (1998): 605–610. [PubMed] [Google Scholar]
- 64. Ohnishi T., Wang X., Ohnishi K., and Takahashi A., “p53‐Dependent Induction of WAF1 by Cold Shock in Human Glioblastoma Cells,” Oncogene 16 (1998): 1507–1511. [DOI] [PubMed] [Google Scholar]
- 65. Roobol A., Roobol J., Carden M. J., et al., “ATR (Ataxia Telangiectasia Mutated‐ and Rad3‐Related Kinase) Is Activated by Mild Hypothermia in Mammalian Cells and Subsequently Activates p53,” Biochemical Journal 435 (2011): 499–508. [DOI] [PubMed] [Google Scholar]
- 66. Shahbazi J., Lock R., and Liu T., “Tumor Protein 53‐Induced Nuclear Protein 1 Enhances p53 Function and Represses Tumorigenesis,” Frontiers in Genetics 4 (2013): 80. [DOI] [PMC free article] [PubMed] [Google Scholar]
- 67. Birzele F., Schaub J., Rust W., et al., “Into the Unknown: Expression Profiling Without Genome Sequence Information in CHO by Next Generation Sequencing,” Nucleic Acids Research 38 (2010): 3999–4010. [DOI] [PMC free article] [PubMed] [Google Scholar]
- 68. Mao B., Zhang Z., and Wang G., “BTG2: A Rising Star of Tumor Suppressors (Review),” International Journal of Oncology 46 (2015): 459–464. [DOI] [PubMed] [Google Scholar]
- 69. Lim I. K., Lee M. S., Ryu M. S., et al., “Induction of Growth Inhibition of 293 Cells by Downregulation of the Cyclin E and Cyclin‐Dependent Kinase 4 Proteins Due to Overexpression of TIS21,” Molecular Carcinogenesis 23 (1998): 25–35. [DOI] [PubMed] [Google Scholar]
- 70. Rouault J.‐P., Falette N., Guéhenneux F., et al., “Identification of BTG2, an Antiproliferative p53–Dependent Component of the DNA Damage Cellular Response Pathway,” Nature Genetics 14 (1996): 482–486. [DOI] [PubMed] [Google Scholar]
- 71. Bieging‐Rolett K. T., Kaiser A. M., Morgens D. W., et al., “Zmat3 is a Key Splicing Regulator in the p53 Tumor Suppression Program,” Molecular Cell 80 (2020): 452–469.e459. [DOI] [PMC free article] [PubMed] [Google Scholar]
- 72. Bieging‐Rolett K. T. and Attardi L. D., “Zmat3 Splices Together p53‐Dependent Tumor Suppression,” Molecular & Cellular Oncology 8 (2021): 1898523. [DOI] [PMC free article] [PubMed] [Google Scholar]
- 73. Klausing S., Krämer O., and Noll T., “Bioreactor Cultivation of CHO DP‐12 Cells Under Sodium Butyrate Treatment—Comparative Transcriptome Analysis With CHO cDNA Microarrays,” BMC Proceedings 5 (2011): P98. [DOI] [PMC free article] [PubMed] [Google Scholar]
- 74. Floch F. L., Tessier B., Chenuet S., et al., “HPCE Monitoring of the N‐Glycosylation Pattern and Sialylation of Murine Erythropoietin Produced by CHO Cells in Batch Processes,” Biotechnology Progress 20 (2004): 864–871. [DOI] [PubMed] [Google Scholar]
- 75. Johnson T., “Promises and Pitfalls of Cell Line Adaptation,” Bioprocess International 3 (2006): S52–S56. [Google Scholar]
- 76. Ozturk S., Kaseko G., Mahaworasilpa T., and Coster H., “Adaptation of Cell Lines to Serum‐Free Culture Medium,” Hybridoma and Hybridomics 22 (2003): 267–272. [DOI] [PubMed] [Google Scholar]
- 77. Ahn W. S., Jeon J.‐J., Jeong Y.‐R., Lee S. J., and Yoon S. K., “Effect of Culture Temperature on Erythropoietin Production and Glycosylation in a Perfusion Culture of Recombinant CHO Cells,” Biotechnology and Bioengineering 101 (2008): 1234–1244. [DOI] [PubMed] [Google Scholar]
- 78. Gandor C., Leist C., Fiechter A., and Asselbergs F. A., “Amplification and Expression of Recombinant Genes in Serum‐Independent Chinese Hamster Ovary Cells,” FEBS Letters 377 (1995): 290–294. [DOI] [PubMed] [Google Scholar]
- 79. Sinacore M., Charlebois T., Harrison S., et al., “CHO DUKX Cell Lineages Preadapted to Growth in Serum‐Free Suspension Culture Enable Rapid Development of Cell Culture Processes for the Manufacture of Recombinant Proteins,” Biotechnology and Bioengineering 52 (1996): 518–528. [DOI] [PubMed] [Google Scholar]
- 80. Florin L., Lipske C., Becker E., and Kaufmann H., “Supplementation of Serum Free Media With HT is Not Sufficient to Restore Growth Properties of DHFR−/− Cells in Fed‐Batch Processes—Implications for Designing Novel CHO‐Based Expression Platforms,” Journal of Biotechnology 152 (2011): 189–193. [DOI] [PubMed] [Google Scholar]
- 81. Moon S.‐H., Huang C.‐H., Houlihan S. L., et al., “p53 Represses the Mevalonate Pathway to Mediate Tumor Suppression,” Cell 176 (2019): 564–580.e519. [DOI] [PMC free article] [PubMed] [Google Scholar]
- 82. Ha T. K., Kim Y. G., and Lee G. M., “Understanding of Altered N‐Glycosylation‐Related Gene Expression in Recombinant Chinese Hamster Ovary Cells Subjected to Elevated Ammonium Concentration by Digital mRNA Counting,” Biotechnology and Bioengineering 112 (2015): 1583–1593. [DOI] [PubMed] [Google Scholar]
- 83. Costa A. R., Withers J., Rodrigues M. E., et al., “The Impact of Cell Adaptation to Serum‐Free Conditions on the Glycosylation Profile of a Monoclonal Antibody Produced by Chinese Hamster Ovary Cells,” New Biotechnology 30 (2013): 563–572. [DOI] [PubMed] [Google Scholar]
- 84. LeFloch F., Tessier B., Chenuet S., et al., “Related Effects of Cell Adaptation to Serum‐Free Conditions on Murine EPO Production and Glycosylation by CHO Cells,” Cytotechnology 52 (2006): 39–53. [DOI] [PMC free article] [PubMed] [Google Scholar]
- 85. Miyagi T. and Yamaguchi K., “Mammalian Sialidases: Physiological and Pathological Roles in Cellular Functions,” Glycobiology 22 (2012): 880–896. [DOI] [PubMed] [Google Scholar]
- 86. Lin N., Mascarenhas J., Sealover N. R., et al., “Chinese Hamster Ovary (CHO) Host Cell Engineering to Increase Sialylation of Recombinant Therapeutic Proteins by Modulating Sialyltransferase Expression,” Biotechnology Progress 31 (2015): 334–346. [DOI] [PMC free article] [PubMed] [Google Scholar]
- 87. Bork K., Horstkorte R., and Weidemann W., “Increasing the Sialylation of Therapeutic Glycoproteins: The Potential of the Sialic Acid Biosynthetic Pathway,” Journal of Pharmaceutical Sciences 98 (2009): 3499–3508. [DOI] [PubMed] [Google Scholar]
- 88. Hossler P., Khattak S. F., and Li Z. J., “Optimal and Consistent Protein Glycosylation in Mammalian Cell Culture,” Glycobiology 19 (2009): 936–949. [DOI] [PubMed] [Google Scholar]
- 89. Patel T. P., Parekh R. B., Moellering B. J., and Prior C. P., “Different Culture Methods Lead to Differences in Glycosylation of a Murine IgG Monoclonal Antibody,” Biochemical Journal 285 (1992): 839–845. [DOI] [PMC free article] [PubMed] [Google Scholar]
- 90. Shields R. L., Lai J., Keck R., et al., “Lack of Fucose on Human IgG1 N‐Linked Oligosaccharide Improves Binding to Human FcγRIII and Antibody‐Dependent Cellular Toxicity,” Journal of Biological Chemistry 277 (2002): 26733–26740. [DOI] [PubMed] [Google Scholar]
- 91. Nam J. H., Zhang F., Ermonval M., Linhardt R. J., and Sharfstein S. T., “The Effects of Culture Conditions on the Glycosylation of Secreted Human Placental Alkaline Phosphatase Produced in Chinese Hamster Ovary Cells,” Biotechnology and Bioengineering 100 (2008): 1178–1192. [DOI] [PMC free article] [PubMed] [Google Scholar]
- 92. Hadley B., Maggioni A., Ashikov A., et al., “Structure and Function of Nucleotide Sugar Transporters: Current Progress,” Computational and Structural Biotechnology Journal 10 (2014): 23–32. [DOI] [PMC free article] [PubMed] [Google Scholar]
- 93. Muraoka M., Kawakita M., and Ishida N., “Molecular Characterization of Human UDP‐Glucuronic acid/UDP‐ N‐Acetylgalactosamine Transporter, a Novel Nucleotide Sugar Transporter With Dual Substrate Specificity,” FEBS Letters 495 (2001): 87–93. [DOI] [PubMed] [Google Scholar]
- 94. Stach C. S., McCann M. G., O'Brien C. M., et al., “Model‐Driven Engineering of N‐Linked Glycosylation in Chinese Hamster Ovary Cells,” ACS Synthetic Biology 2019, 8, 2524–2535. [DOI] [PMC free article] [PubMed] [Google Scholar]
- 95. Kim S.‐M., Chang K.‐H., and Oh D. J., “Effect of Environmental Parameters on Glycosylation of Recombinant Immunoglobulin G Produced From Recombinant CHO Cells,” Biotechnology and Bioprocess Engineering 23 (2018): 456–464. [Google Scholar]
- 96. Adams B. M., Canniff N. P., Guay K. P., Larsen I. S. B., and Hebert D. N., “Quantitative Glycoproteomics Reveals Cellular Substrate Selectivity of the ER Protein Quality Control Sensors UGGT1 and UGGT2,” eLife 9 (2020): 63997. [DOI] [PMC free article] [PubMed] [Google Scholar]
- 97. Ma X., Zhang L., Zhang L., et al., “Validation and Identification of Reference Genes in Chinese Hamster Ovary Cells for Fc‐Fusion Protein Production,” Experimental Biology and Medicine 245 (2020): 690–702. [DOI] [PMC free article] [PubMed] [Google Scholar]
- 98. Bahr S. M., Borgschulte T., Kayser K. J., and Lin N., “Using Microarray Technology to Select Housekeeping Genes in Chinese Hamster Ovary Cells,” Biotechnology and Bioengineering 104 (2009): 1041–1046. [DOI] [PubMed] [Google Scholar]
- 99. Brown A. J., Gibson S., Hatton D., and James D. C., “Transcriptome‐Based Identification of the Optimal Reference CHO Genes for Normalisation of qPCR Data,” Biotechnology Journal 13 (2018): 1700259. [DOI] [PubMed] [Google Scholar]
Associated Data
This section collects any data citations, data availability statements, or supplementary materials included in this article.
Supplementary Materials
Supporting File 1: biot70055‐sup‐0001‐SuppMat.pdf.
Data Availability Statement
The data that support the findings of this study are available from the corresponding author upon reasonable request.