



Abstract
Objectives
This study compares the effects of thermoplastic polyurethane (TPU) and polyethylene terephthalate glycol (PETG) aligners on the oral microbiome and salivary pH during orthodontic treatment.
Materials and methods
Ten participants wore TPU and PETG aligners for 24 h. At five time points (1 min, 4, 8, 12, and 24 h), saliva was collected for pH analysis, and microbial samples were taken from both aligner and supragingival plaque surfaces for 16S rRNA sequencing. Statistical analyses included repeated Measures ANOVA for pH, Kruskal–Wallis test for alpha diversity, PERMANOVA for beta diversity, and two-way ANOVA for microbial composition.
Results
In Group PETG, salivary pH significantly decreased from T0 to T4 (p < 0.05). No significant changes in alpha or beta microbiota diversity were observed in either group. Microbial shifts in supragingival plaque microbiomes were detected at T8 in Group PETG, while in Group TPU, these changes became evident between T12 and T24. In aligner microbiomes, Group TPU showed significant reductions in Veillonella, Actinomyces, and Fusobacterium at T24 (p < 0.05). In contrast, Group PETG exhibited significant increases in Streptococcus from T4 to T24 (p < 0.05) and Fusobacterium from T0 to T4 (p < 0.05), followed by a decline from T4 to T24 (p < 0.01).
Conclusions
PETG aligners caused significant reductions in salivary pH at T4 and triggered pronounced fluctuations at T8 in supragingival plaque microbiomes. TPU aligners caused a delayed decline in salivary pH between T8 and T12 and drove distinct structural shifts during prolonged wear from T12 to T24.
Clinical relevance
Material choice based on microbial impact highlights the need for personalized aligner materials and cleaning cycles.
Keywords: Clear aligners, 16S Rrna, Thermoplastic materials, Oral microbiome, Dentistry, Orthodontics
Introduction
Clear aligners have gained increasing popularity in orthodontic treatment owing to their aesthetic advantages, patient comfort, and removability, which collectively promote improved oral hygiene compared to conventional fixed appliances. The same thermoplastic materials are also widely employed in the fabrication of orthodontic retainers. Numerous studies have demonstrated that clear aligners are associated with more favorable plaque (PI) and gingival index (GI) profiles than fixed appliances [1]. Despite these advantages, the unique structural features of aligners—including grooves, ridges, and microcracks—create niches that facilitate bacterial adhesion and plaque biofilm formation, potentially exerting negative effects on oral health [3]. Consequently, clinicians are increasingly concerned about their long-term impact on the oral microbiome. Recent investigations have further suggested that both the materials and design of aligners may influence the oral microenvironment [4].
The oral microbiome constitutes a highly diverse ecosystem that includes a core microbiota commonly shared among genetically unrelated individuals. This microbial community not only shapes local oral conditions but also contributes to systemic health [5]. Owing to its accessibility and ecological complexity, the oral microbiome serves as a valuable model for exploring host-microbe interactions. In this context, growing attention has been directed toward understanding how aligner materials interact with the oral microbiome. For instance, Rouzi et al. [10] observed a marked increase in the relative abundance of Streptococcus species and a concurrent decline in microbial diversity on aligner surfaces during a three-month treatment period. On a shorter timescale, Yan et al. [11] reported significant reductions in salivary pH and microbial diversity following 12 h of continuous aligner wear, highlighting a potential risk for enamel demineralization.
While existing literature often compares aligners with fixed appliances or studies single aligner materials [12], direct comparisons of the commonly used thermoplastic polyurethane (TPU) and polyethylene terephthalate glycol (PETG) are limited. Previous research has included in vitro evaluations of PETG-based aligners [14] and studies on TPU, largely focused on surface modifications rather than its baseline microbial susceptibility [17]. Although a recent in vitro study by Bozkurt et al. [4] compared microbial responses on several commercial aligner systems, highlighting differences among these brands, comprehensive in vivo investigations directly comparing the time-dependent microbiome dynamics on PETG versus TPU materials remain scarce. Therefore, given their distinct physicochemical properties [18], an in vivo evaluation, such as the present study, is crucial to elucidate their respective influences on the oral microenvironment.
Bacterial 16S rRNA high-throughput sequencing has become a powerful tool for elucidating the relationship between the oral microbiome and disease [20]. This technique has been instrumental in clarifying the associations between oral microbiota and disease [21], with dysbiosis being implicated in common conditions such as dental caries and periodontal disease [22], which pose particular concerns for orthodontic patients. Within the framework of precision oral health and personalized dental care [24], the present study investigates the temporal effects of TPU and PETG aligners on the supragingival and salivary microbiomes. The goal is to provide scientific evidence to inform optimal material selection for caries-susceptible individuals and to offer guidance on aligner hygiene practices. Ultimately, this work aims to align clinical decision-making with microbial risk profiles, contributing to individualized strategies for disease prevention and long-term oral health maintenance.
Materials and methods
The research was granted formal ethical approval by the Ethical Committee of the Shanghai Stomatological Hospital on December 28, 2022 (certificate number 2022–019). A total of ten female participants aged 20–35 years were recruited. The study aimed to investigate their oral microbial composition and diversity through a controlled, time-based observational design.
A formal prospective sample size calculation was not performed due to the exploratory nature of the study. The sample size of ten participants was determined based on precedents in similar within-subject experimental designs that focus on characterizing time-dependent microbial changes [1]. This within-subject design, where each participant served as their own control, significantly reduced inter-individual variability, enhancing the efficiency for detecting changes within individuals despite the limited number of participants.
The patients were enrolled based on the following criteria:
1. No periodontal diseases, caries, or mucosal disease.
2. Undergone supra- and subgingival ultrasonic scaling 1 month before study participation.
3. No antibiotics or hormones for 2 months prior to starting the study.
4. Good oral hygiene.
5. No smoking.
6. The crowding of dentition ≤ 2 mm.
7. No pregnancy, breastfeeding or systemic diseases.
Pre-study standardization
To standardize the Oral Hygiene Index (OHI), all participants underwent professional dental cleaning two weeks prior to the start of the study. At baseline, each participant exhibited a plaque index of < 20%. Uniformity was further ensured by providing standardized toothpaste and toothbrushes. Digital oral scans were performed to generate individualized passive thermoformed appliances using 125 mm-diameter, 1 mm-thick sheets; five appliances were made from PET-G (Erkodent, Pfalzgrafenweiler, Germany) and five from TPU (Maxflex, Taipei, Taiwan). The aligners fully covered the dental crowns up to the gingival margin and did not include attachments. Participants were instructed to abstain from consuming acidic foods, beverages, desserts, coffee, and tea while wearing the appliances. After 12 and 24 h of continuous wear, participants were permitted to rinse the appliances with water, but were instructed to refrain from using any cleaning agents.
Sample collection
Prior to the study, participants were given detailed instructions on aligner use, including wearing them continuously except during meals and oral hygiene routines. Additionally, participants were instructed to avoid cleaning the aligners or consuming acidic foods and beverages throughout the study period.
The study first required the collection of samples from the inner surface contents of the PETG aligners and supragingival plaque at five distinct time intervals—T0 (1 min after the first passive aligner application), T4 (4 h after the second passive aligner application), T8 (8 h after the third passive aligner application), T12 (12 h after the fourth passive aligner application), and T24 (24 h after the fifth passive aligner application). Participants wore the aligners continuously for the specified durations before removing them for sample collection. Each time interval reflects the total duration of aligner use, excluding periods for eating and oral hygiene. The TPU aligners were initiated after a two-week period.
The samples were categorized into three groups. For Sample 1, unstimulated saliva samples were collected in sterile containers at precise time points after the specified aligner-wearing durations (1 min, 4 h, 8 h, 12 h, and 24 h). These saliva samples were transferred to fresh 1.5 mL Eppendorf tubes and equilibrated to 25 °C prior to analysis. All analyses were completed within one hour of collection.
Microbial samples were collected from two distinct sites: the inner surface of the aligner (Sample 2) and the supragingival plaque on the tooth surfaces covered by the aligner (Sample 3, specifically from the buccal, lingual, and occlusal surfaces). Each sample was collected using a sterile cotton swab, and the swab head was placed into a separate sterile 1.5 mL Eppendorf tube. All sample tubes were then immediately stored at −80 °C until further analysis. All sample tubes were immediately stored at −80 °C. For subsequent analysis, samples from the aligner surface (Sample 2) and supragingival plaque (Sample 3) were processed and analyzed separately and were not pooled.
Analysis of pH and 16S rRNA sequencing
Saliva samples were centrifuged at 3,000 rpm for 5 min at room temperature (Eppendorf 5424, Hamburg, Germany), and the pH of the supernatant was measured using a calibrated pH meter (LAQUAtwin pH-11, HORIBA, Kyoto, Japan) [28]. Bacterial DNA was extracted from plaque samples using the OMEGA Soil DNA Kit (M5635-02, Omega Bio-Tek, Norcross, GA, USA) following lysozyme treatment [29]. DNA concentration and purity were assessed with the NanoDrop™ 1000 (NanoDrop NC2000, Thermo Fisher Scientific, Waltham, MA, USA). PCR amplification of the V3–V4 region of the 16S rRNA gene was performed, and sequencing was conducted on the Illumina NovaSeq 6000 platform (Illumina Platform, Illumina, Inc., San Diego, CA, USA) by Shanghai Personal Biotechnology Co., Ltd [30].
Statistical analysis
Samples were categorized into “Group TPU” and “Group PETG” based on the aligner material used. Within each group, microbiomes derived from the aligner inner surface were referred to as the “aligner microbiomes”, while those from supragingival plaque were designated as the “supragingival plaque microbiomes”.
Sequencing was conducted using the Illumina paired-end platform, followed by data preprocessing using the DADA2 Plugin (v1.22.0, Benjamin J. Callahan, Raleigh, NC, USA) and Cutadapt Plugin (v4.4, Marcel Martin, Uppsala, Sweden) for primer removal, quality control, denoising, and chimera filtering [31]. Amplicon sequence variants (ASVs) were identified at 100% sequence similarity.
All statistical analyses were performed using the GENESCLOUD platform (Personal Biotechnology Co., Ltd., Shanghai, China). Taxonomic composition analysis was conducted using IBM SPSS Statistics for macOS (v25.0, IBM Corp., Armonk, NY, USA). Further microbiome analyses employed QIIME2 (v2022.11, QIIME2 Development Team, Boulder, CO, USA). Normality of variables was assessed using the Shapiro–Wilk test in R (v4.2.2, R Foundation, Vienna, Austria) [32].
Salivary pH was analyzed via two-way repeated measures ANOVA with “Material” as a between-subject factor and “Time” as a within-subject factor, followed by Bonferroni-corrected post-hoc tests [33]. If sphericity was violated (per Mauchly’s test), Greenhouse–Geisser or Huynh–Feldt corrections were applied.
Alpha diversity indices (Chao 1, Observed Species, Simpson, and Shannon) were calculated at the ASV level. Group comparisons across time points were performed using the Kruskal–Wallis test followed by Dunn’s post-hoc test with Holm correction [34]. Beta diversity analysis was performed using weighted UniFrac distance matrices, and statistical significance was assessed via PERMANOVA (permutational multivariate analysis of variance) [35]. Principal Coordinates Analysis (PCoA) was used for visualization. Intergroup microbial compositional differences were analyzed using two-way ANOVA, with post-hoc pairwise comparisons via Tukey’s HSD test. Statistical significance was set at p < 0.05.
Results
Analysis of pH
Figure 1 and Table 1 show that in Group PETG, the salivary pH exhibited a significant decline from T0 to T4 (p < 0.05), followed by a stabilization phase with a slight upward trend. In Group TPU, no statistically significant pH changes were observed across sampling points, although a pronounced decrease was evident between T0 and T4, as well as between T8 and T12. By T24, salivary pH in both groups converged.
Fig. 1.
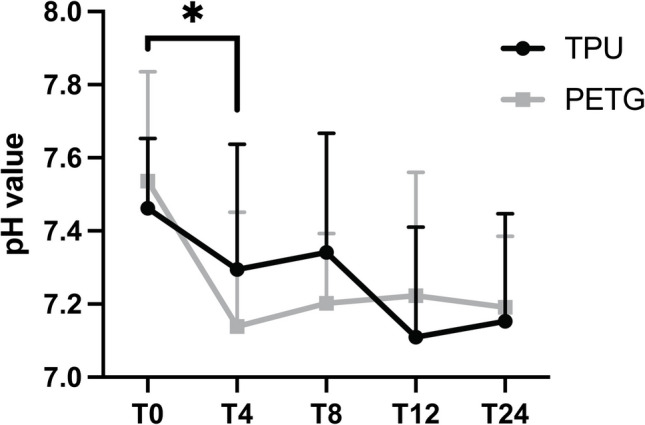
Line graphs generated based on the pH values of saliva at T0, T4, T8, T12, and T24. *Statistically significant difference: pH value of PETG: T0–T4, p = 0.0202
Table 1.
The salivary pH value (mean ± S.D.) at each time point in the PETG and TPU groups
| Time point | Number | TPU pH (mean ± S.D.) |
PETG pH (mean ± S.D.) |
|---|---|---|---|
| 1 min | 10 | 7.46 ± 0.19 | 7.54 ± 0.3 |
| 4 h | 10 | 7.3 ± 0.34 | 7.14 ± 0.31* |
| 8 h | 10 | 7.34 ± 0.33 | 7.2 ± 0.19 |
| 12 h | 10 | 7.11 ± 0.3 | 7.22 ± 0.34 |
| 24 h | 10 | 7.15 ± 0.29 | 7.19 ± 0.19 |
*A statistically significant difference was observed between T0 and T4 in Group PETG (p = 0.0202; Bonferroni-corrected paired t-test)
OTU analysis
In total, 8,221,753 raw reads were generated from 200 plaque samples (10 individuals, 2 thermoplastic materials, 5 times, the surface of a clear aligner and saliva) with an average of 82,217 reads per sample (range: 72,986–87,062). The DADA2 plugin within QIIME2 was employed for sequence processing, including representative sequence inference, primer removal, quality filtering, denoising, sequence merging, and chimera removal [37]. Following sequence processing, 6,097,172 clean reads were obtained, with an average of 60,971 for each sample (range: 45,884–77,494).
Alpha diversity
This study examined the variations in alpha diversity of the aligner microbiomes (TPU-A and PETG-A) and the supragingival plaque microbiomes (TPU-T and PETG-T) (Figs. 2, 3, 4 and 5). The microbial richness estimators (the Chao 1 and observed species indices) and the microbial community diversity estimators (the Simpson and Shannon diversity indices) were employed. No statistically significant changes were observed (p > 0.05) during the 24-h aligner usage period. In the aligner microbiomes, a general trend was identified: during T12-T24, both groups exhibited a notable decline in alpha diversity. The difference was that during the initial 12 h, the Chao1, Observed Species, and Shannon indices demonstrated a gradual increase in Group PETG, while the opposite trend was observed in the TPU group. In the supragingival plaque microbiomes, the Chao 1 and observed species indices in Group TPU showed a continuous decrease from T8 to T24, while the Simpson and Shannon indices indicated a decline in alpha diversity from T12 to T24. In contrast, alpha diversity in Group PETG remained stable, with a peak observed at T8.
Fig. 2.

Alpha diversity indices of the aligner microbiomes of Group TPU-T at T0, T4, T8, T12, and T24, assessed by Kruskal–Wallis test. The panels show: (a) Chao1 index, (b) Observed Species, (c) Shannon’s diversity, and (d) Simpson’s diversity. Data was presented using median and interquartile ranges. The order of the five lines in each set of data from the bottom to top indicates the minimum, first quartile, median, third quartile, and maximum
Fig. 3.
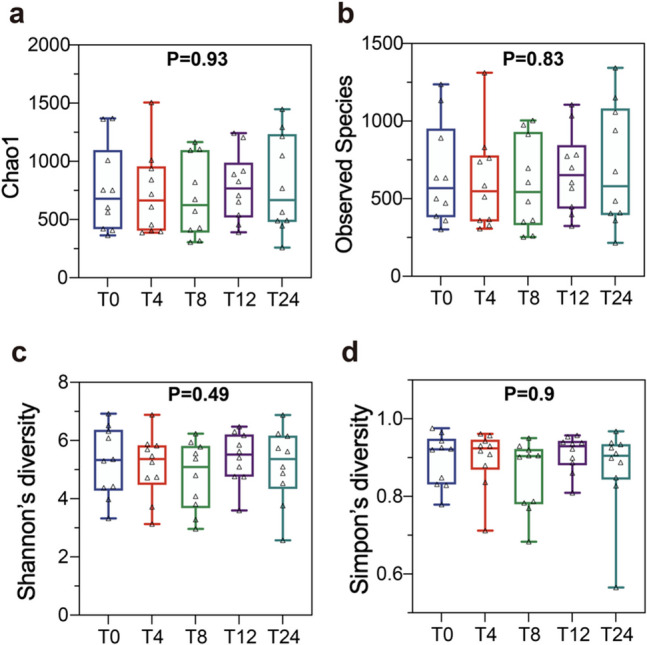
Alpha diversity indices of the aligner microbiomes of Group PETG-T at T0, T4, T8, T12, and T24, assessed by Kruskal–Wallis test. Panel definitions and boxplot representation are identical to those described in Fig. 2
Fig. 4.

Alpha diversity indices of the aligner microbiomes of Group TPU-A at T0, T4, T8, T12, and T24, assessed by Kruskal–Wallis test. Panel definitions and boxplot representation are identical to those described in Fig. 2
Fig. 5.

Alpha diversity indices of the aligner microbiomes of Group PETG-A at T0, T4, T8, T12, and T24, assessed by Kruskal–Wallis test. Panel definitions and boxplot representation are identical to those described in Fig. 2
Beta diversity
In contrast to alpha diversity, which measures within-sample diversity, beta diversity focuses on variations in colony composition and distribution between samples. Temporal variation in the microbial community structure was evaluated across five time points based on weighted UniFrac distance measurements, with significance tested through PERMANOVA analysis (Fig. 6). No statistically significant differences were detected (p > 0.05). At both collection sites, the beta diversity in both groups remained stable over time and was slightly lower than that at T0, except for the TPU group, where the beta diversity in the supragingival plaque microbiomes was slightly higher than T0 at T12.
Fig. 6.

Beta diversity analysis based on weighted UniFrac distance metrics of Group TPU-T (a), PETG-T (b), TPU-A (c), and PETG-A (d) at T0, T4, T8, T12, and T24. The order of the five lines in each set of data from the bottom to top indicates the minimum, first quartile, median, third quartile, and maximum
As illustrated in Fig. 7, the Principal Coordinate Analysis (PCoA) plot displays 95% confidence ellipses for each group, visually summarizing the spread and indicating intra-group variability. Each point represents a sample. The closer the distance between two points, the smaller the difference in their community composition. No distinct separation is observed among different time points for each group, indicating that the composition of OTUs was relatively similar. Notably, in the aligner microbiomes, the confidence ellipse at baseline was significantly larger compared to subsequent time points, except for T12 in Group PETG.
Fig. 7.

Principal coordinates analysis (PCoA) visualization of the structural variation in microbial communities for Group TPU-T (a), PETG-T (b), TPU-A (c), and PETG-A (d) at T0, T4, T8, T12, and T24. Each point represents the bacterial community of an individual sample
In-depth comparative analysis of microbial composition and relative abundances
This section provides a comprehensive analysis of microbial composition on Group TPU and PETG, highlighting temporal changes in the aligner microbiomes and supragingival plaque microbiomes at phylum, genus, and species levels. The analysis includes detailed observations and comparative insights, with an emphasis on how the two materials influence microbial communities differently over time.
Phylum level
In both supragingival plaque and aligner microbiomes, the microbial communities of Group TPU and PETG were categorized into five predominant phyla (relative abundance > 1.0%): Firmicutes, Proteobacteria, Actinobacteria, Bacteroidetes, and Fusobacteria (Fig. 8).
Fig. 8.

Temporal changes in bacterial abundance at the phylum level for Group TPU-T (a), PETG-T (b), TPU-A (c), and PETG-A (d) at T0, T4, T8, T12, and T24
In the supragingival plaque microbiomes, the relative abundance of Firmicutes in both groups decreased steadily from T0 to T12 in both groups (TPU: 58.56% to 51.82%; PETG: 53.72% to 48.65%), barring a notable fluctuation at T8 in Group PETG, and then surged from T12 to T24 (TPU: 51.82% to 62.27%, PETG: 48.65% to 55.93%). These temporal shifts were not statistically significant (p > 0.05).
In the aligner microbiomes, Group TPU showed significantly higher levels of Proteobacteria at T4 and T8 compared to T0 (p < 0.05). Meanwhile, the relative abundance of Actinobacteria at T24 was significantly lower than at T0 (p < 0.01), T4 (p < 0.001), and T8 (p < 0.01). Similarly, Fusobacteria abundance decreased significantly at T24 compared to T0 (p < 0.001), T4 (p < 0.05), and T8 (p < 0.05). In Group PETG, the relative abundance of Firmicutes consistently increased from T4 to T24, while that of Fusobacteria at T24 was significantly reduced compared to T0 (p < 0.05), T4 (p < 0.01), T8 (p < 0.05), and T12 (p < 0.05). A consistent trend in Firmicutes and Proteobacteria was observed across both groups. The relative abundance of Firmicutes initially decreased then increased, while Proteobacteria exhibited the opposite trend. The timing of this transition varied between the groups. In Group TPU, Firmicutes reached a minimum (40.19%) and Proteobacteria a maximum (35.28%) at T8. Meanwhile, in Group PETG, Firmicutes was at its lowest (38.83%) and Proteobacteria peaked (33.73%) at T4.
Saccharibacteria (formerly TM7) emerged as the sixth most prevalent phylum colonizing both supragingival plaque and the inner surfaces of aligners in this study. As shown in Fig. 9, the relative abundance of TM7 in supragingival plaque microbiomes significantly increased from T8 to T12 in Group PETG (p < 0.05). In the aligner microbiomes, Group TPU demonstrated a consistent decline in TM7 abundance, with levels at T12 (p < 0.05) and T24 (p < 0.01) significantly lower than baseline. A notable increase in TM7 abundance from T8 to T12 in supragingival plaque microbiomes, accompanied by a gradual decline in aligner microbiomes, was observed in both groups.
Fig. 9.
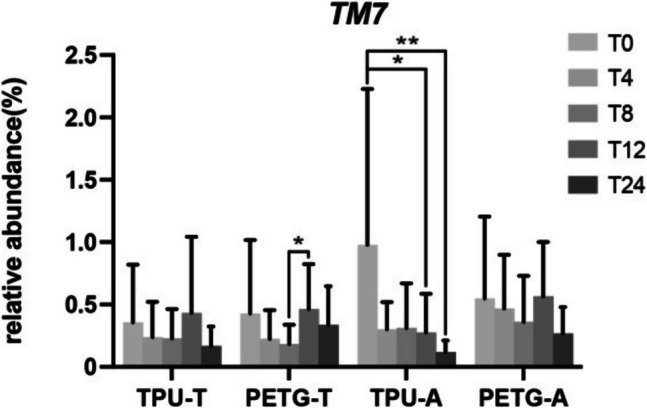
Temporal changes in the relative abundance of the Saccharibacteria phylum. All data are expressed as mean ± standard deviation by ANOVA. *p < 0.05; **p < 0.01
Genus level
At the genus level, community structures of the microbiomes from both sampling sites across different time points are shown in Figs. 10, 11 and 12.
Fig. 10.

Temporal changes in bacterial abundance at the genus level for Group TPU-T (a), PETG-T (b), TPU-A (c), and PETG-A (d) at T0, T4, T8, T12, and T24. All data are expressed as mean ± standard deviation by ANOVA. *p < 0.05; **p < 0.01
Fig. 11.

15 most abundant bacterial genus in the supragingival plaque microbiomes (a) and the aligner microbiomes (b) at T0, T4, T8, T12, and T24
Fig. 12.

Temporal changes in the relative abundance of major pathogenic-related genera of Group TPU-T (a), PETG-T (b), TPU-A (c), and PETG-A (d) at T0, T4, T8, T12, and T24. All data are expressed as mean ± standard deviation by ANOVA. *p < 0.05; **p < 0.01
In the supragingival plaque microbiomes, Group TPU and PETG shared the ten most dominant genera: Streptococcus, Haemophilus, Gemella, Neisseria, Veillonella, Rothia, Actinomyces, and Leptotrichia. In Group TPU, the relative abundance of Neisseria at T24 was significantly lower at T8 (p < 0.05). In Group PETG, the relative abundance of Haemophilus decreased significantly at T24 compared to T4 (p < 0.05). In both groups, and with the exception of the microbial perturbation at T8 in Group PETG, the relative abundance of Streptococcus showed a consistent decline from T0 to T12 (TPU: 5.18% decrease; PETG: 7.46% decrease), and that of Actinomyces reached its peak abundance at T12.
In the aligner microbiomes, the top ten dominant genera included: Streptococcus, Neisseria, Haemophilus, Veillonella, Rothia, Actinomyces, Porphyromonas, Gemella, Prevotella, and Fusobacterium. Group TPU exhibited significantly higher abundance of Neisseria at T8 compared to T0 (p < 0.05), while the relative abundances of Veillonella and Actinomyces were significantly lower at T24 compared to T0 (p < 0.05 and p < 0.01, respectively). The relative abundance of Fusobacterium was significantly lower at T24 compared to T4 (p < 0.05). In Group PETG, the relative abundance of Streptococcus was significantly greater at T24 than at T4 (p < 0.05), and that of Fusobacterium increased significantly from T0 to T4 (p < 0.05) and then decreased from T4 to T24 (p < 0.01). Both groups showed a consistent and significant increase in Streptococcus from T4 to T24 (TPU: 9.34% increase; PETG: 10.69% increase). In both groups, the relative abundances of Prevotella and Porphyromonas showed an overall upward trend over time, with Prevotella showing a slight decline in Group PETG from T12 to T24 and in Group TPU from T4 to T8.
Species level
Species-level analysis provided further insights into the differential microbial dynamics between Group TPU and PETG (Fig. 13).
Fig. 13.

Temporal changes in bacterial abundance at the species level for Group TPU-T (a) and PETG-T (b), and the relative abundance of major pathogenic-related species of Group TPU-A (c) and PETG-A (d) at T0, T4, T8, T12, and T24. All data are expressed as mean ± standard deviation by ANOVA. *p < 0.05; **p < 0.01
In the aligner microbiomes, Group TPU demonstrated a significantly higher abundance of Rothia mucilaginosa at T4 and T8 compared to T0 (P < 0.05), followed by a notable decline at T24 (P < 0.05). The abundance of Fusobacterium periodonticum significantly increased from T0 to T4 (P < 0.01), while sp._HMT_180 was significantly more abundant at T4 (P < 0.01), T8 (P < 0.01), and T12 (P < 0.05) compared to T0, but experienced a marked decline from T4 to T24 (P < 0.01). Similarly, the abundance of Streptococcus salivarius at T24 was significantly lower than at T12 (P < 0.05). In Group PETG, Fusobacterium periodonticum showed significantly higher abundance at T4 (P < 0.01) and T8 (P < 0.05) compared to T0. However, the abundances of Fusobacterium periodonticum and Veillonella parvula decreased significantly from T4 to T24 (P < 0.05). Both groups exhibited an increase in Haemophilus parainfluenzae from T4 to T8, with T8 marking a turning point before subsequent declines.
In the supragingival plaque microbiomes, Group TPU exhibited a significantly increased abundance of Streptococcus sanguinis at T12 compared to T0 (P < 0.01), followed by a significant decline from T12 to T24 (P < 0.01). The abundances of sp._HMT_036 and Rothia aeria were significantly lower at T24 compared to T4 (P < 0.05). Similarly, Corynebacterium matruchotii showed a significant decrease from T0 to T24 (P < 0.05). In Group PETG, the abundance of Haemophilus parainfluenzae at T4 was significantly lower than at T8 and T24 (P < 0.05). In contrast, Fusobacterium Nucleatum exhibited a significantly higher abundance at T12 compared to T4 and T8 (P < 0.05).
Discussion
This study presents a comprehensive comparative analysis of two widely used clear aligner materials—thermoplastic polyurethane (TPU) and polyethylene terephthalate glycol (PETG)—focusing on their short-term effects on oral microecology during a 24-h wear period without cleaning intervention. Our findings indicate that TPU may induce pronounced fluctuations in microbial community structure during extended wear (T12-T24), accompanied by a mild enrichment of key pathogenic anaerobes such as Prevotella and Porphyromonas. In contrast, PETG is associated with notable acidification of saliva at the initial stage (T4) and greater microbial instability in the early phase (T4-T8), followed by stabilization.
Salivary pH, a key marker of caries risk, influences plaque metabolism, and the aligner’s sealing effect limits saliva’s buffering action, enabling acidic, anaerobic biofilms that accelerate enamel demineralization [38]. Continued wear exacerbates plaque accumulation and selects for acidogenic, acid-tolerant, and anaerobic bacteria, further undermining enamel integrity. Yan et al. [39] previously reported that with extended wear time, particularly after 12 and 24 h, the pH of liquid samples from the inner surface of the aligner decreases significantly (p < 0.05). In our study, both material groups showed a similar pH decrease in saliva at T12 compared to baseline. This may suggest that a 12-h interval represents the critical maximum cleaning threshold for clear aligners made from various materials. Although the PETG group showed a significant pH drop at T4, the mean remained mildly alkaline (> 7.0), suggesting initial buffering by saliva and the local aligner environment. In contrast, TPU exhibited a delayed but more sustained pH decline between T8 and T12, aligning with microbial features of biofilm maturation [23]. These trends point to distinct windows of ecological disturbance. Notably, despite these fluctuations, salivary pH in both groups generally stayed above 7.0 throughout the 24-h period. This overall pH maintenance likely reflects a robust interplay of sustained salivary buffering, microbial alkali production (e.g., from urea/arginine), and limited acidogenic substrates under the study's controlled dietary conditions.
Relative abundance was used to capture shifts in biofilm composition as community resources and spatial niches are reallocated. In aligner plaque samples, prolonged wear increases the relative abundance of Streptococcus while reducing Actinomyces, likely reflecting microbial adaptation to sustained wear conditions. Streptococcus thrives under acidic, low-oxygen conditions, potentially acidifying the microenvironment via lactic acid production, which may suppress other taxa and foster pathogenic anaerobes, heightening risks of caries and periodontal disease [40]. The study also identifies temporal enrichment of pathogenic anaerobes during T12-T24 in Group TPU, such as Prevotella and Porphyromonas, with prolonged wear, likely due to biofilm thickening and reduced oxygen permeability. These findings underscore the necessity of routine deep-cleaning cycles to curb pathogenic accumulation during extended aligner use.
In the supragingival plaque microbiomes (Fig. 12a, b), the relative abundance of Porphyromonas in Group PETG continuously increased from T4 onwards, whereas it remained low during T12–T24 in Group TPU. These enrichment patterns likely reflect pH-driven ecological selection, as both occurred shortly after the respective phases of salivary acidification. The Treponema genus, a component of the “red complex” of periodontal pathogens [41], significantly decreased at T12 and T24 in PETG relative to T4, with a significant reduction at T12 compared to baseline (p < 0.05). In the aligner microbiomes (Fig. 12c, d), Porphyromonas exhibited enrichment from T12 to T24 in the TPU group, while in the PETG group, this enrichment was observed between T8 and T12. The genus Prevotella, a crucial marker in caries prediction [42] and also a dominant bacterium in young people with stage III periodontitis [44], showed a consistent increase in TPU from T0 to T24, except for T8, while in PETG, it peaked at T12. Other periodontal pathogens, such as Treponema, Tannerella, and Capnocytophaga, exhibited a decline in relative abundance over time in both groups, with significantly lower levels at T24 than at initial points (T0 or T4). These statistically significant reductions were observed in genera such as Veillonella, Fusobacterium, Capnocytophaga, Treponema, and Tannerella in the TPU group (p < 0.05), and Fusobacterium, Tannerella, and Campylobacter in the PETG group (p < 0.05).
Comparative data across taxonomic levels and sampling sites revealed that both TPU and PETG aligners supported similar dominant genera; however, microbial fluctuations differed in timing and magnitude. In Group PETG, pronounced compositional shifts were observed at T8 in supragingival plaque, with Firmicutes reaching peak abundance (60.18%) and concurrent drops in Proteobacteria (20.53%), Fusobacteria (3.67%), and Saccharibacteria (0.18%). At the genus level, Streptococcus (40.70%) and Gemella (12.17%) also peaked, while Neisseria (7.27%) and Veillonella (3.94%) were lowest. In contrast, Group TPU exhibited more substantial fluctuations between T12–T24, with elevated levels of Veillonella, Actinomyces, Leptotrichia, and Prevotella, along with species such as Haemophilus parainfluenzae (12.00%), Streptococcus salivarius (3.25%), Veillonella dispar (2.69%), and V. parvula (2.71%). These data suggest that PETG may foster earlier, transient shifts, whereas TPU promotes more delayed but sustained community restructuring.
Saccharibacteria are obligate epibionts that reside on the surfaces of their host bacteria and are closely associated with dysbiotic microbiomes in periodontitis and other inflammatory diseases, indicating their potential role as pathogens [45]. TM7 was identified as the sixth most prevalent phylum in both aligner and supragingival microbiomes (Fig. 9). Previous research [46] has strongly linked TM7 to periodontal disease, with TM7 levels increasing from approximately 1% to up to 21% in individuals with periodontitis. Rego et al. [47] observed higher TM7 levels in patients undergoing orthodontic treatment compared to healthy controls, while Wang et al. [48] found greater TM7 abundance in patients using Invisalign aligners compared to those with fixed appliances. The consistent increase in TM7 abundance from T8 to T12 in supragingival plaque microbiomes across both groups highlights a shared trend, suggesting an elevated risk of periodontitis after 8 h of wear and emphasizing the need to limit the cleaning cycle to 8–12 h.
TPU and PETG materials exhibit distinct bacterial adhesion behaviors primarily due to differences in their surface characteristics. TPU's smooth and uniform surface reduces initial bacterial attachment, while its flexibility allows it to adapt to the oral environment, thereby maintaining microbial stability during use [49]. In contrast, PETG materials, after thermoforming, demonstrate higher surface roughness and increased microstructural complexity. These irregular surfaces provide additional attachment points, particularly around the gingival margins, where bacteria can anchor themselves securely in microscopic grooves, evading mechanical cleaning and saliva flow [18]. Additionally, the hydrophobic nature of PETG enhances adhesion to hydrophobic bacteria, such as Gram-positive species commonly found in early biofilms, through hydrophobic interactions that reduce repulsion between bacterial cells and the material surface, thereby accelerating biofilm formation [50]. These mechanisms are supported by experimental results. The Perturbations in the microbial community observed at T8 in Group PETG indicate that the rough and hydrophobic properties of PETG may accelerate the colonization of early biofilm-forming bacteria. In contrast, the smoother, more hydrophilic surface of TPU inhibits rapid bacterial attachment and proliferation.
The observed microbial shifts were documented under conditions where no cleaning agents were applied, underscoring the impact of hygiene frequency on material-specific biofilm development. To minimize confounding variables, only water rinsing was allowed, enabling a controlled assessment of the intrinsic microbial responses to TPU and PETG. While this approach enhances experimental rigor, it diverges from typical clinical practice—where mechanical and chemical cleaning methods (e.g., brushing, effervescent tablets, enzymatic soaks, or ultrasonic baths) are routinely used and known to reduce biofilm burden [51]. Moreover, ultrasonic vibration with cationic detergents has demonstrated efficacy against mature biofilms [53]. Therefore, although methodologically justified, the absence of cleaning agents in our protocol limits the direct translatability of these findings to real-world orthodontic hygiene scenarios.
Based on this study, patient-specific clinical characteristics should guide material selection for personalized treatment. For high-risk individuals (e.g., low salivary flow or poor self-cleansing), an 8-h intensive cleaning cycle is recommended regardless of the thermoformed aligner material. High-risk caries patients wearing PETG aligners should pay special attention to the initial acidification issue and are advised to increase cleaning frequency through oral hygiene education, performing deep cleaning every 4–6 h with meals. Clinicians should tailor material selection to each patient’s oral microbiome, salivary flow, and lifestyle. Future aligner designs ought to incorporate these host-related parameters to optimize oral health and prevent dysbiosis. Adjunctive treatments such as ozonized gels and probiotics have also demonstrated antimicrobial and biofilm-modulating effects in recent studies [54], offering additional strategies to support personalized hygiene protocols.
Several limitations should be acknowledged. First, although this within-subject design enhances internal validity by reducing inter-individual variability, the lack of a non-aligner control group limits our ability to distinguish aligner-induced effects from natural microbial fluctuations. Second, the sample size was modest, and all participants were healthy women aged 20–35 years, which may restrict the generalizability of the findings to broader populations. Third, the study did not evaluate salivary flow rate or biochemical markers, which are known to influence pH dynamics and microbial composition [38]. Fourth, the use of 16S rRNA sequencing limits taxonomic resolution and does not capture fungal or viral components of the oral microbiome [21].
While our findings reflect short-term responses under controlled conditions, evidence from longer wear periods suggests additional microbial and material‐level effects. Extended aligner use (> 24 h) drives biofilm maturation and ecological succession [56], with Caccianiga et al. [58]—in a pilot study on orthodontic patients (aligner group n = 25, mean cohort age 21.5 years) primarily using phase-contrast microscopy as part of a home hygiene evaluation—reporting significant rises in Porphyromonas gingivalis and Prevotella intermedia after two months of wear. Prolonged use also accelerates material degradation—manifesting as increased surface roughness and microstructural fatigue [59]—underscoring the need for longitudinal studies that track both microbial dynamics and mechanical performance over clinically relevant timeframes. Moreover, validation in larger, more diverse cohorts is essential, as our focus on healthy women aged 20–35 years may limit generalizability; host factors such as sex, age, immune status, and systemic health can influence oral microbiome dynamics [62], and future work should explore these variables to advance personalized, microbiome-informed strategies.
Conclusions
This study reveals that clear aligner materials exert distinct, site-specific effects on the oral microbiome during early wear. PETG induced an earlier salivary pH drop at T4, while TPU exhibited a delayed but sustained drop between T8 and T12; notably, salivary pH remained above 7.0 in both groups throughout the 24-h period. In the aligner microbiomes, TPU triggered late-phase restructuring from T12 to T24, marked by the enrichment of acid-tolerant anaerobes such as Prevotella and Porphyromonas. PETG, in contrast, induced earlier and more transient shifts between T8 and T12, with moderate Porphyromonas enrichment following initial acidification. In the supragingival plaque, PETG led to compositional fluctuations at T8, including peaks in Streptococcus and Gemella, whereas TPU drove later changes from T12 to T24, reflected in observable fluctuations in the relative abundance of genera such as Veillonella, Leptotrichia, and Actinomyces. These findings underscore the ecological impact of aligner materials beyond initial wear and support the need for personalized material selection and hygiene protocols tailored to oral conditions and patient risk profiles. This study offers insights to inform next-generation antimicrobial aligner designs and care strategies.
Author contributions
T.G.: investigation, data curation, formal analysis, data interpretation, writing-original draft and visualization; J.Y.: data curation, formal analysis, data interpretation, and writing original draft; Y.Z.: data curation, formal analysis, writing-review and editing; C.M.:conceptualization, methodology, and supervision;B.Z.: supervision and funding acquisition.
Funding
This work was supported by Shanghai Municipal Health Commission (Grant No.202240182) and Shanghai Stomatological Hospital (SHH-2022-YJ-A01).
Data availability
The datasets in this study are available from the corresponding author Dr. Bingjiao Zhao (joyce_zhao_ortho@fudan.edu.cn) on reasonable request.
Declarations
Ethical approval and informed consent
The research was granted formal ethical approval by the Ethical Committee of the Shanghai Stomatological Hospital on December 28, 2022 (certificate number 2022–019). Verbal informed consent was obtained from all the participants.
Conflict of interests
The authors declare no competing interests.
Footnotes
Publisher's Note
Springer Nature remains neutral with regard to jurisdictional claims in published maps and institutional affiliations.
Contributor Information
Chuangchuang Mu, Email: muchuangchuang@fudan.edu.cn.
Bingjiao Zhao, Email: joyce_zhao_ortho@fudan.edu.cn.
References
- 1.Shokeen B, Viloria E, Duong E, Rizvi M, Murillo G, Mullen J et al (2022) The impact of fixed orthodontic appliances and clear aligners on the oral microbiome and the association with clinical parameters: a longitudinal comparative study. Am J Orthod Dentofacial Orthop 161:e475–e485. 10.1016/j.ajodo.2021.10.015 [DOI] [PubMed] [Google Scholar]
- 2.AlMogbel A (2023) Clear aligner therapy: Up to date review article. J Orthod Sci 12(1). 10.4103/jos.jos_30_23 [DOI] [PMC free article] [PubMed]
- 3.Rouzi M, Zhang X, Jiang Q, Long H, Lai W, Li X (2023) Impact of clear aligners on oral health and oral microbiome during orthodontic treatment. Int Dent J 73(5):603–611. 10.1016/j.identj.2023.03.012 [DOI] [PMC free article] [PubMed] [Google Scholar]
- 4.Bozkurt AP, Demirci M, Erdogan P, Kayalar E (2024) Comparison of microbial adhesion and biofilm formation on different orthodontic aligners. Am J Orthod Dentofacial Orthop. 10.1016/j.ajodo.2024.08.010 [DOI] [PubMed] [Google Scholar]
- 5.Dewhirst FE, Chen T, Izard J, Paster BJ, Tanner ACR, Yu W et al (2010) The human oral microbiome. J Bacteriol 192(19):5002–5017. 10.1128/jb.00542-10 [DOI] [PMC free article] [PubMed] [Google Scholar]
- 6.Baker JL, Welch JLM, Kauffman KM, McLean JS, He X (2023) The oral microbiome: diversity, biogeography and human health. Nat Rev Microbiol 22(2):89–104. 10.1038/s41579-023-00963-6 [DOI] [PMC free article] [PubMed] [Google Scholar]
- 7.Sedghi L, DiMassa V, Harrington A, Lynch SV, Kapila YL (2021) The oral microbiome: role of key organisms and complex networks in oral health and disease. Periodontol 2000 87(1):107–131.10.1111/prd.12393 [DOI] [PMC free article] [PubMed]
- 8.Pathak JL, Yan Y, Zhang Q, Wang L, Ge L (2021) The role of oral microbiome in respiratory health and diseases. Respir Med 185:106475. 10.1016/j.rmed.2021.106475 [DOI] [PubMed] [Google Scholar]
- 9.Kilian M, Chapple ILC, Hannig M, Marsh PD, Meuric V, Pedersen AML et al (2016) The oral microbiome – an update for oral healthcare professionals. Br Dent J 221(10):657–666. 10.1038/sj.bdj.2016.865 [DOI] [PubMed] [Google Scholar]
- 10.Rouzi M, Jiang Q, Zhang H, Li X, Long H, Lai W (2023) Characteristics of oral microbiota and oral health in the patients treated with clear aligners: a prospective study. Clin Oral Investig 27(11):6725–6734. 10.1007/s00784-023-05281-y [DOI] [PubMed] [Google Scholar]
- 11.Yan C, Kleiner C, Tabigue A, Shah V, Sacks G, Shah D et al (2023) PETG: applications in modern medicine. Eng Regen 5(1):45–55. 10.1016/j.engreg.2023.11.001 [Google Scholar]
- 12.Zheng J, Wang X, Zhang T, Jiang J, Wu J (2024) Comparative characterization of supragingival plaque microbiomes in malocclusion adult female patients undergoing orthodontic treatment with removable aligners or fixed appliances: a descriptive cross-sectional study. Front Cell Infect Microbiol 14. 10.3389/fcimb.2024.1350181 [DOI] [PMC free article] [PubMed]
- 13.Mummolo S, Nota A, Albani F, Marchetti E, Gatto R, Marzo G et al (2020) Salivary levels of Streptococcus mutans and Lactobacilli and other salivary indices in patients wearing clear aligners versus fixed orthodontic appliances: an observational study. PLoS One 15(4):e0228798. 10.1371/journal.pone.0228798 [DOI] [PMC free article] [PubMed] [Google Scholar]
- 14.Tektas S, Thurnheer T, Eliades T, Attin T, Karygianni L (2020) Initial bacterial adhesion and biofilm formation on aligner materials. Antibiotics (Basel) 9(12):908. 10.3390/antibiotics9120908 [DOI] [PMC free article] [PubMed] [Google Scholar]
- 15.Hamdoon SM, Al-Samak S, Ahmed MK, Gasgoos S (2022) Evaluation of biofilm formation on different clear orthodontic retainer materials. J Orthod Sci 11:34. 10.4103/jos.jos_7_22 [DOI] [PMC free article] [PubMed] [Google Scholar]
- 16.Moradinezhad M, Abbasi Montazeri E, Hashemi Ashtiani A, Pourlotfi R, Rakhshan V (2023) Biofilm formation of Streptococcus mutans, Streptococcus sanguinis, Staphylococcus aureus, Lactobacillus casei, and Candida albicans on five thermoformed and 3D-printed orthodontic clear aligner and retainer materials at three time points: an in vitro study. BMC Oral Health 23(1):215. 10.1186/12903-023-03024-6 [DOI] [PMC free article] [PubMed] [Google Scholar]
- 17.Krishnakumaran M, Mahalingam J, Arumugam S, Prabhu D, Parameswaran TM, Krishnan B (2023) Evaluation of the effect of nanocoating on mechanical and biofilm formation in thermoplastic polyurethane aligner sheets. Contemp Clin Dent 14(4):272–276. 10.4103/ccd.ccd_143_23 [DOI] [PMC free article] [PubMed] [Google Scholar]
- 18.Daniele V, Macera L, Taglieri G, Spera L, Marzo G, Quinzi V (2021) Color stability, chemico-physical and optical features of the most common PETG and PU based orthodontic aligners for clear aligner therapy. Polymers 14(1):14. 10.3390/polym14010014 [DOI] [PMC free article] [PubMed] [Google Scholar]
- 19.Kwok M, Porto B, Mohebi S, Zhu L, Hans M (2021) Physical and chemical properties of five different clear thermoplastic materials. J Appl Polym Sci 139(15). 10.1002/app.51957
- 20.Yang X, Que G (2020) Advance in study on 16S rRNA gene sequencing technology in oral microbial diversity. Zhonghua Kou Qiang Yi Xue Za Zhi 45(7):849–855. 10.11817/j.issn.1672-7347.2020.190236 [DOI] [PubMed]
- 21.Kumar PS, Mason MR, Brooker MR, O’Brien K (2023) Critical review of 16S rRNA gene sequencing workflow in oral microbiome studies. Oral Microbiol Immunol 38(1):e12434. 10.1111/omi.12434 [Google Scholar]
- 22.Rosier BT, Marsh PD, Mira A (2018) Resilience of the oral microbiota in health: mechanisms that prevent dysbiosis. J Dent Res 97(4):371–380. 10.1177/0022034517742139 [DOI] [PubMed] [Google Scholar]
- 23.Valm AM (2019) The structure of dental plaque microbial communities in the transition from health to dental caries and periodontal disease. J Mol Biol 431(16):2957–2969. 10.1016/j.jmb.2019.05.016 [DOI] [PMC free article] [PubMed] [Google Scholar]
- 24.Yu JC, Khodadadi H, Baban B (2019) Innate immunity and oral microbiome: a personalized, predictive, and preventive approach to the management of oral diseases. EPMA J 10(1):43–50. 10.1007/s13167-019-00163-4 [DOI] [PMC free article] [PubMed] [Google Scholar]
- 25.Belibasakis GN, Bostanci N, Marsh PD, Zaura E (2019) Applications of the oral microbiome in personalized dentistry. Arch Oral Biol 104:7–12. 10.1016/j.archoralbio.2019.05.023 [DOI] [PubMed] [Google Scholar]
- 26.Glurich I, Acharya A, Brilliant MH, Shukla SK (2015) Progress in oral personalized medicine: contribution of ‘omics.’ J Oral Microbiol 7:28223. 10.3402/jom.v7.28223 [DOI] [PMC free article] [PubMed] [Google Scholar]
- 27.Guo R, Lin Y, Zheng Y, Li W (2018) Profiling of subgingival plaque biofilm microbiota in female adult patients with clear aligners: a three-month prospective study. Am J Orthod Dentofacial Orthop 153(6):814–822. 10.1016/j.ajodo.2017.10.021 [DOI] [PMC free article] [PubMed] [Google Scholar]
- 28.Cameron SJS, Huws SA, Hegarty MJ, Smith DPM, Mur LAJ (2015) The human salivary microbiome exhibits temporal stability in bacterial diversity. FEMS Microbiol Ecol 91(9):fiv091. 10.1093/femsec/fiv091 [DOI] [PubMed]
- 29.Hong B-Y, Driscoll M, Gratalo D, Jarvie T, Weinstock GM (2024) Improved DNA extraction and amplification strategy for 16S rRNA gene amplicon-based microbiome studies. Int J Mol Sci 25(5):2966. 10.3390/ijms25052966 [DOI] [PMC free article] [PubMed] [Google Scholar]
- 30.Han H, Lee H-J, Kim K-S, Chung J, Na HS (2024) Comparison of the performance of MiSeq and NovaSeq in oral microbiome study. J Oral Microbiol 16(1):2344293. 10.1080/20002297.2024.2344293 [DOI] [PMC free article] [PubMed] [Google Scholar]
- 31.Callahan BJ, McMurdie PJ, Rosen MJ, Han AW, Johnson AJ, Holmes SP (2016) DADA2: high-resolution sample inference from Illumina amplicon data. Nat Methods 13(7):581–583. 10.1038/nmeth.3869 [DOI] [PMC free article] [PubMed] [Google Scholar]
- 32.Shapiro SS, Wilk MB (1965) An analysis of variance test for normality (complete samples). Biometrika 52(3/4):591–611. 10.1093/biomet/52.3-4.591 [Google Scholar]
- 33.Snedecor GW, Cochran WG (1989) Statistical methods, 8th edn. Iowa State University Press, Ames [Google Scholar]
- 34.Holm S (1979) A simple sequentially rejective multiple test procedure. Scand J Stat 6(2):65–70. Https://www.jstor.org/stable/4615733
- 35.Lozupone CA, Knight R (2005) UniFrac: a new phylogenetic method for comparing microbial communities. Appl Environ Microbiol 71(12):8228–8235. 10.1128/AEM.71.12.8228-8235.2005 [DOI] [PMC free article] [PubMed] [Google Scholar]
- 36.Anderson MJ (2001) A new method for non-parametric multivariate analysis of variance. Austral Ecol 26(1):32–46. 10.1111/j.1442-9993.2001.01070.pp.x [Google Scholar]
- 37.Bolyen E, Rideout JR, Dillon MR, Bokulich NA, Abnet CC, Al-Ghalith GA et al (2019) Reproducible, interactive, scalable and extensible microbiome data science using QIIME 2. Nat Biotechnol 37(8):852–857. 10.1038/s41587-019-0209-9 [DOI] [PMC free article] [PubMed] [Google Scholar]
- 38.Pedersen AML, Belstrøm D (2019) The role of natural salivary defences in maintaining a healthy oral microbiota. J Dent 80:S3–S12. 10.1016/j.jdent.2018.08.010 [DOI] [PubMed] [Google Scholar]
- 39.Yan D, Liu Y, Che X, Mi S, Jiao Y, Guo L, Li S (2021) Changes in the microbiome of the inner surface of clear aligners after different usage periods. Curr Microbiol 78(2):566–575. 10.1007/s00284-020-02308-5 [DOI] [PubMed] [Google Scholar]
- 40.Abranches J, Zeng L, Kajfasz JK, Palmer SR, Chakraborty B, Wen ZT et al (2018) Biology of oral Streptococci. Microbiol Spectr 6(5):10. 10.1128/microbiolspec.gpp3-0042-2018 [DOI] [PMC free article] [PubMed] [Google Scholar]
- 41.Hajishengallis G, Lamont RJ (2021) Polymicrobial synergy and dysbiosis in inflammatory disease. Trends Mol Med 27(5):430–440. 10.1016/j.molmed.2021.01.004 [DOI] [PMC free article] [PubMed] [Google Scholar]
- 42.Kahharova D, Pappalardo VY, Buijs MJ, de Menezes RX, Peters M, Jackson R et al (2023) Microbial indicators of dental health, dysbiosis, and early childhood caries. J Dent Res 102(7):759–766. 10.1177/00220345231160756 [DOI] [PMC free article] [PubMed] [Google Scholar]
- 43.da Costa RT, de Almeida NA, Azcarate-Peril MA, Divaris K, Wu D, Cho H et al (2021) The bacterial microbiome and metabolome in caries progression and arrest. J Oral Microbiol 13(1):1886748. 10.1080/20002297.2021.1886748 [DOI] [PMC free article] [PubMed] [Google Scholar]
- 44.Ye Q, Zhao Y, Zhao J, Ouyang Z, Feng Y, Hu J et al (2024) Prevotella, a dominant bacterium in young people with stage III periodontitis, related to the arachidonic acid metabolism pathway. Microbes Infect 26(4):105316. 10.1016/j.micinf.2024.105316 [DOI] [PubMed] [Google Scholar]
- 45.Bor B, Bedree JK, Shi W, McLean JS, He X (2019) Saccharibacteria (TM7) in the human oral microbiome. J Dent Res 98(5):500–509. 10.1177/0022034519831671 [DOI] [PMC free article] [PubMed] [Google Scholar]
- 46.Chipashvili O, Utter DR, Bedree JK, Ma Y, Schulte F, Mascarin G et al (2021) Episymbiotic Saccharibacteria suppress gingival inflammation and bone loss in mice through host bacterial modulation. Cell Host Microbe 29(11):1649-1662.e7. 10.1016/j.chom.2021.09.009 [DOI] [PMC free article] [PubMed] [Google Scholar]
- 47.Rego RO, Oliveira CA, dos Santos-Pinto A et al (2010) Clinical and microbiological studies of children and adolescents receiving orthodontic treatment. Am J Dent 23(6):317–323 [PubMed] [Google Scholar]
- 48.Wang Q, Ma JB, Wang B, Zhang X, Yin YL, Bai H et al (2019) Alterations of the oral microbiome in patients treated with the Invisalign system or fixed appliances. Am J Orthod Dentofacial Orthop 156(5):633–640. 10.1016/j.ajodo.2018.11.017 [DOI] [PubMed] [Google Scholar]
- 49.Cenzato N, Di Iasio G, Carreras-Presas CM, Caprioglio A, Del Fabbro M et al (2024) Materials for clear aligners—a comprehensive exploration of characteristics and innovations: a scoping review. Appl Sci 14(15):6533. 10.3390/app14156533 [Google Scholar]
- 50.De-La-Pinta I, Cobos M, Ibarretxe J, Montoya E, Eraso E, Guraya T et al (2019) Effect of biomaterials hydrophobicity and roughness on biofilm development. J Mater Sci Mater Med 30(7). 10.1007/s10856-019-6281-2 [DOI] [PubMed]
- 51.Bonafé AC, Oliveira DFLM et al (2023) Microbiological evaluation in invisible aligner chemical cleaning methods against Candida albicans and Streptococcus mutans. Am J Orthod Dentofacial Orthop 164(2):e43–e50. 10.1016/j.ajodo.2023.02.015 [DOI] [PubMed] [Google Scholar]
- 52.Lombardo L, Martini M et al (2017) Comparative SEM analysis of nine F22 aligner cleaning strategies. Prog Orthod 18(1):26. 10.1186/s40510-017-0181-2 [DOI] [PMC free article] [PubMed] [Google Scholar]
- 53.Charavet C, Gourdain Z et al (2022) Cleaning and disinfection protocols for clear orthodontic aligners: a systematic review. Healthcare 10(2):340. 10.3390/healthcare10020340 [DOI] [PMC free article] [PubMed] [Google Scholar]
- 54.Colombo M, Gallo S, Garofoli A, Poggio C, Arciola CR et al (2021) Ozone gel in chronic periodontal disease: a randomized clinical trial on the anti-inflammatory effects of ozone application. Biol (Basel) 10(7):625. 10.3390/biology10070625 [DOI] [PMC free article] [PubMed] [Google Scholar]
- 55.Karatas O, Delikan E, Erturk Avunduk AT et al (2024) Comparative evaluation of probiotic solutions on surface roughness and microhardness of different restorative materials and enamel. J Clin Pediatr Dent 48(3):107–119. 10.22514/jocpd.2024.064 [DOI] [PubMed]
- 56.Song Z, Fang S, Guo T, Wen Y, Liu W et al (2024) The microbiome alterations of supragingival plaque among adolescents using clear aligners: a metagenomic sequencing analysis. Prog Orthod 25:48. 10.1186/s40510-024-00547-x [DOI] [PMC free article] [PubMed] [Google Scholar]
- 57.Caccianiga G, Mandelli G, Gianolio A, Piras V, Deidda G, Patti A et al (2021) Impact of clear aligners on salivary and plaque microbiota: a prospective clinical study. Appl Sci 11(15):6758. 10.3390/app11156758 [Google Scholar]
- 58.Caccianiga P, Nota A, Tecco S, Caruso S, Dallatana G, Baldini A et al (2022) Microbiological and clinical effects of wearing clear aligners for 2 months: a pilot study. Healthcare (Basel) 10(11):2255. 10.3390/healthcare10112255 [DOI] [PMC free article] [PubMed] [Google Scholar]
- 59.Bucci R, Rongo R, Levatè C, Michelotti A, Barone S, D’Antò V et al (2019) Thickness changes of orthodontic aligners after thermoforming and after 10 days of intraoral exposure: a prospective clinical study. Prog Orthod 20(1):36. 10.1186/s40510-019-0289-6 [DOI] [PMC free article] [PubMed] [Google Scholar]
- 60.Barreda GJ, Dzierewianko EA, Andreatta M, Bellisario A, Saavedra R, Freddi A et al (2017) SEM evaluation of surface wear on orthodontic attachments in patients wearing Invisalign aligners for 6 months. J Oral Res 6(2):47–53. 10.17126/joralres.2017.015
- 61.Li M, Yang Z, Li X, Lin Y, Zhao Q, Hu H et al (2024) Surface wear of attachments in patients during clear aligner therapy: a prospective clinical study. Prog Orthod 25(1):1–10. 10.1186/s40510-024-00590-7 [DOI] [PMC free article] [PubMed] [Google Scholar]
- 62.Yano H, Lee JY, Gomez JM et al (2020) Differences in oral microbial composition by gender, age, and medical condition: a population-based cross-sectional study. Sci Rep 10:10466. 10.1038/s41598-020-67298-z32591569 [Google Scholar]
Associated Data
This section collects any data citations, data availability statements, or supplementary materials included in this article.
Data Availability Statement
The datasets in this study are available from the corresponding author Dr. Bingjiao Zhao (joyce_zhao_ortho@fudan.edu.cn) on reasonable request.