Abstract
Although a role for the gastric and intestinal mucosa in molecular sensing has been known for decades, the initial molecular recognition events that sense the chemical composition of the luminal contents has remained elusive. Here we identified putative taste receptor gene transcripts in the gastrointestinal tract. Our results, using reverse transcriptase–PCR, demonstrate the presence of transcripts corresponding to multiple members of the T2R family of bitter taste receptors in the antral and fundic gastric mucosa as well as in the lining of the duodenum. In addition, cDNA clones of T2R receptors were detected in a rat gastric endocrine cell cDNA library, suggesting that these receptors are expressed, at least partly, in enteroendocrine cells. Accordingly, expression of multiple T2R receptors also was found in STC-1 cells, an enteroendocrine cell line. The expression of α subunits of G proteins implicated in intracellular taste signal transduction, namely Gαgust, and Gαt-2, also was demonstrated in the gastrointestinal mucosa as well as in STC-1 cells, as revealed by reverse transcriptase–PCR and DNA sequencing, immunohistochemistry, and Western blotting. Furthermore, addition of compounds widely used in bitter taste signaling (e.g., denatonium, phenylthiocarbamide, 6-n-propil-2-thiouracil, and cycloheximide) to STC-1 cells promoted a rapid increase in intracellular Ca2+ concentration. These results demonstrate the expression of bitter taste receptors of the T2R family in the mouse and rat gastrointestinal tract.
Keywords: stomach‖intestine‖gustducin‖transducin
The gustatory system has been selected during evolution to detect nutritive and beneficial compounds as well as harmful or toxic substances (1, 2). In particular, bitter taste has evolved as a central warning signal against the ingestion of potentially toxic substances (3). Recently, a large family of bitter taste receptors (T2Rs) expressed in specialized neuroepithelial taste receptor cells organized within taste buds in the tongue has been identified in humans and rodents (4–6). These putative taste receptors, which belong to the guanine nucleotide-binding regulatory protein (G protein)-coupled receptor superfamily characterized by seven putative transmembrane domains, are distantly related to V1R vomeronasal receptors and opsins (5). Genetic and biochemical evidence indicate that specific Gα subunits, gustducin (Gαgust) and transducin (Gαt), mediate bitter and sweet gustatory signals in the taste buds of the lingual epithelium (7–11).
Outside the tongue, expression of Gαgust also has been localized to gastric (12) and pancreatic (13) cells, suggesting that a taste-sensing mechanism also may exist in the gastrointestinal (GI) tract. However, not all cells that express Gαgust also coexpress members of the T2R family of receptors (5). For example, most Gαgust-positive taste receptor cells in the lingual fungiform papillae are T2R-negative, implying that Gαgust also could mediate signaling through other receptors (9). To establish that the gastric and intestinal mucosa play a role in molecular sensing and to unravel the signaling mechanisms involved, it is of critical importance to identify taste receptor gene transcripts in the lining of the stomach or intestine.
In view of the importance of chemical sensing in food intake, digestion, and poison rejection, we determined whether bitter taste receptors are expressed in the GI tract. In the present study, we demonstrate the expression of multiple bitter taste receptors of the T2R family as well as Gαgust and Gαt-2 in rat and mouse stomach and small intestine. We also found expression of multiple T2Rs family members, Gαgust and Gαt-2, in the mouse intestinal endocrine tumor cell line STC-1. Stimulation of these cells with bitter-tasting compounds including denatonium, phenylthiocarbamide, 6-n-propil-2-thiouracil, or cycloheximide induced rapid intracellular Ca2+ signaling. The identification of chemosensory receptors in the stomach and intestine that perceive chemical components of ingested substances including drugs and toxins has important implications for understanding molecular sensing in the GI tract and for developing novel therapeutic compounds that modify the function of these receptors in the gut.
Materials and Methods
Cell Lines.
The intestinal STC-1 cell line, a gift from D. Hanahan (University of California, San Francisco), was derived from an endocrine tumor that developed in the small intestine of a double transgenic mouse expressing the rat insulin promoter linked to the simian virus 40 large T antigen and to the polyomavirus small T antigen, respectively (14). The culture medium consisted of DMEM supplemented with 5% FBS and antibiotics (100 units/ml penicillin plus 50 mmol/liter streptomycin). Swiss 3T3 fibroblasts and IEC-6 and IEC-18 cells were cultured in DMEM supplemented with 10% FBS, as described (15, 16).
Tissues, cDNA, and Genomic DNA Library.
Mouse (C57BL/[6]) tissues were collected from stomach (antrum and fundus), duodenum, jejunum, ileum, colon, heart, kidney, liver, and tongue. Rat (Sprague–Dawley) tissues were collected from stomach, duodenum, liver, kidney, and submandibular gland.
Collagenase-dispersed rat gastric endocrine cells were isolated by elutriation and enriched by density gradient centrifugation. Poly(A)+ RNA was extracted from pooled cell pellet (>108 cells), and gastric endocrine cell markers including somatostatin and histidine decarboxylase were verified by reverse transcriptase–PCR (RT-PCR). A cDNA expression library was prepared from size-fractionated poly(A)+ RNA by using λ ZAP-CMV XR vector (Stratagene). Mouse genomic DNA clones were obtained by PCR screening of two bacterial artificial chromosome mouse ES-129/SvJ genomic DNA libraries (release version I and II, Incyte Genomics, St. Louis, MO).
Design of Oligonucleotide Primers.
Transducin primers were designed based on the consensus sequence encoding the C-terminal 114 aa of human and mouse rod and cone transducins. Gustducin primers were synthesized based on published rat sequence (GenBank accession no. X65747). Intron-spanning β-actin primers (forward: TTGTAACCAACTGGGACGATATGG; reverse: GATCTTGATCTTCATGGTGCTAGG) (CLONTECH) were used to amplify a control transcript of 764 bp.
Our strategy to detect expression of taste receptor-related sequences in the lining of the stomach and small intestine was to use RT-PCR with either degenerate or specific oligonucleotide primers based on published T1R (17), T2R (4, 5), and TRB (6) sequences. Degenerate primers were designed from the conserved regions in TM2 (forward primers) and TM6 or TM7 (reverse primers) of each taste receptor gene family. For T1R, primer sequences were: TM-2, ACCTCWTSCARGCCATGCG; TM-7, CTKGAAGGCRAYGCAGATG. For T2R, primer sequences were: TM-2, GGYYTNGSNAYNWSNMRNDT; TM-7, GBHNYKNYKNAGNBKNBDRT. For TRB, primer sequences were: TM-2, CTGCYCTGGCCATCTCCAG; TM-6, TGCARGSCYYTDATRTGGGC. Specific primers also were synthesized from the similar regions based on published sequences in the National Center for Biotechnology Information database except for rT2R10, which was reported only as a partial sequence (Table 1, which is published as supporting information on the PNAS web site, www.pnas.org).
RT-PCR and DNA Sequencing.
RT-PCR was performed on 0.1 μg of poly(A)+ RNA isolated by a oligo(dT) cellulose spin column (FastTrack 2.0 Kit, Invitrogen). First-strand cDNA was synthesized by oligo(dT) priming using Superscript RT (Invitrogen). PCR was performed by using degenerate or specific oligonucleotide primers derived from rat or mouse T2R receptor sequences. Reactions were performed in Taq+ DNA polymerase (Stragtagene) in high-salt buffer containing 200 μM of each dNTP and 50 pmol of each primer pair. After 1 min at 94°C, 30 cycles were performed at 92°C for 1 min, 57°C for 1 min, 72°C for 2 min, followed by a final extension step at 72°C for 10 min. Sequences of all PCR products were confirmed by DNA sequencing, which was performed by a thermo-cycling protocol and subsequently analyzed on an automatic DNA sequencer (model 377, Applied Biosystems). clustalw alignment and DNA sequence search and analysis were performed with macvector software (version 6.5, Accelrys, San Diego).
Immunohistochemistry.
Animals were anesthetized with halothane and cardioperfused with PBS followed by 4% paraformaldehyde (PFA) in PBS. Stomachs were removed, postfixed in 4% PFA overnight, trimmed, and embedded in paraffin blocks. Four-micrometer sections were cut and stained with hematoxylin/eosin.
For immunohistochemistry, deparaffinized sections were used. Unmasking was carried out by steaming the sections for 20 min. After inhibition of endogenous peroxidase with hydrogen peroxide and incubation with normal goat serum, the primary antibodies were applied (Gαgust and Gαt-2, Santa Cruz Biotechnology) at a 1:50 dilution. After washing, the secondary antibody (biotinylated goat anti-rabbit IgG 1:200, Vector Laboratories) was applied, and the sections were then incubated with avidin/biotinilated horseradish peroxidase. Development was done with diaminobenzidine nickel or 3-amino-9-ethylcarbazole substrate kits for peroxidase (SK 4100 and SK 4200, Vector Laboratories). Sections were then counterstained with hematoxilin and mounted routinely.
Western Blot Analysis.
STC-1 cells were lysed in 2× SDS-polyacrylamide gel electrophoresis sample buffer (20 mM Tris⋅HCl, pH 6.8/6% SDS/2 mM EDTA/4% 2-mercaptoethanol/10% glycerol) and boiled for 10 min. After SDS/PAGE, proteins were transferred to Immobilon-P membranes as described (31) and blocked by overnight incubation with 5% nonfat dried milk in PBS, pH 7.2. Membranes were incubated at room temperature for 2 h with antisera specifically recognizing either Gαgust or Gαt-2 (Santa Cruz Biotechnology) in PBS containing 3% nonfat dried milk. Immunoreactive bands were visualized by using horseradish peroxidase-conjugated anti-rabbit IgG and enhanced chemiluminescence methods.
Calcium Imaging Analysis.
STC-1 cells grown on coverslips were washed twice with PBS (pH 7.2) and then incubated in PBS containing 5 μM Fura-2 AM (fura-2-tetra-acetoxy methyl ester; Molecular Probes) for 45–60 min at 37°C. Coverslips were washed with prewarmed PBS followed by mounting in an experimental chamber (volume 0.5 ml) with continuous perfusion by heated PBS (1 ml/min) at 37°C. The chamber in turn was placed on the stage of an inverted microscope (Zeiss TV100) to which a digital imaging system (Attofluor, Atto Instruments, Rockville, MD) with associated software (ratiovision) was attached. Ratio images (expressed as I340 nm/I380 nm, where I is intensity) were obtained about 1 per sec, and the average ratio values from selected regions (10 μm2) of single cells were stored for offline analysis. Ratio values were converted to Ca2+ concentrations by using a series of calcium buffers containing Fura-2 AM to construct a standard curve.
Results
Expression of Gustducin (Gαgust) and Transducin (Gαt-2) in Rat and Mouse GI Tissues.
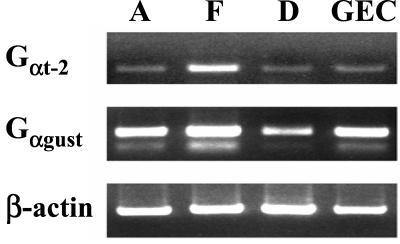
To examine Gαgust expression in the GI tract, reversed-transcribed mRNA isolated from rat antral, fundic, and duodenal mucosa was subjected to PCR using specific primers based on the rat Gαgust sequence (Table 1). A major PCR product of the predicted size (332 bp) was obtained from each of these tissues (Fig. 1). PCR amplification of a cDNA library enriched in rat gastric endocrine cells with the Gαgust-specific primers also produced a 332-bp fragment. Sequence analysis verified that these PCR products corresponded to amplified Gαgust. We confirmed the identity of gastric Gαgust by cloning and sequencing cDNA fragments encoding the entire ORF of Gαgust from the gastric endocrine cell cDNA library.
Figure 1.
Expression of Gαgust and Gt-2 in rat GI tissues and a gastric endocrine cell cDNA library. Consensus primers to amplify Gαgust and Gαt-2 were designed based on the published rat, mouse, and human sequences, as shown in Table 1. PCR amplification was performed on reverse-transcribed poly(A)+ RNA isolated from rat antrum (A), fundus (F), and duodenum (D), and on cDNA from a gastric endocrine cell library (GEC). The predicted sizes of the PCR products of Gαt-2 (Top) and Gαgust (Middle) are 340 bp and 332 bp, respectively. A cDNA fragment (764 bp) corresponding to β-actin was amplified as a control transcript from the respective cDNA sample (Bottom).
The α subunit of transducins 1 (Gαt-1) and 2 (Gαt-2), originally thought to be expressed only in photoreceptor cells of the retina, are also present in vertebrate taste cells where they are implicated in intracellular taste signal transduction (7,8). Here, we used RT-PCR and immunohistochemistry to determine whether the transducins also are expressed in the GI mucosa.
RT-PCR using primers based on the consensus sequence encoding the COOH-terminal 114 aa of human and mouse transducins (Table 1) detected Gαt-2 transcripts predominantly in the fundic mucosa (Fig. 1). Weaker RT-PCR signals also were obtained with RNA extracted from the gastric antrum and duodenum. In addition, Gαt-2 was detected in the cDNA library of rat gastric endocrine cells. In contrast, using the same conditions of RT-PCR, only faint signals corresponding to amplified Gαt-1 were obtained from fundus, antrum, duodenum, and the cDNA library of rat gastric endocrine cells. When RT-PCR for Gαt-1 was performed for 15 additional cycles, the predicted Gαt-1 product (340 bp) was detected only in the fundus, whereas an unspliced variant containing an additional 116-bp intron 7 (456 bp) was identified in the antrum (data not shown). These results indicate that, in addition to Gαgust, the transducins, especially Gαt-2, also are expressed in the gastrointestinal system.
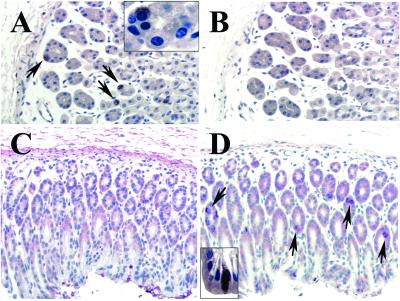
Whereas Gαgust transcripts were detected in the fundus and the antrum, Gαt-2 appeared to be present preferentially in the fundus, suggesting that these two Gα proteins might be expressed by different gastric cells. To examine this possibility, we determined the expression of the α subunits of these G proteins by immunohistochemistry using specific antibodies directed against unique amino acid sequences of Gαgust and Gαt-2 (see legends to Figs. 7 and 8, which are published as supporting information on the PNAS web site). We verified that these antibodies immunostained the taste buds of the lingual epithelium and the cones of the retina (Figs. 7 and 8). In sections of mouse fundic mucosa, Gαt-2 was localized to cells present in the base rather than the apical region of the glands (Fig. 2A). In the neck, only few scattered Gαt-2-positive cells were seen. Conversely, most Gαgust-positive cells of the fundus were located in the upper (neck) region of the glands, the isthmus, or the surface epithelium but not in the basal portion (Fig. 2B). Gαt-2-positive cells were found rarely in the antral mucosa whereas Gαgust-positive cells were abundant in that zone of the stomach (Fig. 2 C and D). Exposure of the Gαt-2 and Gαgust antibodies to the corresponding immunogenic peptides completely abolished immunostaining of the gastric epithelial cells (Figs. 7 and 8). As revealed by examination of serial sections, the distribution and morphology (see Fig. 2 A and D Insets) of Gαt-2-positive cells were clearly different from those of Gαgust-positive cells (Fig. 2). The findings presented in Figs. 1 and 2 indicate that Gαgust and Gαt-2 appear to be expressed by distinct epithelial cell types in the gastric mucosa.
Figure 2.
Immunostaining of Gαt-2 and Gαgust in mouse fundus (A and B) and antrum (C and D). (A) Immunostaining with antibody against Gαt-2 The base of the fundic glands is rich in positively stained cells (arrows) (×40). (Inset) Higher-power (×100) view of a gland showing that the stained cell is round, with a central or slightly eccentric nucleus and pale cytoplasm. (B) A consecutive section stained with antibody against Gαgust. There are no positive cells at this portion of the gland (×40). (C) Antral mucosa immunostained with antibody against Gαt-2. There are no positive cells (×40). (D) A consecutive section stained with antibody against Gαgust. Arrows point at some of the many positively stained cells (×40). (Inset) Higher-power (×100) view of a Gαgust-positive cell exhibiting an elongated shape with a luminal pole and a projection toward the basement membrane.
Identification of Putative Taste Receptor Transcripts in the Rat and Mouse Gastroenteric Mucosa.
Because gustducin and transducins, which are implicated in bitter taste receptor signal transduction, are expressed in the GI tract, our next step was to determine whether any member of the taste receptor families identified in taste cells of the lingual epithelium are also expressed in the gastric and duodenal mucosa. Initially, we searched for the expression of T1R (17), T2R (4, 5), and TRB (6) members by RT-PCR using degenerate primers designed for each gene family. We did not detect any transcripts of the T1R or TRB families in the mouse or rat gastric or duodenal mucosa. In striking contrast, PCR of reverse-transcribed mRNA using degenerate T2R-primers produced amplification products in the antrum, fundus, and duodenum.
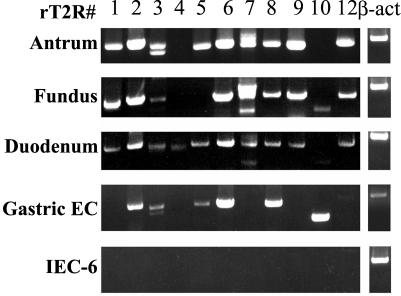
In view of these findings, we decided to examine the expression of 11 known rT2R subtypes (rT2R1 to 12, except for rT2R11, which is a pseudogene) in the rat antral, fundic, and duodenal tissues. RT-PCR using rat subtype-specific primers (Table 1) detected multiple T2R transcripts in rat antrum, fundus, and duodenum (Fig. 3). In addition, we found multiple T2R cDNA sequences in a highly enriched rat gastric endocrine cell cDNA library (Fig. 3). All amplified products were cloned and sequenced, confirming that they are identical to known taste receptor sequences. Interestingly, we noted some differences in the expression of the receptor subtypes. Whereas all receptor subtypes tested (T2R 1–12) were detected in the duodenum, T2R4 was absent from the stomach and T2R4 and T2R5 were not detected in the fundus. In addition, PCR amplification products corresponding to T2R2, T2R3, T2R5, T2R6, T2R8, T2R10, and T2R12 were generated from the rat gastric endocrine cell cDNA library. In contrast, RT-PCR using RNA isolated from liver, submandibular gland, heart, kidney, and brain as well as from the nondifferentiated intestinal epithelial cell line IEC-6 did not detect any of these transcripts (data not shown). These results revealed the selective expression of taste receptors of the T2R family in the rat gastric and duodenal mucosa.
Figure 3.
Expression of members of the rT2R family of receptors in rat gastric and duodenal mucosa. RT-PCR was performed by using specific primers for each of the 11 rT2R subtypes (Table 1) on poly(A)+ RNA isolated from rat antral, fundic, duodenal mucosa, and IEC-6 cells, and on cDNAs from a rat gastric endocrine cell cDNA library. PCR products were separated on 1% agarose gel containing ethidium bromide, and products of the predicted size (Table 1) for each rT2R subtype were subcloned and sequenced to verify their identity. Control transcript β-actin from the respective sample is shown in the far right lanes.
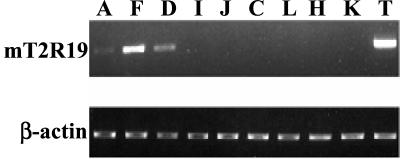
We also determined whether any of the known murine T2Rs are expressed in mouse gastric and duodenal tissues. RT-PCR and sequencing analysis indicated that transcripts corresponding to the T2R family members mT2R5 and mT2R19 were present in these upper GI tissues (Fig 4). To verify that the taste receptors expressed in the mouse gastroenteric mucosa are identical to those identified in taste cells from the lingual epithelium, we isolated the full-length cDNA of mT2R19 (≈1 kb) and mT2R5 (≈0.9 kb) from the gastric tissues and confirmed that their sequences were identical to those from the tongue. We also examined whether mT2R19, which was more abundant than mT2R5 in the stomach, was also expressed in other mouse tissues and cell lines. We detected transcripts of mT2R19 in the antrum, fundus, and duodenum as well as in the tongue but not in other tissues, including colon, liver, heart, and kidney (Fig. 4).
Figure 4.
Distribution of mT2R19 transcripts in mouse tissues. RT-PCR using mT2R19-specific primers (Table 1) was performed on cDNAs prepared from various mouse tissues. PCR products were separated on 1% agarose gel containing ethidium bromide, and the identity of the predicted mT2R19 cDNA fragment (698 bp) was confirmed by DNA sequencing. A: antrum; F: fundus; D: duodenum; I: ileum; J: jejunum; C: colon; L: liver; H: heart; K: kidney; T: tongue (Upper). As a control, β-actin from the respective samples was amplified (Lower).
Expression of Gαgust, Gαt-2, and T2R Family Members in STC-1 Cells.
The enteroendocrine cells play a critical role in the integration and coordination of multiple physiological functions in the GI tract including motility, release of GI hormones, and pancreatobiliary secretion. We hypothesized that these cells could play a role in sensing the chemical composition of the luminal contents. As a first step toward testing this hypothesis, we examined whether the intestinal STC-1 cell line, a mixed population of gut endocrine cells (14, 18), expresses members of the T2R family as well as α subunits of G proteins implicated in intracellular taste signal transduction.
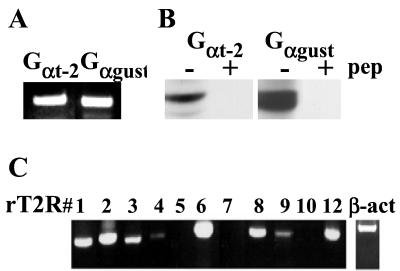
RT-PCR and sequencing revealed the presence of transcripts for Gαgust and Gαt-2 in STC-1 cells (Fig. 5A). Furthermore, Western blot analysis of STC-1 cell lysates using specific antibodies directed against Gαgust and Gαt-2 revealed immunoreactive bands of 42–46 kDa, which were extinguished by the presence of the immunogenic peptide (Fig. 5B). These results demonstrate that STC-1 cells express the α subunits of G proteins implicated in intracellular taste signal transduction and thus, prompted us to examine whether these enteroendocrine cells could also express bitter taste receptors.
Figure 5.
Expression of Gαt-2, Gαgust, and members of the T2R family in STC-1 cells. (A) RT-PCR analysis for the α subunits of Gt-2 and Ggust was performed on poly(A)+ RNA isolated from STC-1 cells. PCR products with the predicted size were subcloned and sequenced to confirm their identity. (B) Immunoblot analysis for Gαt-2 and Gαgust was performed on total protein extracts prepared from STC-1 cells. Normal or preabsorbed Gαt-2 and Gαgust-specific antibodies were used to detect the presence of these Gα subunits in STC-1 cell lysates by Western blotting. (C) RT-PCR analysis using rat T2R subtype-specific primers was performed on the same cDNAs used in the experiments described in A. PCR products corresponding to the predicted mT2Rs were subcloned and sequenced to confirm their relatedness to published rat and mouse sequences.
To test whether members of the T2R family are expressed in STC-1 cells, we initially used mouse T2R subtype-specific primers based on the available sequence of mT2R5, mT2R8, and mT2R19 (Table 1). RT-PCR and sequencing analysis revealed the presence of mT2R5 and mT2R19. The taste receptors from the STC-1 cells are identical to those from the taste cells, as shown by sequencing the cDNA encoding the full-length receptor proteins of mT2R19 and mT2R5 from these cells. In contrast, none of these transcripts were detected by RT-PCR using RNA isolated from mouse Swiss 3T3 fibroblasts.
To determine whether additional members of the bitter taste receptor family are expressed in STC-1 cells, rat T2R subtype-specific primers (Table 1) were used to amplify mouse STC-1 cell cDNA. RT-PCR and sequencing analysis demonstrated that STC-1 cells expressed mouse orthologs of rT2R1 (mT2R19), rT2R2 (mT2R23), rT2R3 (mT2R18), rT2R4 (mT2R7), rT2R6 (mT2R30), rT2R8 (mT2R2), rT2R9 (mT2R5), and rT2R12 (mT2R26) (Fig. 5C).
In some cases, multiple T2R sequences were obtained by using the same rat T2R primer pair (e.g., rT2R2, rT2R6, and rT2R8), suggesting that they may represent other closely related family members. To confirm the existence of these T2R genes, we used specific primers to amplify the mouse gene fragments from genomic DNA and to screen for these mouse genes in two genomic DNA libraries (bacterial artificial chromosome mouse ES-129/SvJ release version I and II, Incyte Genomics). Seven clones were obtained, and four mT2R genes (corresponding to STC-1 cDNA clones 9–1, 9–2, 9–7, and mT2R5) were found in these genomic DNA clones.
Predicted Partial and Complete Amino Acid Sequences from STC-1 cDNA and Genomic Clones.
Amino acid sequences were deduced from cDNA clones of STC-1 generated by RT-PCR with rat-specific primers (T2R1, T2R2, T2R3, T2R4, T2R6, T2R8, T2R9, and T2R12) or from the genomic clones isolated from the mouse genomic DNA libraries. This analysis revealed that mouse gene/cDNA 9–1 is a novel sequence related to mT2R23 and rT2R2 (84–85% homology) and also to the known partial sequence of rT2R10 (89% homology). Mouse gene corresponding to cDNA clone 9–1 was further characterized for its expression in mouse GI tissues and STC-1 cells. We found the presence of identical 9–1 transcripts by isolating cDNA that encodes the predicted full-length sequence of this member of the T2R family from fundic mucosa and STC-1 cells. The mouse gene corresponding to cDNA clone 9–2 was found to be related to mT2R23 with 11-aa substitutions, and the third mouse gene/cDNA 9–7 is almost identical to mT2R2 with only 2-aa changes.
Mouse cDNA clones 7–1 and 7–4 are rT2R6 orthologs generated from STC-1 by RT-PCR using rT2R6-specific primers. Both clone 7–1 and 7–4 encode partial T2R sequences (TM-2 to TM-7) that are closely related to mT2R30, with 85% and 95% homology, respectively.
Calcium Response of STC-1 Cells to Bitter Taste Substances.
Having demonstrated that STC-1 cells express Gαgust, Gαt-2, and multiple bitter taste receptors, our next step was to examine whether the addition of bitter taste compounds induces a functional response in these cells. Because of heterogeneity of the STC-1 cell population (18), we monitored responses in the intracellular Ca2+ concentration [Ca2+]i by using Ca2+ imaging of individual cells and tested the effect of several compounds widely used in bitter taste signaling.
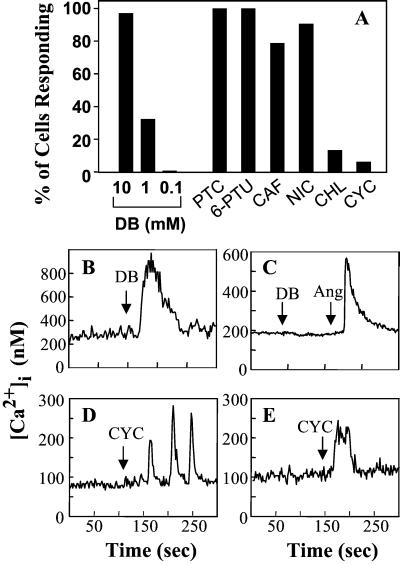
Addition of denatonium benzoate to cultures of STC-1 cells, loaded with the fluorescence Ca2+ indicator Fura-2 AM, induced a rapid and dose-dependent elevation in the [Ca2+]i measured either in individual cells (Fig. 6) or in cell populations (Fig. 9, which is published as supporting information on the PNAS web site). At 10 mM, denatonium induced a marked increase in [Ca2+]i in 97% of the cells examined, whereas at 1 mM this bitter tastant induced an increase in [Ca2+]i in 33% of the STC-1 population (Fig. 6). In contrast, denatonium, at similar concentrations, did not induce any change in [Ca2+]i in cells that do not express T2Rs, including intestinal epithelial cells (IEC-6 and IEC-18) or mouse Swiss 3T3 fibroblasts (Figs. 6 and 9). The concentrations of denatonium used in these experiments are similar to those used for eliciting second messenger changes (19) and ion channel activity (20) in taste tissues. A variety of other bitter substances including phenylthiocarbamide, 6-n-propil-2-thiouracil, caffeine, and nicotine also induced robust [Ca2+]i responses in STC-1 cells (Fig. 6).
Figure 6.
STC-1 cells respond to bitter tastant molecules with an increase in [Ca2+]i. The [Ca2+]i of individual cells was measured before and after exposure to single concentrations of bitter tastants. (A) Percent of cells that responded to each tastant: DB, denatonium benzoate at 10 mM (n = 160 cells), 1 mM (n = 98 cells), 0.1 mM (n = 82 cells); PTC, phenylathiocarbamide at 3 mM (n = 60 cells); 6-PTU, 6-n-propyl thiouracil at 1 mM (n = 63 cells); CAF, caffeine at 10 mM (n = 52); NIC, nicotine at 10 mM (n = 53 cells); CHL, chloroquine at 1 mM (n = 52 cells); CYC; cycloheximide at 50 μM (n = 538 cells). The values in parenthesis are the number of cells analyzed. (B) Typical individual trace of [Ca2+]i from a single STC-1 cell exposed to 10 mM denatonium benzoate (DB). (C) Typical individual trace of [Ca2+]i from a single IEC-6 cell exposed sequentially to 10 mM denatonium benzoate (DB) followed by 50 nM angiotensin II (Ang), added as a positive control. (D) Individual trace of [Ca2+]i from a single STC-1 cell exposed to 50 μM cycloheximide (CYC) that displayed an oscillatory response. (E) Individual trace of [Ca2+]i from a single STC-1 cell exposed to 250 μM cycloheximide (CYC) that displayed a peak and plateau response. The addition of the tastant or agonist is marked by the arrow.
Heterologous expression in HEK-293 cells of chimeric T2R receptors containing the NH2-terminal 39 aa of rhodopsin has demonstrated that mT2R-5 responds to cycloheximide, as shown by an increase in [Ca2+]i (4). Because a low level of mT2R5 expression also was detected in STC-1 cells, we determined whether cycloheximide stimulates a [Ca2+]i response in these cells. We found that addition of cycloheximide at 50 μM induced oscillatory changes in [Ca2+]i in a small subpopulation of STC-1 cells (Fig. 6). When cycloheximide was added at 250 μM, the responding cells exhibited an increase in [Ca2+]i with typical peak and plateau phases. In contrast, other bitter substances including atropine, caffeic acid, and epicatechin did not induce any detectable change in [Ca2+]i in STC-1 cells.
Discussion
Molecular sensing of the luminal contents of the GI tract not only regulates motility, release of GI hormones, and pancreatobiliary secretion, but it is also responsible for the detection of ingested drugs and toxins thereby initiating responses critical for survival. The enteroendocrine cells, which produce and release more than 20 identified hormones, are thought to play a critical role in the integration and coordination of these physiological responses (21). Although these fundamental control systems have been known for decades, the initial molecular recognition events that sense the chemical composition of the luminal contents have remained elusive.
The results presented here identify the presence of transcripts corresponding to the T2R family of bitter taste receptors in the antral and fundic gastric mucosa as well as in the lining of the duodenum. In addition, we detected cDNA clones of T2R receptors in a rat gastric endocrine cell cDNA library, suggesting that these receptors are expressed, at least in part, in enteroendocrine cells of the GI tract. In agreement with this hypothesis, we also found expression of multiple members of the T2R family of receptors in cultured STC-1 cells, an enteroendocrine cell line. These results provide compelling evidence demonstrating the expression of bitter taste receptors of the T2R family in the mouse and rat gastro-enteric system.
Our results also substantiate the expression of α subunits of G proteins implicated in intracellular taste signal transduction, namely Gαgust and Gαt-2, in the gastroenteric mucosa as well as in STC-1 cells, as revealed by RT-PCR and sequencing, immunohistochemistry, and Western blotting. In particular, our results indicate that Gαgust-positive cells in the stomach can be distinguished from cells expressing Gαt-2, as judged by cell morphology and distribution. These findings indicating the presence of Gαgust and Gαt-2 in gastric epithelial cells provide further support for the existence of chemosensory mechanisms in the postoral GI tract.
Having demonstrated that STC-1 cells express multiple bitter taste receptors as well as α subunits of G proteins that mediate taste signal transduction, we also examined whether exposure of these cells to bitter taste compounds initiates intracellular events that may lead to changes in their function. Specifically, activation of bitter taste receptors promotes the synthesis of second messengers leading to the release of Ca2+ from intracellular stores or modulates the gating of ion channels that mediate Ca2+ entry into the cell (1). The increase in [Ca2+]i in response to bitter tastants could trigger the release of signaling molecules that activate neural reflexes and/or modulate the activity of adjacent cells.
In the present study, we demonstrate that addition of compounds widely used in bitter taste signaling (e.g., denatonium, phenylthiocarbamide, 6-n-propil-2-thiouracil, and cycloheximide) to cultures of STC-1 cells promoted rapid [Ca2+]i responses in these cells. Given that at present there are not cultured cell model systems to study taste receptor-mediated signaling, our findings suggest that STC-1 cells may emerge as a cell model for studying T2R-mediated signal transduction.
The identification of chemosensory receptors in the stomach and intestine that perceive chemical components of ingested substances including drugs and toxins has a number of important implications including the design of novel molecules that modify responses initiated by activation of these receptors. For example, drugs and toxins initiate vomiting reflexes; several food components regulate appetite and satiety, alter motility of the stomach, and intestine and initiate neural and hormonal pathways necessary for normal digestive function. It is likely that the large family of chemosensory receptors that we identified in the stomach and intestine play a major role in mediating these responses.
A challenging question will be to elucidate whether taste reception in the postoral GI tract is integrated in the central nervous system with taste signals emanating from the lingual epithelium or are processed through an entirely different system (2). In the same context, it will be important to examine whether the behavioral effects of bitter compounds (e.g., conditioned taste avoidance) may be the consequence of a complex integration of stimuli, perceived not only at the taste buds but also by taste receptors expressed in the stomach and intestine. The identification of taste receptors in the gastric and duodenal mucosa opens new avenues for understanding molecular sensing and could pave the way for developing therapeutic compounds that modify the function of these receptors in the gut.
Supplementary Material
Acknowledgments
We acknowledge the contributions of John H. Walsh (who passed away on June 14, 2000) in the early stages of this work. We are grateful to Debbie Avedian and Long Sheng Hong for excellent technical assistance. This work was supported by National Institutes of Health Grants DK 17294, DK 56930, and DK 55003.
Abbreviations
- GI
gastrointestinal
- [CA2+]i
intracellular Ca2+ concentration
- RT-PCR
reverse transcriptase–PCR
Footnotes
References
- 1.Herness M S, Gilbertson T A. Annu Rev Physiol. 1999;61:873–900. doi: 10.1146/annurev.physiol.61.1.873. [DOI] [PubMed] [Google Scholar]
- 2.Katz D B, Nicolelis M A L, Simon S A. Am J Physiol. 2000;278:G6–G9. doi: 10.1152/ajpgi.2000.278.1.G6. [DOI] [PubMed] [Google Scholar]
- 3.Glendinning J I, Tarre M, Asaoka K. Behav Neurosci. 1999;113:840–854. [PubMed] [Google Scholar]
- 4.Chandrashekar J, Mueller K L, Hoon M A, Adler E, Feng L, Guo W, Zuker C S, Ryba N J P. Cell. 2000;100:703–711. doi: 10.1016/s0092-8674(00)80706-0. [DOI] [PubMed] [Google Scholar]
- 5.Adler E, Hoon M A, Mueller K L, Chandrashekar J, Ryba N J P, Zuker C S. Cell. 2000;100:693–702. doi: 10.1016/s0092-8674(00)80705-9. [DOI] [PubMed] [Google Scholar]
- 6.Matsunami H, Montmayeur J-P, Buck L B. Nature (London) 2000;404:601–604. doi: 10.1038/35007072. [DOI] [PubMed] [Google Scholar]
- 7.Ming D, Ruiz-Avila L, Margolskee R F. Proc Natl Acad Sci USA. 1998;95:8933–8938. doi: 10.1073/pnas.95.15.8933. [DOI] [PMC free article] [PubMed] [Google Scholar]
- 8.Ruiz-Avila L, McLaughlin S K, Wildman D, McKinnon P J, Robichon A, Spickofsky N, Margolskee R F. Nature (London) 1995;376:80–85. doi: 10.1038/376080a0. [DOI] [PubMed] [Google Scholar]
- 9.Wong G T, Gannon K S, Margolskee R F. Nature (London) 1996;381:796–800. doi: 10.1038/381796a0. [DOI] [PubMed] [Google Scholar]
- 10.Ming D, Ninomiya Y, Margolskee R F. Proc Natl Acad Sci USA. 1999;96:9903–9908. doi: 10.1073/pnas.96.17.9903. [DOI] [PMC free article] [PubMed] [Google Scholar]
- 11.Ruiz-Avila L, Wong G T, Damak S, Margolskee R F. Proc Natl Acad Sci USA. 2001;98:8868–8873. doi: 10.1073/pnas.151235798. [DOI] [PMC free article] [PubMed] [Google Scholar]
- 12.Hoefer D, Pueschel B, Drenckhahn D. Proc Natl Acad Sci USA. 1996;93:6631–6634. doi: 10.1073/pnas.93.13.6631. [DOI] [PMC free article] [PubMed] [Google Scholar]
- 13.Hoefer D, Drenckhahn D. Histochem Cell Biol. 1998;110:303–309. doi: 10.1007/s004180050292. [DOI] [PubMed] [Google Scholar]
- 14.Rindi G, Grant S G N, Yiangou Y, Ghatei M A, Bloom S R, Bautch V L, Solcia E, Polak J M. Am J Pathol. 1990;136:1349–1364. [PMC free article] [PubMed] [Google Scholar]
- 15.Chiu T, Rozengurt E. Am J Physiol. 2001;280:C929–C942. doi: 10.1152/ajpcell.2001.280.4.C929. [DOI] [PubMed] [Google Scholar]
- 16.Rozengurt E, Stroobant P, Waterfield M D, Deuel T F, Keehan M. Cell. 1983;34:265–272. doi: 10.1016/0092-8674(83)90157-5. [DOI] [PubMed] [Google Scholar]
- 17.Hoon M A, Adler E, Lindemeier J, Battey J F, Ryba N J P, Zuker C S. Cell. 1999;96:541–551. doi: 10.1016/s0092-8674(00)80658-3. [DOI] [PubMed] [Google Scholar]
- 18.Cheung A T, Dayanandan B, Lewis J T, Korbutt G S, Rajotte R V, Bryer-Ash M, Boylan M O, Wolfe M M, Kieffer T J. Science. 2000;290:1959–1962. doi: 10.1126/science.290.5498.1959. [DOI] [PubMed] [Google Scholar]
- 19.Yan W, Sunavala G, Rosenzweig S, Dasso M, Brand J G, Spielman A I. Am J Physiol. 2001;280:C742–C751. doi: 10.1152/ajpcell.2001.280.4.C742. [DOI] [PubMed] [Google Scholar]
- 20.Tsunenari T, Kurahashi T, Kaneko A. J Physiol (London) 1999;519:397–404. doi: 10.1111/j.1469-7793.1999.0397m.x. [DOI] [PMC free article] [PubMed] [Google Scholar]
- 21.Furness J B, Kunze W A A, Clerc N. Am J Physiol. 1999;277:G922–G928. doi: 10.1152/ajpgi.1999.277.5.G922. [DOI] [PubMed] [Google Scholar]
Associated Data
This section collects any data citations, data availability statements, or supplementary materials included in this article.


