

Abstract
The dynamic properties of the inositol (1,4,5)-trisphosphate (IP3) receptor are crucial for the control of intracellular Ca2+, including the generation of Ca2+ oscillations and waves. However, many models of this receptor do not agree with recent experimental data on the dynamic responses of the receptor. We construct a model of the IP3 receptor and fit the model to dynamic and steady-state experimental data from type-2 IP3 receptors. Our results indicate that, (i) Ca2+ binds to the receptor using saturating, not mass-action, kinetics; (ii) Ca2+ decreases the rate of IP3 binding while simultaneously increasing the steady-state sensitivity of the receptor to IP3; (iii) the rate of Ca2+-induced receptor activation increases with Ca2+ and is faster than Ca2+-induced receptor inactivation; and (iv) IP3 receptors are sequentially activated and inactivated by Ca2+ even when IP3 is bound. Our results emphasize that measurement of steady-state properties alone is insufficient to characterize the functional properties of the receptor.
Oscillations and waves in the concentration of free intracellular calcium (Ca2+) are seen in many cell types and are known to be an important intra- and intercellular signaling system. It is thus of interest to determine the mechanisms underlying such complex dynamic behavior. One of the most important of these mechanisms is the inositol trisphosphate receptor (IPR), which also functions as a Ca2+ channel. There is now a great deal of experimental evidence that in many cell types, oscillations and waves of Ca2+ are mediated in major part by the release through the IPR of Ca2+ from the endoplasmic reticulum, and that it is the modulation of the IPR by Ca2+ and by inositol (1,4,5)-trisphosphate (IP3) that causes such complex dynamic behavior (1–7).
Models of the IPR thus play a central role in models of Ca2+ oscillations and waves, and a number of such models have been constructed (8–15). Most of them assume that the IPR can be modulated by the binding of Ca2+ and IP3, and that Ca2+ plays a dual role, both activating and inactivating the IPR. However, recent experimental data are forcing us to reevaluate older models. One major problem with almost all older models of the IPR is that they assume that Ca2+ binds to the IPR with mass action kinetics, in which case the rate of IPR activation and inactivation increases approximately linearly with Ca2+ concentration ([Ca2+]). However, experiments show that as [Ca2+] varies over five orders of magnitude, the rate of IPR inactivation varies over approximately only a single order of magnitude (16–18). This discrepancy can be avoided if we assume that each transition between receptor states is modulated by Ca2+ but is more complex than just simple Ca2+ binding by mass action kinetics.
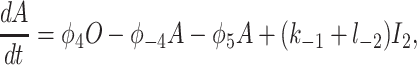
Consider, for example, the reaction scheme shown in Fig. 1. If we assume that à and Ā are in instantaneous equilibrium, we have cà = L1Ā, where L1 = l−1/l1, and c denotes [Ca2+]. Hence, letting A = Ā + Ã, we have dA/dt = (k−1 + l−2)I − φ(c)A, where φ(c) = c(k1L1+l2)/c+L1. Thus, this scheme is a simple way in which saturating binding kinetics can be incorporated into a model. It is similar to the Michaelis–Menten model of an enzyme-catalyzed reaction, in which a saturating reaction rate is obtained by assuming the existence of an intermediate complex. In this introductory model, the state Ā plays a role similar to that of the enzyme complex. By assuming that the original state à (analogous to the substrate) is in fast equilibrium with state Ā, we attain saturating kinetics of the Michaelis–Menten type.
Figure 1.

Reaction diagram of a Ca2+-dependent transition from state A to state I (c is Ca2+ concentration). If à and Ā are in equilibrium, and if A = Ā + Ã, then the upper reaction scheme is equivalent to the lower.
An IPR Model
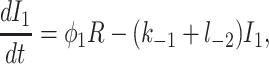
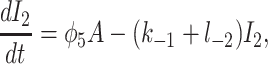
A diagram of the IPR model is given in Fig. 2. Although it appears to contain a multiplicity of states, there are specific reasons for each one. The background structure is simple. Ignoring the various tildes, hats, and primes, we see that a receptor, R, can bind Ca2+ and inactivate to state I1, or it can bind IP3 and open to state O. State O can then shut (state S) or bind Ca2+ and activate to state A. State A can then bind Ca2+ and inactivate to state I2. This structure is clearer in Fig. 3.
Figure 2.

The full IPR model. R, receptor; O, open; A, activated; S, shut; I, inactivated. c is [Ca2+]; p is [IP3].
Figure 3.

Simplified diagram of the IPR model. Given the fast equilibria described in the text, this diagram is equivalent to that in Fig. 2.
States R̄, Ō, Ā, and R′ are used to give Ca2+-dependent transitions that have saturable kinetics, as in the simple example of Fig. 1. These states will ultimately disappear, leaving behind only functions of c. Note that the inactivated states I1 and I2 both have Ca2+ bound to the same site, but I2 also has IP3 and one other Ca2+ ion bound. For simplicity, we assume that the rate of Ca2+ binding to the inactivating site is independent of whether IP3 is bound, or whether the receptor has been activated by Ca2+ (but see ref. 19 and later discussion). The R̄, R̃, Õ triangle models Ca2+-dependent binding of IP3; Ca2+ modulates the interconversion of the receptor between two states, each of which can bind IP3 with different kinetics. In type-3 IPR, Ca2+ enhances IP3 binding but inhibits IP3 binding in type-1 IPR (20–22). The reaction scheme shown here incorporates either possibility, depending on the parameter values. As we shall see, our model predicts that Ca2+ increases the rate of IP3 binding to type-2 IPR.
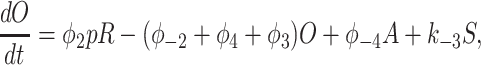
To derive the model equations, we first define Ki = k−i/ki and Li = l−i/li for every appropriate integer i. We also let c and p denote [Ca2+] and [IP3], respectively. Then, assuming that the transitions R̃ ⇄ R̄, Õ ⇄ Ō, à ⇄ Ā and R̃ ⇄ R′ are fast and in instantaneous equilibrium, we get cR̃ = L3R̄, cR̃ = L1R′, cÕ = L5Ō, and cà = L1Ā. We now define the new variables R = R̃ + R̄ + R′, O = Õ + Ō, A = à + Ā. Then
 |
 |
 |
 |
 |
where
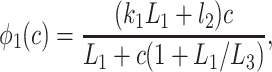 |
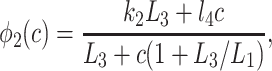 |
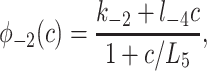 |
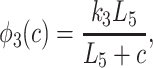 |
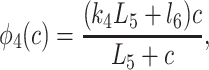 |
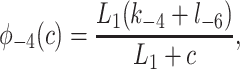 |
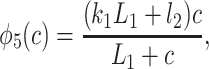 |
and where R + O + A + S + I1 + I2 = 1. Thus, given the fast equilibria above, Fig. 2 is equivalent to Fig. 3.
The model assumes that the binding of IP3 and Ca2+ is sequential, not independent. So, for instance, Ca2+ can bind to the activating site only after IP3 has bound. Other models have made similar assumptions (10–12, 14) but without the correct dynamic behavior. Experimental data (23) indicate that the binding of IP3 and Ca2+ are not independent events, with Ca2+ being unable to bind to the activating site until IP3 has first bound.
There are three inactivated states; I1, I2, and S. States I1 and I2 have a Ca2+ bound to the same inactivating site, but I2 also has IP3 bound and Ca2+ bound to the activating site. State I1 is necessary so that the receptor can inactivate in the absence of IP3 (16). State I2 is necessary so that an activated receptor may be inactivated by Ca2+. State S is necessary so that an open receptor can inactivate in the absence of Ca2+ (18, 23).
We assume the IP3 receptor consists of four independent and identical subunits and allows Ca2+ current when all four subunits are in state O, or all four are in state A, or some intermediate combination (for instance, when three are in state O, and one is in state A). Furthermore, we shall assume that the more subunits there are in state A, the greater the open probability of the receptor. With these assumptions, the open probability of the receptor is most conveniently written as (0.1O + 0.9A)4. The numbers 0.1 and 0.9 are not crucial. Similar fits, essentially identical to visual inspection and with only small changes in parameter values, are obtained by using, for instance, (0.1O + A)4 or (0.05O + 0.9A)4 as the open probability (computations not shown). We note that the receptor must be able to pass Ca2+ current when all four subunits are in the O state, as it is known to allow Ca2+ current even in the absence of cytosolic Ca2+ (7).
The model closely follows the ideas of Taylor (7, 19, 23). Once IP3 is bound, there is a competition between the intrinsic inactivation to state S and the Ca2+-induced activation to state A. It is broadly consistent also with the scheme proposed by Hajnóczky and Thomas (24), in which the binding of IP3 is modulated by Ca2+ binding, and binding of activating and inactivating Ca2+ happens sequentially. One difference between the model of ref. 24 and that presented here is that we assume that Ca2+ can bind directly to the inactivating site without first having to bind to the activating site. Another difference is that in ref. 24, the positive feedback action of Ca2+ on the receptor is mediated by the modulation of IP3 binding alone, with no contribution from an activating binding site. Although our model includes the modulation of IP3 binding by Ca2+, the excitable nature of Ca2+ release results from the activation by Ca2+ (i.e., the O to A transition).
One major difference between our model and that of Taylor (19) is that we assume that an inactivating Ca2+ can bind even when IP3 is already bound; i.e., the binding of IP3 offers no protection to the inactivating site, as proposed in ref. 19. If, following Taylor, we assume the reverse, that Ca2+ cannot inactivate an IPR that already has IP3 bound [i.e., we set φ5(c) 0], then we are unable to obtain acceptable fits to the dynamic data (computations not shown). Of course, we hasten to emphasize that this by no means rules out Taylor's hypothesis. We discuss this difference in more detail later.
Results and Discussion
The parameter values were determined by fitting the model to time courses of Ca2+ release from type-2 IPR at a fixed [Ca2+] and [IP3] (18) and to type-2 IPR steady-state data at a single [IP3] (25). For each time course (indexed by j), the net Ca2+ efflux (ej) is measured at a sequence of time points, ti. Dufour et al. (18) did not measure the receptor open probability directly but measured instead net Ca2+ release. This release will be proportional to the instantaneous open probability but with an unknown constant of proportionality. We made the simplest assumption, that this constant of proportionality is equal to one. To determine the objective function for each set of parameter values, we solved the differential equations (by using a forward Euler method with a time step of 0.001 s) to determine the model solution mj(ti) at each of these time points and for each time course. The objective function corresponding to the time courses is then ∑i,j(ej(ti) − mj(ti))2.
In addition to the sum of squares shown above, the objective function included a sum of squares of differences between the model steady state and the data of (25) from type-2 IPR. The steady-state data of ref. 25 have open probabilities that reach as high as 0.5, a figure inconsistent with our dynamic data, because in the dynamic responses the open probabilities reached after the initial peak are approximately a factor of 10 smaller than the peak values. This difference is not possible if the steady-state open probability reaches as high as 0.5. However, there is extreme variation in the published open probabilities of IPR, with peak values ranging from around 0.01 or less (27) to 0.5 or greater (25, 26, 28). The reasons for these differences are unclear. Thus, we chose to retain the qualitative nature of the type-2 IPR data of ref. 25 but to scale the data by a factor of 1/30 to force consistency with our dynamic data. We estimated the data of ref. 25 by eye from figure 7B (the curve labeled R-T2) of that paper.
A minimum of the objective function was then found by Powell's method (29). Typical parameters determined by the fit are shown in the caption to Fig. 4. The objective function was not sensitive to the precise parameter values. We also ensured that K1 = L1L2, K2 = L3L4, and K4 = L5L6, so that the reaction scheme satisfies detailed balance.
Figure 4.

(Upper) Data obtained from superfusion of 45Ca2+-loaded hepatic microsomes. At t = 0.10 μM, IP3 and the indicated [Ca2+] were added to the stimulus buffer and the Ca2+ flux measured as a function of time. Full details are given in ref. 18. (Lower) Ca2+ dose responses calculated from the model. Initial conditions were R = 1; all other receptor states were zero. At t = 0, 10 μM of IP3 was added, with the indicated Ca2+ concentrations. Best-fit parameter values are: k1 = 0.64s−1⋅μM−1, k−1 = 0.04 s−1, k2 = 37.4 s−1⋅μM−1, k−2 = 1.4 s−1, k3 = 0.11s−1⋅μM−1, k−3 = 29.8 s−1, k4 = 4 s−1⋅μM−1, k−4 = 0.54 s−1, L1 = 0.12 μM, L3 = 0.025 μM, L5 = 54.7 μM, l2 = 1.7 s−1, l4 = 1.7 s−1⋅μM−1, l6 = 4707 s−1, l−2 = 0.8 s−1, l−4 = 2.5 μM−1⋅s−1, and l−6 = 11.4 s−1.
Experimental and model Ca2+ dose responses are shown in Fig. 4. At t = 0, various concentrations of Ca2+ were added, all at [IP3] = 10 μM. These time courses are faster than those in ref. 23 but agree well with those of refs. 16 and 19; the experiments of ref. 23 were in permeabilized cells, whereas those of refs. 16 and 18 were in microsome preparations, which may explain these differences. Another possible explanation of these differences is the different loading state of the stores. Our time courses agree well also with those of ref. 17; Parker et al. used in vivo pulses of IP3 release in Xenopus oocytes to measure the rate of Ca2+ release as a function of time, although not at constant [Ca2+]. Experimental and model IP3 dose responses are shown in Fig. 5. At t = 0, IP3 was added at various concentrations, all at 0.4 μM Ca2+. As [IP3] increases, so does the response maximum. The model time courses show a clear latent period of around 20 ms before the open probability begins to rise, even at the highest [IP3], similar to that seen experimentally (17, 30, 31).
Figure 5.

(Upper) Data obtained from superfusion of 45Ca2+-loaded hepatic microsomes. At t = 00.4 μM, Ca2+ and the indicated [IP3] were added to the stimulus buffer and the Ca2+ flux measured as a function of time. Full details are given in ref. 18. (Lower) Model IP3 dose responses. Initial conditions were R = 1; all other receptor states were zero (i.e., low Ca2+, low IP3). At t = 00.4,μM Ca2+ was added, together with the indicated [IP3].
The steady-state open probability of the model for various [IP3] is shown in Fig. 6. At lower [IP3], the steady-state curve is not bell-shaped, and at all [IP3], the open probability remains nonzero as [Ca2+] gets large.
Figure 6.

Steady-state open probability of the IPR, measured at [IP3] = 0.02, 0.2, and 1 μM. The symbols are the experimental data of ref. 25, from type-2 IPR, measured at [IP3] = 1 μM. The data were estimated by eye from figure 7B of ref. 25.
Preincubation by Ca2+ or IP3 attenuates the responses. After 0.3 s of exposure to 0.4 μM Ca2+, in the absence of IP3, the response maximum is greatly decreased (computations not shown), in agreement with ref. 16. Similarly, after 0.3 s of exposure to 1 μM IP3, in the absence of Ca2+, the response maximum is again greatly decreased (computations not shown). Although the time scales are different, this result is similar to the results of Marchant and Taylor (23).
In Fig. 7, we plot the various φ functions (note the different scale for φ4). By comparing φ2, φ1, and φ5, we see that the binding of IP3 proceeds faster than the inactivation by Ca2+. Activation by Ca2+ is much faster than either, with φ4 being about an order of magnitude larger than all the other rate functions for all c > 0.1. This fast activation rate was a persistent feature of the fits and is consistent with previous modeling work (8, 9, 11, 14). Thus our model supports the theory that the dynamic responses are mediated by the fast activation and slower inactivation of the IPR by Ca2+.
Figure 7.

The rate functions. The dotted curve, φ4, is relative to the right-hand axis, whereas all the other curves are relative to the left-hand axis. All functions, except φ2, are in units of s−1. φ2 has units of μM−1⋅s−1.
Our model predicts that Ca2+-independent inactivation of the IPR by IP3 has a time constant of around 10 s (φ3 ≈ 0.1 s−1), which is slower than the figure of 250 ms of ref. 23 but faster than the figure of 30 s of ref. 32. Our rate of Ca2+-dependent IPR inactivation (φ5 ≈ 1.7 at [Ca2+] = 10 μM, giving a time constant of 588 ms) is slower than the figure of 50 ms of ref. 19 but is in excellent agreement with the figure of 580 ms (at 10 μM Ca2+) of ref. 16. Our speed of the reversal of Ca2+-induced IPR inactivation (around 800 ms) is slower than the figure of 400 ms of ref. 19. The rate of IP3 dissociation from the IPR (2 ≤ φ−2 ≤ 7, approximately, giving a time constant of 140–500 ms) agrees well with the figure of 450 ms of ref. 33, but the rate of IP3 binding (k2 = 37.4 μM⋅s−1) is slower than the figure of 120 μM⋅s−1 of ref. 33. Because of the different model structures, it is more difficult to compare our results to those of ref. 34; however, Moraru et al. get a Ca2+ binding on-rate of 10 μM⋅s−1, compared to our value of k4 = 4 μM⋅s−1, and an IP3 binding on-rate of 250 μM⋅s−1, compared to our value of k2 = 37.4 μM⋅s−1. It thus appears that some of the rate constants predicted by our model lie within the experimentally observed ranges, whereas for others the deviations are greater. Differences in experimental method may account for some of these deviations, although it is highly likely that variability in the fitting procedure also plays an important role. The physiological effects of differences in the parameter values are even less clear. Not until such dynamic models are constructed for all the different receptor subtypes will we be able to study the functional importance of any differences in rate constants between receptor subtypes.
Because φ2 is a decreasing function of c, the rate of IP3 binding is decreased by higher [Ca2+]. However, the steady-state [IP3] for half-maximal binding can be calculated to be
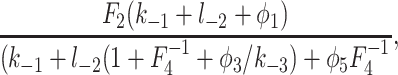 |
where Fi = φ−i/φi. For the best-fit parameters, this equation is a decreasing function of c when c > 0.1 μM. Thus, when c > 0.1 μM, the steady-state sensitivity of the IPR to IP3 increases as c increases, even though the rate of IP3 binding decreases. Hence, steady-state measurements of the Ca2+ dependence of IP3 binding give no information on the dynamic effects of Ca2+ on IP3 binding.
It has been proposed that the binding of IP3 renders the IPR unable to bind Ca2+ to the inactivating site (19), the evidence for this assertion being principally that the addition of a large concentration of Ca2+ does not inactivate the receptor once IP3 is already bound. We simulate this experiment in Fig. 8. The solid line is the control response to the addition of 10 μM IP3 and 500 nM Ca2+. The dotted line is the result of adding (in addition to the control stimulation) 30 μM Ca2+ at t = 0.22. After the second addition of Ca2+, the open probability initially rises as the receptor activates but then relaxes along much the same time course as the control response. The initial spike on the second addition of Ca2+ is very fast and unlikely to be easily detectable in superfusion studies. The results shown in Fig. 8 are qualitatively similar to those of ref. 19, even though our model assumes that Ca2+ can inactivate an IPR that has already bound IP3. In addition, we investigated a model in which φ5 was set to zero (i.e., modeling the assumption that the receptor cannot be inactivated by Ca2+ once it has bound IP3). We were unable to obtain good fits of this model to the time-course data (computations not shown). Although this result does not imply that such a model cannot be made to fit the time-course data, in combination with the simulation of Fig. 8, it suggests that inactivation by Ca2+, even when IP3 is bound, is an important part of the response.
Figure 8.

The effect of the addition of high [Ca2+] after addition of IP3. Solid curve: 10 μM IP3 and 500 nM Ca2+ were added at t = 0. Dotted curve: same as the solid curve, except that at t = 0.22, 30 μM of Ca2+ was added.
We conclude that, because of the saturating kinetics of Ca2+ activation and inactivation, the response to the addition of large amounts of Ca2+ may not be sufficient to determine whether the binding of IP3 shields the Ca2+-inactivating site.
Acknowledgments
J.S. was supported by the Marsden Fund of the Royal Society of New Zealand. J.-F.D. was supported by National Swiss Foundation Grant 3100-063696.00
Abbreviations
- IP3
inositol (1,4,5)-trisphosphate
- IPR
IP3 receptor
Footnotes
This paper was submitted directly (Track II) to the PNAS office.
References
- 1.Parker I, Ivorra I. Proc Natl Acad Sci USA. 1990;87:260–264. doi: 10.1073/pnas.87.1.260. [DOI] [PMC free article] [PubMed] [Google Scholar]
- 2.Yao Y, Parker I. J Physiol. 1992;458:319–338. doi: 10.1113/jphysiol.1992.sp019420. [DOI] [PMC free article] [PubMed] [Google Scholar]
- 3.Berridge M J. Nature (London) 1993;361:315–325. doi: 10.1038/361315a0. [DOI] [PubMed] [Google Scholar]
- 4.Sanderson M J, Charles A C, Boitano S, Dirksen E R. Mol Cell Endocrinol. 1994;98:173–187. doi: 10.1016/0303-7207(94)90136-8. [DOI] [PubMed] [Google Scholar]
- 5.Thomas A P, Bird G S J, Hajnóczky G, Robb-Gaspers L D, Putney J W J. FASEB J. 1996;10:1505–1517. [PubMed] [Google Scholar]
- 6.Yoshida Y, Imai S. Jpn J Pharmacol. 1997;74:125–137. doi: 10.1254/jjp.74.125. [DOI] [PubMed] [Google Scholar]
- 7.Taylor C W. Biochim Biophys Acta. 1998;1436:19–33. doi: 10.1016/s0005-2760(98)00122-2. [DOI] [PubMed] [Google Scholar]
- 8.DeYoung G W, Keizer J. Proc Natl Acad Sci USA. 1992;89:9895–9899. doi: 10.1073/pnas.89.20.9895. [DOI] [PMC free article] [PubMed] [Google Scholar]
- 9.Atri A, Amundson J, Clapham D, Sneyd J. Biophys J. 1993;65:1727–1739. doi: 10.1016/S0006-3495(93)81191-3. [DOI] [PMC free article] [PubMed] [Google Scholar]
- 10.Othmer H, Tang Y. In: Experimental and Theoretical Advances in Biological Pattern Formation. Othmer H, Murry J, Maini P, editors. London: Plenum; 1993. [Google Scholar]
- 11.Bezprozvanny I. Cell Cal. 1994;16:151–166. doi: 10.1016/0143-4160(94)90019-1. [DOI] [PubMed] [Google Scholar]
- 12.Tang Y, Stephenson J L, Othmer H J. Biophys J. 1996;70:246–263. doi: 10.1016/S0006-3495(96)79567-X. [DOI] [PMC free article] [PubMed] [Google Scholar]
- 13.Laurent M, Claret M. J Theor Biol. 1997;186:307–326. doi: 10.1006/jtbi.1996.0365. [DOI] [PubMed] [Google Scholar]
- 14.LeBeau A P, Yule D I, Groblewski G E, Sneyd J. J Gen Physiol. 1999;113:851–871. doi: 10.1085/jgp.113.6.851. [DOI] [PMC free article] [PubMed] [Google Scholar]
- 15.Sneyd J, LeBeau A, Yule D. Physica D. 2000;145:158–179. [Google Scholar]
- 16.Finch E A, Turner T J, Goldin S M. Science. 1991;252:443–446. doi: 10.1126/science.2017683. [DOI] [PubMed] [Google Scholar]
- 17.Parker I, Yao Y, Ilyin V. Biophys J. 1996;70:222–237. doi: 10.1016/S0006-3495(96)79565-6. [DOI] [PMC free article] [PubMed] [Google Scholar]
- 18.Dufour J-F, Arias I M, Turner T J. J Biol Chem. 1997;272:2675–2681. doi: 10.1074/jbc.272.5.2675. [DOI] [PubMed] [Google Scholar]
- 19.Adkins C E, Taylor C W. Curr Biol. 1999;9:1115–1118. doi: 10.1016/s0960-9822(99)80481-3. [DOI] [PubMed] [Google Scholar]
- 20.Yoneshima H, Miyawaki A, Michikawa T, Furuichi T, Mikoshiba K. Biochem J. 1997;322:591–596. doi: 10.1042/bj3220591. [DOI] [PMC free article] [PubMed] [Google Scholar]
- 21.Cardy T J, Traynor D, Taylor C W. Biochem J. 1997;328:785–793. doi: 10.1042/bj3280785. [DOI] [PMC free article] [PubMed] [Google Scholar]
- 22.Sienaert I, Missiaen L, De Smedt H, Parys J B, Sipma H, Casteels R. J Biol Chem. 1997;272:25899–25906. doi: 10.1074/jbc.272.41.25899. [DOI] [PubMed] [Google Scholar]
- 23.Marchant J S, Taylor C W. Biochemistry. 1998;37:11524–11533. doi: 10.1021/bi980808k. [DOI] [PubMed] [Google Scholar]
- 24.Hajnóczky G, Thomas A F. EMBO J. 1997;16:3533–3543. doi: 10.1093/emboj/16.12.3533. [DOI] [PMC free article] [PubMed] [Google Scholar]
- 25.Ramos-Franco J, Bare D, Caenepeel S, Nani A, Fill M, Mignery G. Biophys J. 2000;79:1388–1399. doi: 10.1016/S0006-3495(00)76391-0. [DOI] [PMC free article] [PubMed] [Google Scholar]
- 26.Mak D-O D, McBride S, Foskett J K. J Gen Physiol. 2001;117:435–446. doi: 10.1085/jgp.117.5.435. [DOI] [PMC free article] [PubMed] [Google Scholar]
- 27.Kaftan E J, Ehrlich B E, Watras J. J Gen Physiol. 1997;110:529–538. doi: 10.1085/jgp.110.5.529. [DOI] [PMC free article] [PubMed] [Google Scholar]
- 28.Mak D-O D, McBride S, Foskett J K. Proc Natl Acad Sci USA. 1998;95:15821–15825. doi: 10.1073/pnas.95.26.15821. [DOI] [PMC free article] [PubMed] [Google Scholar]
- 29.Press W H, Teukolsky S A, Vetterling W T, Flannery B P. Numerical Recipes in Fortran. 2nd Ed. Cambridge, U.K.: Cambridge Univ. Press; 1992. [Google Scholar]
- 30.Marchant J S, Taylor C W. Curr Biol. 1997;7:510–518. doi: 10.1016/s0960-9822(06)00222-3. [DOI] [PubMed] [Google Scholar]
- 31.Ogden D, Capiod T. J Gen Physiol. 1997;109:741–756. doi: 10.1085/jgp.109.6.741. [DOI] [PMC free article] [PubMed] [Google Scholar]
- 32.Mak D-O D, Foskett J K. J Gen Physiol. 1997;109:571–587. doi: 10.1085/jgp.109.5.571. [DOI] [PMC free article] [PubMed] [Google Scholar]
- 33.Meyer T, Wensel T, Stryer L. Biochemistry. 1990;29:32–37. doi: 10.1021/bi00453a004. [DOI] [PubMed] [Google Scholar]
- 34.Moraru I I, Kaftan E J, Ehrlich B E, Watras J. J Gen Physiol. 1999;113:837–849. doi: 10.1085/jgp.113.6.837. [DOI] [PMC free article] [PubMed] [Google Scholar]