

Abstract
This research delves deeper into previous works on femoral cross‐sectional properties during ontogeny by focusing for the first time on the human femoral midneck. The ontogenetic pattern of cross‐sectional properties at femoral midneck is established and compared with those at three different femoral locations: the proximal femur, the midshaft, and the distal femur. The study sample includes 99 femora (70 non‐adults and 29 adults) belonging to archaeological specimens. Cross‐sectional properties were extracted from computed tomographic scans and analyzed with the MomentMacro plugin of ImageJ. Ontogenetic trends of these variables were assessed using locally estimated scatterplot smoothing and segmented regressions, along with Wilcoxon post hoc tests for all possible age group pairings. Our results show that the femoral midneck exhibits a unique growth pattern. Area variables showed rapid growth until adolescence, followed by a more gradual increase leading into adulthood. Nonetheless, the relative cortical area does not demonstrate any significant drops or rise during growth. The morphology of the midneck section of the femur remains stable during ontogeny, with early adolescence and the onset of adulthood marking two periods of significant change. In contrast to the femoral diaphysis, the acquisition of a mature bipedal gait does not appear to constitute a period of significant morphological change at the femoral midneck cross section.
Keywords: adolescence, growth, bipedal gait, ontogeny
The properties of femoral midneck cross‐sections exhibit a unique growth pattern that is characterized by shape changes during adolescence.

1. INTRODUCTION
Long bones serve as support columns and levers, enabling the body to perform movements. Throughout these movements, bones undergo a range of axial, transaxial, and rotary forces, leading to mechanical stresses that cause shape changes in bones (Beck et al., 1993). The fact that bones change their shape in response to mechanical stress has been used extensively in anthropological literature to reconstruct and interpret intrapopulational and interpopulational differences in behavioral aspects and mobility levels of past human populations (Beck et al., 2001; Churchill & Formicola, 1997; Larsen, 1997; Lovejoy & Trinkaus, 1980; Ruff et al., 1993). Given that the femur is a major weight‐bearing bone, it is the most investigated element for these questions. Most of the studies cited above have focused on adult individuals, demonstrating how the osteogenic response to high mechanical loads results in increased bone deposition at the periosteal surface, redistributing this newly formed bone to areas where strains are believed to be highest (Holt, 2003; Larsen, 1997; Richmond & Jungers, 2008; Rodríguez et al., 2018; Ruff, 1987; Ruff et al., 2006; Shackelford, 2007; Stamos & Weaver, 2020; Stock & Pfeiffer, 2001, 2004; Trinkaus, 1997; Trinkaus & Ruff, 2012; Wescott, 2006). Nonetheless, it is important to note that due to the greater number and sensitivity of cells involved in the modeling and remodeling process during the growth period, non‐adult bones are more responsive to mechanical loading than adult bones (Enlow & Hans, 1996; Pearson & Lieberman, 2004; Seeman, 2003).
Several studies have demonstrated that the developmental pattern of changes in femoral cross‐sectional properties (CSP) reflects changes in loading regimes associated with the development of locomotor behavior (Cowgill et al., 2010; Cowgill & Hager, 2007; Gosman et al., 2013; Johnston & Cowgill, 2018; Osipov et al., 2016; Ruff, 2003a; Ruff et al., 1994; Swan et al., 2020). Until early adolescence, there is a net gain of cortical bone due to an excess of periosteal apposition over endosteal resorption (Frisancho et al., 1970). This newly formed bone is redistributed based on changes in mechanical loadings caused by locomotor development. During the first 6 months of life, infants cannot move independently but progress from basic movements like stepping and kicking to holding their heads upright and sitting with support by around 5 months (Adolph & Joh, 2007; Bly, 1994; Thelen & Fisher, 1982). Between 6 months and the first year of life, infants partially load their femurs as they achieve independent locomotion through crawling or scooting, gain static balance to sit unsupported, and often pull themselves to stand and cruise while holding onto objects (Adolph et al., 1998; Bly, 1994). From 1 to 2 years, individuals begin to walk independently with an immature toddling gait, characterized by a wide base of support, flexed hips and knees, and a forward‐leaning torso, which leads to short, unsteady steps taken at irregular intervals (Forssberg, 1985; Hallemans et al., 2003; Hallemans et al., 2006). Between 2 and 4 years, children's walking gait improves significantly, becoming longer, narrower, and more consistent, with a true heel strike at touchdown as they transition to a more mature form (Adolph et al., 2003; Hallemans et al., 2006; Ivanenko et al., 2004; Zeininger et al., 2018). From 4 to 9 years, children develop a mature bipedal gait, characterized by stable walking mechanics, positive vertical acceleration of the center of mass, and a femoral bicondylar angle approaching adult values, with maturation occurring more gradually (Bril & Brenière, 1993; Cowgill et al., 2010; Sutherland, 1997; Tardieu & Damsin, 1997). At early adolescence, the adult femoral configuration is already attained, with the femur becoming strengthened along the anterior–posterior plane (Cowgill et al., 2010; Gosman et al., 2013).
All of these studies focus on the femoral diaphysis, demonstrating that the proximal and distal femoral diaphysis are more sensitive to developmentally induced changes than the femoral midshaft, highlighting the anatomical specificity of the response to mechanical stress in different femoral regions (Cambra‐Moo et al., 2012; Goldman et al., 2009; Gosman et al., 2013; Hubbell et al., 2011). Considering this variability in the response to mechanical stress, the study of age‐related changes from infancy to adulthood of femoral neck CSP could be particularly important. Lovejoy (1988) showed that in humans, the thickness of the inferior cortex of the femoral neck is markedly greater than of the superior cortex presumably due to bipedal locomotion. The axial compression generated by the action of the hip abductors works together with the bending caused by the force at the hip joint, leading to increased compression in the inferior cortex and decreased tension in the superior cortex (Demes et al., 2000). Thus, the femoral neck is a good candidate to evaluate changes in CSP and their relationship with change in modes of locomotion occurring during development. However, as we know, there is little research on this topic.
The main objective of this study is to explore how femoral neck CSP changes during development in response to locomotor development. As mentioned above, previous studies have shown that femoral CSP exhibit marked regional differences. Therefore, the ontogenetic trends of femoral midneck CSP are compared with those at three different locations representing the distal, middle, and proximal sections. This approach provides a comprehensive perspective of the entire bone, allowing for a more accurate functional interpretation of the relationship between loading regime and femoral CSP. Given that the femoral neck is reinforced in the inferior cortex in adults, likely due to bipedal locomotion, we hypothesize that significant changes in the bending of this femoral location will occur during the transition to mature bipedal locomotion, specifically between the ages of 4 and 9 years, as adult form is acquired.
2. MATERIALS AND METHODS
2.1. Sample
The sample consisted of 99 femora (70 non‐adults and 29 adults) belonging to an archaeological population from the cemetery at San Pablo Monastery (Burgos, Spain) (SP) dated between the 14th and 18th centuries, and now housed at the Laboratory of Human Evolution (LEH) of University of Burgos (García‐González et al., 2024). Non‐adult individuals with age estimates below 2 years were excluded from the analyses because the femoral neck starts to develop at this age (Ryan & Krovitz, 2006). The left or the right femur was selected for analysis depending on preservation. Femora with moderate bending modifications due to pathological conditions such as rickets and with postmortem damage or taphonomic alterations were removed from the study to avoid features that could influence CSP.
2.2. Age estimation
In the case of non‐adults, age at death was estimated based on calcification and formation of dental crowns and roots. The mineralization stages of each tooth class were obtained by analyzing the 3D volume renderings from CT scans. The developmental stages of permanent dentition were scored using the method of Demirjian et al. (1973) and were converted into age according to the adjusted data for prediction proposed by Liversidge et al. (2006). The method developed by Liversidge and Molleson (2004) was used for deciduous dentition.
When no dentition was associated with the femoral remains, age at death estimation was performed based on a predictive regression analysis. For this purpose, femoral diaphyseal length (FDL) was estimated based on estimated dental age in a sample of 35 non‐adult individuals. These two variables were log‐transformed to avoid issues related to accelerated FDL growth during ontogeny. We developed two regression models for age predictions: inverse and classical calibration. In the inverse model, dental age (dependent) was regressed on FDL (independent). In the classic calibration model, FDL (dependent) was regressed on age (independent) (Table 1). We tested the performance of these two models calculating the error of the estimations relative to dental age. The model with the lowest overall bias was inverse calibration and, thus, we use this model to predict age based on femoral length. We estimated age from dentition in 50% of the non‐adult sample (35 individuals) and from femoral length in the other 50%.
TABLE 1.
Log–log classical and inverse calibration models used in this study for predicting age in the Spanish sample from maximum length of the femur.
| Model | N | Equation | R 2 | MSE/SEE |
|---|---|---|---|---|
| Classical | 35 | Age = (logFDL − 2.0755)/0.40128 | 0.79 | 1.46 |
| Inverse | 35 | Age = 1.9764 × logFDL‐3.9504 | 0.79 | 1.14 |
Note: Age in log10 years.
Abbreviations: FDL, femoral diaphyseal length; MSE, mean standard error; SEE, standard error of estimate.
In adult individuals, age at death was estimated based on pelvic changes related to aging using the Transition Analysis 3 software (Ousley et al., 2020). The age range of our sample spans from 2 to 30 years.
2.3. Age groups
The non‐adult sample was sorted into four groups according to age categories. From 2.00 to 9.00 years, the sample was sorted into two groups already used by Swan et al. (2020). These groups are the “late toddling group” (LT) consisting of individuals ranging in age from 2.00 to 3.99 years, and the “maturing walking group” (MW) comprising individuals aged 4.00–8.99 years. From 9 years onward, children have already acquired a mature gait. Thus, individuals older than 9 years were sorted into the age groups proposed by Gosman et al. (2013). These age groups are related to puberty and early adolescence (9.00–13.99) and late adolescence (14.00–17.99). As we identified individuals over 17.99 years presenting unfused femoral epiphyses, we extend this age group up to 20.00 years. Although Gosman et al. (2013) include individuals younger than 9.00 years, they did not classify the sample prior to this age by locomotor stages but into age categories. As during infancy and childhood individuals express a vast repertoire of locomotor behaviors that impact femoral CSP (Swan et al., 2020), we preferred to consider the locomotor stages proposed by Swan et al. (2020) for individuals younger than 9.00 rather than the age categories proposed by Gosman et al. (2013) for this age range. Finally, individuals displaying fully fused epiphyses were considered and classified as adults.
In summary, we sorted our sample into five groups: 2.00–3.99 (representing late toddlers), 4.00–8.99 (representing maturing walkers), 9.00–13.99 (representing puberty and early adolescents), 14.00–20.00 (representing late adolescents), and adults. The distribution of the sample by age groups can be seen in Table 2.
TABLE 2.
Distribution of the archaeological sample used in this study by age groups. Age ranges in years.
| Age group | Age range | Total femora (N) | Left femora (N) | Right femora (N) |
|---|---|---|---|---|
| 1 | 2.00–3.99 | 14 | 8 | 6 |
| 2 | 4.00–8.99 | 21 | 13 | 8 |
| 3 | 9.00–13.99 | 18 | 7 | 11 |
| 4 | 14.00–20.00 | 12 | 5 | 7 |
| 5 | Adults | 29 | 12 | 17 |
2.4. Cross‐sectional extraction and analysis
Computed tomographic (CT) scans of all specimens were obtained using a YXLON Compact X‐Ray industrial multi‐slice CT housed at the University of Burgos. Femora were aligned along the diaphyseal axis with the proximal epiphysis closest to the gantry. Scanner energy was 160 kV and 4 mA, slice thickness was collimated to 0.5 mm, inter‐slice spacing was 0.5 mm, and field of view was 18.52 cm, with a reconstruction interval of 0.5 mm. The CT images were visualized using the Mimics™ (Materialise, NV., Belgium) software program.
Previous studies have noted that it is necessary to make an adjustment of the percentages at which the cross sections are extracted when analyzing unfused individuals due to effect of unfused epiphyses (Cowgill et al., 2010; Gosman et al., 2013; Ruff, 2003a). As femora undergo several changes in size and shape during ontogeny, the landmark‐based approach described by Swan et al. (2020) was used to limit intraobserver and interobserver errors. Thus, cross sections at the femoral shaft were extracted at 15%, 45%, and 75% in unfused femora following Ruff (2003a, 2003b) and in 20%, 50%, and 80% in fused femora measured from the distal end of the femur. In this way, sections extracted at 15%/20% represent the distal diaphysis, those at 45/50% represent midshaft and those at 75/80% represent the proximal diaphysis. In fused femora, levels were calculated from unfused biomechanical length following Trinkaus et al. (2002a, 2002b), whereas in unfused femora, levels were calculated from femoral intermetaphyseal length following Cowgill et al. (2010) and Ruff (2003b). Because the distal femoral epiphyses contribute more significantly to the overall biomechanical length in fused femora, this measurement aligns more closely with diaphyseal levels in individuals whose distal femoral epiphyses are fused (Ruff, 2003b).
Cross sections from the femoral midneck were obtained once reorientating the femur on its own neck axis (Figure 1). To do that, first we identified the neck axis, which is determined by two points, one in the middle of the upper and lower margins of the neck—the midpoint of the vertical diameter of the neck—and another in the middle of the maximum vertical diameter of the metaphyseal surface (Bonneau et al., 2012). Then, we calculated the midpoint of neck length as half the distance between the metaphyseal surface of the femoral head edge and the intertrochanteric ridge taken along the neck axis (McHenry & Corruccini, 1978; Ruff & Higgins, 2013). As we included fused and unfused femora in our study, we calculated this midpoint in fused femora by identifying first the fusion line of the femoral head.
FIGURE 1.
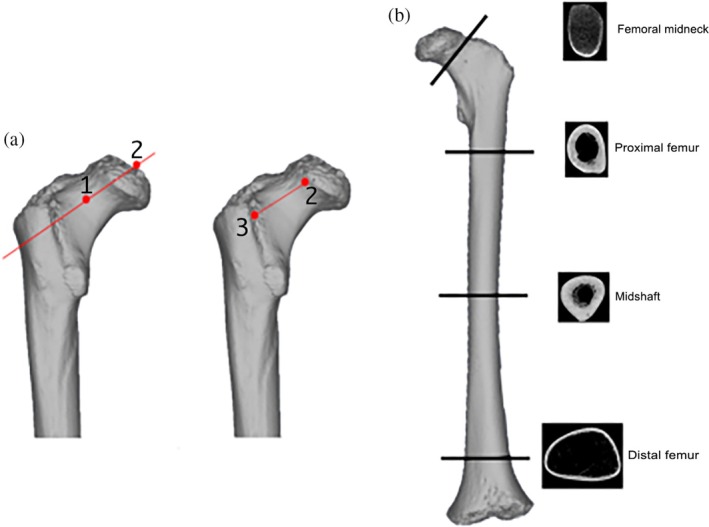
(a) Location of landmarks used to extract the midneck cross section. Red point 1 represents the midpoint of the vertical diameter of the neck, and red point 2 represents the midpoint of the vertical diameter of the femoral head metaphyseal surface or femoral head when it is fusing or fused. The red line crossing points 1 and 2 represents the neck axis. Red point 3 represents the intertrochanteric ridge. The red line between points 2 and 3 is the neck length. (b) Illustration of the protocol used to extract the cross sections at femoral midneck and femoral diaphysis in unfused femora.
Once we extracted and processed the cross sections, they were analyzed with the MomentMacro plugin of ImageJ (Ruff, 2006). Following the recommendations of Sládek et al. (2018), we derived the periosteal contours using automatic processing and the endosteal contours manually. The brightness and contrast levels of each scan were automatically optimized using the Mimics™ (Materialize, NV., Belgium) software program. This procedure was made for two reasons: to delineate the periosteal contour, which has the most significant impact on the calculations of the second moment of area (Sparacello & Pearson, 2010; Stock & Shaw, 2007), and to obtain a gray scale between the minimum and maximum density (air and cortical bone tissue, respectively). The endosteal contour was defined using points placed manually using digital tools in ImageJ. The distance between the chosen points ranged from 4 to 9 pixels, depending on the cross section. Trabecular bone made it particularly challenging to estimate the endosteal contour, especially at the distal femur and the femoral midneck (Figure 1). We adhered to the recommendations of Ruff and Hayes (1983) and digitally removed the trabecular struts. On the other hand, the inferior neck demonstrates a clear section of cortical bone, but this is much less clear on the superior aspect of the neck in both adults and non‐adults. To solve this and to ensure the continuity of the cortical wall at femoral midneck cross section, we forced a minimum of one pixel representing the cortex over the endosteal layer following Narra et al. (2013). Illustrations of how we have extracted the different cross sections are provided in Figures 1 and 2.
FIGURE 2.
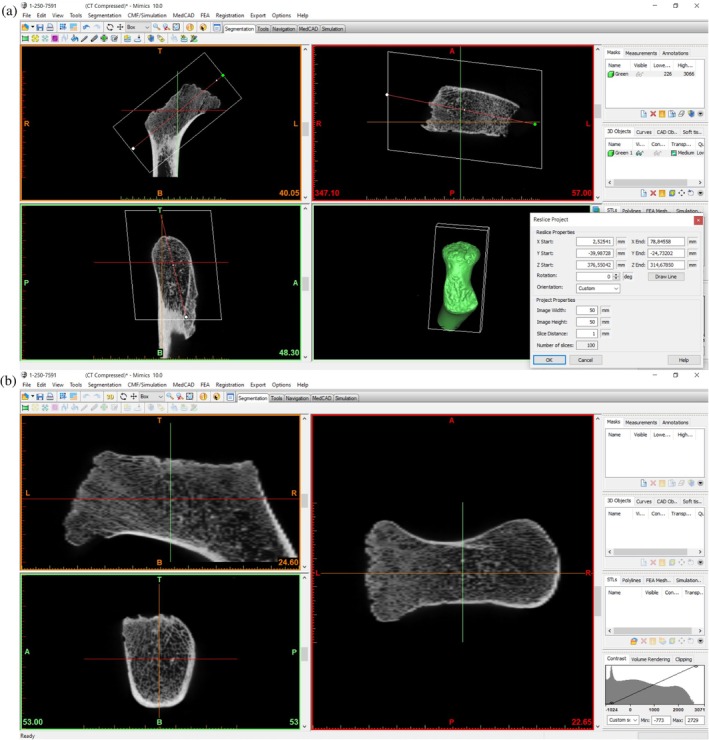
(a) Reslicing of the Mimics project with the axis of orientation along the femoral neck. (b) Femoral midneck cross‐sectional slices in Mimics once the axis of orientation is reoriented.
CSP measured in this study include total subperiosteal area (TA); cortical subperiosteal area (CA); medullary cavity area (MA); relative cortical area percentage (%CA), second moments of area around the diaphyseal medio‐lateral (M‐L) or neck antero‐posterior (A‐P) axis (Ix); second moments of area around the diaphyseal antero‐posterior (A‐P) or neck superior–inferior (S‐I) axis (I y ); maximum (I max) and minimum (I min) moments of area; I x /I y and I max/I min; and theta (θ). Areal variables (TA, CA, MA, and %CA) were employed as indicators of bone deposition and resorption. The relationship between maximum and minimum moments (I max/I min) was employed to delineate the cross‐sectional shape, and the relationship between moments of area about the anatomical axes (I x /I y ) was interpreted as a rigidity index, as this ratio may not always accurately reflect shape of the cross section (Carlson, 2005). Theta was defined by Ruff (2008) as the orientation of maximum bending rigidity. Theta values (degrees) obtained from MomentMacro presented both negative and positive values. To facilitate the interpretation of this variable, we used the absolute theta values. The axes used to calculate theta differ between cross sections in the diaphysis and the femoral neck because different anatomical planes (i.e., AP and ML versus AP and SI, respectively) are used as the reference axes in these locations.
2.5. Statistical analysis
The data were analyzed in R studio version R 4.1.2 (R Core Team, 2021) following different approaches. First, we examined the ontogenetic trends in CSP at the different femoral locations. Initially, raw data were fitted to a growth curve using a local regression (locally estimated scatterplot smoothing [LOESS]). This approach allows visualization and comparison of overall patterns of biomechanical change during ontogeny. We determined the most appropriate smoothing parameter for each LOESS regression using the paleoMAS package in R (Correa‐Metrio et al., 2012).
In some growth curves, a breakpoint was distinguishable. To estimate when changes in the growth rate of the different variables with respect to age occur in our data, we performed segmented regressions using the “Segmented” package (Muggeo, 2003). Breakpoints were automatically determined in a linear regression, and significance was evaluated assessing p‐values of statistical tests for statistical significance. The alpha value chosen for establishing statistical significance was p < 0.05.
Second, summary statistics for each age group were used to assess how ontogenetic changes in CSP reflect the two different processes contributing to bone appositional growth (deposition and resorption) across the age groups established in this study. The Kolmogorov–Smirnov test revealed that variables were not normally distributed in any of the age groups. Consequently, differences in CSP at each femoral location were compared between groups using Wilcoxon post hoc pairwise comparisons applying a Benjamini–Hochberg correction.
3. RESULTS
3.1. Ontogenetic pattern of CSP at femoral midneck and diaphysis
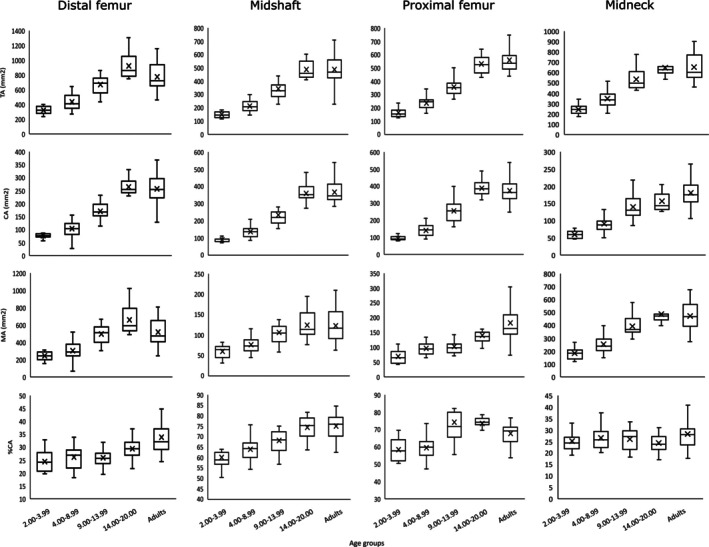
TA, CA, and MA increase with age at all four femoral locations (Figure 3). Visual examination of the LOESS fit lines suggests that at the femoral midneck, both TA and MA exhibit a trend of rapid expansion starting from the second year of life, while CA shows a more linear growth trajectory. Significant breakpoints were identified at 13.89 years in TA, at 13.10 years in CA, and at 15.49 years in MA at the femoral midneck (Table 3). The trends for these three CSPs are similar to those observed at the distal femur but differ from those at the proximal femur and midshaft. In these latter two cases, TA and CA show a trend of rapid expansion, whereas MA shows a more linear growth trajectory. Segmented regression analysis (Table 3) reveals significant breakpoints at 15.52 years in TA, at 16.80 years in CA, and at 15.25 years in MA at the distal femur. At the midsection, the significant estimated breakpoint in TA is at 15.16 years, in CA is at 15.74 years, and in MA is at 12.74 years. At the proximal femur, we localized a significant breakpoint in TA at 16.03 years and at 15.89 years in CA. While at the femoral midneck and at distal femur, %CA is relatively constant, at the proximal femur and at midshaft, %CA presents a less linear growth pattern. Breakpoints for %CA are not statistically significant at all femoral locations, except at the midshaft, where a significant breakpoint occurs at 17.25 years.
FIGURE 3.
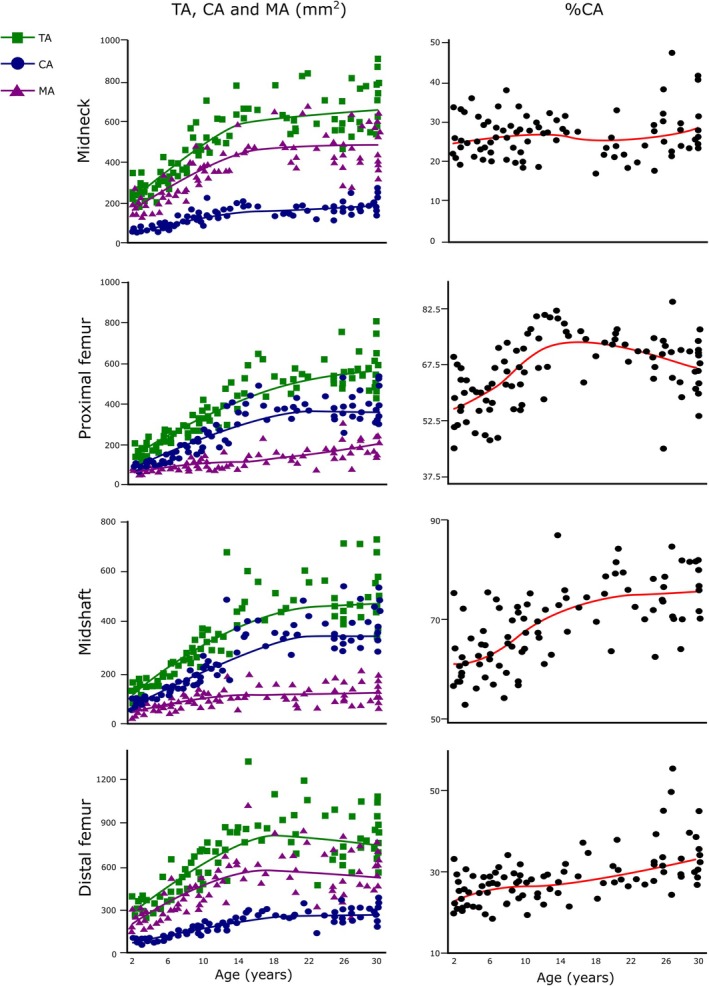
LOESS regressions for TA, CA, MA, and %CA against age at all femoral locations. Age in years. The green, blue, and purple lines are the LOESS fit lines for TA, CA, and MA, respectively. The red line is the LOESS fit line for %CA. %CA, relative cortical area percentage; CA, cortical area; LOESS, locally estimated scatterplot smoothing; MA, medullary area; TA, total area.
TABLE 3.
Results from segmented regression analysis.
| Femoral location | Variable | Breakpoint (years) | 95% CI | SE | p‐value |
|---|---|---|---|---|---|
| Distal femur | TA | 15.52 | 13.04–17.99 | 1.24 | 0.00 |
| CA | 16.80 | 13.76–19.85 | 1.53 | 0.00 | |
| MA | 15.25 | 12.3–18.19 | 1.48 | 0.00 | |
| %CA | 11.76 | 8.36–15.15 | 1.71 | 0.72 | |
| I x /I y | 12.58 | 9.00–16.15 | 1.80 | 0.00 | |
| I max/I min | 6.74 | 5.48–8.00 | 0.63 | 0.00 | |
| Theta | 22.00 | 14.14–29.89 | 3.95 | 0.22 | |
| Midshaft | TA | 15.16 | 11.63–18.69 | 1.77 | 0.00 |
| CA | 15.74 | 12.21–19.27 | 1.77 | 0.00 | |
| MA | 12.74 | 8.01–17.46 | 2.37 | 0.00 | |
| %CA | 17.25 | 10.59–23.91 | 3.35 | 0.02 | |
| I x /I y | 6.45 | 3.49–9.42 | 1.49 | 0.01 | |
| I max/I min | 3.49 | 1.43–5.55 | 1.03 | 0.66 | |
| Theta | 8.32 | 5.37–11.27 | 1.48 | 0.00 | |
| Proximal femur | TA | 16.03 | 11.80–20.26 | 2.13 | 0.00 |
| CA | 15.89 | 13.17–18.61 | 1.37 | 0.00 | |
| MA | 23 | 13.64–32.35 | 4.71 | 0.26 | |
| %CA | 13.89 | 10.54–17.23 | 1.68 | 0.00 | |
| I x /I y | 4.49 | 0.11–8.88 | 2.20 | 0.44 | |
| I max/I min | 25.51 | 22.60–28.42 | 1.46 | 0.02 | |
| Theta | 4.49 | 1.49–7.50 | 1.51 | 0.10 | |
| Midneck | TA | 13.89 | 11.27–16.50 | 1.31 | 0.00 |
| CA | 13.10 | 9.33–16.88 | 1.89 | 0.00 | |
| MA | 15.49 | 12.27–18.72 | 1.62 | 0.00 | |
| %CA | 22.91 | 15.75–30.07 | 3.60 | 0.19 | |
| I x /I y | 17.10 | 14.12–20.07 | 1.49 | 0.00 | |
| I max/I min | 13.89 | 6.58–21.19 | 3.67 | 0.08 | |
| Theta | 11.76 | 8.36–15.15 | 1.71 | 0.00 |
Note: Breakpoint estimates are displayed in years for each cross‐sectional location and variable along with 95% confidence intervals (CI) standard error (SE) and p‐value. Significant p‐values are indicated in bold.
Abbreviations: CA, cortical area; MA, medullar area; TA, total area.
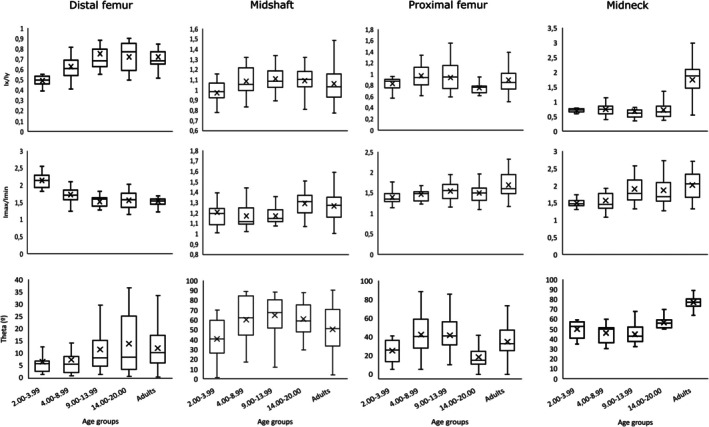
The growth curves regarding I x /I y , I max/I min, and theta can be seen in Figure 4. At femoral midneck, I x /I y decreases slightly from 2 years until adolescence and then increases until adulthood. A significant breakpoint in this ratio occurs at 17.10 years. I x /I y values remain relatively constant during ontogeny and until adulthood at the proximal and the distal femur, while at femoral midshaft, I x /I y showed a parabolic distribution. At the femoral midshaft, a statistically significant breakpoint occurs at 6.45 years, while at the distal femur, one occurs at 12.58 years. Therefore, the growth curve of I x /I y at the femoral midneck shows a unique pattern only observed at this femoral location.
FIGURE 4.
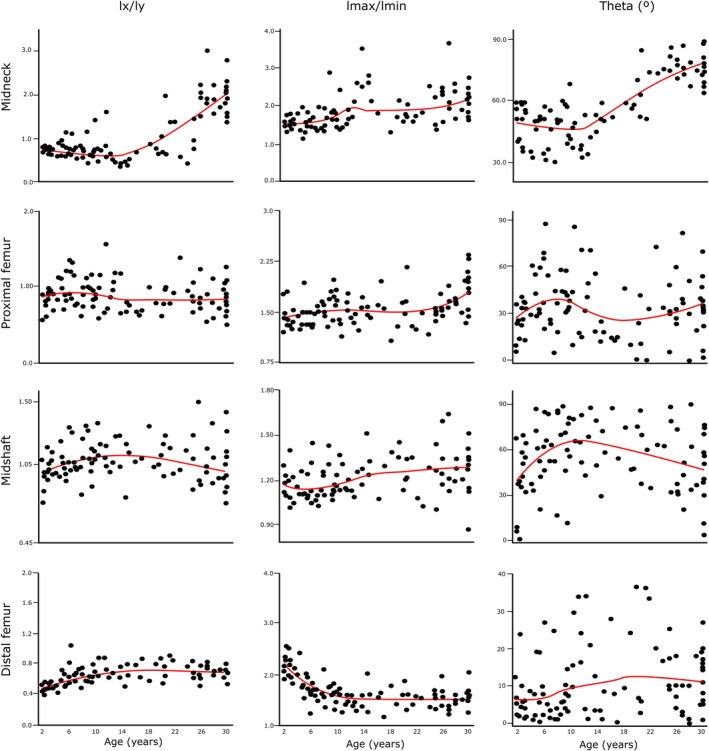
LOESS regressions for I x /I y , I max/I min, and theta against age at all femoral locations. Age in years. I max/I min—maximum (I max) and minimum (I min) second moments of area ratio; I x /I y —second moment of area around the medial–lateral axis (diaphysis) or antero‐posterior axis (midneck) (I x ) and second moment of area around the antero‐posterior axis (diaphysis) or superior–inferior axis (midneck) (I y ) ratio. Red lines are the LOESS fit lines. LOESS, locally estimated scatterplot smoothing.
On the other hand, at the femoral midneck, the proximal femur and the femoral midshaft, I max/I min remains relatively constant during ontogeny. A significant breakpoint is found at 25.51 at the proximal femur. At the distal femur, I max/I min values decrease from 2 years until adolescence, but then values remain constant thereafter. A significant breakpoint regarding I max/I min occurs at 6.74 years in this femoral location.
At the femoral midneck, theta values remain constant until the adolescent years, when values increase until adulthood. A significant breakpoint occurs at 11.76 years in this femoral location. At the proximal femur, theta increases from age 2 years until juvenility, then decreases slightly during adolescence before rising again in the early twenties. At the femoral midshaft, theta values increase also until juvenility and then decrease until adulthood. A significant breakpoint occurs at this femoral location at 8.32 years. At the distal femur, theta values increase slightly from age 2 years until early adulthood, after which they remain constant.
3.2. Comparisons of raw CSP between age groups at the femoral midneck and diaphysis
Summary statistics comprising the mean and standard deviation (SD) for CSP divided by age groups and femoral locations are displayed in Table 4. Results obtained from Wilcoxon post hoc tests are depicted in Table 5. Box‐and‐whisker plots of age groups for TA, CA, MA, and %CA for each femoral location are displayed in Figure 5 and for I x /I y , I max/I min, and theta in Figure 6.
TABLE 4.
Summary statistics for CSP for each age group and cross‐sectional location. Statistics include mean and standard deviation (SD).
| Femoral location | ||||||||||
|---|---|---|---|---|---|---|---|---|---|---|
| Distal femur | Midshaft | Proximal femur | Midneck | |||||||
| Variable | Age group | N | Mean | SD | Mean | SD | Mean | SD | Mean | SD |
| TA (mm2) | 2.00–3.99 | 14 | 321.22 | 55.96 | 147.82 | 22.61 | 161.61 | 31.88 | 246.42 | 51.22 |
| 4.00–8.99 | 21 | 411.03 | 125.58 | 209.91 | 43.18 | 236.67 | 42.52 | 347.40 | 88.78 | |
| 9.00–13.99 | 18 | 665.40 | 131.51 | 340.52 | 98.09 | 356.08 | 61.14 | 533.98 | 97.60 | |
| 14.00–20.00 | 12 | 923.96 | 176.66 | 485.22 | 68.24 | 527.98 | 67.01 | 647.02 | 85.23 | |
| Adults | 29 | 777.32 | 179.30 | 488.09 | 110.37 | 557.10 | 124.71 | 653.06 | 118.99 | |
| CA (mm2) | 2.00–3.99 | 14 | 77.29 | 9.05 | 88.19 | 11.43 | 93.02 | 11.94 | 61.03 | 10.44 |
| 4.00–8.99 | 21 | 105.35 | 31.01 | 134.38 | 30.22 | 141.43 | 35.00 | 91.51 | 26.70 | |
| 9.00–13.99 | 18 | 170.37 | 31.25 | 234.62 | 81.95 | 254.30 | 68.73 | 139.50 | 36.34 | |
| 14.00–20.00 | 12 | 265.39 | 28.92 | 360.51 | 53.50 | 387.30 | 48.26 | 156.50 | 26.35 | |
| Adults | 29 | 257.62 | 51.04 | 365.52 | 82.68 | 374.53 | 79.5 | 181.24 | 41.07 | |
| MA (mm2) | 2.00–3.99 | 14 | 243.92 | 52.16 | 59.63 | 15.93 | 68.59 | 22.71 | 185.39 | 44.92 |
| 4.00–8.99 | 21 | 305.67 | 101.81 | 75.53 | 19.85 | 95.24 | 20.56 | 255.89 | 70.40 | |
| 9.00–13.99 | 18 | 495.02 | 106.97 | 105.89 | 30.7 | 101.78 | 25.62 | 394.47 | 75.58 | |
| 14.00–20.00 | 12 | 658.57 | 163.22 | 124.70 | 33.43 | 140.68 | 33.36 | 490.51 | 80.15 | |
| Adults | 29 | 519.70 | 152.46 | 122.56 | 41.31 | 182.57 | 70.79 | 471.82 | 108.51 | |
| %CA | 2.00–3.99 | 14 | 24.56 | 4.20 | 60.17 | 6.68 | 58.45 | 6.56 | 25.23 | 4.37 |
| 4.00–8.99 | 21 | 26.09 | 4.04 | 64.01 | 5.73 | 59.38 | 7.30 | 26.53 | 4.99 | |
| 9.00–13.99 | 18 | 25.86 | 3.00 | 68.26 | 7.09 | 74.05 | 17.21 | 26.11 | 4.68 | |
| 14.00–20.00 | 12 | 29.31 | 4.32 | 74.39 | 5.34 | 73.50 | 4.06 | 24.36 | 3.92 | |
| Adults | 29 | 33.91 | 6.97 | 75.06 | 5.57 | 67.68 | 7.32 | 28.22 | 6.73 | |
| I x /I y | 2.00–3.99 | 14 | 0.49 | 0.04 | 0.96 | 0.14 | 0.82 | 0.12 | 0.71 | 0.06 |
| 4.00–8.99 | 21 | 0.62 | 0.13 | 1.08 | 0.13 | 0.96 | 0.20 | 0.75 | 0.20 | |
| 9.00–13.99 | 18 | 0.75 | 0.21 | 1.10 | 0.10 | 0.94 | 0.23 | 0.68 | 0.32 | |
| 14.00–20.00 | 12 | 0.72 | 0.13 | 1.09 | 0.12 | 0.75 | 0.12 | 0.72 | 0.27 | |
| Adults | 29 | 0.72 | 0.16 | 1.06 | 0.17 | 0.89 | 0.26 | 1.74 | 0.58 | |
| I max/I min | 2.00–3.99 | 14 | 2.13 | 0.23 | 1.20 | 0.17 | 1.39 | 0.18 | 1.49 | 0.12 |
| 4.00–8.99 | 21 | 1.72 | 0.25 | 1.17 | 0.12 | 1.46 | 0.16 | 1.57 | 0.36 | |
| 9.00–13.99 | 18 | 1.52 | 0.16 | 1.17 | 0.07 | 1.54 | 0.21 | 1.89 | 0.53 | |
| 14.00–20.00 | 12 | 1.55 | 0.25 | 0.29 | 0.12 | 1.49 | 0.22 | 1.86 | 0.44 | |
| Adults | 29 | 1.53 | 0.17 | 1.26 | 0.16 | 1.68 | 0.29 | 2.02 | 0.56 | |
| Theta (°) | 2.00–3.99 | 14 | 6.50 | 5.92 | 40.70 | 22.66 | 25.51 | 11.45 | 49.71 | 8.94 |
| 4.00–8.99 | 21 | 8.56 | 10.86 | 60.35 | 21.96 | 42.28 | 19.90 | 46.04 | 9.08 | |
| 9.00–13.99 | 18 | 19.19 | 23.54 | 64.51 | 19.13 | 42.97 | 18.92 | 43.05 | 5.21 | |
| 14.00–20.00 | 12 | 13.07 | 14.09 | 61.12 | 18.67 | 18.23 | 14.30 | 56.45 | 6.18 | |
| Adults | 29 | 12.02 | 8.20 | 50.40 | 22.44 | 34.90 | 19.39 | 76.82 | 6.31 | |
Abbreviations: CA, cortical area; CSP, cross‐sectional properties; MA, medullar area; TA, total area.
TABLE 5.
Results of Wilcoxon post hoc pairwise comparison between age groups for each femoral section location.
| Variable | Femoral location | ||||||||||||||||
|---|---|---|---|---|---|---|---|---|---|---|---|---|---|---|---|---|---|
| Distal femur | Midshaft | Proximal femur | Midneck | ||||||||||||||
| Age groups | 1 | 2 | 3 | 4 | 1 | 2 | 3 | 4 | 1 | 2 | 3 | 4 | 1 | 2 | 3 | 4 | |
| TA | 2 | 0.01 | ‐ | ‐ | ‐ | 0.00 | ‐ | ‐ | ‐ | 0.00 | ‐ | ‐ | ‐ | 0.00 | ‐ | ‐ | ‐ |
| 3 | 0.00 | 0.00 | ‐ | ‐ | 0.00 | 0.00 | ‐ | ‐ | 0.00 | 0.00 | ‐ | ‐ | 0.00 | 0.00 | ‐ | ‐ | |
| 4 | 0.00 | 0.00 | 0.00 | ‐ | 0.00 | 0.00 | 0.00 | ‐ | 0.00 | 0.00 | 0.00 | ‐ | 0.00 | 0.00 | 0.01 | ‐ | |
| 5 | 0.00 | 0.00 | 0.54 | 0.18 | 0.00 | 0.00 | 0.00 | 1.00 | 0.00 | 0.00 | 0.00 | 1.00 | 0.00 | 0.00 | 0.00 | 1.00 | |
| CA | 2 | 0.00 | ‐ | ‐ | ‐ | 0.00 | ‐ | ‐ | ‐ | 0.00 | ‐ | ‐ | ‐ | 0.00 | ‐ | ‐ | ‐ |
| 3 | 0.00 | 0.00 | ‐ | ‐ | 0.00 | 0.00 | ‐ | ‐ | 0.00 | 0.00 | ‐ | ‐ | 0.00 | 0.00 | ‐ | ‐ | |
| 4 | 0.00 | 0.00 | 0.00 | ‐ | 0.00 | 0.00 | 0.00 | ‐ | 0.00 | 0.00 | 0.00 | ‐ | 0.00 | 0.00 | 1.00 | ‐ | |
| 5 | 0.00 | 0.00 | 0.00 | 1.00 | 0.00 | 0.00 | 0.00 | 1.00 | 0.00 | 0.00 | 0.00 | 1.00 | 0.00 | 0.00 | 0.00 | 1.00 | |
| MA | 2 | 0.35 | ‐ | ‐ | ‐ | 0.00 | ‐ | ‐ | ‐ | 0.00 | ‐ | ‐ | ‐ | 0.01 | ‐ | ‐ | ‐ |
| 3 | 0.00 | 0.00 | ‐ | ‐ | 0.00 | 0.00 | ‐ | ‐ | 0.00 | 1.00 | ‐ | ‐ | 0.00 | 0.00 | ‐ | ‐ | |
| 4 | 0.00 | 0.00 | 0.05 | ‐ | 0.00 | 0.00 | 1.00 | ‐ | 0.00 | 0.00 | 0.00 | ‐ | 0.00 | 0.00 | 0.05 | ‐ | |
| 5 | 0.00 | 0.00 | 1.00 | 0.13 | 0.00 | 0.00 | 1.00 | 1.00 | 0.00 | 0.00 | 0.00 | 0.12 | 0.00 | 0.00 | 0.08 | 1.00 | |
| %CA | 2 | 1.00 | ‐ | ‐ | ‐ | 0.40 | ‐ | ‐ | ‐ | 1.00 | ‐ | ‐ | ‐ | 1.00 | ‐ | ‐ | ‐ |
| 3 | 1.00 | 1.00 | ‐ | ‐ | 0.00 | 0.52 | ‐ | ‐ | 0.00 | 0.00 | ‐ | ‐ | 1.00 | 1.00 | ‐ | ‐ | |
| 4 | 0.15 | 0.40 | 0.28 | ‐ | 0.00 | 0.00 | 0.04 | ‐ | 0.00 | 0.00 | 1.00 | ‐ | 1.00 | 1.00 | 1.00 | ‐ | |
| 5 | 0.00 | 0.00 | 0.00 | 0.46 | 0.00 | 0.00 | 1.00 | 1.00 | 0.00 | 0.00 | 1.00 | 0.02 | 1.00 | 1.00 | 1.00 | 0.74 | |
| Ix/Iy | 2 | 0.00 | ‐ | ‐ | ‐ | 0.56 | ‐ | ‐ | ‐ | 0.61 | ‐ | ‐ | ‐ | 1.00 | ‐ | ‐ | ‐ |
| 3 | 0.00 | 0.29 | ‐ | ‐ | 0.03 | 1.00 | ‐ | ‐ | 1.00 | 1.00 | ‐ | ‐ | 0.45 | 0.73 | ‐ | ‐ | |
| 4 | 0.00 | 0.62 | 1.00 | ‐ | 0.23 | 1.00 | 1.00 | ‐ | 1.00 | 0.04 | 0.22 | ‐ | 1.00 | 1.00 | 1.00 | ‐ | |
| 5 | 0.00 | 0.03 | 1.00 | 1.00 | 1.00 | 1.00 | 1.00 | 1.00 | 1.00 | 1.00 | 1.00 | 0.97 | 0.00 | 0.00 | 0.00 | 0.00 | |
| Imax/Imin | 2 | 0.00 | ‐ | ‐ | ‐ | 1.00 | ‐ | ‐ | ‐ | 1.00 | ‐ | ‐ | ‐ | 0.93 | ‐ | ‐ | ‐ |
| 3 | 0.00 | 0.08 | ‐ | ‐ | 1.00 | 1.00 | ‐ | ‐ | 0.46 | 1.00 | ‐ | ‐ | 0.02 | 0.04 | ‐ | ‐ | |
| 4 | 0.00 | 1.00 | 1.00 | ‐ | 0.53 | 0.14 | 0.10 | ‐ | 1.00 | 1.00 | 1.00 | ‐ | 0.06 | 0.46 | 0.81 | ‐ | |
| 5 | 0.00 | 0.00 | 1.00 | 1.00 | 1.00 | 0.15 | 0.13 | 1.00 | 0.00 | 0.01 | 1.00 | 0.66 | 0.00 | 0.00 | 1.00 | 1.00 | |
| Theta | 2 | 0.43 | ‐ | ‐ | ‐ | 0.25 | ‐ | ‐ | ‐ | 0.14 | ‐ | ‐ | ‐ | 0.11 | ‐ | ‐ | ‐ |
| 3 | 0.43 | 0.90 | ‐ | ‐ | 0.02 | 1.00 | ‐ | ‐ | 0.13 | 1.00 | ‐ | ‐ | 0.11 | 0.58 | ‐ | ‐ | |
| 4 | 0.83 | 0.54 | 0.45 | ‐ | 0.37 | 1.00 | 1.00 | ‐ | 1.00 | 0.00 | 0.02 | ‐ | 0.14 | 0.01 | 0.12 | ‐ | |
| 5 | 0.91 | 0.32 | 1.00 | 1.00 | 1.00 | 1.00 | 0.22 | 1.00 | 1.00 | 1.00 | 1.00 | 0.08 | 0.00 | 0.00 | 0.00 | 0.00 | |
Note: Significant values (p < 0.05) are indicated in bold. Age group 1: 2.00–3.99 years; Age group 2: 4.00–8.99 years; Age group 3: 9.00–13.99 years; Age group 4: 14.00–20.00 years; Age group 5: adults.
FIGURE 5.
Box‐and‐whiskers plot of areal variables by age groups. Boxes include 25th to 75th percentile and whiskers extend to values within 1.5 x interquartile range from upper and lower limits of the box. Median is shown as a line within the interquartile range and the mean is indicated by a cross. %CA, relative cortical area percentage; CA, cortical area; MA, medullary area; TA, total area.
FIGURE 6.
Box‐and‐whiskers plot of I x /I y , I max/I min, and theta by age groups. I max/I min—maximum (I max) and minimum (I min) second moments of area ratio; I x /I y —second moment of area around the medial‐lateral axis (diaphysis) or antero‐posterior axis (midneck) (I x ) and second moment of area around the antero‐posterior axis (diaphysis) or superior–inferior axis (midneck) (I y ) ratio. Boxes include 25th to 75th percentiles, and whiskers extend to values within 1.5 × interquartile range from upper and lower limits of the box. Median is shown as a line within the interquartile range and the mean is indicated by a cross.
The results of the Wilcoxon post hoc tests indicate significant differences in TA at all the femoral locations between consecutive age groups up to late adolescence. Regarding CA, we detected the same differences observed in TA at the femoral diaphysis. At the femoral midneck, we only detected significant differences between the first three consecutive groups. These results, along with the trends observed in the summary statistics, suggest that while adult CA values are reached in late adolescence at all femoral diaphyseal locations, the increase in CA at the femoral midneck is more gradual from adolescence to adulthood.
Trends observed in MA are quite different to those observed in TA and CA. At femoral midneck significant differences in MA occurs between the first three consecutive groups, as observed in CA. At the proximal femur, MA increases significantly between the 2.00–3.99 and 4.00–8.99 age group, and between the 9.00–13.99 and 14.00–20.00 age group; thus, early adolescence seems to be a transition phase in which MA growth is constant at this femoral location. At the femoral midshaft, MA increases significantly among age groups only until puberty and early adolescence (9.00–13.99 age group). At the distal femur, we only detected a significant difference between the 4.00–8.99 age group and the 9.00–13.99 age group. The femoral midneck differences among groups regarding MA are similar to the differences that are present at midshaft.
In terms of %CA, we detected several significant differences at the proximal femur. Individuals under 8.99 years (late toddlers and maturing walkers) statistically differ from the other age groups, showing significant less %CA. Regarding differences between consecutive age groups, we detected significant differences between the 4.00–8.99 age group and the 9.00–13.99 age group and between late adolescents and adults. At the femoral midshaft, late toddlers (2.00–3.99 age group) showed significantly lower %CA than the two adolescent groups and adults, while maturing walkers (4.00–8.99 age group) showed significantly lower %CA than late adolescents and adults. We only found one period of significant change between consecutive age groups at the femoral midshaft: the transition between the 9.00–13.99 age group and the 14.00–20.00 age group. The femoral midneck and the distal femur showed no periods of significant change of %CA among consecutive age groups, indicating a steadier %CA growth during ontogeny at these femoral locations. Nonetheless, at the distal femur, the adult group shows significantly higher %CA than the other age groups except for late adolescents (14.00–20.00 age group).
Regarding I x /I y , we only detected significant differences in the adult group at the femoral midneck. This group shows significantly higher I x /I y values when compared with the other groups at this femoral location. At the proximal femur, there is only a significant difference in this ratio between maturing walkers (4.00–8.99 age group) and late adolescents (14.00–20.00 age group). At the femoral midshaft, we detected a significant difference between late toddlers (2.00–3.99 age group) and early adolescents (9.00–13.99 age group). At the distal femur, late toddlers (2.00–3.99 age group) showed significantly lower I x /I y values than the other groups. At this femoral location, we also detected a significant difference between maturing walkers (4.00–8.99 age group) and adults.
The femoral midneck cross‐sectional shape remains relatively constant until adulthood; nonetheless, we found a period of significant change between consecutive age groups regarding I max/I min, and this is related to the transition from maturing walking (4.00–8.99 age group) to puberty and early adolescence (9.00–13.99 age group). At the femoral midneck, we also detected significant differences between late toddlers (2.00–3.99 age group) and early adolescents (9.00–13.99 age group) and adults and between adults and maturing walkers (4.00–8.99 age group). At the proximal femur, we only detected significant differences regarding the adult group, which shows significantly higher I max/I min values than individuals under 8.99 years (late toddlers and maturing walkers). At the femoral midshaft, we detected no significant differences among groups regarding I max/I min. On the other hand, I max/I min values are significantly higher in late toddlers (2.00–3.99 age group) than in other age groups at the distal femur. At this femoral location, there is also a significant difference between adults and maturing walkers (4.00–8.99 age group). We detected no significant differences among consecutive groups at the femoral midshaft and the proximal femur. This suggests that the degree of circularity (midshaft) and ellipticity (proximal femur) of these femoral locations remains relatively constant during growth.
Regarding theta, we observed no differences among groups at the distal femur. At the femoral midshaft, there is a significant difference between early adolescents (9.00–13.99 age group) and late toddlers (2.00–3.99 age group). We observed a significant difference in theta values among consecutive groups at the proximal femur, related to the transition among the adolescent groups. Nonetheless, we also detected a significant difference between late adolescents (14.00–20.00 age group) and maturing walkers (4.00–8.99 age group) at this femoral location. Raw theta values indicate that the elliptical cross section of the proximal femur is initially oriented with its primary axis in an anterolateral position. However, during late adolescence, primary axis orientation shifts to a more mediolateral position, before returning to a more anterolateral position during adulthood. Moreover, significant differences are also found between adults and the other age groups at the femoral midneck. Late adolescents (14.00–20.00 age group) and maturing walkers (4.00–8.99 age group) also showed significant differences regarding theta. In this femoral location, theta values remain relatively constant until adolescence, showing values around 45°, and suggesting a more superior‐anterior/inferior‐posterior orientation of the cross section. In adults, values are well above 45°, indicating a more superior–inferior orientation. Nonetheless, we did not find differences among consecutive groups at the femoral midshaft or the distal femur.
4. DISCUSSION
The current study delves into changes in the femoral CSP through ontogeny, focusing for the first time on the analysis of the femoral midneck. Previous studies have focused on the development of CSP in the femoral diaphysis during ontogeny, pointing out that femoral CSP exhibit marked regional differences (Cowgill et al., 2010; Goldman et al., 2009; Gosman et al., 2013; Swan et al., 2020). Thus, the findings obtained in this study add to the biomechanical and developmental interpretation of this regional variability. Another important contribution of this work is that, while changes in diaphyseal CSP have been well documented up to 9 years old, the non‐adult sample sizes beyond this age are generally small, or there is a notable gap in age representation from about 9 years old to 18 years old. In this sense, we have expanded the sample size of non‐adult individuals older than 9 years, allowing us to more precisely investigate changes in femoral CSP during adolescence. Examples of femoral cross sections at different locations for each age group can be seen in Figure 7.
FIGURE 7.
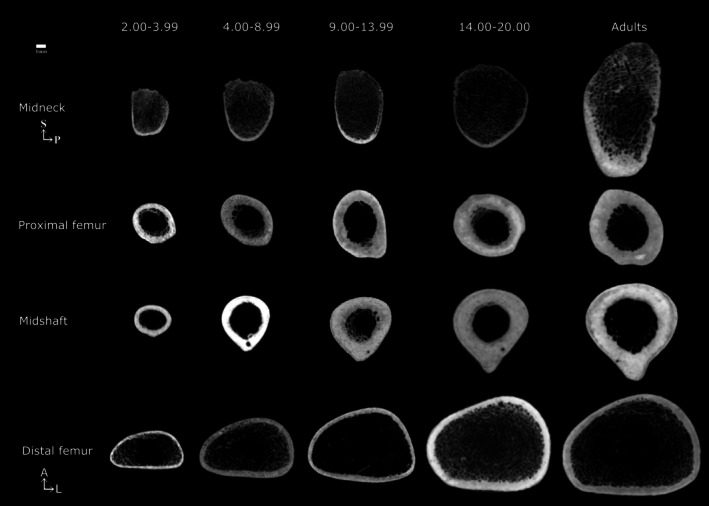
Representative age group cross sections at each femoral section location. Individuals were chosen randomly. All femora are from the right side. Age ranges in years.
The lack of significant differences between consecutive groups suggests gradual growth, explaining why differences appear mainly between non‐consecutive age groups. However, we have chosen to focus on significant changes between consecutive groups, as these highlight key moments of ontogenetic change.
TA, CA, and MA significantly increase at the femoral midneck throughout ontogeny. However, from adolescence onward, the changes in CA and MA are more gradual, as we did not find significant differences between the adolescent groups or between late adolescents and adults. In TA and CA, we found significant breakpoints at this femoral location that occur earlier compared with the other diaphyseal locations, while the significant breakpoint that occurs in MA is similar to that observed at the distal femur.
We did not detect significant changes in terms of %CA at the femoral midneck so relative cortical area remains constant during ontogeny at this femoral location, without any significant drops. This is unusual compared with other femoral regions. Previous studies reported that %CA has no mechanical significance (Ruff, 2018; Ruff et al., 1994) and that body mass does not influence this variable (Cowgill et al., 2023). Nevertheless, recent studies have utilized it as an indicator of strength under axial compression (Cosnefroy et al., 2022; Swan et al., 2020). Cowgill et al. (2023) identified a consistent pattern in %CA at the femoral, humeral, and tibial midshaft across various samples, showing high values at birth, low levels in early childhood, and an increase during later childhood and adolescence. Nonetheless, the underlying reasons for this common pattern remain unclear, as appositional growth is intricate and is influenced not only by mechanical loads but also by hormonal and nutritional factors (Bonjour et al., 2012; Gosman et al., 2011). This is the first time the growth pattern of the femoral midneck cross section has been described, so we do not know if this relative stasis in %CA throughout ontogeny is a common pattern across different samples. As Cowgill et al. (2023) comment, to establish what is “normal” for cortical bone growth, a large range of non‐adult individuals from different samples should be compared.
Nonetheless, our results suggest that the femoral midneck cross section is characterized by lower %CA and greater superior–inferior bone deposition, which highlight the longitudinal asymmetry of loading from the most upper part to the most distal part of the femur. One possible explanation for this configuration is that a low %CA in a cross section with a relatively large TA minimizes bone deposition while maximizing strength through maintaining periosteal size (Cowgill et al., 2023). Thus, low %CA at the femoral midneck may be a consequence of a large TA in this location. Our results support this statement, as TA and MA continue to expand even after CA growth has ceased.
On the other hand, until early adolescence and regulated by the combined action of growth hormone (GH) and the insulin‐like growth factor (IGF‐I), there is a net gain of cortical bone due to an excess of periosteal apposition over endosteal resorption (Frisancho et al., 1970). During puberty, as sex hormones are secreted, axial growth experiences an acceleration (Seeman, 2004) and bone is deposited in both periosteal and endosteal surfaces. Moreover, Ruff et al. (1994) observed that the sensitivity of bone‐forming surfaces to increased mechanical loading changes during development. In children and early adolescents, the periosteal surface is the most responsive. However, after mid‐adolescence, the endosteal surface becomes more responsive. Nonetheless, there are sexual differences in the absolute and relative amounts of bone gained at these two surfaces. This is due to the fact that while estrogen inhibits, androgens enhance periosteal apposition (Gosman et al., 2011; Veldhuis et al., 2006). As a result, periosteal apposition is greater in males than in females while endosteal apposition is greater in females than in males (Frisancho et al., 1970).
While several authors have noted a medullary contraction during late adolescence in post‐menarcheal girls (Bass et al., 2002; Chevalley et al., 2011; Frisancho et al., 1970; Garn, 1970; Macdonald et al., 2006), other have not found it (Goldman et al., 2009; Gosman et al., 2013; Kontulainen et al., 2005). Therefore, there would be a possibility of finding this medullary contraction in our results if sex in non‐adults had been estimated. Nonetheless, estimating sex in non‐adult skeletons is problematic. While a variety of metric and morphological methods have been developed to determine the sex of non‐adult skeletons (Loth & Henneberg, 2001; Molleson et al., 1998; Schutkowski, 1993; Stull et al., 2017; Stull & Godde, 2013; Weaver, 1980), they generally yield poor accuracy when applied to an external population mainly due to variations in the pattern and degree of sexual dimorphism among different populations (Cardoso & Saunders, 2008; Coqueugniot et al., 2002; García‐González et al., 2021; Lamer et al., 2021; Scheuer, 2002; Sheridan & Mittler, 1992; Sutter, 2003; Vlak et al., 2008). In the pooled‐sex sample, as the effects of estrogen and androgens are differential, the decrease in medullary area in females would offset the increase in total area in males regarding the percentage of relative cortical area, masking sexual variation in the relative degree of endosteal apposition. In summary, we believe that the contraction of the medullary area is a crucial aspect that requires further investigation to infer differential patterns of appositional growth between adolescent males and females in past populations.
The developmental pattern of femoral midneck morphology indicates that neck shape begins relatively elliptical and becomes only incrementally more elliptical with age. This is consistent with a previous study that reported elliptical shape varies with size and increases as the superior–inferior femoral neck diameter and cross‐sectional size increases (Zebaze et al., 2005). The femoral midneck cross section has a unique developmental trajectory in terms of shape. We detected only one period of significant shape change (I max/I min) between successive age groups at the femoral midneck, and this is related to early adolescence, in which the I max/I min ratio increases. This increase is significant in early adolescents compared with late toddlers and maturing walkers. By contrast, this transition is not significant in any location along the femoral diaphysis. Shape changes at the femoral midneck are more noticeable during puberty and early adolescence than at the femoral diaphysis, which can be related to cross‐sectional shape being mostly influenced by local periosteal loads (Gosman et al., 2011). There is anatomical specificity of the response to changes in body size and shape in other femoral regions undergoing more significant changes in CSP than midshaft (Cambra‐Moo et al., 2012; Goldman et al., 2009; Gosman et al., 2013; Hubbell et al., 2011). Considering that the midneck is more susceptible than the midshaft to new mechanical loads during adolescence and that the femoral neck is influenced by a predominantly unidirectional (vertical) pattern of weight transmission at the hip joint, leading to concentrated loading stresses on the inferior side of the femoral neck (Pina et al., 2012), it could better reflect the changes related to body composition during puberty and early adolescence. Thus, the significant change observed during early adolescence in terms of shape may be related to the adolescent growth spurt. During puberty, significant hormonal changes and a rapid increase in body size take place, leading to notable alterations in body composition (Siervogel et al., 2003). These changes are associated with an increase in height and weight velocity, with approximately 25% of adult height and 50% of adult body weight gained during adolescence (Rogol et al., 2002). This significant shape change can also affect femoral head size (Ruff & Higgins, 2013); allometric growth during ontogeny; the femoral neck‐shaft angle, which has exhibited ongoing remodeling until the age of 15 in previous studies (Carman et al., 2023; Pujol et al., 2014, 2016); and pelvic configuration during ontogeny (Ruff, 1995). Nonetheless, the relationship between changes in body proportions occurring during early adolescence and the shape change occurring at the femoral midneck during growth requires further investigation.
After adolescence, elliptical morphology remains constant until adulthood at the femoral midneck, with a superior–inferior reinforcement occurring in adults and marking the second period of change: the transition from late adolescence to adulthood. This transition is significant in terms of I x /I y , but not in terms of I max/I min. I x /I y ratios remain near 1 throughout development, reflecting dimensional equality, until a significant rise is seen in adulthood. This is inconsistent with the results obtained from the I max/I min ratio. Carlson (2005) reported that the ratio of the second moments of area around anatomical axes (I x /I y ) does not necessarily reflect the same characteristics of a cross section as the ratio of the maximum to minimum second moments of area (I max/I min). This arises from arbitrarily superimposing neutral axes without considering the material of the cross section in the former case (Carlson, 2005). In contrast, the maximum and minimum second moments of area, defined by the material, consistently indicate cross‐sectional shape regardless of bone alignment. Thus, the significant change in I x /I y at the onset of adulthood should be interpreted as a shift in the alignment of the major and minor axes of the cross sections relative to the anatomical axes. This is supported by the changes observed in theta. In late adolescence, theta values increase slightly compared with early adolescence, although this rise is not significant. Nonetheless, the transition from late adolescence to adulthood is significant. In adults, theta values are close to 90°, indicating a superior–inferior direction of the greatest bending. This may be related to pelvic configuration changes, as pelvic dimensions and femoral head diameters enlarge in width after skeletal maturity and the cessation of longitudinal growth (Berger et al., 2011). A wider pelvis, that is, an increased biacetabular breadth, further increases medio‐lateral bending of the femoral shaft (Ruff, 1995), and thus, likely also superior–inferior bending of the femoral neck.
On the other hand, our findings primarily on diaphyseal CSP align with those previously proposed by other authors, suggesting that the immature femur undergoes changes in CSP to meet both the mechanical demands due to the development of the locomotor behavior and changes in body shape and size during adolescence (Cowgill et al., 2010; Gosman et al., 2013; Swan et al., 2020). In contrast to the femoral diaphysis, the acquisition of a mature bipedal gait does not appear to constitute a period of significant morphological change at the femoral midneck cross section, because we did not find significant differences between late toddlers and maturing walkers in terms of shape.
Regarding our initial hypothesis, our results suggest that it should be rejected, as the main changes in bending, as signaled by the cross section of the mid‐femoral neck occur starting in adolescence, rather than between ages 4 and 9 years, when mature bipedal locomotion is acquired.
5. LIMITATIONS
We are aware that there are some methodological limitations in our study, many of which are inherent to studies of archaeological populations. The first of these limitations is related to the nature of the sample itself, which is cross‐sectional. This limitation may restrict the interpretations that can be made regarding absolute value comparisons between successive age categories.
Second, dividing the samples into age cohorts based on either chronological or dental age could potentially affect the results. Females mature faster than males so that at the beginning of puberty, their skeletons are 2 years advanced to males (Bogin, 1994; Bogin et al., 1992; Rogol et al., 2002; Tanner, 1978; Watts, 1986). Moreover, delayed puberty may reduce periosteal apposition in males and endocortical apposition in females (Seeman, 2001). Consequently, while late‐pubertal males have smaller bone, in terms of length and external diameter, with a thinner cortex but normal medullary diameter, late‐pubertal females have larger bone with a thinner cortex and larger medullary diameter (Seeman, 2001). Indeed, sexual maturation stages instead of age are commonly used in clinical studies about this topic (Kontulainen et al., 2005, Schoenau et al., 2001). Owing to variations in the margin of error associated with the two age at death estimations (derived from dental or femoral development), these discrepancies could potentially impact our results. Because teeth are less affected by environmental factors than bones, age estimates based on these two indicators can often differ. Consequently, individuals whose age we estimated using femoral development, due to the absence of dental remains associated with the skeleton, may have experienced delayed puberty affecting femoral growth. This could mean that some individuals with delayed puberty were classified into younger age groups than would be appropriate if their age could be estimated based on dental development.
Lastly, an important aspect to consider is the effect of nutrition in the gain or loss of bone. A previous study on the SP sample has asserted that several individuals show a delay in skeletal development probably due to malnutrition and illness (García‐González et al., 2019). Although the association between nutrition and bone apposition has been extensively studied, it is still unclear. Although several scholars have noted that malnourished individuals show a reduction in relative levels of cortical bone (Garn, 1970; Garn et al., 1964, 1969; Hummert, 1983; Huss‐Ashmore, 1981; Schug & Goldman, 2014; Van Gerven et al., 1985), others have pointed out that this reduction may be reflecting the normal growth and modeling (Ruff et al., 1994). Moreover, Temple et al. (2013) proposed that reductions in bone formation associated with malnutrition may be masked by elevated levels of mechanical loading. Thus, it seems likely that nutritional effects on bone formation can be only detected analyzing age‐specific growth attainment: Well‐nourished individuals attained greater proportion of average adult cortical area than malnourished individuals at the same age (Cowgill & Hager, 2007). Given that our sample is cross‐sectional, it is likely that if any individual was affected by undernutrition, these values would be obscured within the rest of the sample.
6. CONCLUSIONS
In this study, we use CT imaging to evaluate changes in CSP at the femoral midneck cross section during ontogeny for the first time. Consistent with previous studies, we confirm two crucial phases of change in femoral CSP at this femoral location. The first period (up to adolescence) is characterized by a fast increase in TA, CA, and MA. Although the femoral midneck is characterized by a faster increase in TA, CA, and MA, it showed a steadier change in terms of %CA and shape when compared with the femoral diaphyseal cross sections. The second period (from adolescence to adulthood) is characterized by shape changes, which may be related to changes in mechanical loads and body composition.
In sum, our findings unveil distinctive patterns in the development of femoral CSP throughout infancy to adulthood, showing that the femoral midneck exhibits a unique growth pattern. We strongly believe that the comprehensive analysis of these properties provides a unique and valuable perspective that can significantly enhance our knowledge of ontogenetic changes related to different biological processes and variability in past populations.
AUTHOR CONTRIBUTIONS
Julia Muñoz‐Guarinos: Conceptualization; investigation; writing – original draft; methodology; validation; visualization; writing – review and editing; formal analysis. Laura Rodríguez: Methodology; writing – review and editing; formal analysis. José Miguel Carretero: Funding acquisition; writing – review and editing; visualization; supervision. Rebeca García‐González: Conceptualization; investigation; writing – original draft; methodology; validation; visualization; writing – review and editing; formal analysis; supervision.
FUNDING INFORMATION
J. M. G benefits a predoctoral grant co‐funded by the Government of Castilla y León and the European Union. BOCYL‐D‐07/07/2020 no. 135 p. 23452. The Atapuerca research project is financed by the Ministerio de Ciencia, Innovación y Universidades Grant PID2021‐122355NB‐C31 funded by the MCIN/AEI/10.13039/501100011033 and “ERDF A way of making Europe.”
ACKNOWLEDGMENTS
We have benefitted from fruitful discussions with our colleagues from the Laboratorio de Evolución Humana at the University of Burgos.
Muñoz‐Guarinos, J. , Rodríguez, L. , Carretero, J. M. , & García‐González, R. (2025). Exploring developmental changes in femoral midneck cross‐sectional properties. The Anatomical Record, 308(8), 2212–2233. 10.1002/ar.25618
DATA AVAILABILITY ASSESSMENT
The raw data that support the findings of this study are available upon request to the authors.
REFERENCES
- Adolph, K. E. , & Joh, A. S. (2007). Motor development: How infants get into the act. In Slater A. & Lewis M. (Eds.), Introduction to infant development (2nd ed., pp. 63–80). Oxford University Press; [Google Scholar]
- Adolph, K. E. , Vereijken, B. , & Denny, M. A. (1998). Learning to crawl. Child Development, 69, 1299–1312. 10.1111/j.1467-8624.1998.tb06213.x [DOI] [PubMed] [Google Scholar]
- Adolph, K. E. , Vereijken, B. , & Shrout, P. E. (2003). What changes in infant walking and why. Child Development, 74, 475–497. 10.1111/1467-8624.7402011 [DOI] [PubMed] [Google Scholar]
- Bass, S. L. , Saxon, L. , Daly, R. M. , Turner, C. H. , Robling, A. G. , Seeman, E. , & Stuckey, S. (2002). The effect of mechanical loading on the size and shape of bone in pre‐, peri‐, and postpubertal girls: A study in tennis players. Journal of Bone and Mineral Research, 17(12), 2274–2280. 10.1359/jbmr.2002.17.12.2274 [DOI] [PubMed] [Google Scholar]
- Beck, T. J. , Oreskovic, T. L. , Stone, K. L. , Ruff, C. B. , Ensrud, K. , Nevitt, M. C. , Gennant, H. K. , & Cummings, S. R. (2001). Structural adaptation to changing skeletal load in the progression toward hip fragility: The study of osteoporotic fractures. Journal of Bone and Mineral Research, 16, 1108–1119. 10.1359/jbmr.2001.16.6.1108 [DOI] [PubMed] [Google Scholar]
- Beck, T. J. , Ruff, C. B. , & Bissessur, K. (1993). Age‐related changes in female femoral neck geometry: Implications for bone strength. Calcified Tissue International, 53, S41–S46. 10.1007/BF01673401 [DOI] [PubMed] [Google Scholar]
- Berger, A. A. , May, R. , Renner, J. B. , Viradia, N. , & Dahners, L. E. (2011). Surprising evidence of pelvic growth (widening) after skeletal maturity. Journal of Orthopaedic Research, 29(11), 1719–1723. [DOI] [PubMed] [Google Scholar]
- Bly, L. (1994). Motor skills acquisition in the first year: An illustrated guide to normal development. Therapy Skill Builders. [Google Scholar]
- Bogin, B. (1994). Adolescence in evolutionary perspective. Acta Paediatrica, 83, 29–35. [DOI] [PubMed] [Google Scholar]
- Bogin, B. , Wall, M. , & MacVean, R. B. (1992). Longitudinal analysis of adolescent growth of ladino and Mayan school children in Guatemala: Effects of environment and sex. American Journal of Physical Anthropology, 89(4), 447–457. [DOI] [PubMed] [Google Scholar]
- Bonjour, J. P. , Benoit, V. , Rousseau, B. , & Souberbielle, J. C. (2012). Consumption of vitamin D‐and calcium‐fortified soft white cheese lowers the biochemical marker of bone resorption TRAP 5b in postmenopausal women at moderate risk of osteoporosis fracture. The Journal of Nutrition, 142(4), 698–703. 10.3945/jn.111.153692 [DOI] [PubMed] [Google Scholar]
- Bonneau, N. , Libourel, P. A. , Simonis, C. , Puymerail, L. , Baylac, M. , Tardieu, C. , & Gagey, O. (2012). A three‐dimensional axis for the study of femoral neck orientation. Journal of Anatomy, 221(5), 465–476. 10.1111/j.1469-7580.2012.01565.x [DOI] [PMC free article] [PubMed] [Google Scholar]
- Bril, B. , & Brenière, Y. (1993). Posture and independent locomotion in early childhood: Learning to walk or learning dynamic postural control? In Savelsbergh G. J. P. (Ed.), The development of coordination in infancy (pp. 337–358). Elsevier. [Google Scholar]
- Cambra‐Moo, O. , Meneses, C. N. , Barbero, M. Á. R. , Gil, O. G. , Pérez, J. R. , Rello‐Varona, S. , Campo, M. , & Martín, A. G. (2012). Mapping human long bone compartmentalisation during ontogeny: A new methodological approach. Journal of Structural Biology, 178(3), 338–349. 10.1016/j.jsb.2012.04.008 [DOI] [PubMed] [Google Scholar]
- Cardoso, H. F. , & Saunders, S. R. (2008). Two arch criteria of the ilium for sex determination of immature skeletal remains: A test of their accuracy and an assessment of intra‐and inter‐observer error. Forensic Science International, 178(1), 24–29. 10.1016/j.forsciint.2008.01.012 [DOI] [PubMed] [Google Scholar]
- Carlson, K. J. (2005). Investigating the form‐function interface in African apes: Relationships between principal moments of area and positional behaviors in femoral and humeral diaphyses. American Journal of Physical Anthropology: The Official Publication of the American Association of Physical Anthropologists, 127(3), 312–334. [DOI] [PubMed] [Google Scholar]
- Carman, L. , Besier, T. , Stott, N. S. , & Choisne, J. (2023). Sex differences in linear bone measurements occur following puberty but do not influence femoral or tibial torsion. Scientific Reports, 13(1), 11733. 10.1038/s41598-023-38783-6 [DOI] [PMC free article] [PubMed] [Google Scholar]
- Chevalley, T. , Bonjour, J. P. , Ferrari, S. , & Rizzoli, R. (2011). Pubertal timing and body mass index gain from birth to maturity in relation with femoral neck BMD and distal tibia microstructure in healthy female subjects. Osteoporosis International, 22, 2689–2698. 10.1007/s00198-011-1531-3 [DOI] [PMC free article] [PubMed] [Google Scholar]
- Churchill, S. E. , & Formicola, V. (1997). A case of marked bilateral asymmetry in the upper limbs of an upper Palaeolithic male from Barma Grande (Liguria), Italy. International Journal of Osteoarchaeology, 7(1), 18–38. [DOI] [Google Scholar]
- Coqueugniot, H. , Giacobini, G. , & Malerba, G. (2002). L'utilisation de caractères morphologiques dans la diagnose sexuelle des mandibules d'enfants. Application à la collection ostéologique de Turin (Italie). Bulletins et mémoires de la Société d'Anthropologie de Paris. BMSAP, 14(14), 1–2. 10.4000/bmsap.483 [DOI] [Google Scholar]
- Correa‐Metrio, A. , Urrego, D. H. , Cabrera, K. R. , & Bush, M. B. (2012). paleoMAS: Paleoecological Analysis. R Package Version 2.0–1. https://CRAN.R-project.org/package=paleoMAS
- Cosnefroy, Q. , Marchal, F. , Bellaiche, L. , Carlier, R. , Cazeau, C. , Lamberton, F. , Perrier, A. , Theil, J. C. , & Berillon, G. (2022). Do femoral biomechanical properties follow locomotor changes in primates? An ontogenetic study of olive baboons (Papio anubis). American Journal of Biological Anthropology, 179(4), 609–623. [Google Scholar]
- Cowgill, L. , Harrington, L. , MacKinnon, M. , & Kurki, H. K. (2023). Gains in relative cortical area during growth and their relationship to nutrition, body size, and physical activity. American Journal of Biological Anthropology, 182(2), 177–193. [DOI] [PubMed] [Google Scholar]
- Cowgill, L. W. , & Hager, L. D. (2007). Variation in the development of postcranial robusticity: An example from Çatalhöyük, Turkey. International Journal of Osteoarchaeology, 17(3), 235–252. 10.1002/oa.882 [DOI] [Google Scholar]
- Cowgill, L. W. , Warrener, A. , Pontzer, H. , & Ocobock, C. (2010). Waddling and toddling: The biomechanical effects of an immature gait. American Journal of Physical Anthropology, 143(1), 52–61. 10.1002/ajpa.21289 [DOI] [PubMed] [Google Scholar]
- Demes, B. , Jungers, W. L. , & Walker, C. (2000). Cortical bone distribution in the femoral neck of strepsirhine primates. Journal of Human Evolution, 39(4), 367–379. 10.1006/jhev.2000.0424 [DOI] [PubMed] [Google Scholar]
- Demirjian, A. , Goldstein, H. , & Tanner, J. M. (1973). A new system of dental age assessment. Human Biology, 45, 211–227. [PubMed] [Google Scholar]
- Enlow, D. H. , & Hans, M. G. (1996). Essentials of facial growth. American Journal of Orthodontics and Dentofacial Orthopedics, 110(5), 568. [Google Scholar]
- Forssberg, H. (1985). Ontogeny of human locomotor control I. Infant stepping, supported locomotion and transition to independent locomotion. Experimental Brain Research, 57, 480–493. 10.1007/BF00237835 [DOI] [PubMed] [Google Scholar]
- Frisancho, A. R. , Garn, S. M. , & Ascoli, W. (1970). Subperiosteal and endosteal bone apposition during adolescence. Human Biology, 42(4), 639–664. [PubMed] [Google Scholar]
- García‐González, R. , Carretero, J. M. , Rodríguez, L. , & Arsuaga, J. L. (2019). Two new methodological approaches for assessing skeletal maturity in archeological human remains based on the femoral distal epiphysis. Archaeological and Anthropological Sciences, 11, 6515–6536. 10.1007/s12520-019-00920-6 [DOI] [Google Scholar]
- García‐González, R. , Rodríguez, L. , & Carretero, J. M. (2021). Sexing subadult individuals: What morphological method is the most appropriate? European Journal of Anatomy, 25, 147–163. [Google Scholar]
- García‐González, R. , Rodríguez, L. , Muñoz‐Guarinos, J. , Sánchez‐Puente, Z. , Fernández‐Viejo, M. , Cirotto, N. , Navarro‐Pérez, A. , García Barreiro, M. , Salazar‐Fernández, A. , Quintino, Y. , Adán‐Álvarez, G. , & Carretero, J. M. (2024). Paleodemographic profiles of the populations buried in San Pablo Convent (Burgos, Spain). ENTEMU, XX, 2024 (In press).
- Garn, S. M. (1970). Calcium requirements for bone building and skeletal maintenance. American Journal of Clinical Nutrition, 23, 1149–1150. [DOI] [PubMed] [Google Scholar]
- Garn, S. M. , Guzmán, M. A. , & Wagner, B. (1969). Subperiosteal gain and endosteal loss in protein‐calorie malnutrition. American Journal of Physical Anthropology, 30(1), 153–155. 10.1002/ajpa.1330300120 [DOI] [PubMed] [Google Scholar]
- Garn, S. M. , Rohmann, C. G. , Béhar, M. , Viteri, F. , & Guzman, M. A. (1964). Compact bone deficiency in protein‐calorie malnutrition. Science, 145(3639), 1444–1445. 10.1126/science.145.3639.144 [DOI] [PubMed] [Google Scholar]
- Goldman, H. M. , McFarlin, S. C. , Cooper, D. M. , Thomas, C. D. L. , & Clement, J. G. (2009). Ontogenetic patterning of cortical bone microstructure and geometry at the human mid‐shaft femur. The Anatomical Record, 292(1), 48–64. 10.1002/ar.20778 [DOI] [PubMed] [Google Scholar]
- Gosman, J. H. , Hubbell, Z. R. , Shaw, C. N. , & Ryan, T. M. (2013). Development of cortical bone geometry in the human femoral and tibial diaphysis. The Anatomical Record, 296(5), 774–787. 10.1002/ar.22688 [DOI] [PubMed] [Google Scholar]
- Gosman, J. H. , Stout, S. D. , & Larsen, C. S. (2011). Skeletal biology over the life span: A view from the surfaces. American Journal of Physical Anthropology, 146, 86–98. 10.1002/ajpa.21612 [DOI] [PubMed] [Google Scholar]
- Hallemans, A. , D'Août, K. , De Clercq, D. , & Aerts, P. (2003). Pressure distribution patterns under the feet of new walkers: The first two months of independent walking. Foot & Ankle International, 24, 444–453. 10.1177/107110070302400513 [DOI] [PubMed] [Google Scholar]
- Hallemans, A. , De Clercq, D. , & Aerts, P. (2006). Changes in 3D joint dynamics during the first 5 months after the onset of independent walking: A longitudinal follow‐up study. Gait & Posture, 24, 270–279. 10.1016/j.gaitpost.2005.10.003 [DOI] [PubMed] [Google Scholar]
- Holt, B. M. (2003). Mobility in upper Paleolithic and Mesolithic Europe: Evidence from the lower limb. American Journal of Physical Anthropology, 122(3), 200–215. 10.1002/ajpa.10256 [DOI] [PubMed] [Google Scholar]
- Hubbell, Z. , Gosman, J. H. , Shaw, C. N. , & Ryan, T. M. (2011). Age‐related changes in cortical bone geometry in the human tibial diaphysis: A whole‐bone perspective. Journal of Bone and Mineral Research, 26, S389–S787. 10.1002/ar.22688 [DOI] [Google Scholar]
- Hummert, J. R. (1983). Cortical bone growth and dietary stress among subadults from Nubia's Batn El Hajar. American Journal of Physical Anthropology, 62(2), 167–176. 10.1002/ajpa.1330620206 [DOI] [PubMed] [Google Scholar]
- Huss‐Ashmore, R. (1981). Bone growth and remodeling as a measure of nutritional stress. In Martin D. L. & Bumsted M. P. (Eds.), Research Reports 20 Biocultural adaptation: Comprehensive approaches to skeletal analysis (pp. 84–95). University of Massachusetts. [Google Scholar]
- Ivanenko, Y. P. , Dominici, N. , Cappellini, G. , Dan, B. , Cheron, G. , & Lacquaniti, F. (2004). Development of pendulum mechanism and kinematic coordination from the first unsupported steps in toddlers. Journal of Experimental Biology, 207, 3797–3810. [DOI] [PubMed] [Google Scholar]
- Johnston, R. A. , & Cowgill, L. W. (2018). The effect of muscle mass and exercise on proximal femoral shaft strength in NHANES III runners. American Journal of Physical Anthropology, 165, 134. [Google Scholar]
- Kontulainen, S. A. , Macdonald, H. M. , Khan, K. M. , & McKay, H. A. (2005). Examining bone surfaces across puberty: A 20‐month pQCT trial. Journal of Bone and Mineral Research, 20(7), 1202–1207. 10.1359/JBMR.050214 [DOI] [PubMed] [Google Scholar]
- Lamer, M. , Spake, L. , & Cardoso, H. F. (2021). Testing the cross‐applicability of juvenile sex estimation from diaphyseal dimensions. Forensic Science International, 321, 110739. 10.1016/j.forsciint.2021.110739 [DOI] [PubMed] [Google Scholar]
- Larsen, C. S. (1997). Bioarchaeology: Interpreting behavior from the human skeleton (Vol. 69). Cambridge University Press. [Google Scholar]
- Liversidge, H. M. , Chaillet, N. , Mörnstad, H. , Nyström, M. , Rowlings, K. , Taylor, J. , & Willems, G. (2006). Timing of Demirjian's tooth formation stages. Annals of Human Biology, 33(4), 454–470. 10.1080/03014460600802387 [DOI] [PubMed] [Google Scholar]
- Liversidge, H. M. , & Molleson, T. (2004). Variation in crown and root formation and eruption of human deciduous teeth. American Journal of Physical Anthropology, 123(2), 172–180. 10.1002/ajpa.10318 [DOI] [PubMed] [Google Scholar]
- Loth, S. R. , & Henneberg, M. (2001). Sexually dimorphic mandibular morphology in the first few years of life. American Journal of Physical Anthropology, 115(2), 179–186. 10.1002/ajpa.1067 [DOI] [PubMed] [Google Scholar]
- Lovejoy, C. O. (1988). Evolution of human walking. Scientific American, 259(5), 118–125. [DOI] [PubMed] [Google Scholar]
- Lovejoy, C. O. , & Trinkaus, E. (1980). Strength and robusticity of the Neandertal tibia. American Journal of Physical Anthropology, 53(4), 465–470. 10.1002/ajpa.1330530402 [DOI] [Google Scholar]
- Macdonald, H. , Kontulainen, S. , Petit, M. , Janssen, P. , & McKay, H. (2006). Bone strength and its determinants in pre‐and early pubertal boys and girls. Bone, 39(3), 598–608. 10.1016/j.bone.2006.02.057 [DOI] [PubMed] [Google Scholar]
- McHenry, H. M. , & Corruccini, R. S. (1978). The femur in early human evolution. American Journal of Physical Anthropology, 49(4), 473–487. 10.1002/ajpa.1330490407 [DOI] [PubMed] [Google Scholar]
- Molleson, T. , Cruse, K. , & Mays, S. (1998). Some sexually dimorphic features of the human juvenile skull and their value in sex determination in immature skeletal remains. Journal of Archaeological Science, 25, 719–728. [Google Scholar]
- Muggeo, V. M. R. (2003). Estimating regression models with unknown break‐points. Statistics in Medicine, 22, 3055–3071. 10.1002/sim.1545 [DOI] [PubMed] [Google Scholar]
- Narra, N. , Nikander, R. , Viik, J. , Hyttinen, J. , & Sievänen, H. (2013). Femoral neck cross‐sectional geometry and exercise loading. Clinical Physiology and Functional Imaging, 33(4), 258–266. 10.1111/cpf.12022 [DOI] [PubMed] [Google Scholar]
- Osipov, B. , Temple, D. , Cowgill, L. , Harrington, L. , Bazaliiskii, V. I. , & Weber, A. W. (2016). Evidence for genetic and behavioral adaptations in the ontogeny of prehistoric hunter‐gatherer limb robusticity. Quaternary International, 405, 134–146. 10.1016/j.quaint.2015.09.093 [DOI] [Google Scholar]
- Ousley, S. D. , Milner, G. R. , Boldsen, J. L. , Getz, S. M. , Weise, S. , & Tarp, P. (2020). Transition Analysis 3. V 0.8.4 .
- Pearson, O. M. , & Lieberman, D. E. (2004). The aging of Wolff's “law”: Ontogeny and responses to mechanical loading in cortical bone. American Journal of Physical Anthropology, 125(S39), 63–99. 10.1002/ajpa.20155 [DOI] [PubMed] [Google Scholar]
- Pina, M. , Alba, D. M. , Almécija, S. , Fortuny, J. , & Moyà‐Solà, S. (2012). Brief communication: Paleobiological inferences on the locomotor repertoire of extinct hominoids based on femoral neck cortical thickness: The fossil great ape hispanopithecus laietanus as a test‐case study. American Journal of Physical Anthropology, 149(1), 142–148. [DOI] [PubMed] [Google Scholar]
- Pujol, A. , Rissech, C. , Ventura, J. , Badosa, J. , & Turbón, D. (2014). Ontogeny of the female femur: Geometric morphometric analysis applied on current living individuals of a Spanish population. Journal of Anatomy, 225(3), 346–357. 10.1111/joa.12209 [DOI] [PMC free article] [PubMed] [Google Scholar]
- Pujol, A. , Rissech, C. , Ventura, J. , & Turbón, D. (2016). Ontogeny of the male femur: Geometric morphometric analysis applied to a contemporary Spanish population. American Journal of Physical Anthropology, 159(1), 146–163. 10.1002/ajpa.22846 [DOI] [PubMed] [Google Scholar]
- R Core Team . (2021). R: A language and environment for statistical computing. R Foundation for Statistical Computing. https://www.R-project.org/ [Google Scholar]
- Richmond, B. G. , & Jungers, W. L. (2008). Orrorin tugenensis femoral morphology and the evolution of hominin bipedalism. Science, 319(5870), 1662–1665. 10.1126/science.1154197 [DOI] [PubMed] [Google Scholar]
- Rodríguez, L. , Carretero, J. M. , García‐González, R. , & Arsuaga, J. L. (2018). Cross‐sectional properties of the lower limb long bones in the middle Pleistocene Sima de los Huesos sample (sierra de Atapuerca, Spain). Journal of Human Evolution, 117, 1–12. 10.1016/j.jhevol.2017.11.007 [DOI] [PubMed] [Google Scholar]
- Rogol, A. D. , Roemmich, J. N. , & Clark, P. A. (2002). Growth at puberty. Journal of Adolescent Health, 31(6), 192–200. [DOI] [PubMed] [Google Scholar]
- Ruff, C. (1987). Sexual dimorphism in human lower limb bone structure: Relationship to subsistence strategy and sexual division of labor. Journal of Human Evolution, 16(5), 391–416. 10.1016/0047-2484(87)90069-8 [DOI] [Google Scholar]
- Ruff, C. B. (1995). Biomechanics of the hip and birth in early Homo. American Journal of Physical Anthropology, 98(4), 527–574. [DOI] [PubMed] [Google Scholar]
- Ruff, C. (2003a). Ontogenetic adaptation to bipedalism: Age changes in femoral to humeral length and strength proportions in humans, with a comparison to baboons. Journal of Human Evolution, 45(4), 317–349. 10.1016/j.jhevol.2003.08.006 [DOI] [PubMed] [Google Scholar]
- Ruff, C. (2003b). Growth in bone strength, body size, and muscle size in a juvenile longitudinal sample. Bone, 33(3), 317–329. 10.1016/S8756-3282(03)00161-3 [DOI] [PubMed] [Google Scholar]
- Ruff, C. B. (2006). MomentMacro.
- Ruff, C. B. (2008). Biomechanical analyses of archaeological human skeletal samples. In Katzenburg M. A. & Saunders S. R. (Eds.), Biological anthropology of the human skeleton (2nd ed., pp. 183–206). Wiley. [Google Scholar]
- Ruff, C. B. (2018). Biomechanical analyses of archaeological human skeletons. In Katzenberg M. A. & Grauer A. L. (Eds.), Biological anthropology of the human skeleton (Third ed., pp. 189–224). John Wiley & Sons Inc. 10.1002/9781119151647.ch6 [DOI] [Google Scholar]
- Ruff, C. B. , & Hayes, W. C. (1983). Cross‐sectional geometry of Pecos Pueblo femora and tibiae—A biomechanical investigation: I. Method and general patterns of variation. American Journal of Physical Anthropology, 60(3), 359–381. [DOI] [PubMed] [Google Scholar]
- Ruff, C. B. , & Higgins, R. (2013). Femoral neck structure and function in early hominins. American Journal of Physical Anthropology, 150(4), 512–525. 10.1002/ajpa.22214 [DOI] [PubMed] [Google Scholar]
- Ruff, C. B. , Holt, B. M. , Sládek, V. , Berner, M. , Murphy, W. A., Jr. , Zur Nedden, D. , Seidler, H. , & Recheis, W. (2006). Body size, body proportions, and mobility in the Tyrolean “iceman”. Journal of Human Evolution, 51(1), 91–101. 10.1016/j.jhevol.2006.02.001 [DOI] [PubMed] [Google Scholar]
- Ruff, C. B. , Trinkaus, E. , Walker, A. , & Larsen, C. S. (1993). Postcranial robusticity in homo. I: Temporal trends and mechanical interpretation. American Journal of Physical Anthropology, 91(1), 21–53. 10.1002/ajpa.1330910103 [DOI] [PubMed] [Google Scholar]
- Ruff, C. B. , Walker, A. , & Trinkaus, E. (1994). Postcranial robusticity in homo. III: Ontogeny. American Journal of Physical Anthropology, 93(1), 35–54. 10.1002/ajpa.1330930103 [DOI] [PubMed] [Google Scholar]
- Ryan, T. M. , & Krovitz, G. E. (2006). Trabecular bone ontogeny in the human proximal femur. Journal of Human Evolution, 51(6), 591–602. 10.1016/j.jhevol.2006.06.004 [DOI] [PubMed] [Google Scholar]
- Scheuer, L. (2002). Application of osteology to forensic medicine. Clinical Anatomy: The Official Journal of the American Association of Clinical Anatomists and the British Association of Clinical Anatomists, 15(4), 297–312. 10.1002/ca.10028 [DOI] [PubMed] [Google Scholar]
- Schoenau, E. , Neu, C. M. , Rauch, F. , & Manz, F. (2001). The development of bone strength at the proximal radius during childhood and adolescence. The Journal of Clinical Endocrinology & Metabolism, 86(2), 613–618. 10.1210/jcem.86.2.7186 [DOI] [PubMed] [Google Scholar]
- Schug, G. R. , & Goldman, H. M. (2014). Birth is but our death begun: A bioarchaeological assessment of skeletal emaciation in immature human skeletons in the context of environmental, social, and subsistence transition. American Journal of Physical Anthropology, 155(2), 243–259. 10.1002/ajpa.22536 [DOI] [PubMed] [Google Scholar]
- Schutkowski, H. (1993). Sex determination of infant and juvenile skeletons: I. Morphognostic features. American Journal of Physical Anthropology, 90(2), 199–205. 10.1002/ajpa.1330900206 [DOI] [PubMed] [Google Scholar]
- Seeman, E. (2001). Sexual dimorphism in skeletal size, density, and strength. The Journal of Clinical Endocrinology & Metabolism, 86(10), 4576–4584. 10.1210/jcem.86.10.7960 [DOI] [PubMed] [Google Scholar]
- Seeman, E. (2003). The structural and biomechanical basis of the gain and loss of bone strength in women and men. Endocrinology and Metabolism Clinics, 32(1), 25–38. 10.1016/S0889-8529(02)00078-6 [DOI] [PubMed] [Google Scholar]
- Seeman, E. (2004). The growth and age‐related origins of bone fragility in men. Calcified Tissue International, 75, 100–109. [DOI] [PubMed] [Google Scholar]
- Shackelford, L. L. (2007). Regional variation in the postcranial robusticity of late upper Paleolithic humans. American Journal of Physical Anthropology, 133(1), 655–668. 10.1002/ajpa.20567 [DOI] [PubMed] [Google Scholar]
- Sheridan, S. G. , & Mittler, D. M. (1992). Sex determination in subadults using auricular surface morphology: A forensic science perspective. Journal of Forensic Sciences, 37(4), 1068–1075. 10.1520/JFS13293J [DOI] [PubMed] [Google Scholar]
- Siervogel, R. M. , Demerath, E. W. , Schubert, C. , Remsberg, K. E. , Chumlea, W. C. , Sun, S. , Czerwinski, S. A. , & Towne, B. (2003). Puberty and body composition. Hormone Research, 60(Suppl. 1), 36–45. [DOI] [PubMed] [Google Scholar]
- Sládek, V. , Sabolová, V. , Šebesta, O. , Zikmund, T. , Kaiser, J. , & Čerevková, S. (2018). Effect of deriving periosteal and endosteal contours from micro CT scans on computation of cross‐sectional properties in non‐adults: The femur. Journal of Anatomy, 233(3), 381–393. [DOI] [PMC free article] [PubMed] [Google Scholar]
- Sparacello, V. S. , & Pearson, O. M. (2010). The importance of accounting for the area of the medullary cavity in cross‐sectional geometry: A test based on the femoral midshaft. American Journal of Physical Anthropology, 143(4), 612–624. [DOI] [PubMed] [Google Scholar]
- Stamos, P. A. , & Weaver, T. D. (2020). Ontogeny of the distal femoral metaphyseal surface and its relationship to locomotor behavior in hominoids. American Journal of Physical Anthropology, 172(3), 462–474. 10.1002/ajpa.24036 [DOI] [PubMed] [Google Scholar]
- Stock, J. , & Pfeiffer, S. (2001). Linking structural variability in long bone diaphyses to habitual behaviors: Foragers from the southern African later Stone age and the Andaman Islands. American Journal of Physical Anthropology, 115(4), 337–348. 10.1002/ajpa.1090 [DOI] [PubMed] [Google Scholar]
- Stock, J. T. , & Pfeiffer, S. K. (2004). Long bone robusticity and subsistence behaviour among later Stone age foragers of the forest and fynbos biomes of South Africa. Journal of Archaeological Science, 31(7), 999–1013. 10.1016/j.jas.2003.12.012 [DOI] [Google Scholar]
- Stock, J. T. , & Shaw, C. N. (2007). Which measures of diaphyseal robusticity are robust? A comparison of external methods of quantifying the strength of long bone diaphyses to cross‐sectional geometric properties. American Journal of Physical Anthropology, 134(3), 412–423. [DOI] [PubMed] [Google Scholar]
- Stull, K. E. , & Godde, K. (2013). Sex estimation of infants between birth and one year through discriminant analysis of the humerus and femur. Journal of Forensic Sciences, 58(1), 13–20. 10.1111/j.1556-4029.2012.02286.x [DOI] [PubMed] [Google Scholar]
- Stull, K. E. , L'Abbé, E. N. , & Ousley, S. D. (2017). Subadult sex estimation from diaphyseal dimensions. American Journal of Physical Anthropology, 163(1), 64–74. 10.1002/ajpa.23185 [DOI] [PubMed] [Google Scholar]
- Sutherland, D. (1997). The development of mature gait. Gait & Posture, 6, 163–170. 10.1016/S0966-6362(97)00029-5 [DOI] [Google Scholar]
- Sutter, R. C. (2003). Nonmetric subadult skeletal sexing traits: I. A blind test of the accuracy of eight previously proposed methods using prehistoric known‐sex mummies from northern Chile. Journal of Forensic Sciences, 48(5), 927–935. [PubMed] [Google Scholar]
- Swan, K. R. , Ives, R. , Wilson, L. A. , & Humphrey, L. T. (2020). Ontogenetic changes in femoral cross‐sectional geometry during childhood locomotor development. American Journal of Physical Anthropology, 173(1), 80–95. 10.1002/ajpa.24080 [DOI] [PubMed] [Google Scholar]
- Tanner, J. M. (1978). Foetus into man: Physical growth from conception to maturity. Harvard University Press. [Google Scholar]
- Tardieu, C. , & Damsin, J. P. (1997). Evolution of the angle of obliquity of the femoral diaphysis during growth — Correlations. Surgical and Radiologic Anatomy, 19, 91–97. [PubMed] [Google Scholar]
- Temple, D. H. , Bazaliiskii, V. I. , Goriunova, O. I. , & Weber, A. W. (2013). Skeletal growth in early and late Neolithic foragers from the cis‐Baikal region of eastern Siberia. American Journal of Physical Anthropology, 153(3), 377–386. 10.1002/ajpa.22436 [DOI] [PubMed] [Google Scholar]
- Thelen, E. , & Fisher, D. M. (1982). Newborn stepping: An explanation for a "disappearing" reflex. Developmental Psychology, 18, 760–775. [Google Scholar]
- Trinkaus, E. (1997). Appendicular robusticity and the paleobiology of modern human emergence. Proceedings of the National Academy of Sciences, 94(24), 13367–13373. 10.1073/pnas.94.24.13367 [DOI] [PMC free article] [PubMed] [Google Scholar]
- Trinkaus, E. , & Ruff, C. B. (2012). Femoral and Tibial Diaphyseal cross‐sectional geometry in Pleistocene homo . PaleoAnthropology, 2012, 13–62. 10.4207/PA.2012.ART69 [DOI] [Google Scholar]
- Trinkaus, E. , Ruff, C. B. , Esteves, F. , Coelho, J. M. S. , Silva, M. , & Mendova, M. (2002a). The lower limb remains. In Zilhao J. & Trinkaus E. (Eds.), Portrait of the artist as a child (pp. 435–465). Intituto Portugues de Arqueologia. [Google Scholar]
- Trinkaus, E. , Ruff, C. B. , Esteves, F. , Coelho, J. M. S. , Silva, M. , & Mendova, M. (2002b). The upper limb remains. In Zilhao J. & Trinkaus E. (Eds.), Portrait of the artist as a child (pp. 466–488). Instituto Portugues de Arqueologia. [Google Scholar]
- Van Gerven, D. P. , Hummert, J. R. , & Burr, D. B. (1985). Cortical bone maintenance and geometry of the tibia in prehistoric children from Nubia's Batn el Hajar. American Journal of Physical Anthropology, 66(3), 275–280. 10.1002/ajpa.1330660304 [DOI] [PubMed] [Google Scholar]
- Veldhuis, J. D. , Roemmich, J. N. , Richmond, E. J. , & Bowers, C. Y. (2006). Somatotropic and gonadotropic axes linkages in infancy, childhood, and the puberty‐adult transition. Endocrine Reviews, 27(2), 101–140. [DOI] [PubMed] [Google Scholar]
- Vlak, D. , Roksandic, M. , & Schillaci, M. A. (2008). Greater sciatic notch as a sex indicator in juveniles. American Journal of Physical Anthropology, 137(3), 309–315. 10.1002/ajpa.20875 [DOI] [PubMed] [Google Scholar]
- Watts, E. S. (1986). Evolution of the human growth curve. In Human growth: A comprehensive treatise volume 1 developmental biology prenatal growth (pp. 153–166). Springer US. [Google Scholar]
- Weaver, D. S. (1980). Sex differences in the ilia of a known sex and age sample of fetal and infant skeletons. American Journal of Physical Anthropology, 52, 191–195. 10.1002/ajpa.1330520205 [DOI] [PubMed] [Google Scholar]
- Wescott, D. J. (2006). Effect of mobility on femur midshaft external shape and robusticity. American Journal of Physical Anthropology, 130(2), 201–213. 10.1002/ajpa.20316 [DOI] [PubMed] [Google Scholar]
- Zebaze, R. M. , Jones, A. , Welsh, F. , Knackstedt, M. , & Seeman, E. (2005). Femoral neck shape and the spatial distribution of its mineral mass varies with its size: Clinical and biomechanical implications. Bone, 37(2), 243–252. [DOI] [PubMed] [Google Scholar]
- Zeininger, A. , Schmitt, D. , Jensen, J. L. , & Shapiro, L. J. (2018). Ontogenetic changes in foot strike pattern and calcaneal loading during walking in young children. Gait & Posture, 59, 18–22. 10.1016/j.gaitpost.2017.09.02 [DOI] [PubMed] [Google Scholar]
Associated Data
This section collects any data citations, data availability statements, or supplementary materials included in this article.
Data Availability Statement
The raw data that support the findings of this study are available upon request to the authors.