

Abstract
The Arthur M. Sackler Colloquium of the National Academy of Sciences, “Frontiers in Bioinformatics: Unsolved Problems and Challenges,” organized by David Eisenberg, Russ Altman, and myself, was held October 15-17, 2004, to provide a forum for discussing concepts and methods in bioinformatics serving the biological and medical sciences. The deluge of genomic and proteomic data in the last two decades has driven the creation of tools that search and analyze biomolecular sequences and structures. Bioinformatics is highly interdisciplinary, using knowledge from mathematics, statistics, computer science, biology, medicine, physics, chemistry, and engineering.
Keywords: blast, repeat sequences, r-scan statistics, frequent and rare oligonucleotides and peptides
More than 200 bacterial, 20 archaeal, and 20 eukaryotic genomes as well as 1,600 viral genomes have been completely sequenced. Moreover, several hundred mitochondrial chromosomal sets and at least 30 chromosomal plastids have been sequenced. A deeper understanding of basic biology can be gained from a comparison of organisms in different evolutionary lineages, and this understanding is the aim of the currently intense sequencing efforts. New species thriving in environments throughout the earth and oceans reveal microbes in geothermal areas, in arctic ice, in acidic springs, in toxic waste sites, in assorted air currents, and in subterranean habitats (1, 2). Unique mixes of microbes that thrive in different ecosystems have been described (3). For example, a new type of bacterial rhodopsin was discovered by genomic analysis of naturally occurring marine bacterioplankton (4). Prokaryote genomic samples from the human oral cavity and the intestinal tract, and their changes in time, are progressively being followed (5). The diversity of microbes in cutaneous wounds of humans is of great practical importance. Sequencing efforts facilitate health research and understanding of pathogenesis and may have commercial, industrial, and agricultural benefits as well. It is clear that lack of data is not a problem today; rather, the challenge will be the analysis of the vast quantity of information already available.
Bioinformatic methods underlie most of computational biology. Current emphasis is on computationally efficient and wide-ranging algorithms that have been implemented and tested on real and simulated data sets. Exact and empirical algorithms have been applied to genomics, proteomics, gene networks, structure prediction, and drug design. Bioinformatic tools are used daily, including the generalized blast programs (sequence similarity evaluations) (6-9); genscan and genie (gene discovery) (10, 11); saps (statistical analysis of protein sequences) (12); clustal and iteralign (multiple sequence alignment) (13, 14); r-scan statistics (15) (detecting anomalous spacing of specific markers distributed along a sequence); and “frequent” and “rare” oligonucleotides and peptides (sequence words that occur statistically more or less frequently than would be expected by chance) (16-18).
The standard blast protocol compares a query sequence with a large database of protein sequences to uncover significant similarities that help to circumscribe function and structure of the query sequence. blast-like programs are extended to searches using multiple alignments (13, 14, 19); to single-sequence analyses (20), e.g., to identify DNA-binding peptides and transmembrane tracts; and to three-dimensional analyses, e.g., to identify charge clusters in protein structures and cysteine knots (21, 22). The blast programs currently serve ≈250,000 queries per day at the National Center for Biotechnology Information (NCBI) in Washington, DC. The theory relies on fundamental properties of extremal statistical distributions and the stochastic theory of large deviations (23-25). There are natural relationships between these analyses and studies on the maximum service time among customers in queuing systems, as well as in applications to insurance risk and traffic flow models (see refs. 26 and 27 and below)
DNA microarrays (DNA chips) aim to dissect gene expression under varied physiological, clinical, and environmental conditions. Microarrays are used to monitor well characterized genes in different situations; to discover disease genes; to assess gene expression during treatment with drugs, chemicals, or toxins; to discover genes that compensate for knockout mutations; and to profile gene expression in temporal and in tissue-specific localizations (28-30). Experimental evaluations of protein abundances under different cellular conditions can be assayed by two-dimensional gel electrophoresis (31) and supplemented by mass spectrometry, antibody associations, and biochemical tests. Codon usage analysis offers another way to evaluate gene expression with a different set of limitations (32-34). Ribosomal protein (RP) codon frequencies deviate strongly from average codon frequencies in many bacteria, especially during rapid growth. By contrast, the expression levels for RPs in archaea are variable; 15-30% of archaeal genes have average codon usage (35, 36). The most biased codon usages are found for genes generally involved in general processes of transcription/translation, chaperone/degradation, and energy metabolism (33, 34).
Highlights of the Sackler Colloquium
Discussions at the Colloquium focused on the following topics: sequence patterns (12, 18, 20), comparative genomics and proteomics, modeling of molecular interactions and gene regulatory networks, management and interpretation of protein expression data (33, 34), microarrays (29), over- and underrepresentations of words in genomes and proteomes, molecular evolution (37-39), alternative splicing (40-43), polymorphisms and SNPs (44), genomic haplotypes (HAP-MAP) (45), and three-dimensional macromolecular taxonomy (46). In this article, I will summarize results and perspectives issuing from Colloquium talks and then review some general concepts and methods of bioinformatics.
George Miklos called attention to difficulties arising from noise in microarray data sets. Conflicts in the clinical application of microarray data to cancers and complex diseases are exposed in refs. 47 and 48. Marc Gerstein reviewed data on the numbers and distribution of pseudogenes (called fossil records) over several complete eukaryotic genomes, especially the human genome. Ribosomal protein genes predominate among pseudogenes in human sequences counting more than 2,000 cases (49, 50). In chromosomes 21 and 22 (see ref. 51), the median length of processed pseudogenes is approximately the same median length as that of singleexon (intronless) genes. The median length of single-exon genes is approximately congruent to the median internal exon length times the average number of exons per gene. These observations support the proposition that many single-exon genes derive from processed multiexon genes transposed into the genome (51). David Haussler identified the most conserved (called ultraconserved) intergenic regions across several higher eukaryotic genomes (human, chimpanzee, mouse, rat, dog, and chicken) and attributes this conservation to purifying selection (52). Pavel Pezner described synteny (genome rearrangements) and characterizations of breakpoints in mammalian genomes (53).
Several Colloquium talks focused on the regulatory role of RNA selection pressure and aspects of splicing. Chris Burge used the specificity of splicing to identify exons in the proximity of exonsplice enhancer sequences and exonsplice silencer sequences (54, 55). Chris Lee pointed out that alternative splicing (AS) in humans is found at levels from 60% to 80%, according to tissue, developmental stage, and disease contingencies. Some AS exons can be related to protein domains. On human chromosome 22, at least 25% of gene structures have 5′ and 3′ untranslated exons (UTEs) (51). These UTEs may play an important role in AS, as in the case of G protein-coupled receptor proteins. These analyses were carried out on alternatively spliced exons in comparing human-chimp, mouse-rat, and humanmouse sequences. Amino acid mutation differences and synonymous mutation differences could be interpreted in terms of AS. Synonymous mutations are known to disrupt existing splicing signals as they introduce new splicing signals leading to potential human diseases. Lee proposed that AS is adaptive and positively selected during evolution and hypothesized the creation of new exons by means of an AS mechanism (56). He emphasized RNA-level selection pressures distinguished from protein-level selection. Shawn Eddy discussed RNA genes and RNA-based regulatory circuits that control gene function (57).
Two sessions focused on proteomic interactions, networks of molecular interactions, and chromosomal adjacency of the interacting genes. Per Bork described gene control in metazoans and how it influences genome evolution. He proffered a gene neighborhood on predicting gene function (43). Hanah Margalit reported how gene regulation and the arrangement of protein pairs participate in protein-protein interactions in Escherichia coli and Saccharomyces cerevisiae. She displayed situations of chromosomal adjacency among these genes (58). Shoshana Wodak also dealt with protein-protein interaction and the structural problem of docking (59). David Eisenberg reviewed several programs relevant to the study of protein interactions comparing multiple bacterial genomes. The information can be applied in structural genomics to determine protein partners and predict protein interactions (60, 61). An interesting family of proteins featured in Eisenberg's talk are the PGRS (polymorphic GC-rich repetitive sequences) of Mycobacterium tuberculosis. There are genes for ≈70 such proteins in the M. tuberculosis genome that have many glycine-glycine doublets, have few charged, aliphatic, or aromatic residues, and are virtually devoid of cysteine residues. Their composition precludes electrostatic, hydrophobic, or disulfide-bridge interactions. M. tuberculosis pathogenicity islands contain putative PGRS genes (62), and there is evidence to suggest that the proteins encoded by these genes are surface-exposed and can obstruct the host immune system. Some experimental evidence suggests that several PGRS genes contribute virulence and persistence of M. tuberculosis in macrophage environments (63).
Michael Levitt compared a hierarchy of programs useful for structural protein alignment (64). Helen Berman reviewed the tools available for probing the Protein Data Bank (PDB) crystallographic database (65). Volker Brendel and Terry Gaasterland discussed the functional plant genomics of Arabidopsis thaliana and maize. The challenges of building databases that associate genotype with phenotype were discussed by Russ Altman (66). My focus was on the subject of a characterization of the highly expressed genes in archaeal genomes (35).
Context-dependent mutational processes (mutations that depend on flanking nucleotide content) in mammalian species were considered by Phil Green (67) who emphasized the methylation-deamination-mutation scenario associated with the low frequency of the CpG dinucleotide. Green proposed that mutational asymmetry results from transcription-coupled repair. He also discussed a generation time effect of mutations that occur in conjunction with DNA replication (68). CpG mutations have been reported to have a reduced generation time effect (67).
CpG Dinucleotide Suppression
The role of CpG dinucleotides, particularly in the context of CpG methylation, is of considerable interest (e.g., see ref. 69). In addition to causing increased mutation rates, CpG methylation alters the shape of the major groove of DNA, leading to modified chromatin structure, and thus it is capable of altering patterns and rates of gene transcription (70). Recent studies in humans have shown that the nonpromoter CpG islands are targets for de novo methylation, playing a role in cancer and aging (71). As a mechanism for modifying gene expression levels and tissue-specific expression, it offers regulatory possibilities that are exploited in genomic imprinting, X chromosome inactivation, transposon inactivation, and developmental processes (71-73). It has been suggested that methylation is partly a defense against the uptake and integration of foreign DNA (74). CpG islands have also been suggested to be origins of replication (75). However, CpG suppression can be strong even in the absence of CpG methylation (76).
A natural measure of dinucleotide bias is the symmetrized dinucleotide relative abundance values ρXpY = fXpY/fXfY, where fX, fY, and fXpY are the frequencies of the bases X and Y and the dinucleotide XpY, respectively, calculated over a DNA strand concatenated with its inverted complement. ρ can be computed for complete genomes or sequence “windows.” Statistically, the dinucleotide XpY is said to be underrepresented if ρXpY ≤ 0.78 and to be overrepresented if ρXpY ≥ 1.23 (18). Early biochemical experiments measuring nearest-neighbor frequencies established that the set of dinucleotide biases is a remarkably stable property of the DNA of an organism (77-79). From this perspective, the set of dinucleotide biases constitutes a “genomic signature” that can discriminate sequences from different organisms. The dinucleotide biases appear to reflect species-specific properties of the enzymes of DNA modification, replication, and repair. In addition, the genomic signature is useful for detecting pathogenicity islands and horizontal gene transfer between bacterial genomes (62).
Human nuclear DNA and that of other mammals is significantly CpG-suppressed, but generally nonvertebrate DNA does not have this property. Animal mtDNA is not methylated, apparently because methyltransferases cannot gain access to the mitochondrion, yet almost all metazoan mitochondria are CpG-suppressed (80). CpG has the highest free energy (stacking stability) of all dinucleotides, 16% higher than GpC (81). Accordingly, reduced CpG helps local strand separation, with the potential for higher replication and transcription rates, and easier access for host factors. Differences between species in their DNA replication, repair, and transcription machinery might favor different dinucleotide abundances; for example, through variations in processing efficiency and accuracy depending on local DNA structure (base-step configuration) and DNA curvature, DNA modifications, and generation of context-dependent mutation rates. DNA topology is determined principally by the base-step configuration, specifically through dinucleotide stacking energies and charge interactions (82). Further, many protein-DNA interactions involve DNA bending as well as sequencespecific interactions. DNA repair enzymes recognize lesions in DNA by their shape (83). Hence, the dinucleotide biases that characterize different genomes might result from coevolution of genome dinucleotides with genome maintenance processes (84-88).
Some Methods for Sequence Analysis
(i) Score-Based Sequence and Structure Analysis. The theory of score-based methods has been developed in three contexts: (i) analysis of a single sequence to identify distinctive sequence features (e.g., membrane tracts, proline concentrations, etc.), often reflected in motifs of appropriate high score (20, 23); (ii) comparisons among multiple sequences to identify segments having high similarity score (13, 14); and (iii) patterns that can be investigated in protein structures (e.g., charge clusters, cysteine knots, etc.) (21, 22).
(ii) r-scan Statistics. r-scan statistics provide means for characterizing nonrandomness in the distribution of a specific marker array in DNA and amino acid sequence data. r-scan methodology can also be used to discern significant peaks in the analysis of counts in sliding windows. In particular, r-scan statistics characterize clustering, overdispersion, or excessive evenness in the distribution of specific markers in a sequence. By varying r, sequence organization on different scales can be analyzed (15).
(iii) The Identity of Frequent (Abundant) and Rare (Avoided) Oligonucleotides and Peptides, Including General Analysis of Compositional Extremes. For example, the Chi sequence CGTGGTGG, abundant in the E. coli genome, is important in promoting recombination events. Over- and under-representation measures in evaluating compositional biases in short oligonucleotides include the examples of CpG dinucleotide suppression in vertebrates and the CTAG tetranucleotide underrepresentation in many proteobacterial and archaeal genomes.
(iv) Repeat Patterns. These occur at three levels: (i) microsatellites and minisatellites, e.g., the triplet repeats in neurological diseases; (ii) motifs, highly frequent occurrences of words of moderate length; and (iii) two or more occurrences of very long words that tolerate a few short mismatches and/or indels (89-91).
(v) Molecular Evolution. This method comprises prokaryotes compared to eukaryotes (36, 92), issues of horizontal gene transfer (93, 94), phylogenetic reconstructions (37, 38, 95-97), and the existence of three domains of life (98, 99). Conflicting results often accompany phylogenetic inference with respect to RNA, DNA, or protein sequences across diverse organisms (37). Causes contributing to these conflicts relate to ambiguities in identifying homologous characters in alignments, sensitivity of tree-making methods to unequal evolutionary rates (e.g., fast evolution), biases in species sampling, unrecognized paralogy, functional differentiation, and difficulties with the assumptions and approximations used to infer phylogeny. Attempts to surmount these difficulties by averaging over many proteins and gene order considerations are problematic because of inherent biases of selected families, lack of signal in others, and lateral transfer events, fusion, and/or chimerism. Assessing reliability by using the bootstrap protocol is strewn with obstacles because of lack of independence and inhomogeneity in the molecular data. Several recent methods with limitations of their own include the signature of Gupta (98), the genomic signature introduced by Karlin and colleagues (87), discrimination by protein domain Pfam content (100), and structural folds (38, 46).
Score-Based Methods
Probabilities of High-Scoring Segments. The simplest model is as follows (20). Let {X1, X2,..., Xn} be independent identically distributed (i.i.d.) letters drawn from a finite alphabet {ai} with associated scores {si} such that Prob{X = si} = pi, i = 1, 2,..., r, pi > 0, Σpi = 1. Let
 |
be the cumulative score process. The quantity
corresponds to a segment of sequence  with maximal aggregate score. The essential assumptions are that {Sm} entails a negative mean score and one or more si is positive. A quantity fundamental to the asymptotic (n → ∞) distribution of Mn is the unique positive root θ* of the equation E[exp(θ*X)] = 1 that is
 |
where E signifies expectation. It has been proven (24) for n large that
 |
[1] |
with accessible computation for K* and θ* (6, 20). The formula in Eq. 1 can be used to establish benchmarks of statistical significance. For example, we set the right side of Eq. 1 to some significance level, for example, p* = 0.01, and solve for x* = x(p*). A maximal segment score exceeding (ln n/θ*) + x* is significant at the p* level.
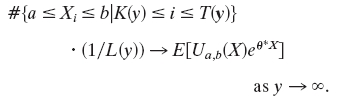
The analysis also provides information on the composition of high-scoring segments and related variables (6, 20, 23, 24, 101). For each level y > 0, let L(y) = T(y) - K(y) be the length extending from K(y) + 1 to T(y) as the first segment of aggregate score exceeding y (20). Let Um be a sequence of vector random variables where Um is independent of Xk, k ≠ m. Form
 |
so that W(y) cumulates Uk samples in a high-scoring segment. Then W(y)/L(y) → u* as y → ∞,  . Taking Xk ∈ A equal to 1 and 0 otherwise, then W(y)/L(y) is the fraction of samples in A that lie in a high-scoring segment. Thus, over high-scoring segments, the relative frequency of score si is approximately qi = piexp{θ*si} (6, 20). It follows that scores defined by si = ln(qi/pi) (a positive multiplicative scaling of si will not change any of the theory or its applications) identify high-scoring segments of target frequencies qi. These log ratio scores automatically satisfy the assumptions of negative mean score with some si positive.
Examples of Natural Scoring Assignments.
(i) Amino acid scores emphasizing positive charge. For Lys (K) and Arg (R) set s = +2; for Asp (D) and Glu (E) set s = -2; and for other amino acids set s = -1.
(ii) Scoring applied to gene finding (10, 18, 23). A 61 letter alphabet (codons) α = 1,..., 61; qα = observed frequency in coding; pα = observed frequency of triplet nucleotides generally; and sα = In(qα/pα).
(iii) Scores for hydrophobic proflies can be based on the Kyte-Doolittle scale or any of the many other scales for measuring hydrophobicity (102).
(iv) Scores derived from target frequencies. Letters in a high-scoring segment have an intrinsic biased composition such that letter ai occurs in these segments with frequency  . This result can be used as the basis for defining the scoring system. Suppose the overall letter frequencies are {
 }. Let {
 } be a set of target frequencies that corresponds to the composition in representative segments of the type we wish to identify. The scores si = In(qi/pi), i = 1, 2,..., r are appropriate because in a high-scoring segment letter ai occurs approximately with the frequency
  .
.
(v) High-scoring assignments that identify transmembrane protein segments (see Fig. 1). qi = frequencies over A segments (where A equals experimentally established transmembrane tracts) and pi = overall letter frequencies. The scores for high-scoring segments with si = log(qi/pi) generally identify transmembrane segments. Combining experimental data also can be adapted to identify DNA-binding proteins, signal peptides, and amphipathic helices (20).
Fig. 1.

High-scoring assignments to identify transmembrane protein segments. A, experimentally established transmembrane tracts.
Connections to Queuing Models. The standard G/G/1, one server queue, involves (i.i.d.) service times U1, U2,... and (i.i.d.) interarrival times T1, T2,... of successive customers (103). A stable queue results if  (the queue line does not become infinite). Let Ui − Ti = Xi. The maximal waiting time among the first n customer is the same as the maximal segment score of the sequence {
 ,}. The analysis also applies with Markov dependence among the {
 } and separately among the {
 }. Define
  ,
,  ; 0 otherwise. During high-scoring intervals
 |
In particular, during long waiting times among the first n customers, the fraction of interarrival times between a and b is  .
.
Multiple High-Scoring Segments. Applications of the scoring method often concern the sum of the t highest segment scores (23, 104). This assessment is relevant when there may be several distinct segments within the sequence of a given type (e.g., several transmembrane segments, multiple charge clusters, etc.). For sequence comparisons, insertions or deletions can break an alignment into several pieces. Denote the t highest-scoring segments of the model of Eq. 1 as  . It is convenient to deal with the centered segment scores
  ,
,  . The limiting density of
  is
is  defined on the domain
  .
.
The number of high-scoring segments of level  closely adheres to a Poisson distribution with parameter
  .
.
Maximal Score for Sequence Matching (23, 24). In DNA and protein sequences, matching segment scores are of the form  , where ai is the ith letter in the first sequence,
  is the jth letter in the second sequence, and F(x,y) is the score for the letter pair (x, y). The maximal segment score allowing shifts is
 |
Suppose the two sequences are independent:  i.i.d. following the distribution law μ(x) and
  . i.i.d. v(y). Of primary relevance is the case where the expected score per pair is negative and there is positive probability of attaining some positive pair score. So we assume
  ,
,  , in which case
  corresponds to a rare event. Also,
  where
where  . Determine
  to satisfy
  . The conjugate measure is defined to be
  , which is the two-dimensional analog of target frequencies. The relative entropy for two probability measures μ and v is the quantity
 |
 |
where  is the marginal x distribution of α and
  corresponds to the y variable. Condition E holds if F(x,y) = F(y,x), i.e., F is symmetric and μ ≈ v (i.e., μ and v are quite similar) (23-25).
Comparing Two Sequences (24). Let  be scores for the pairing
  that occur with probabilities
  . Assuming
  is negative,
  is the unique positive solution of
  , and the sequence lengths N and M grow roughly at similar rates, then the maximal matching segment score S satisfies the probability law
  .
.
The Significant Segment Pair Alignment (sspa) Protocol (14). A pairwise amino acid similarity matrix s(i,j) [e.g., BLOSUM, PAM (105, 106)] is often used to assess amino acid matching. Given two sequences to be aligned, the global similarity between the two protein sequences is scored as follows. First, all high-scoring segment pairs (HSSPs), significant at the 1% level, are identified. Next, the HSSPs are combined into a consistent alignment, labeled SSPA. The alignment score is the maximal value over all sets of sequence segments calculated by summing HSSP segment scores and then normalizing to allow comparisons among proteins of different sizes and quality (14). For the sequence pairing with at least one segment having a significantly high score match, additional segments are identified by using a lower threshold. The use of the reduced threshold helps to fill in regions between the more significant HSSPs. The SSPA scores can be used to deduce groupings of sequences. A group is deemed coherent if the sspa score within the group invariably exceeds the sspa scores with sequences not in the group and if the scores for all members of the group are consistent. The ITERALIGN multiple alignment method uses a symmetric-iterated protocol that combines a motif-finding procedure and a local dynamic programming procedure. The use of each sequence as a template to which all sequences are aligned distinguishes ITERALIGN from methods of progressive pairwise alignments. Consensus sequences are generated from each of the alignments, and the procedure is iterated leading to enhanced discrimination of conserved blocks of alignment and variable-length unaligned insertions. Each of the aligned blocks can be independently studied as a potential functional/structural unit.
Charge Clusters in Protein Sequences. A charge cluster indicates a nonrandom distribution of the charged residues in a protein sequence, producing high local concentrations of certain charge types. In eukaryotes, charge clusters are often associated with transcriptional activation, developmental control, and regulation of membrane receptor activity, and they are generally lacking in cytoplasmic enzymes and housekeeping proteins. Clusters of opposite charge in different proteins may mediate the formation of multiprotein complexes. Charge clusters of like sign may help to keep certain protein assemblages apart. Charge clusters within one protein could contribute to intramolecular folding or cooperative protein-protein and protein-nucleic acid interactions.
The percentage of proteins with significant charge clusters averages ≈20% to 25% in most eukaryotic species but only ≈7% in E. coli. Proteins with multiple charge clusters are uncommon, ≈3.5% in human, mouse, fly, and yeast, and extremely rare in E. coli (< 0.1%) (107). Most developmental control proteins in Drosophila (e.g., Antp, Bicoid, Ftz) carry at least one charge cluster, commonly proximal or overlapping a homeodomain or a zinc-finger region. The homeodomain is generally associated with a mixed-charge cluster that mediates DNA binding, often in a cooperative dimeric conformation. The homeoproteins Cut, Deformed, Engrailed, and Paired carry multiple charge clusters. The nervous system embryogenetic protein Cut (2175 residues long) contains five separated charge clusters, but a homeodomain ascribed to positions 1743-1803 does not qualify as a charge clusters by our statistical tests.
Regulatory proteins frequently interact with DNA, RNA, or other proteins. Electrostatic interactions that exert relatively long-range, rapid, and localized effects presumably mediate or facilitate processes such as protein sorting, translocation, docking, orientation, and binding to DNA and to other protein molecules. It is important to distinguish the occurrence of a charge cluster from a preponderant net charge over the whole protein. For example, the eukaryotic histones have a substantial net positive charge of at least 15%, but the charge distribution is without clusters.
Nonrandomness in a Marker Array Along a Sequence
Particular markers (e.g., specific DNA restriction sites, nucleosome placements, gene locations) are distributed along chromosomes. Let Xi be the gap (in DNA units) between the ith and the (i + 1)th markers. General issues of sequence heterogeneity lead to statistical considerations of the r-scan process { }, the array of distances between the ith and the (i + r)th markers, i = 1, 2, 3,..., where r is an integer parameter. It is of interest to characterize r-scan lengths harboring clusters or overdispersions of the markers along the sequence. n = number of markers. We form the order statistics
  . Let
. Let  (kth smallest),
  (kth largest), say k = 1, 2, 3;
  too small indicates clustering;
  too large and/or
  too small indicates significant evenness; and
  too large indicates overdispersion. The distribution of a marker is evaluated by comparing the distribution of {
 } calculated for a random sequence to those actually observed. Let the minimum and maximum r-scans be
  and
and  respectively. The theoretical probabilities for the extremal r-scan statistics of a marker array of n points distributed randomly (uniformly), are
 |
 |
These equations allow criteria whether minimum and maximum observed spacings deviate significantly from random expectations. For example, setting the probability of the minimum to a required significance (typically 0.01) yields the condition  , which is solved for xb yielding the threshold
  . For a sequence of length L, when
  , an r-scan cluster is asserted. Similarly, a significantly even spacing is indicated by
  , where ar* is determined from the first equation by setting the probability of m(r) to 0.99. For sampling from a density f(x),
 |
Distribution of the Tetranucleotide CTAG Sites in Human Herpesviruses and Proteobacterial Genomes. Human cytomegalovirus (229 kbp) contains 341 CTAG sites (frequency ≈ 0.0015). A 10-scan cluster at position 91832 stretching 1,046 bp gives the significant level (0.01), which overlaps the orilyt region of human cytomegalovirus (108). The Epstein-Barr virus (172 kbp) contains 342 CTAG sites (frequency ≈ 0.002). A significant 5-scan cluster occurs at position 53082 stretching 255 bp, which again overlaps the orilyt region of Epstein-Barr virus. The human herpesviruses herpes simplex virus 1 and varicellazoster virus show no significant 1-, 3-, 5-, and 10-cluster scans; no significant 1-scan clusters occurred in all genomes.
The frequency of CTAG is significantly low in many proteobacterial and archaeal genomes. Some possible contributing factors may be as follows. The DCM methylase (short-patch DNA repair system in E. coli) targets the second C of the pentanucleotide CCAGG, which can then mutate by deamination to CTAGG. Generally, the repair system corrects T/G mismatches back to C/G. However, if the repair system lacked perfect specificity and sometimes corrected legitimate CTAG tetranucleotides, this configuration might operate to some extent in limiting CTAG representations. The perfect dyad symmetry ACTAGTT AACTAGT is the consensus binding site for the E. coli trpR-encoded repressor, and this regulatory activity might impose sufficient rarity of CTAG. There is some evidence from the crystal structure of the trp-repressor/operator complex that the two CTAG tetranucleotides “kink” when bound by trpR, which may, under conditions of supercoiling, be structurally deleterious (109). It has been demonstrated experimentally that CTAG promotes crosslinking between complementary DNA strands by UV irradiation at a much greater rate than any other tetranucleotides (110). Because crosslinking generally entails deleterious effects, avoidance of CTAG motifs could be a natural consequence.
CTAG is missing in the left half of the λ-genome in a segment of 24,743 bp, and occurrence concentrate in three clusters in the right half. Eight are located in noncoding regions or at stop codons, four in ORFs of undetermined expression, one in the CI gene near the carboxyl end, and one in gene S (affecting cell lysis). Thus, the distribution of CTAG sites in λ is rare and nonrandom. In E. coli, CTAG occurs relatively more frequently in the rRNA operon than elsewhere. The low frequency of CTAG persists in proteobacterial genomes entailing clustering in the 16S and 23S ribosomal RNA genes. Is it possible that CTAG sites are nucleation or anchor points in the assembly of the ribosomal complex?
Cluster of DAM Sites in the ori-C Region of E. coli. DAM sites are important regulatory signals composed of the tetranucleotide GATC. These sequences serve in part to distinguish the template strand (fully methylated) from the newly synthesized strand (unmethylated) during semiconservative replication and repair. These sites also are associated with genes involved in the SOS response, transposon function, and bacteriophage infection. In the 245-bp sequence that defines the minimal ori-C region of E. coli, there are 8 DAM sites. In a 350-bp stretch flanking the ori-C region, there are an additional 12 DAM sites. Do the 8 DAM methylation sites observed in a stretch of 245 bp that includes the E. coli origin of replication or that are joined with the additional 12 DAM sites located in the flanking 350 bp or both represent a statistically significant cluster? We apply the formula first in the case of r = 7, where n is the number of DAM sites over the E. coli genome. In the E. coli genome, the GATC frequency is 0.0044. There are 20,680 DAM sites throughout the genome. Now, exp {-x7/7!} = 96 bp when x = 1.75. Eight DAM sites in a stretch of 245 bp somewhere in the E. coli genome would occur with probability ≈0.06. Thus, the concentration of DAM sites in the ori-C region of E. coli is not statistically significant. However, the calculation with r = 19 implies that a segment of 1,068 bp in length or less containing 20 DAM sites presents a statistically significant cluster.
Applications of scan-statistics analysis for a fixed-length sliding window pertain to phenomena such as clusters of disease in time, generalized birthday proximities, and rth nearest-neighbor problems. Early work on scan statistics focused mainly on exact formulae (111), exploiting calculations of coincidence probabilities in diffusion stochastic processes. The asymptotic results reported here are based on the powerful Chen-Stein method of Poisson approximations (112, 113).
Frequent Words (Oligonucleotides and Peptides)
A classical approach for deciding whether a given word is frequent is to count the number of its occurrences N(L) in a sequence of length L and compare this count with the expected count, postulating independently or Markov-generated sequences. Let μ be the mean and σ2 the variance of the length between successive occurrences of the target word. For the independence model, the quantity  follows approximately the standard normal distribution for large L. The tails of the normal distribution can be used as thresholds for rare and frequent levels. However, this method is difficult to implement, especially the computation of σ for each word (114).
Some problems concerning long repeats in a random letter sequence are idealized into a ball-in-urn model (urns correspond to all DNA words of a given size, and balls refer to the observed words in a given sequence). Limit theorems for several generalized occupancy problems are germane. A sequence of n indistinguishable balls are allocated independently equally likely into an array of m urns. Two Poisson limit laws refer to the variable Nr, the number of urns containing r balls: with n, m → ∞, Nr has a Poisson limit law with parameter  if
if  ; and if n = m(lnm) + rm(lnlnm) + mx + o(m), then Nr has a Poisson limit law with parameter exp (-x/r!). Limiting distributions for the waiting times until some urn first acquires r balls ensue through their duality relations with the occupancy problems. A compendium of results of this kind can be found in ref. 17.
As possible words (urns) and L (actually L − s + 1) samples then, as L → ∞, As → ∞ and Pr{urn 1 contains ≥ r balls} ≈ [L/As]r (1/r!) for moderate r and As ≫ L. The expected number of such frequent words is approximately (L/As)r-1 (L/r!) = λ, and provided λ is small, the number of frequent words is approximately Poisson-distributed with parameter λ (115, 116). Guided by these formulas, for a given sequence of length L, we determine the word size s to satisfy s - 1 ≤ (logL)/(logA) < s, and then we determine the copy number r to satisfy (r - 1)/r < (logL/logAs) ≤ (r/(r + 1)). Accordingly, few s-words are expected to occur at least r times in the sequence and can be considered “frequent words.”
Rare words are characterized as follows. Set the word size s obeying the inequalities As log As ≤ L ≤ As+1 log As+1 and then determine r satisfying As(log As + rlog log as) < L ≤ As (log As + (r + 1)log log As). Following these prescriptions, s-words occurring at most r times are deemed “rare words.”
For DNA, rare words might be binding sites for transcription control factors restricted to specific locations. Alternatively, rare words may be discriminated against because of structural incompatibilities.
Frequent words often include repetitive, structural, regulatory, and transposable elements [e.g., uptake signal sequences (USSs; see below) in Haemophilus influenzae], Chi sites in association with the RecBCD recombination complex, and REP elements (repeated extragenic palindrome) of unknown function, the latter two in E. coli. In proteins, frequent oligopeptides often reflect characteristic motifs shared in certain protein functional families, e.g., the sequence environment of the catalytic triad of serine proteases.
Frequent Oligonucleotides and Peptides of the H. influenzae Genome. Two major classes of frequent oligonucleotides in the H. influenzae genome stand out: (i) oligos related to the USSs AAGT-GCGGT (USS+737 occurrences) and its inverted complement (USS− 734) of almost equal counts and (ii) multiple tetranucleotide iterations. The USS+ and USS− as established by r-scan statistics are remarkably evenly spaced around the genome and appear predominantly in the same coding frame. The above findings suggest that USSs contribute to global genomic functions.
A major hypothesis concerning H. influenzae (and some other bacterial organisms) is that natural genetic competence (transformation) evolved and is maintained for the task of acquiring templates mediating repair of DNA lesions. One possibility is that the uptake of DNA followed by the production of single-stranded tails could induce higher levels of RecA enzyme activities and concomitantly increase the extent of DNA repair. In fact, single-stranded DNA is known to be an inducing signal of SOS repair and RecA polymerization in binding single-stranded DNA of E. coli. Other possible roles of natural genetic competence have been attributed to benefits for horizontal gene transfer for the repair of damaged chromosomes that are rescued by recombination with exogenous homologous DNA, for conversion of mutant alleles to functional alleles, or simply as a good nutrient source. The uptake mechanisms are largely unknown. Another bacterium with corresponding directed uptake is Neisseria gonorrhoeae. Generally, a small percentage (≈10%) of a population of Bacillus subtilis can become competent for uptake of nonspecific DNA sequences. In B. subtilis and Streptococcus pneumoniae, competence is genetic competence regulated by cell density, cell-cell signaling, and nutritional signaling dependence on growth conditions. Although DNA uptake is widespread in bacterial cells, nonspecific integration into the chromosome seems to be rare.
Many bacteria can develop the state of physiological competence for natural DNA uptake that is consistent with a bacterial gene transfer of free DNA (117). H. influenzae (and N. gonorrhoeae) can only bind and take up double-stranded and single-stranded DNA from the same or closely related species. This finding is different from B. subtilis, where the DNA uptake tends to be nonspecific and most cells are not competent, whereas natural genetic competence in H. influenzae and Azotobacter vinelandii can be attained by almost 100% of cells. As noted previously, the degree of bacterial cell competence seems to be correlated with the presence of highly frequent words.
The palindrome GGCGATCGCC labeled HIP1 (highly iterated palindrome) is highly frequent in Synechocystis (118) and in most cyanobacteria. The r-scan analysis shows a significantly even distribution where the observed minimal spacing between any two successive occurrences is 52 bp. Thus, the even spacing of the HIP1 in Synechocystis is considerably more dramatic than the even spacing of the USSs in H. influenzae. Synechocystis, like H. influenzae, is known to be transformable. Whether the HIP1 sequences serve as recognition sites in this capacity is unknown. The significance of its palindromic character also is intriguing.
Mechanisms allowing changes in the frequency of gene expression include introduction of frameshifts that affect transcription and/or translation. Moxon et al. (119), for a number of pathogenic bacterial populations, highlight nonstandard mutation mechanisms that occur at special loci, and they explicitly discuss the case of the repeat tract, (TCAA)16, present in H. influenzae at the 5′ end of the lic2 gene. The H. influenzae genome contains 11 impressive microsatellites in the form of tandem tetranucleotide repeats each extending at least 15 iterations. Generally, in tandem repeats (in the coding region and/or in gene regulatory regions) polymerase slippage, homologous recombination, or mismatch repair occurring during chromosomal replication can generate a heterogeneous population of cells that can facilitate infection or can counter host defense mechanisms. Other examples of variable gene expression putatively controlled by repeat sequence tracts occur in Bordetella pertussis, Neisseria meningitides, and N. gonorrhoeae.
The example of (AGTC)32 in H. influenzae that offers at least two alternatively encoded genes is particularly interesting.
In frame 1, (AGTC)32 is part of a 194-aa ORF. In frame 2, the gene encodes Mod (629 aa), similar to a type III restriction-modification enzyme of E. coli. Frame 3 is “null,” flanked by multiple termination codons. The sequence exhibits a rare example of two genes encoded in the same orientation in different reading frames overlapping >40 aa. Is it possible that their movement around the genome is channeled through transposon activity? Variation in the number of AGTC iterations is a strategy that can alter the translational frame and/or intensity of DNA supercoiling in regulation of gene expression and provide a repertoire of genetic polymorphism. Mechanisms capable of generating such nonstandard random variation putatively provide a solution to the problem of enabling rapid and reversible response to environmental changes that are frequently encountered in the bacterial habitat.
Frequent peptides are related to the Walker A box motif GXXGXGK(S/T)TL. Frequent peptides related to the motif LLDEPTN are associated with the ATP hydrolysis B site generally located 40-70 residues downstream of the A-site (90) in the form φφφφD, representing four successive unspecified aliphatic residues culminating with the essential aspartate residue. As identified in x-ray crystal structures, the Walker A and B boxes mostly contribute to the ATP-binding pocket of ATP-dependent transport proteins. A third motif approximately of the form LSGGQ(Q/R)Q ≈20 aa upstream from the B site was identified in ref. 90. There is considerable agreement of ATP and GTP DNA-binding motifs in prokaryotic and eukaryotic species.
The frequent motifs HVDHG, VDHGK, and DHGKT, which combine into HVDHGKT, are notable because they occur in the elongation factor Tu, in tufB-B, in selB (translation factor), in infB (initiation factor 2), and in other translation factors.
Most of the frequent words in higher eukaryotes have been characteristic of zinc fingers, chymotrypsin proteases, serine/threonine and tyrosine kinases, Ig heavy and light chains, and homoebox proteins among others. The active sites in these classes of proteins generally have at least one frequent word associated with them. These include explicitly CGKAF, CEECG in zing fingers, LTAAH, GDS-GGP in chymotrypsin protease proteins, and ADFGL, FGQGT in kinases are highly conserved. Peptide words FQNRR and HFNRY are frequent peptides in homeobox proteins.
Rare Words in Human Herpesvirus Genomes. Consider the genome of the major human herpesviruses herpes simplex virus 1, varicella-zoster virus, cytomegalovirus, and Epstein-Barr virus. The DNA totals 678,780 bp. The criterion for rare words is size s = 7 and at most r = 12 copies. For these characteristics, 728 rare words qualify from a totality of 47 ≈ 16,000. All 7-words occurred at least once, and the bottom 11 of least occurrences are TCTAGTA (1 occurrence), ACTAGGC (3 occurrences), CTAACTC (3 occurrences), TCTAGTC (3 occurrences), AAGTTAG (4 occurrences), ACTTAGG (4 occurrences), ATCACTC (4 occurrences), CTTAGCT (4 occurrences), GACCTAA (4 occurrences), GGACTAG (4 occurrences), and TACTAAG (4 occurrences). It is notable that most of these words contain stop codons and the tetranucleotide CTAG.
Concluding Remarks
In my view, the role of statistics in sequence analysis is primarily exploratory and interactive with the data, generating new questions and lines of experimental investigation. Rather than fitting models to biomolecular sequences with the purpose of statistical hypothesis testing, the analysis of the extreme tails of distributions derived from random sequences can provide benchmarks for the selection of sequences, part of sequences, or sequence features to concentrate on for further study. Essential in this approach is the use of a mixture of different statistics and interaction with the data and the experimenter. Here robustness includes sensitivity of the statistics to outliers due to sampling biases, concordance among several different measures that examine the data in different ways, and consistency among independently sampled data sets. There are also many challenging problems related to classification of protein and DNA sequences with reference to function, structure, subcellular localization, expression, phylogenetic relations, and other biological and medical criteria. Statistical stratification of the databases can also aid these tasks as more sequences and genomes become available.
This paper serves as an introduction to the Arthur M. Sackler Colloquium of the National Academy of Sciences, “Frontiers in Bioinformatics: Unsolved Problems and Challenges,” held October 15-17, 2004, at the Arnold and Mabel Beckman Center of the National Academies of Sciences and Engineering in Irvine, CA. Papers from this Colloquium will be available as a collection on the PNAS web site. The complete program is available on the NAS web site at www.nasonline.org/bioinformatics.
Abbreviations: AS, alternative splicing; i.i.d., independent identically distributed; USS, uptake signal sequence.
References
- 1.Pace, N. R. (1997) Science 276, 734-740. [DOI] [PubMed] [Google Scholar]
- 2.Venter, J. C., Remington, K., Heidelberg, J. F., Halpern, A. L., Rusch, D., Eisen, J. A., Wu, D., Paulsen, I., Nelson, K. E., Nelson, W., et al. (2004) Science 304, 66-74. [DOI] [PubMed] [Google Scholar]
- 3.Zeidner, G., Preston, C. M., Delong, E. F., Massana, R., Post, A. F., Scanlan, D. J. & Beja, O. (2003) Environ. Microbiol. 5, 212-216. [DOI] [PubMed] [Google Scholar]
- 4.Beja, O., Aravind, L., Koonin, E. V., Suzuki, M. T., Hadd, A., Nguyen, L. P., Jovanovich, S. B., Gates, C. M., Feldman, R. A., Spudich, J. L., et al. (2000) Science 289, 1902-1906. [DOI] [PubMed] [Google Scholar]
- 5.Lepp, P. W., Brinig, M. M., Ouverney, C. C., Palm, K., Armitage, G. C. & Relman, D. A. (2004) Proc. Natl. Acad. Sci. USA 101, 6176-6181. [DOI] [PMC free article] [PubMed] [Google Scholar]
- 6.Karlin, S. & Altschul, S. F. (1990) Proc. Natl. Acad. Sci. USA 87, 2264-2268. [DOI] [PMC free article] [PubMed] [Google Scholar]
- 7.Altschul, S. F., Gish, W., Miller, W., Myers, E. W. & Lipman, D. J. (1990) J. Mol. Biol. 215, 403-410. [DOI] [PubMed] [Google Scholar]
- 8.Altschul, S. F., Madden, T. L., Schaffer, A. A., Zhang, Z., Miller, W. & Lipman, D. J. (1997) Nucleic Acids Res. 25, 3389-3402. [DOI] [PMC free article] [PubMed] [Google Scholar]
- 9.Ewens, W. S. & Grant, G. R. (2001) Statistical Methods in Bioinformatics: An Introduction (Springer, New York).
- 10.Burge, C. & Karlin S. (1997) J. Mol. Biol. 268, 78-94. [DOI] [PubMed] [Google Scholar]
- 11.Kulp, D., Haussler, D., Reese, M. G. & Eckman, F. H. (1996) Proc. Int. Conf. Intell. Syst. Mol. Biol. 4, 134-142. [PubMed] [Google Scholar]
- 12.Brendel, V., Bucher, P., Nourbakhsh, I. R., Blaisdell, B. E. & Karlin, S. (1992) Proc. Natl. Acad. Sci. USA 89, 2002-2006. [DOI] [PMC free article] [PubMed] [Google Scholar]
- 13.Higgins, D., Thompson, J., Gibson, T., Thompson, J. D., Higgins, D. G. & Gibson, T. J. (1994) Nucleic Acids Res. 22, 4673-4680. [DOI] [PMC free article] [PubMed] [Google Scholar]
- 14.Brocchieri, L. & Karlin, S. (1998) J. Mol. Biol. 276, 249-264. [DOI] [PubMed] [Google Scholar]
- 15.Dembo, A. & Karlin, S. (1992) Ann. Appl. Prob. 2, 329-357. [Google Scholar]
- 16.Karlin, S., Mrazek, J. & Campbell, A. M. (1996) Nucleic Acids Res. 24, 4263-4272. [DOI] [PMC free article] [PubMed] [Google Scholar]
- 17.Johnson, N. L. & Kotz, S. (1997) Urn Models and Their Applications (Wiley, New York).
- 18.Karlin, S. & Cardon, L. (1994) Annu. Rev. Microbiol. 48, 619-654. [DOI] [PubMed] [Google Scholar]
- 19.Park, Y. & Spouge, J. L. (2002) Bioinformatics 18, 1236-1242. [DOI] [PubMed] [Google Scholar]
- 20.Karlin, S. & Brendel, V. (1992) Science 257, 39-49. [DOI] [PubMed] [Google Scholar]
- 21.Karlin, S. & Zhu, Z. Y. (1996) Proc. Natl. Acad. Sci. USA 93, 8344-8349. [DOI] [PMC free article] [PubMed] [Google Scholar]
- 22.Zhu, Z. Y. & Karlin, S. (1996) Proc. Natl. Acad. Sci. USA 93, 8350-8355. [DOI] [PMC free article] [PubMed] [Google Scholar]
- 23.Karlin, S. (1994) Philos. Trans. R. Soc. London B 344, 391-402. [DOI] [PubMed] [Google Scholar]
- 24.Dembo, A., Karlin, S. & Zeitouni, O. (1994) Ann. Prob. 22, 1993-2021. [Google Scholar]
- 25.Dembo, A. & Zeitouni, O. (1998) Large Deviations Techniques and Applications (Springer, New York), 2nd Ed.
- 26.Iglehart, D. (1972) Ann. Math. Stat. 43, 627-635. [Google Scholar]
- 27.Assmussen, S. (1982) Adv. Appl. Prob. 14, 143-170. [Google Scholar]
- 28.Futcher, B., Latter, G. I., Monardo, P., Mclaughlin, C. S. & Garrels, J. I. (1999) Mol. Cell. Biol. 19, 7357-7368. [DOI] [PMC free article] [PubMed] [Google Scholar]
- 29.Yates, J. R., III. (2000) Trends Genet. 16, 5-8. [DOI] [PubMed] [Google Scholar]
- 30.Gygi, S. P., Rochon, Y., Franza, B. R. & Aebersold, R. (1999) Mol. Cell. Biol. 19, 1720-1730. [DOI] [PMC free article] [PubMed] [Google Scholar]
- 31.Van Bogelen, R. A., Schiller, E. E., Thomas, J. D. & Neidhardt, F. C. (1999) Electrophoresis 20, 2149-2159. [DOI] [PubMed] [Google Scholar]
- 32.Sharp, P. M. & Matassi, G. (1994) Curr. Opin. Genet. Dev. 4, 851-860. [DOI] [PubMed] [Google Scholar]
- 33.Karlin, S. & Mrazek, J. (2000) J. Bacteriol. 182, 5238-5250. [DOI] [PMC free article] [PubMed] [Google Scholar]
- 34.Karlin, S. Mrazek, J., Campbell, A. & Kaiser, D. (2001) J. Bacteriol. 183, 5025-5040. [DOI] [PMC free article] [PubMed] [Google Scholar]
- 35.Karlin, S., Mrazek, J., Ma, J., Brocchieri, L. (2005) Proc. Natl. Acad. Sci. USA 102, 7303-7308. [DOI] [PMC free article] [PubMed] [Google Scholar]
- 36.Karlin, S., Brocchieri, L., Campbell, A. M., Cyert, M., Mrazek, J. (2005) Proc. Natl. Acad. Sci. USA 102, 7309-7314. [DOI] [PMC free article] [PubMed] [Google Scholar]
- 37.Brocchieri, L. (2001) Theor. Popul. Biol. 59, 27-40. [DOI] [PubMed] [Google Scholar]
- 38.Yang, S., Doolittle, R. F. & Bourne, P. E. (2005) Proc. Natl. Acad. Sci. USA 102, 373-378. [DOI] [PMC free article] [PubMed] [Google Scholar]
- 39.Felsenstein, J. (2003) Inferring Phylogenies (Sinauer, Sunderland, MA).
- 40.Modrek, B. & Lee, C. (2002) Nat. Genet. 30, 13-19. [DOI] [PubMed] [Google Scholar]
- 41.Modrek, B. & Lee, C. J. (2003) Nat. Genet. 34, 177-180. [DOI] [PubMed] [Google Scholar]
- 42.Sorek, R. & Ast, G. (2003) Genome Res. 13, 1631-1637. [DOI] [PMC free article] [PubMed] [Google Scholar]
- 43.Boue, S., Letunic, I. & Bork, P. (2003) BioEssays 25, 1031-1034. [DOI] [PubMed] [Google Scholar]
- 44.The International SNP Map Working Group (2001) Nature 409, 928-933.11237013 [Google Scholar]
- 45.The International HapMap Consortium (2003) Nature 426, 789-796. [DOI] [PubMed] [Google Scholar]
- 46.Murzin, A. G., Brenner, S. E., Hubbard, T. & Chothia, C. (1995) J. Mol. Biol. 247, 536-540. [DOI] [PubMed] [Google Scholar]
- 47.Miklos, G. L. & Maleszka, R. (2004) Nat. Biotechnol. 22, 615-621. [DOI] [PubMed] [Google Scholar]
- 48.Yeung, K. Y., Medvedovic, M. & Bumgarner, R. E. (2004) Genome Biol. 5, R48. [DOI] [PMC free article] [PubMed] [Google Scholar]
- 49.Zhang, Z., Harrison, P. M., Liu, Y. P. & Gerstein, M. (2003) Genome Res. 13, 2541-2558. [DOI] [PMC free article] [PubMed] [Google Scholar]
- 50.Zhang, Z., Carriero, N. & Gerstein, M. (2004) Trends Genet. 20, 62-67. [DOI] [PubMed] [Google Scholar]
- 51.Chen C., Gentles, A. J., Jurka, J. & Karlin, S. (2002) Proc. Natl. Acad. Sci. USA 99, 2930-2935. [DOI] [PMC free article] [PubMed] [Google Scholar]
- 52.Bejerano, G., Pheasant, M., Makunin, I., Stephen, S., Kent, W. J., Mattick, J. S. & Haussler, D. (2004) Science 304, 1321-1325. [DOI] [PubMed] [Google Scholar]
- 53.Bourque, G., Pevzner, P. A. & Tesler, G. (2004) Genome Res. 14, 507-516. [DOI] [PMC free article] [PubMed] [Google Scholar]
- 54.Fairbrother, W. G., Holste, D., Burge, C. B. & Sharp, P. A. (2004) PLoS Biol. 2, E268. [DOI] [PMC free article] [PubMed] [Google Scholar]
- 55.Yeo, G., Hoon, S., Venkatesh, B. & Burge, C. B. (2004) Proc. Natl. Acad. Sci. USA 101, 15700-15705. [DOI] [PMC free article] [PubMed] [Google Scholar]
- 56.Xing, Y. & Lee, C. (2005) Proc. Natl. Acad. Sci. USA 102, 13526-13531. [DOI] [PMC free article] [PubMed] [Google Scholar]
- 57.Eddy, S. R. (2001) Nat. Rev. Genet. 2, 919-929. [DOI] [PubMed] [Google Scholar]
- 58.Yeger-Lotem, E., Sattath, S., Kashtan, N., Itzkovitz, S., Milo, R., Pinter, R. Y., Alon, U. & Margalit, H. (2004) Proc. Natl. Acad. Sci. USA 101, 5934-5939. [DOI] [PMC free article] [PubMed] [Google Scholar]
- 59.Wodak, S. J. & Mendez, R. (2004) Curr. Opin. Struct. Biol. 14, 242-249. [DOI] [PubMed] [Google Scholar]
- 60.Strong, M., Graeber, T. G., Beeby, M., Pellegrini, M., Thompson, M. J., Yeates, T. O. & Eisenberg, D. (2003) Nucleic Acids Res. 31, 7099-7109. [DOI] [PMC free article] [PubMed] [Google Scholar]
- 61.Salwinski, L. & Eisenberg, D. (2004) Nat. Biotechnol. 22, 1017-1019. [DOI] [PubMed] [Google Scholar]
- 62.Karlin, S. (2001) Trends Microbiol. 9, 335-343. [DOI] [PubMed] [Google Scholar]
- 63.Ramakrishnan, L., Federspiel, N. A. & Falkow, S. (2000) Science 288, 1436-1439. [DOI] [PubMed] [Google Scholar]
- 64.Kolodny, R., Koehl, P. & Levitt, M. (2005) J. Mol. Biol. 346, 1173-1188. [DOI] [PMC free article] [PubMed] [Google Scholar]
- 65.Bourne, P. E., Westbrook, J. & Berman, H. M. (2004) Brief Bioinform. 5, 23-30. [DOI] [PubMed] [Google Scholar]
- 66.Klein, T. E. & Altman, R. B. (2004) Pharmacogenomics J. 4, 1. [DOI] [PubMed] [Google Scholar]
- 67.Hwang, D. G. & Green, P. (2004) Proc. Natl. Acad. Sci. USA 101, 13994-14001. [DOI] [PMC free article] [PubMed] [Google Scholar]
- 68.Meunier, J. & Duret, L. (2004) Mol. Biol. Evol. 21, 984-990. [DOI] [PubMed] [Google Scholar]
- 69.Gentles, A. J. & Karlin, S. (2004) Recent Developments in Nucleic Acids Research (Transworld Research Network, Kerala, India), Vol. 1, Part I, pp. 35-51. [Google Scholar]
- 70.Takai, D. & Jones, P. A. (2002) Proc. Natl. Acad. Sci. USA 99, 3740-3745. [DOI] [PMC free article] [PubMed] [Google Scholar]
- 71.Nguyen, C., Liang, G. M., Nguyen, T. T., Tsao-Wei, D., Groshen, S., Lubbert, M., Zhou, J. H., Benedict, W. F. & Jones, P. A. (2001) J. Natl. Cancer Inst. 93, 1465-1472. [DOI] [PubMed] [Google Scholar]
- 72.Avner, P. & Heard, E. (2001) Nat. Rev. Genet. 2, 59-67. [DOI] [PubMed] [Google Scholar]
- 73.Bird, A. (2002) Genes Dev. 16, 6-21. [DOI] [PubMed] [Google Scholar]
- 74.Doerfler, W. (1991) Biol. Chem. 372, 557-564. [PubMed] [Google Scholar]
- 75.Antequera, F. & Bird, A. (1999) Curr. Biol. 9, 661-667. [DOI] [PubMed] [Google Scholar]
- 76.Kress, C., Thomassin, H. & Grange, T. (2001) FEBS Lett. 494, 135-140. [DOI] [PubMed] [Google Scholar]
- 77.Josse, J., Kaiser, A. D. & Kornberg, A. (1961) J. Biol. Chem. 236, 864-875. [PubMed] [Google Scholar]
- 78.Russel, G. J., Walker, P. M. B., Elton, R. A. & Subak-Sharpe, J. H. (1976) J. Mol. Biol. 108, 1-28. [DOI] [PubMed] [Google Scholar]
- 79.Russel, G. J. & Subak-Sharpe, J. H. (1977) Nature 266, 533-535. [DOI] [PubMed] [Google Scholar]
- 80.Groot, G. S. & Kroon, A. M. (1979) Biochim. Biophys. Acta 564, 355-357. [DOI] [PubMed] [Google Scholar]
- 81.Breslauer, K. J., Frank, R., Blocker, H. & Marky, L. A. (1986) Proc. Natl. Acad. Sci. USA 83, 3746-3750. [DOI] [PMC free article] [PubMed] [Google Scholar]
- 82.Hunter, C. A. (1993) J. Mol. Biol. 230, 1025-1054. [DOI] [PubMed] [Google Scholar]
- 83.Kunkel, T. A. & Bebeneck, K. (2000) Annu. Rev. Biochem. 69, 497-529. [DOI] [PubMed] [Google Scholar]
- 84.Sinden, R. R. (1994) DNA Structure and Function (Academic, San Diego).
- 85.Karlin, S. & Burge, C. (1995) Trends Genet. 11, 283-290. [DOI] [PubMed] [Google Scholar]
- 86.Gentles, A. J. & Karlin, S. (2001) Genome Res. 11, 540-546. [DOI] [PMC free article] [PubMed] [Google Scholar]
- 87.Karlin, S. (1998) Curr. Opin. Microbiol. 1, 598-610. [DOI] [PubMed] [Google Scholar]
- 88.Krieg, A. M., Wu, T. Weeratna, R., Efler, S. M., Love-Homan, L., Yang, L., Yi, A. K., Short, D. & Davis, H. L. (1998) Proc. Natl. Acad. Sci. USA 95, 12631-12636. [DOI] [PMC free article] [PubMed] [Google Scholar]
- 89.Krawiec, S. & Riley, M. (1990) Microb. Rev. 54, 502-539. [DOI] [PMC free article] [PubMed] [Google Scholar]
- 90.Blaisdell, B. E., Rudd, K. E., Matin, A. & Karlin, S. (1993) J. Mol. Biol. 229, 833-848. [DOI] [PubMed] [Google Scholar]
- 91.Leung, M.-Y., Blaisdell, B. E., Burge, E. & Karlin, S. (1991) J. Mol. Biol. 221, 1367-1378. [DOI] [PMC free article] [PubMed] [Google Scholar]
- 92.Woese, C. R., Kandler, O. & Wheelis, M. L. (1990) Proc. Natl. Acad. Sci. USA 87, 4576-4579. [DOI] [PMC free article] [PubMed] [Google Scholar]
- 93.Campbell, A. (2000) Theor. Popul. Biol. 57, 71-77. [DOI] [PubMed] [Google Scholar]
- 94.Ochman, H., Lawrence, J. G. & Groisman, E. A. (2000) Nature 405, 299-304. [DOI] [PubMed] [Google Scholar]
- 95.Felsenstein, L. (1989) phylip: Phylogeny Package, Version 3.2, Cladistics 5, 164-166. [Google Scholar]
- 96.Swofford, D. L. (1993) paup: Phylogenetic Analysis Using Parsimony (Illinois Natural History Survey, Champaign, IL), Version 3.1.
- 97.Kumar, S., Tamura K. & Nei, M. (2004) mega3: Integrated Software for Molecular Evolutionary Genetic Analysis and Sequence Alignment, Brief. Bioinform. 5, 150-163. [DOI] [PubMed] [Google Scholar]
- 98.Gupta, R. S. (1998) Microbiol. Rev. 62, 1435-1491. [DOI] [PMC free article] [PubMed] [Google Scholar]
- 99.Karlin, S., Brocchieri, L., Trent, J., Blaisdell, B. E. & Mrazek, J. (2002) Theor. Popul. Biol. 61, 367-390. [DOI] [PubMed] [Google Scholar]
- 100.Bateman, A., Birney, E., Cerruti, L., Durbin, R., Etwiller, L., Eddy, S. R., Griffiths-Jones, S., Howe, K. L., Marshall, M. & Sonnhammer, E. L. (2002) Nucleic Acids Res. 30, 276-280. [DOI] [PMC free article] [PubMed] [Google Scholar]
- 101.Karlin, S. & Dembo, A. (1992) Adv. Appl. Prob. 24, 113-140. [Google Scholar]
- 102.Von Heijne, G. (1987) Sequence Analysis in Molecular Biology: Treasure Trove or Trivial Pursuit (Academic, New York).
- 103.Feller, W. (1968) An Introduction to Probability Theory and Its Applications (Wiley, New York), Vol. II.
- 104.Karlin, S. & Altschul, S. F. (1993) Proc. Natl. Acad. Sci. USA 90, 5873-5877. [DOI] [PMC free article] [PubMed] [Google Scholar]
- 105.Henikoff, S. & Henikoff, J. G. (1992) Protein Sci. 6, 698-705. [DOI] [PMC free article] [PubMed] [Google Scholar]
- 106.Dayhoff, M. O. (1978) Atlas of Protein Sequence and Structure (National Biomedical Research Foundation, Washington, DC), Vol. 5.
- 107.Karlin S. (1995) Curr. Opin. Struct. Biol. 5, 360-371. [DOI] [PubMed] [Google Scholar]
- 108.Masse, M. J. O., Karlin, S., Schachtel, G & Mocarski, E. S. (1992) Proc. Natl. Acad. Sci. USA 89, 5246-5250. [DOI] [PMC free article] [PubMed] [Google Scholar]
- 109.Gunsalus, R. P. J. & Yanovsky, C. (1980) Proc. Natl. Acad. Sci. USA 77, 7117-7121. [DOI] [PMC free article] [PubMed] [Google Scholar]
- 110.Burge, C., Campbell, A. M. & Karlin, S. (1992) Proc. Natl. Acad. Sci. USA 89, 1358-1362. [DOI] [PMC free article] [PubMed] [Google Scholar]
- 111.Naus, J. I. (1979) Int. Stat. Rev. 47, 47-78. [Google Scholar]
- 112.Arratia, R., Goldstein, L. & Gordon, L. (1989) Ann. Prob. 17, 9-25. [Google Scholar]
- 113.Barbour, A. D., Holst, L. & Janson, S. (1992) Poisson Approximations (Oxford Univ. Press, Oxford).
- 114.Kleffe, J. & Borodovsky, M. (1992) Comput. Appl. Biosci. 8, 433-441. [DOI] [PubMed] [Google Scholar]
- 115.Karlin, S. & Leung, M.-Y. (1991) Ann. Appl. Prob. 4, 513-538. [Google Scholar]
- 116.Reinert, G., Schbath, S. & Waterman, M. S. (2003) J. Comp. Biol. 7, 1-46. [DOI] [PubMed] [Google Scholar]
- 117.Lorenz, M. G. & Wackernagel, W. (1994) Microbiol. Rev. 58, 563-602. [DOI] [PMC free article] [PubMed] [Google Scholar]
- 118.Robinson, N. J., Robinson, P. J., Gupta, A., Bleasby, A. J., Whitton, B. A. & Morby, A. P. (1995) Nucleic Acids Res. 23, 729-735. [DOI] [PMC free article] [PubMed] [Google Scholar]
- 119.Moxon, E. R., Rainey, P. B., Nowak, M. A. & Lenski, R. E. (1994) Curr. Biol. 4, 24-33. [DOI] [PubMed] [Google Scholar]