

Abstract
CyaA is crucial for colonization by Bordetella pertussis, the etiologic agent of whooping cough. Here we report crystal structures of the adenylyl cyclase domain (ACD) of CyaA with the C-terminal domain of calmodulin. Four discrete regions of CyaA bind calcium-loaded calmodulin with a large buried contact surface. Of those, a tryptophan residue (W242) at an α-helix of CyaA makes extensive contacts with the calcium-induced, hydrophobic pocket of calmodulin. Mutagenic analyses show that all four regions of CyaA contribute to calmodulin binding and the calmodulin-induced conformational change of CyaA is crucial for catalytic activation. A crystal structure of CyaA–calmodulin with adefovir diphosphate, the metabolite of an approved antiviral drug, reveals the location of catalytic site of CyaA and how adefovir diphosphate tightly binds CyaA. The ACD of CyaA shares a similar structure and mechanism of activation with anthrax edema factor (EF). However, the interactions of CyaA with calmodulin completely diverge from those of EF. This provides molecular details of how two structurally homologous bacterial toxins evolved divergently to bind calmodulin, an evolutionarily conserved calcium sensor.
Keywords: adenylyl cyclase toxin, calmodulin, catalytic activation, CyaA, pertussis
Introduction
Calcium ion is a vital and versatile intracellular second messenger and calmodulin (CaM) is a key calcium sensor (Berridge et al, 2003). Two unique properties allow CaM to dynamically interact with an array of structurally diverse targets (Crivici and Ikura, 1995; Hoeflich and Ikura, 2002; Bhattacharya et al, 2004). First, CaM has N- and C-terminal globular domains (N- and C-CaM) that are connected by a flexible α-helix. This flexible linker allows N- and C-CaM to independently associate with their targets. Second, each globular domain of CaM has two calcium-binding motifs. Calcium binding to CaM induces conformational changes from a mainly hydrophilic closed state to an open conformation, exposing a large, hydrophobic binding pocket. Structures of CaM in complex with its effectors have begun to reveal the rich repertoire of dynamic interactions that are possible.
Bordetella pertussis is the pathogenic bacterium that causes whooping cough, a severe childhood disease worldwide (Mattoo et al, 2001). This pathogen secretes several virulence factors and, among them, CyaA is a 188-kDa CaM-activated adenylyl cyclase toxin. CyaA serves as an anti-inflammatory and antiphagocytic factor facilitating respiratory tract colonization by B. pertussis (Mattoo et al, 2001; Carbonetti et al, 2005). Upon binding to its cellular surface receptor, αMβ2 integrin, CyaA becomes an integral membrane protein and inserts its N-terminal adenylyl cyclase domain (ACD) into the cytosol (Guermonprez et al, 2001). After binding to CaM, CyaA–ACD raises the intracellular cyclic AMP (cAMP) of host cells to a pathologic level (Rogel et al, 1991; Ladant and Ullmann, 1999).
CyaA belongs to a family of adenylyl cyclase toxins secreted by pathogenic bacteria, including those that cause anthrax, plague, and certain nosocomial infections (Shen et al, 2005). The adenylyl cyclase core domain of CyaA shares 25% sequence identity with edema factor (EF), an adenylyl cyclase toxin crucial for anthrax pathogenesis (Shen et al, 2005). While the catalytic activities of CyaA and EF can be activated greater than 10 000-fold by CaM, these two toxins differ significantly in their interaction with CaM (Shen et al, 2002). CyaA has 0.2 nM affinity to CaM, which is about 100-fold higher affinity than EF. CyaA can be fully activated by the N- or C-CaM, while EF cannot. The ACD of EF has a catalytic core and helical domains, and both domains are required for EF activation by CaM (Drum et al, 2002). However, CyaA is fully activated by CaM, without the domain corresponding to the helical domain of EF.
To address the molecular basis for the CaM binding and catalytic activation of CyaA, we report the C-CaM-bound CyaA–ACD structures and mutagenic analyses in this paper. Our studies reveal that CyaA and EF have similar structures and the same mechanism of activation. Interestingly, our structure shows that the interaction of CyaA–ACD with CaM differs markedly from that of EF with CaM. This provides the structural basis for striking differences in the activation of CyaA and EF by CaM.
Results
Structure of C-CaM-bound CyaA–ACD
Active complex of the minimal, functional domains of CyaA and CaM were used in the crystallization. To do this, we first performed an extensive truncation analysis to identify amino acid M1 to S373 of CyaA as a minimal folding domain that maintained CaM-activated adenylyl cyclase activity (Supplementary Figure 1). Both N- and C-CaM can fully activate the enzymatic activity of CyaA–ACD although they have a reduced affinity to CyaA relative to intact CaM (Shen et al, 2002). To analyze whether N- and C-CaM activate the activity of CyaA–ACD in a manner similar to intact CaM, we made a CyaA–ACD mutant carrying a tryptophan 242 to glycine mutation, CyaA–ACD–W242G. This mutant has ∼1000-fold reduced sensitivity to CaM (Glaser et al, 1989). We found that CyaA–ACD–W242G had reduced sensitivity to CaM, N-CaM, and C-CaM (Supplementary Figure 2). This suggests that CyaA can either interact with N- or C-CaM to create the heterogeneous complexes of CyaA–ACD and CaM.
While N-CaM can fully activate the activity of CyaA–ACD, our biochemical and mutagenic analyses reveal that this activation is not physiologically relevant (Shen et al, 2002). The activation of CyaA–ACD by intact CaM does not require the calcium loading and conformational switch of the N-terminal domain of CaM, while that by N-CaM is calcium-dependent. To avoid the heterogeneity caused by the improper binding of calcium-loaded N-CaM to CyaA–ACD, we crystallized the C-CaM-bound CyaA–ACD. The structures of C-CaM-bound CyaA–ACD with and without exogenously added CaCl2 were determined at resolutions of 2.5 and 2.1 Å, respectively (Table 1, Supplementary Table 1 and Supplementary Figure 3). Adefovir diphosphate, the active metabolite of an approved antiviral drug, adefovir dipivoxil, mimics ATP and competitively inhibits the catalysis of CyaA with high affinity (25 nM Ki) (Shen et al, 2004). To obtain further insight into the nucleotide binding and catalysis of CyaA, the structures of C-CaM-bound CyaA–ACD in complex with pyrophosphate (PPi) (a reaction product) and adefovir diphosphate were also determined at resolutions of 2.2 and 2.1 Å, respectively (Table 1).
Table 1.
Crystallographic statistics
| CyaA–ACD/C-CaM | CyaA–ACD/C-CaM/Ca2+ | CyaA–ACD/C-CaM/PPi | CyaA–ACD/C-CaM/PMEAPP | |
|---|---|---|---|---|
| Data collection | ||||
| Beamline | APS 14-IDB | APS 19ID | APS 19BM | APS 19BM |
| Wavelength (Å) | 1.04189 | 0.97951 | 0.97934 | 0.97934 |
| Space group | P41212 | P41212 | P41212 | P41212 |
| Cell dimension (Å) | ||||
| a | 79.4 | 79.4 | 79.5 | 79.6 |
| b | 79.4 | 79.4 | 79.5 | 79.6 |
| c | 139.2 | 139.2 | 139.3 | 139.2 |
| Resolution (Å) | 30–2.1 | 30–2.5 | 50–2.2 | 30–2.1 |
| Rsym (%)a | 6.9 (36.2)b | 10.5 (42.6)b | 9.0 (33.9)b | 10.8 (40.9)b |
| I/sigma | 33.4 (3.6)b | 35.0 (4.6)b | 37.5 (7.5)b | 26.0 (4.5)b |
| Redundancyc | 11.2 (6.7)b | 9.4 (5.5)b | 12.8 (7.4)b | 12.6 (6.5)b |
| Completeness (%) | 98.7 (87.2)b | 99.4 (99.0)b | 100.0 (99.0)b | 99.0 (99.0)b |
| Unique reflections | 25 680 | 27 215 | 25 680 | 27 215 |
| Refinement | ||||
| Rworkd | 0.221 | 0.226 | 0.247 | 0.252 |
| Rfreee | 0.271 | 0.293 | 0.293 | 0.291 |
| No. of atoms | ||||
| Protein | 3237 | 3237 | 3237 | 3237 |
| Water | 160 | 71 | 118 | 158 |
| B-factors | ||||
| Protein | 27.3 | 31.8 | 32.4 | 30.6 |
| Water | 28.4 | 32.2 | 31.2 | 34.6 |
| R.m.s. deviations | ||||
| Bond lengths (Å) | 0.020 | 0.011 | 0.012 | 0.019 |
| Bond angles (deg) | 1.13 | 1.25 | 1.50 | 1.18 |
| Ramachandran plot (%) | ||||
| Favorable region | 89.4 | 84.8 | 82.8 | 85.8 |
| Allowed region | 10.6 | 15.2 | 17.2 | 14.2 |
| Generously allowed region | 0 | 0 | 0 | 0 |
| Disallowed region | 0 | 0 | 0 | 0 |
| aRsym=∑j∣〈I〉−Ij∣/∑〈I〉 where Ij is the intensity of the jth reflection and 〈I〉 is the average intensity. | ||||
| bThe outer resolution shell. | ||||
| cNobs/Nunique. | ||||
| dRwork=∑hkl∣Fobs−Fcalc∣/∑hklFobs. | ||||
| eRfree, calculated the same as for Rwork, but on the 5% data excluded from the refinement calculation. | ||||
The models of C-CaM-bound CyaA–ACD with and without exogenously added calcium ions, PPi, or adefovir diphosphate are almost identical (Figure 1). They include A7-A225 and L233-A364 of CyaA and T79-A147 of CaM. No electron density can be found between A225 and L233 of CyaA–ACD, which is the trypsin-sensitive site that divides CyaA–ACD into the N-terminal T25 (25 kDa tryptic fragment) and the C-terminal T18 (Ladant, 1988). Consistent with the fluorescence anisotropy decay data, the C-CaM-bound CyaA–ACD has an elongated shape (Figure 1) (Gallay et al, 2004). C-CaM adopts the calcium-loaded, open conformation. Calcium ions are present at both calcium-binding sites even though no calcium ion was added exogenously. While both T18 and T25 of CyaA–ACD bind C-CaM, T18 makes substantially more contact (Figure 1). This is consistent with the finding that T18 is the primary CaM-binding domain (Ladant, 1988; Bouhss et al, 1993). The catalytic site of CyaA–ACD lies between T25 and T18, as depicted by the binding of adefovir diphosphate; thus, both domains are required for catalysis (Figure 1).
Figure 1.
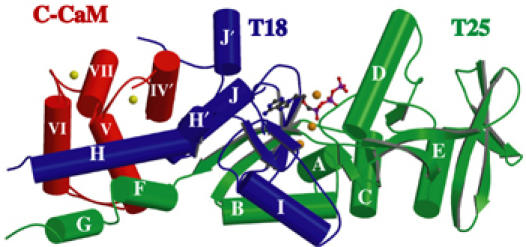
Secondary structure of CaM-bound CyaA–ACD in the presence of adefovir diphosphate. T25 and T18 domains of CyaA–ACD are colored green and purple, respectively. C-CaM is colored red. Calcium ions are colored yellow and magnesium ions orange. The carbon, oxygen, nitrogen, and phosphorus atoms of adevofir diphosphate are colored gray, red, blue, and purple, respectively.
Interaction between CyaA–ACD and C-CaM
The highly positively charged surfaces of CyaA–ACD bind C-CaM, an acid protein with a pI value of 4.1. Four discrete regions and 49 residues of CyaA–ACD are involved to form a network of salt bridges, hydrogen bonds, and hydrophobic contacts embracing C-CaM (Figure 2A). Conversely, 41 out of 70 residues of C-CaM make substantial contacts with CyaA–ACD (Figure 2A). Their interaction buries a 3395 Å2 solvent-accessible surface between the two proteins. The contact regions of CyaA–ACD include three discrete segments, helix F (H197–R206), helix H (R235–R246), and helix H′ with the preceding loop (R250–R259), as well as the C-terminal end (E346–R360) (Figure 2A). This is consistent with the finding that the segment from P196 to M267 contributes about 90% binding energy to CaM (Bouhss et al, 1993).
Figure 2.
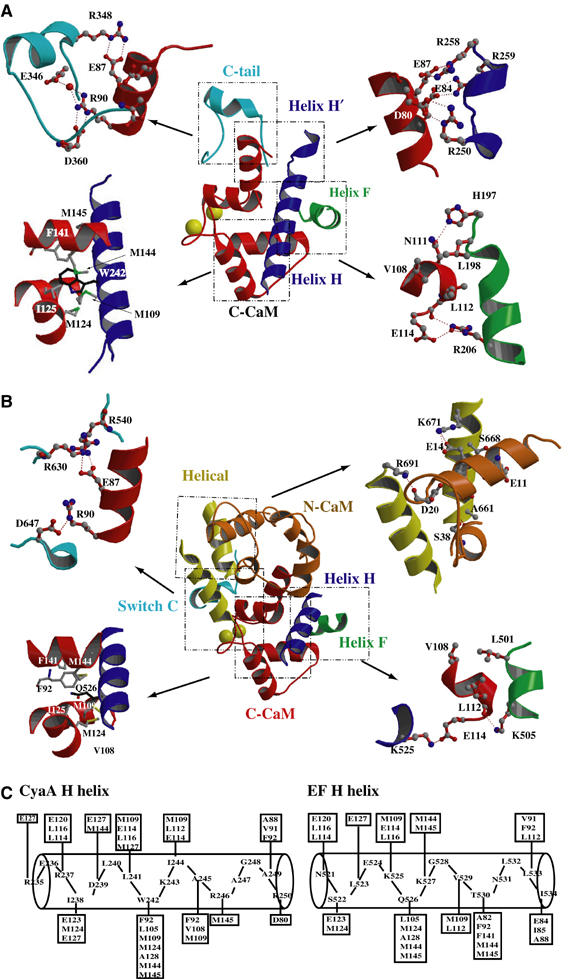
Interactions of CaM with CyaA–ACD. (A) Detailed interactions of C-CaM with four discrete regions of CyaA–ACD. C-CaM is colored red and N-CaM is colored in orange. The C-CaM-contact regions, helix F, helices H/H′, and the C-terminal tail of CyaA–ACD are colored green, purple, and cyan, respectively. The atoms carbon, oxygen, nitrogen, and sulfur are colored in gray, red, blue, and green, respectively. (B) The interactions of CaM with EF for the comparison. The corresponding CaM contact regions of EF, helix F, and helix H at switch A are colored green and purple, respectively. The two additional CaM contact regions, switch C and the helical domain, are colored cyan and yellow, respectively. (C) Schematic diagram showing the major contact between C-CaM with the helix H of CyaA–ACD and EF. The CaM residues within 4 Å distance of the indicated residues of CyaA–ACD are boxed.
Of those, there is extensive interaction between helix H of CyaA–ACD and C-CaM (Figure 2A). Particularly, tryptophan 242 of CyaA is completely buried by a hydrophobic pocket formed by two hydrophobic residues, isoleucine 125 and phenylalanine 141, as well as four methionines (M109, M124, M144, M145) of C-CaM (Figure 2A). This is consistent with the observations that the oxidation of three methionine residues, 109, 124, and 145, of CaM significantly reduces their affinity to CyaA, and the CyaA–ACD–W242G mutant has drastically reduced activation by CaM (Figure 3) (Glaser et al, 1989; Vougier et al, 2004). Outside the H helix, three additional regions of CyaA make substantial contacts with C-CaM. These include the extensive salt bridges formed between three arginine residues, R250, R258, and R259, at the H′ helix of CyaA–ACD and glutamate residues E84 and E87 of C-CaM (Figure 2A). This also includes the interaction of the residues at the C-terminal end of CyaA–ACD, E346, R348 and D360, with E87 and R90 of C-CaM (Figure 2A). In addition, the F helix of CyaA–ACD also makes significant contacts with C-CaM. While H197 of CyaA–ACD forms a hydrogen bond with E114 of C-CaM, R206 of CyaA–ACD forms a hydrogen bond with the main chain of G113 and contacts E114 via a water molecule (Figure 2A).
Figure 3.
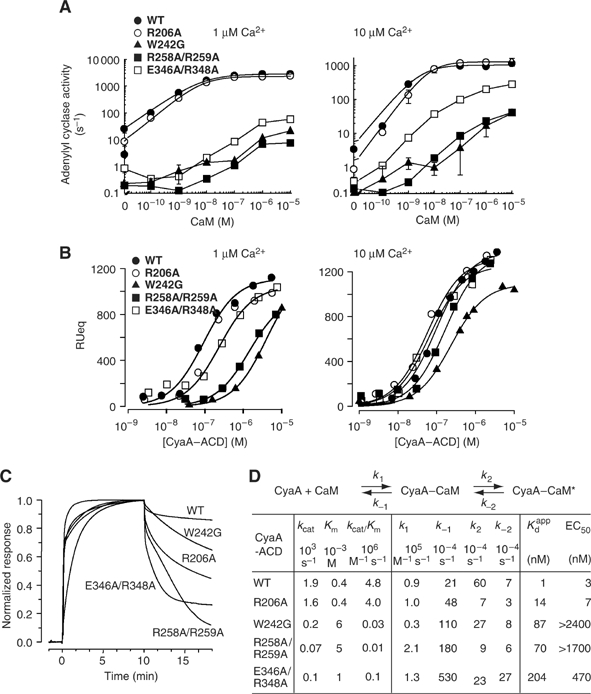
Characterization of CyaA–ACD mutants. (A) The activation of CyaA–ACD and its mutants by CaM at 1 and 10 μM free Ca2+ concentration. Assays were performed in the presence of 10 mM MgCl2 and 5 mM ATP. (B) Equilibrium binding isotherms of CyaA and its mutant to cutinase-CaM at 1 μM (left) and 10 μM (right) free Ca2+. (C) Representative normalized SPR sensorgrams of the binding of cutinase-CaM with CyaA–ACD and its mutants at 10 μM free Ca2+ concentration. (D) Kinetic parameters of CyaA mutants. The kcat and Km values were derived from enzymatic assays with variable ATP concentrations. Apparent dissociation constant (Kdapp) calculated from these kinetic parameters based on the conformational change model listed above and χ2 values were below 20 in all analyses. K1=k−1/k1 and K2=k2/k−2. Kdapp=K1/(1+K2). EC50 values for CaM activation were derived from curve fitting of the CaM activation curve at 10 μM Ca2+ to a simple rectangular hyperbola.
To examine whether the C-CaM-bound CyaA–ACD structure truly represents the interaction between CyaA–ACD and CaM, CyaA mutants carrying mutations at four CaM contact regions of CyaA were made and characterized by their kinetic parameters and interaction with immobilized CaM (Figure 3) (Shen et al, 2002). CyaA–ACD–R206A, which has a single mutation at the F helix, behaved similarly to wild-type CyaA–ACD (Figure 3). The other three mutants, CyaA–ACD–W242G, CyaA–ACD–R258A/R259A, and CyaA–ACD–E356A/R358A, CyaA mutants with mutations at helix H, helix H′, and C-terminal tail of CyaA–ACD, respectively, have reduced activation by CaM at both 1 and 10 μM free calcium concentrations (Figure 3A). Consequently, all three mutants had reduced catalytic efficiency (kcat/Km) (Figure 3D and Supplementary Figure 4). These mutants also had noticeably reduced affinity to CaM based on the Kd values derived from the equilibrium binding isotherms at 1 μM free calcium concentration (Figure 3B). Interestingly, the differences in the apparent Kd values were less obvious at 10 μM free calcium concentration (Figure 3B).
To better examine the binding affinity of CaM with CyaA–ACD, we analyzed the association and dissociation kinetics of CaM in complex with wild-type and mutant forms of CyaA–ACD at a free calcium concentration of 10 μM (Figure 3C). The dissociation of wild-type CyaA–ACD from CaM was slow (data not shown). On the contrary, all CyaA–ACD mutants displayed faster dissociation than wild type. In all mutants, there was an initial rapid dissociation phase followed by a slow dissociation one. In some cases, there was a pseudo-linear phase between these two phases. These results are consistent with the C-CaM-bound CyaA–ACD structure, which shows that all four C-CaM contact regions of CyaA–ACD contribute to CaM binding.
The simplest model accounting for these characteristics of CyaA–ACD mutants assumes the presence of two kinetically resolvable CyaA–CaM complexes. At a Ca2+ concentration of 10 μM, the conversion of CyaA–CaM* to CyaA–CaM is slow. This conversion was accelerated in the absence of Ca2+, as CyaA was rapidly dissociated from CaM in the presence of excess EGTA (data not shown). Based on this model, kinetic parameters could be deduced and all four mutants have increased apparent Kd values (Figure 3D).
Comparison of the interactions of CaM with CyaA–ACD and EF
The adenylyl cyclase core domain of CyaA shares 25% sequence identity to that of anthrax EF. EF consists of the N-terminal anthrax protective antigen-binding domain and the C-terminal ACD, which can be divided into the CA and CB domains of the catalytic core and helical domains (Figure 4A) (Drum et al, 2002; Shen et al, 2005). The catalytic site of EF lies at the interface of CA and CB (Figure 4B). CyaA–ACD has structural domains that correspond to the CA and CB domains of EF (Figure 4 and Supplementary Figure 5). These two domains of CyaA–ACD, CA (M1–G61, A187–A364) and CB (V62–T186), are quite similar to those of EF (r.m.s.d.=1.17 Å for a total of 145 Cα atoms of CA and r.m.s.d.=1.08 Å for a total of 107 Cα atoms of CB). Hereafter, they are referred to as the CA and CB domains of CyaA–ACD. Interestingly, the surface charge distribution of the CA and CB domains of CyaA–ACD is quite different from that of EF.
Figure 4.
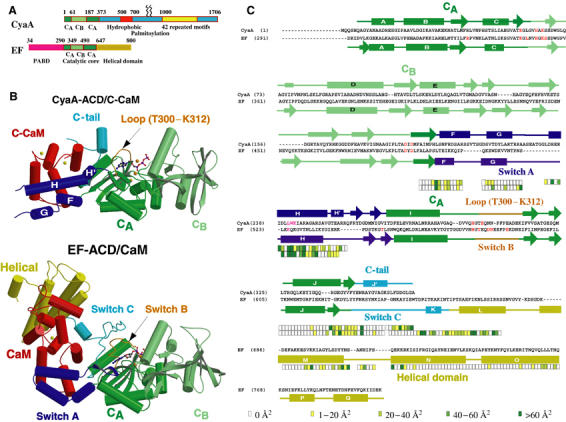
Comparison of C-CaM-bound CyaA–ACD and CaM-bound EF–ACD. (A) Diagram for the domain organization of CyaA and EF. CyaA has the N-terminal ACD containing CA and CB domains, and the C-terminal domain for membrane insertion, receptor binding, and hemolytic activity. EF has the N-terminal anthrax protective antigen-binding domain (PABD) and C-terminal ACD that contains the catalytic core (CA and CB) and helical domains. (B) Secondary structure of CaM-bound CyaA–ACD (top) and CaM-bound EF–ACD (bottom). CA and CB domains of CyaA–ACD and EF–ACD are colored green and light green, respectively. C-CaM (CyaA–ACD) and CaM (EF–ACD) are colored red. The helical domain of EF is colored yellow. The three switch regions, switch A, switch B, and switch C of EF, are colored purple, orange, and cyan, respectively. The regions, helices F–H′, loop T300–K312, and the C-tail of CyaA–ACD, that correspond to the three switch regions of EF are colored purple, orange, and cyan, respectively. Calcium ions are colored yellow and magnesium ions orange. The carbon, oxygen, nitrogen, and phosphorus atoms of adefovir diphosphate (CyaA–ACD) and 3′dATP (EF–ACD) are colored gray, red, blue, and purple, respectively. (C) Sequence alignment of CyaA–ACD and EF–ACD. The secondary structure assignment of CyaA–ACD is shown above the sequences of CyaA and that of EF is below the sequences of EF. The color boxes below indicate the contact areas (Å2) of CyaA and EF buried by CaM in four shades of green. Residues in CyaA–ACD and EF–ACD that are shown to be involved in catalysis and CaM binding by mutagenic analyses are colored red and magenta, respectively (Glaser et al, 1989, 1991; Munier et al, 1992; Drum et al, 2000, 2002).
Both CyaA and EF make substantial contacts in binding CaM (Figure 4B and C). Two C-CaM-contacting regions, helices F and H of CyaA, are positioned similarly to those helices at the switch A region of EF (Figures 2 and 4B). However, the other two CaM contact regions of CyaA are distinct from those of EF. The C-terminal tail of CyaA–ACD is structurally diverse from the corresponding switch C region of EF. CyaA has an additional H′ helix to contact C-CaM, while EF has an extra domain, the helical domain, to bind N-CaM (Drum et al, 2002; Shen et al, 2005).
Sequence comparison reveals that the residues of CyaA that contact CaM are not conserved with the corresponding residues in EF (Figure 4C). Consequently, the residues at the four CaM-contacting regions of CyaA–ACD are almost completely different from those of EF (Figure 2). The H helix involved in the CyaA and EF interaction with C-CaM is particularly striking (Figure 2C). Furthermore, key interactions of CaM with CyaA also distinctly diverge from those with EF. For example, while CyaA–ACD W242 plays a vital role in CaM binding, the corresponding residue in EF, glutamine 526, has a minimal role (Figure 2) (Drum et al, 2002). Instead, the salt bridge formed between lysine 525 of EF and glutamate 114 of CaM is crucial for their interaction (Figure 2B) (Drum et al, 2002; Shen et al, 2002).
CyaA has about 100-fold higher affinity to CaM than EF. However, the contact surface between CyaA and C-CaM (3395 Å2) is smaller than that between EF and C-CaM (3914 Å2). In addition, CyaA lacks the corresponding helical domain of EF, which also makes substantial contact with CaM and is vital for the activation of EF by CaM (Figure 4) (Drum et al, 2000). Even though there is the smaller contact surface, one contribution to CyaA–ACD's higher affinity to CaM is that CyaA–ACD has a significantly better surface complementarity to C-CaM than EF. This is based on the higher Sc index for the contact of C-CaM with CyaA than that with EF (0.658 versus 0.518) (Lawrence and Colman, 1993).
Catalytic site of CyaA
CyaA and EF, the enzymes that convert ATP to cAMP and PPi, have similar properties in catalysis. CyaA and EF have near-equal affinities to ATP (0.2–1 mM) and the reaction products (0.6–4 mM) (Supplementary Figure 6 and Supplementary Table 2) (Guo et al, 2004). They also have similar catalytic rates (1–5 m s−1) and catalytic efficiency (∼107 M−1 s−1). Steady-state kinetic analysis reveals that these two enzymes release the reaction products randomly, but prefer to release PPi first (Supplementary Figure 6) (Guo et al, 2004). The rate of the reverse reaction of CyaA is about one-thirteenth that of the forward reaction (Supplementary Figure 6 and Supplementary Table 2). This differs from EF, which has similar rates for the forward and reverse reactions (Guo et al, 2004).
The structure of C-CaM-bound CyaA–ACD in complex with adefovir diphosphate reveals how adefovir diphosphate binds the active site of this enzyme tightly (Figure 5A and B and Supplementary Figure 7). Adefovir diphosphate forms a network of hydrogen bonds and salt bridges to contact the residues crucial for catalysis of CyaA–ACD, which lie between the interface of the CA and CB domains (Figure 5A). The interaction of CyaA–ACD with the adenine base and triphosphate moieties of adefovir diphosphate is similar to how EF interacts with 3′deoxy ATP, a noncyclizable ATP analog, and adefovir diphosphate (Figure 5A and C). Three magnesium ions are observed in C-CaM-bound CyaA–ACD in complex with adefovir diphosphate. Two of them are found at locations similar to those found in CaM-bound EF in complex with 3′deoxy ATP (Figure 5A and C). Of those, one is coordinated by two aspartate residues (D188 and D190) and a histidine (H298), and the other by α and β phosphates of triphosphate moieties. These two metal ions at the active site of EF are postulated to be involved in two-metal-ion catalysis (Shen et al, 2005). The third magnesium ion is coordinated by two aspartates (D188 and D190) and the main chain of glutamine 297. This magnesium is away from the substrate and may play a structural role in the active site of CyaA.
Figure 5.
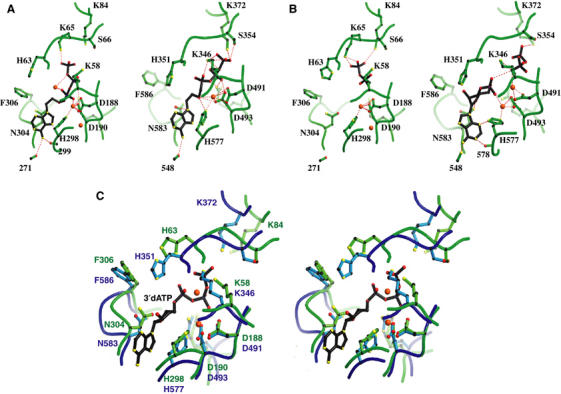
Comparison of nucleotide binding of CyaA and EF. (A) Active site of CyaA–ACD with adefovir diphosphate (left, accession number 1ZOT) and EF–ACD (right, 1PK0) in the presence of adefovir diphosphate. The atoms, carbon, oxygen, and nitrogen, are black, red, and yellow, respectively. Three Mg2+ ions and one Yb3+ ion are colored red at the active sites of CyaA–ACD and EF–ACD, respectively. (B) Active site of CyaA–ACD with PPi (left, 1COL) and EF–ACD with cAMP and PPi (right, 1SK6). Two Mg2+ ions and two Yb3+ ions are colored red at the active sites of CyaA–ACD and EF–ACD, respectively. (C) Comparison of the catalytic site of CyaA–ACD (1YRT) with EF–Mg2+–3′dATP (1XFV) in the stereo view. The main chains of CyaA–ACD are colored green and the side chains are colored light green. The main chains of EF are in blue and the side chains are sky-blue. Magnesium ions (red) and 3′dATP are from the EF–CaM complex.
Comparing the orientations of CA and CB of CaM-bound EF, the CB domain of CyaA–ACD has a 23° rigid body rotation relative to CA (Supplementary Figure 5) (Shen et al, 2005). Due to this rigid body rotation, the catalytic residues in CB are moved approximately 2 Å away from those in CA (Figure 5C). This makes the catalytic pocket of CyaA–ACD more open than that of EF. Adefovir diphosphate is an acyclic nucleotide phosphonate. The adenine base of this molecule has higher rotational freedom to its triphosphate moiety when compared with those of the ATP analogs. This may explain our failure to obtain the crystal of C-CaM-bound CyaA–ACD in complex with 3′deoxy ATP or 2′deoxy 3′anthraniloyl ATP by soaking or cocrystallization to date. The high flexibility between the adenine and triphosphate moieties may, in part, explain the 10 000-fold higher affinity of adefovir diphosphate to the active site of CyaA than that of ATP.
The structure of C-CaM-bound CyaA–ACD in complex with PPi reveals that the binding of PPi to the active site of CyaA is similar to how the terminal diphosphate of adefovir diphosphate binds (Figure 5B). The structural comparison reveals that the locations of residues on CA that are crucial for the binding of catalytic metal ions (aspartates 188 and 190 as well as histidine 298) and the positioning of ribose (asparagine 304) of CyaA are nearly identical to the corresponding residues in EF (Figure 5C) (Shen et al, 2005). Similarly, those residues on CB that are crucial for binding the triphosphate of ATP (arginine 37 and three lysine residues, K58, K65, K84) and the deprotonation of 3′OH (histidine 63) are well aligned with the corresponding residues in EF (Figure 5C).
Mechanism of catalytic activation of CyaA by CaM
While the CaM-contacting residues of CyaA vary substantially from those of EF, the mechanism of activation of CyaA and EF is likely to be similar. The structures of EF alone and CaM-bound EF reveal that EF–ACD has three regions, switch A, B, and C, that undergo significant conformational changes (Figures 4B and 6A) (Drum et al, 2002). The corresponding regions in CyaA are located at T18, the primary CaM interacting domain that becomes protease resistant upon CaM binding (Figures 1B and 6A) (Ladant, 1988). This suggests that T18 undergoes substantial conformational rearrangement when it interacts with CaM as well.
Figure 6.
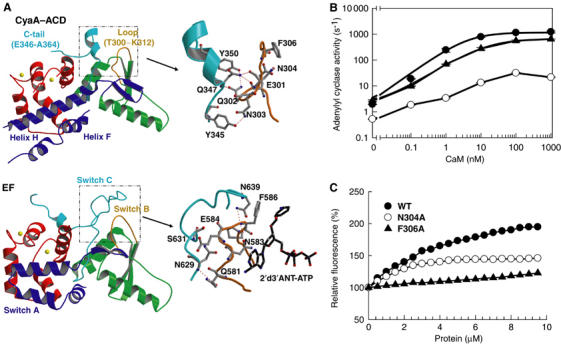
Catalytic activation of CyaA. (A) Structural comparison of CyaA–ACD and the switch regions of EF. The structure of CyaA–ACD is aligned with EF by the CA domain (green). The C-CaM is colored red. The switch A, B, C of EF and the corresponding regions of CyaA are colored blue, orange, and cyan, respectively. The catalytic loop of CyaA–ACD and its contact with the C-terminal tail of CyaA–ACD are highlighted (right). The corresponding switch B and switch C regions of EF are shown for comparison (right). The atoms, carbon, oxygen, and nitrogen, are gray, red, and blue, respectively. The accession number for CaM-bound EF–ACD in complex with 2′d′3ANT-ATP is 1LVC. (B) The activation of CyaA–ACD and its mutants, N304A and F306A, by CaM at 10 μM free Ca2+ concentration. (C) Equilibrium titration of 2′d 3′ANT–ATP with CaM-bound CyaA–ACD and its mutants, N304A and F306A.
The key step in the activation of EF by CaM is stabilization of a catalytic loop, switch B (Drum et al, 2002). The corresponding homologous loop of CyaA, T300–K312, resides at a similar location. We hypothesize that the binding of CaM can stabilize the T300–K312 loop of CyaA to bring crucial catalytic residues into contact with ATP. Asparagine 304 of CyaA at loop T300–K312 is a key candidate, since it is homologous to N583 of EF, the key catalytic residue at switch B holding ribose in place during catalysis (Figure 6A). The interaction of EF and a fluorogenic ATP analog reveals that CaM promotes the interaction of the catalytic loop of EF with ATP. CaM can increase the fluorescence signal of EF- and CyaA-bound anthraniloyl ATP (Sarfati et al, 1990). Phenylalanine 586 of EF is responsible for this enhancement (Shen et al, 2002). Structural alignment reveals that the corresponding phenylalanine residue of CyaA, F306, is positioned identically to F586 of EF (Figures 2 and 6A).
To test the hypothesis of catalytic loop stabilization, we made CyaA–ACD–F306A and CyaA–ACD–N304A, which have a single mutation of phenylalanine 306 and asparagine 304 to alanine, respectively. CyaA–ACD–F306A is near normal in its activation by CaM and catalytic efficiency (Figure 6B and Supplementary Figure 4). Consistent with our hypothesis, this mutant fails to increase the fluorescence signal of 2′d3′anthraniloyl ATP (Figure 6C). CyaA–ACD–N304A has about a 72-fold reduction in its catalytic efficiency, while having a normal EC50 value for CaM activation (Figure 6B and Supplementary Figure 4). This mutant also has a reduced ability to enhance the CaM-induced fluorescence of 2′d3′anthraniloyl-ATP (Figure 6C), indicating the role of N304 in nucleotide binding and catalysis. Together, our data support the hypothesis that CaM induces catalytic loop stabilization in the promotion of catalysis.
The interaction between the catalytic loop (switch B) and switch C is the key step in catalytic activation of EF by CaM (Figure 6A) (Drum et al, 2002). Although the corresponding region in CyaA–ACD, V343–A364, does not share structural homology with the switch C of EF, this region mimics switch C to make substantial contacts with both C-CaM and the catalytic loop of CyaA (Figure 6A). As described above, the mutations at helix F and H′, and the C-terminal tail of CyaA–ACD can profoundly impede the conversion of CyaA–CaM to CyaA–CaM* (Figure 3D). Thus, a concerted movement of the C-terminal tail of CyaA–ACD as well as those of helices F and H′ upon CaM binding likely plays a key role in stabilizing the T300–K312 loop for catalytic activation.
Catalytic activation of EF by CaM starts with the coordinated interactions of the helical domain of EF with N-CaM and that of switch A of EF with C-CaM (Figures 4B and 6A) (Drum et al, 2002; Ulmer et al, 2003). The interactions of the F, H, and H′ helices of CyaA–ACD with C-CaM likely mimic the interaction of switch A with CaM. While N-CaM by itself can activate CyaA–ACD and contributes significantly in energy to bind and activate CyaA–ACD, there is no segment of CyaA–ACD that mimics the helical domain of EF (Figure 4) (Shen et al, 2002). The role of the helical domain of EF is to lock EF in the inactive state (Shen et al, 2002). This explains why EF has no detectable basal activity in a sensitive genetic assay, while CyaA does (Karimova et al, 1998; Drum et al, 2000). The molecular mechanism of how N-CaM contributes to the catalytic activation of CyaA remains elusive.
Discussion
The interaction of CaM effectors with CaM represents an array of evolutionary strategies utilized by the diverse molecules in their interaction with this highly conserved calcium sensor. The conventional view is that CaM binds a short amphipathic α-helical peptide such as the high-affinity CaM-binding peptide from smooth and skeletal muscle myosin light chain kinases (MLCK) (Figure 7) (Hoeflich and Ikura, 2002). The extensive interaction of C-CaM with the H helix of CyaA–ACD represents the classical interaction of C-CaM with the motifs from CaM effectors (Figure 7A). The interaction of CyaA W242 with the hydrophobic pocket of C-CaM is identical to that between the corresponding tryptophan at the CaM binding α-helix of MLCK and CaM (Figure 7B) (Ikura et al, 1992; Meador et al, 1992).
Figure 7.
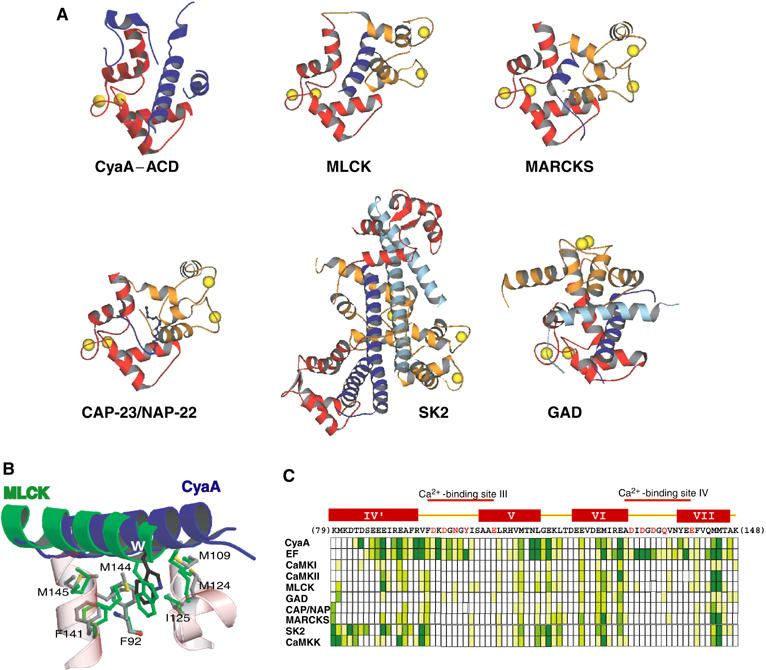
Comparison of the interactions of CaM with its effectors. (A) Representative structures of CaM in complex with its effectors. N-CaM is colored orange and C-CaM red. The segment from CaM effectors is colored purple and the second molecule of the dimer of CaM effectors is cyan. The protein data bank accession numbers, 1CDL, 1IWQ, 1L7Z, 1NWD, 1G4Y, and 1YRT, for CaM in complex with MLCK, MARCKS, CAP-23/NAP-22, GAD, calcium-activated small-conductance potassium channel (SK2), and CyaA, respectively. (B) Comparison of the interaction of C-CaM with the H helix of CyaA–ACD and the amphipathic α-helix of MLCK. The helices of CaM are colored red and the atoms, carbon, oxygen, nitrogen, and sulfur, are gray, red, blue, and yellow, respectively. (C) Interaction of CaM with its effectors. Sequence and secondary structure of the C-terminal of CaM are shown on the top. The Ca2+-binding sites are marked and Ca2+-binding residues are colored red. Boxes beneath the sequence of C-CaM indicate the contact area of each residue in the various structures, using the same coloring scheme as in Figure 4C. The Protein Data Bank codes for the structures are 1CKK, 1CDM, 1IQ5, and 1K90 for CaM in complex with CaM kinase I (CaMKI), CaM kinase II (CaMKII), CaM kinase kinase (CaMKK), and EF, respectively. Helix designations above the CaM sequence are based on the 1CLL CaM structure.
Growing evidence shows that CaM can bind motifs other than a short α-helix. CaM can bind other short motifs such as the amphipathic, turn-helix peptides and the myristoylated peptides exemplified by CaM's interaction with the major alanine-rich C-kinase substrate (MARCKS) and CAP-23/NAP-22, respectively (Figure 7A and C) (Yamauchi et al, 2003; Matsubara et al, 2004). CaM can grasp two or three helices to trigger the dimerization of its effectors such as the small-conductance potassium channel (SK2) and glutamic acid decarboxylase (GAD) (Figure 7A) (Schumacher et al, 2001; Yap et al, 2003). Our structures of CaM-bound EF and C-CaM-bound CyaA reveal how four discrete regions of EF and CyaA form a large surface to bind CaM (Figure 3). Together, these structures reveal how CaM utilizes all of its available contact surfaces to bind its effectors (Figure 7C).
There are substantial similarities between CyaA–ACD and EF–ACD. CyaA–ACD has a structure similar to EF–ACD. These two enzymes also share a similar mechanism of activation, which is the stabilization of a catalytic loop upon CaM binding (Drum et al, 2002). The interaction of CyaA–ACD with PMEApp reveals where three magnesium ions are located. The location of two of these ions is ideal for two-metal-ion catalysis (Shen et al, 2005). Thus, similar to EF, CyaA is likely to use this catalytic mechanism, which is shared by most DNA and RNA polymerases (Steitz, 1998). However, our structures of CaM-bound EF and CyaA reveal the remarkable differences in how CaM interacts with two structurally homologous adenylyl cyclase toxins. The distinct CaM-binding surface of CyaA and EF allows CyaA to have an approximately 100-fold higher affinity to CaM than EF.
The need to have such a differential affinity may be explained by the route of entrance and cellular location of these two enzymes. CyaA–ACD translocates across the host cell surface and stays on the intracellular side of the plasma membrane (Ladant and Ullmann, 1999). EF enters onto the cytosolic face of host cells through endocytosis (Abrami et al, 2005). Thus, these two enzymes will undoubtedly need to compete with different sets of CaM-binding proteins (Jurado et al, 1999). CyaA and EF belong to the class II adenylyl cyclase family. The third known adenylyl cyclase toxin in this family is ExoY secreted by Pseudomonas aeruginosa, the causative agent of certain nosocomial infections. Interestingly, ExoY enters the host cell via the type III secretion system, and cannot bind and be activated by CaM (Yahr et al, 1998). Future genomic and biochemical analyses will undoubtedly offer insight into how EF and CyaA evolve around the unique properties of CaM to fulfill their biological roles, as well as into how other adenylyl cyclase toxins such as ExoY or Vibrio cholerae adenylyl cyclase toxin choose cellular activators (Yahr et al, 1998; Purdy et al, 2005).
Class II adenylyl cyclases are structurally distinct from class III enzymes, which are found in bacteria and many eukaryotes (Linder and Schultz, 2003). The active site of class III enzymes is formed at the interface of two homologous domains and both domains of class III enzymes contribute the catalytic residues (Tesmer et al, 1997; Sinha et al, 2005; Steegborn et al, 2005; Tews et al, 2005). Rigid body rotation of two homologous domains and conformational changes at the interface trigger the conformational changes of the active site from the open conformation to closed, leading to catalytic activation. This activation mechanism is distinct from EF and CyaA, which use stabilization of the catalytic loop. However, our data suggest that the relative rigid body rotation between CA and CB may also play a regulatory role in catalysis of class II enzymes. In the crystal structure of C-CaM-bound CyaA–ACD, the rotation of CB relative to CA makes the active site more open than CaM-bound EF. This rigid body rotation between CA and CB is also seen in EF (Shen et al, 2005).
Pertussis is a severe infant disease and one of the top five child killers, and CyaA is a key virulence factor for colonization by pertussis bacteria (Mattoo et al, 2001). CyaA–ACD is engineered to elucidate protein–protein interaction by bacterial two-hybrid analysis, as well as to monitor the bacterial secretion machinery (Sory and Cornelis, 1994; Karimova et al, 1998; Nagai et al, 2005). CyaA with the inserted epitope at its ACD was developed as an effective vehicle for antigen presentation and diagnosis (Vordermeier et al, 2004). Our C-CaM-bound CyaA–ACD structure will undoubtedly lay the foundation for the design of a vaccine and antitoxin against this deadly infant killer, as well as to better design CyaA as experimental tools.
Materials and methods
Purification of recombinant proteins
Mutants of CyaA–ACD and CaM were generated using the Quick-Change mutagenesis kit (Biocrest Manufacturing LP). The expression and purification of N-terminal hexahistidine-tagged CyaA–ACD and its mutants, selenomethionyl CyaA–ACD-(1–373), CaM, and CaM mutants were performed as described (Drum et al, 2000, 2002; Shen et al, 2002). To make the monomeric C-CaM-bound CyaA–ACD-(1–373), C-CaM and CyaA–ACD were mixed at a ratio of 1.5 to 1 and incubated on ice for 30 min. After a 10-min centrifugation at 5000 g to remove the CyaA–ACD aggregate, the sample was added to a Pharmacia Superdex-200 column and the monomeric C-CaM-bound CyaA–ACD was then isolated and stored at −80°C.
Crystallization and data collection of CyaA–ACD–C-CaM complex
Crystals of the complex of CyaA–ACD-(1–373) and C-CaM were obtained by hanging-drop vapor diffusion at 4°C by mixing 1 μl of the protein solution [10 mg ml−1 in 20 mM Tris–HCl (pH 8.0) and 20 mM NaCl] with the precipitant solution [18% (v v−1) PEG 4000, 16% (v v−1) isopropanol, and 0.1 M sodium citrate (pH 5.6)]. Crystals with a size greater than 0.1 mm in all three dimensions formed within 2 weeks. Crystals were transferred to the precipitant solution with 25% glycerol for 3 min prior to flash freezing in liquid nitrogen. To obtain crystals of the complex of CyaA–ACD-(1–373) and C-CaM in the presence of 1 mM Ca2+, the precipitant solution was 18% PEGMME 2000, 14% ethanol and 0.1 M citrate acid (pH 5.0). Crystals of the complex of C-CaM-bound CyaA–ACD with 1 mM Ca2+ were transferred into the cryoprotectant (32% PEGMME 2000, 14% ethanol and 0.1 M citrate acid (pH 5.0)) for 5 min and flash-frozen in liquid nitrogen. To obtain a crystal of the complex of CyaA–ACD and C-CaM with adefovir diphosphate, crystals of C-CaM-bound CyaA–ACD were grown using vapor diffusion, soaked in 10 mM adefovir diphosphate and 5 mM additional MgCl2 during cryoprotection overnight, and frozen in liquid nitrogen. A similar procedure was used to obtain CyaA–ACD in complex with C-CaM and PPi, except that 10 mM cAMP, 10 mM PPi, and 5 mM MgCl2 were used during soaking. Data were collected at APS BioCars 14-IDB, APS SBC 19ID, and APS SBC-19BM and were processed with the HKL 2000 program (Otwinowski and Minor, 1997).
Structure determination of C-CaM-bound CyaA–ACD
The initial phases were obtained from the data set of multi-wavelength anomalous dispersion (MAD) of C-CaM-bound selenomethionyl CyaA–ACD because no satisfactory phase solutions emerged from the molecular replacement methods using either EF–ACD or C-CaM as the search model. Five out of seven selenium sites were identified by the Shake-n-Bake program using the data set collected at the peak wavelength from the MAD data set of C-CaM-bound selenomethionyl CyaA–ACD (Weeks and Miller, 1999). The positions of these sites as well as the MAD data set were then entered into the SHARP program to calculate the initial phases (La Fortelle and Bricogne, 1997). An experimental 3.2 Å electron density map was calculated and solvent flattened using program DM, resulting in an overall figure of merit of 0.81 for all reflections (Supplementary Table 1). From the electron density map, the protein secondary structure can be unambiguously identified. The phases were then extended to two data sets (CyaA–ACD–C-CaM in the presence of 1 mM CaCl2 at 2.5 Å and CyaA–ACD–C-CaM without exogenously added calcium ion at 2.1 Å) using the Resolve program (Terwiliger, 2000). The initial phases for CyaA–ACD–C-CaM in complex with adefovir diphosphate or PPi were obtained by the difference Fourier method using the CNS program and the model of C-CaM-bound CyaA–ACD. Model building and refinement were carried out with O and CNS, respectively (Jones et al, 1991; Brunger et al, 1998). The crystals of C-CaM-bound CyaA–ACD contain one protein complex in an asymmetric unit. The accession number for the coordinate of C-CaM-bound CyaA–ACD with and without exogenously added CaCl2 are 1YRU and 1YRT, respectively, and those with adefovir diphosphate and PPi are 1ZOT and 2COL, respectively. Figures were generated using software Molscript, Bobscript, Pov-ray, and Raster3D.
In vitro adenylyl cyclase assay and fluorescence measurement
The activities for the forward reaction were measured at 30°C in the presence of 10 mM MgCl2, the indicated ATP concentrations and a trace amount of α-ATP for 10 min as described (Guo et al, 2004). The reaction was buffered by 100 mM Hepes (pH 7.2) and the free calcium concentration was controlled by 10 mM EGTA to 0.1 μM/2 μM free Ca2+ based on calculated values using the MAXC program, http://www.stanford.edu/~cpatton/max.html. cAMP was separated from ATP by Dowex and alumina columns. The activities for the synthesis of ATP from cAMP and PPi by CyaA–ACD were measured as described (Guo et al, 2004). Steady-state fluorescence emission spectra were recorded on a Jobin Yvon-Spex Fluoromax-2 photon-counting spectrofluorometer (Edison, NJ).
Binding analysis of CyaA–ACD with CaM
Binding analysis was performed using a method similar to what was previously described (Shen et al, 2002). Various concentrations (1 nM–10 μM) of CyaA–ACD or its mutants in buffer X (10 mM Tris–HCl, pH 7.0, 150 mM KCl, 1.0 mM EGTA, 10 mM MgCl2 and variable CaCl2 concentrations to reach the desired free Ca2+ concentrations) were applied to cutinase-CaM immobilized on a self-assembled monolayer at a flow rate of 3 μl·min−1 for 10 min, followed by washing with buffer X (10–180 min) and regenerated with buffer X supplemented with 50 mM EGTA (10 min). All experiments were carried out at 25°C using a BIACore 1000 instrument. Equilibrium response changes (ΔRUeq) were obtained as described (Schuck, 1997). Background binding was minimal (ΔRU<30) when measured by assessing the binding of CyaA or mutants to cutinase-immobilized surfaces. All binding was specific as treatments with EGTA induced near-complete dissociations of all bound material. Equilibrium analysis was carried out by plotting ΔRUeq against concentrations of CyaA–ACD or the mutants. The data were fitted into a Langmuir isotherm shown below to obtain apparent Kd values:
![]()
Supplementary Material
Supplemental Figure 1
Supplemental Figure 2
Supplemental Figure 3
Supplemental Figure 4
Supplemental Figure 5
Supplemental Figure 6
Supplemental Figure 7
Supplemental Table 1
Supplemental Table 2
Acknowledgments
We are grateful to the staff of APS SBC, APS BioCars, Pengyun Li, and Natalia Zhukovskaya for their help in data collection, to Xiaojing Yang for her computer support and insight, to Mohammed Yousef for his helpful advice in fluorescence measurement, and to David Sisul for his critical reading of the manuscript. This research was supported by the National Institutes of Health GM62548, AI66503 and GLRCE-DP9 grant to W-J Tang and the AHA fellowship 0520123Z to Y Shen and the Burroughs Wellcome Fund Interfaces grant 1001774 to Y-S Lee. Use of the Advanced Photon Source was supported by the US Department of Energy, Office of Basic Energy Sciences, under Contract No. W-31-109-ENG-38.
References
- Abrami L, Reig N, van der Goot FG (2005) Anthrax toxin: the long and winding road that leads to the kill. Trends Microbiol 13: 72–78 [DOI] [PubMed] [Google Scholar]
- Berridge MJ, Bootman MD, Roderick HL (2003) Calcium signalling: dynamics, homeostasis and remodelling. Nat Rev Mol Cell Biol 4: 517–529 [DOI] [PubMed] [Google Scholar]
- Bhattacharya S, Bunick CG, Chazin WJ (2004) Target selectivity in EF-hand calcium binding proteins. Biochim Biophys Acta 1742: 69–79 [DOI] [PubMed] [Google Scholar]
- Bouhss A, Krin E, Munier H, Gilles AM, Danchin A, Glaser P, Barzu O (1993) Cooperative phenomena in binding and activation of Bordetella pertussis adenylate cyclase by calmodulin. J Biol Chem 268: 1690–1694 [PubMed] [Google Scholar]
- Brunger AT, Adams PD, Clore GM, DeLano WL, Gros P, Grosse-Kunstleve RW, Jiang JS, Kuszewski J, Nilges M, Pannu NS, Read RJ, Rice LM, Simonson T, Warren GL (1998) Crystallography & NMR system: a new software suite for macromolecular structure determination. Acta Crystallogr D Biol Crystallogr 54: 905–921 [DOI] [PubMed] [Google Scholar]
- Carbonetti NH, Artamonova GV, Andreasen C, Bushar N (2005) Pertussis toxin and adenylate cyclase toxin provide a one–two punch for establishment of Bordetella pertussis infection of the respiratory tract. Infect Immun 73: 2698–2703 [DOI] [PMC free article] [PubMed] [Google Scholar]
- Crivici A, Ikura M (1995) Molecular and structural basis of target recognition by calmodulin. Annu Rev Biophys Biomol Struct 24: 85–116 [DOI] [PubMed] [Google Scholar]
- Drum CL, Yan SZ, Bard J, Shen Y, Lu D, Soelaiman S, Grabarek Z, Bohm A, Tang W-J (2002) Structural basis for the activation of anthrax adenylyl cyclase exotoxin by calmodulin. Nature 415: 396–402 [DOI] [PubMed] [Google Scholar]
- Drum CL, Yan SZ, Sarac R, Mabuchi Y, Beckingham K, Bohm A, Grabarek Z, Tang W-J (2000) An extended conformation of calmodulin induces interactions between the structural domains of adenylyl cyclase from Bacillus anthracis to promote catalysis. J Biol Chem 275: 36334–36340 [DOI] [PubMed] [Google Scholar]
- Gallay J, Vincent M, Li de la Sierra IM, Munier-Lehmann H, Renouard M, Sakamoto H, Barzu O, Gilles AM (2004) Insight into the activation mechanism of Bordetella pertussis adenylate cyclase by calmodulin using fluorescence spectroscopy. Eur J Biochem 271: 821–833 [DOI] [PubMed] [Google Scholar]
- Glaser P, Elmaoglou-Lazaridou A, Krin E, Ladant D, Barzu O, Danchin A (1989) Identification of residues essential for catalysis and binding of calmodulin in Bordetella pertussis adenylate cyclase by site-directed mutagenesis. EMBO J 8: 967–972 [DOI] [PMC free article] [PubMed] [Google Scholar]
- Glaser P, Munier H, Gilles AM, Krin E, Porumb T, Barzu O, Sarfati R, Pellecuer C, Danchin A (1991) Functional consequences of single amino acid substitutions in calmodulin-activated adenylate cyclase of Bordetella pertussis. EMBO J 10: 1683–1688 [DOI] [PMC free article] [PubMed] [Google Scholar]
- Guermonprez P, Khelef N, Blouin E, Rieu P, Ricciardi-Castagnoli P, Guiso N, Ladant D, Leclerc C (2001) The adenylate cyclase toxin of Bordetella pertussis binds to target cells via the alpha(M)beta(2) integrin (CD11b/CD18). J Exp Med 193: 1035–1044 [DOI] [PMC free article] [PubMed] [Google Scholar]
- Guo Q, Shen Y, Zhukovskaya NL, Florián J, Tang W-J (2004) Structural and kinetic analyses of the interaction of anthrax adenylyl cyclase toxin with reaction products, cAMP and pyrophosphate. J Biol Chem 279: 29427–29435 [DOI] [PubMed] [Google Scholar]
- Hoeflich KP, Ikura M (2002) Calmodulin in action: diversity in target recognition and activation mechanisms. Cell 108: 739–742 [DOI] [PubMed] [Google Scholar]
- Ikura M, Clore GM, Gronenborn AM, Zhu G, Klee CB, Bax A (1992) Solution structure of a calmodulin–target peptide complex by multidimensional NMR. Science 256: 632–638 [DOI] [PubMed] [Google Scholar]
- Jones TA, Zou JY, Cowan SW, Kjeldgaard M (1991) Improved methods for binding protein models in electron density maps and the location of errors in these models. Acta Crystallogr A 47: 110–119 [DOI] [PubMed] [Google Scholar]
- Jurado LA, Chockalingam PS, Jarrett HW (1999) Apocalmodulin. Physiol Rev 79: 661–682 [DOI] [PubMed] [Google Scholar]
- Karimova G, Pidoux J, Ullmann A, Ladant D (1998) A bacterial two-hybrid system based on a reconstituted signal transduction pathway. Proc Natl Acad Sci USA 95: 5752–5756 [DOI] [PMC free article] [PubMed] [Google Scholar]
- La Fortelle E, Bricogne G (1997) Maximum-likelihood heavy-atom parameter refinement in the MIR and MAD methods. Methods Enzymol 276: 472–494 [DOI] [PubMed] [Google Scholar]
- Ladant D (1988) Interaction of Bordetella pertussis adenylate cyclase with calmodulin. Identification of two separated calmodulin-binding domains. J Biol Chem 263: 2612–2618 [PubMed] [Google Scholar]
- Ladant D, Ullmann A (1999) Bordetella pertussis adenylate cyclase: a toxin with multiple talents. Trends Microbiol 7: 172–176 [DOI] [PubMed] [Google Scholar]
- Lawrence MC, Colman PM (1993) Shape complementarity at protein/protein interfaces. J Mol Biol 234: 946–950 [DOI] [PubMed] [Google Scholar]
- Linder JU, Schultz JE (2003) The class III adenylyl cyclase: multi-purpose signalling modules. Cell Signal 15: 1081–1089 [DOI] [PubMed] [Google Scholar]
- Matsubara M, Nakatsu T, Kato H, Taniguchi H (2004) Crystal structure of a myristoylated CAP-23/NAP-22 N-terminal domain complexed with Ca2+/calmodulin. EMBO J 23: 712–718 [DOI] [PMC free article] [PubMed] [Google Scholar]
- Mattoo S, Foreman-Wykert AK, Cotter PA, Miller JF (2001) Mechanisms of Bordetella pathogenesis. Front Biosci 6: e168–e186 [DOI] [PubMed] [Google Scholar]
- Meador WE, Means AR, Quiocho FA (1992) Target enzyme recognition by calmodulin: 2.4 Å structure of a calmodulin–peptide complex. Science 257: 1251–1255 [DOI] [PubMed] [Google Scholar]
- Munier H, Bouhss A, Krin E, Danchin A, Gilles AM, Glaser P, Barzu O (1992) The role of histidine 63 in the catalytic mechanism of Bordetella pertussis adenylate cyclase. J Biol Chem 267: 9816–9820 [PubMed] [Google Scholar]
- Nagai H, Cambronne ED, Kagan JC, Amor JC, Kahn RA, Roy CR (2005) A C-terminal translocation signal required for Dot/Icm-dependent delivery of the Legionella RalF protein to host cells. Proc Natl Acad Sci USA 102: 826–831 [DOI] [PMC free article] [PubMed] [Google Scholar]
- Otwinowski Z, Minor W (1997) Processing of X-ray diffraction data collected in oscillation mode. Methods Enzymol 276: 307–326 [DOI] [PubMed] [Google Scholar]
- Purdy A, Rohwer F, Edwards R, Azam F, Bartlett DH (2005) A glimpse into the expanded genome content of Vibrio cholerae through identification of genes present in environmental strains. J Bacteriol 187: 2992–3001 [DOI] [PMC free article] [PubMed] [Google Scholar]
- Rogel A, Meller R, Hanski E (1991) Adenylate cyclase toxin from Bordetella pertussis. The relationship between induction of cAMP and hemolysis. J Biol Chem 266: 3154–3161 [PubMed] [Google Scholar]
- Sarfati RS, Kansal VK, Munier H, Glaser P, Gilles AM, Labruyere E, Mock M, Danchin A, Barzu O (1990) Binding of 3′-anthraniloyl-2′-deoxy-ATP to calmodulin-activated adenylate cyclase from Bordetella pertussis and Bacillus anthracis. J Biol Chem 265: 18902–18906 [PubMed] [Google Scholar]
- Schuck P (1997) Use of surface plasmon resonance to probe the equilibrium and dynamic aspects of interactions between biological macromolecules. Annu Rev Biophys Biomol Struct 26: 541–566 [DOI] [PubMed] [Google Scholar]
- Schumacher MA, Rivard AF, Bachinger HP, Adelman JP (2001) Structure of the gating domain of a Ca2+-activated K+ channel complexed with Ca2+/calmodulin. Nature 410: 1120–1124 [DOI] [PubMed] [Google Scholar]
- Shen Y, Lee Y-S, Soelaiman S, Bergson P, Lu D, Chen A, Beckingham K, Grabarek Z, Mrksich M, Tang W-J (2002) Physiological calcium concentrations regulate calmodulin binding and catalysis of adenylyl cyclase exotoxins. EMBO J 21: 6721–6732 [DOI] [PMC free article] [PubMed] [Google Scholar]
- Shen Y, Zhukovskaya NL, Guo Q, Florian J, Tang W-J (2005) Calcium-independent calmodulin binding and two-metal-ion catalytic mechanism of anthrax edema factor. EMBO J 24: 929–941 [DOI] [PMC free article] [PubMed] [Google Scholar]
- Shen Y, Zhukovskaya NL, Zimmer MI, Soelaiman S, Bergson P, Wang CR, Gibbs CS, Tang WJ (2004) Selective inhibition of anthrax edema factor by adefovir, a drug for chronic hepatitis B virus infection. Proc Natl Acad Sci USA 101: 3242–3247 [DOI] [PMC free article] [PubMed] [Google Scholar]
- Sinha SC, Wetterer M, Sprang SR, Schultz JE, Linder JU (2005) Origin of asymmetry in adenylyl cyclases: structures of Mycobacterium tuberculosis Rv1900c. EMBO J 24: 663–673 [DOI] [PMC free article] [PubMed] [Google Scholar]
- Sory MP, Cornelis GR (1994) Translocation of a hybrid YopE-adenylate cyclase from Yersinia enterocolitica into HeLa cells. Mol Microbiol 14: 583–594 [DOI] [PubMed] [Google Scholar]
- Steegborn C, Litvin TN, Levin LR, Buck J, Wu H (2005) Bicarbonate activation of adenylyl cyclase via promotion of catalytic active site closure and metal recruitment. Nat Struct Mol Biol 12: 32–37 [DOI] [PMC free article] [PubMed] [Google Scholar]
- Steitz TA (1998) A mechanism for all polymerases. Nature 391: 231–232 [DOI] [PubMed] [Google Scholar]
- Terwiliger TC (2000) Maximum likelihood density modification. Acta Crystallogr D Biol Crystallogr 56: 965–972 [DOI] [PMC free article] [PubMed] [Google Scholar]
- Tesmer JJ, Sunahara RK, Gilman AG, Sprang SR (1997) Crystal structure of the catalytic domains of adenylyl cyclase in a complex with Gsα-GTPγS. Science 278: 1907–1916 [DOI] [PubMed] [Google Scholar]
- Tews I, Findeisen F, Sinning I, Schultz A, Schultz JE, Linder JU (2005) The structure of a pH-sensing mycobacterial adenylyl cyclase holoenzyme. Science 308: 1020–1023 [DOI] [PubMed] [Google Scholar]
- Ulmer TS, Soelaiman S, Li S, Klee CB, Tang W-J, Bax A (2003) Calcium dependency of the interaction between calmodulin and anthrax edema factor. J Biol Chem 278: 29261–29266 [DOI] [PubMed] [Google Scholar]
- Vordermeier HM, Simsova M, Wilkinson KA, Wilkinson RJ, Hewinson RG, Sebo P, Leclerc C (2004) Recognition of mycobacterial antigens delivered by genetically detoxified Bordetella pertussis adenylate cyclase by T cells from cattle with bovine tuberculosis. Infect Immun 72: 6255–6261 [DOI] [PMC free article] [PubMed] [Google Scholar]
- Vougier S, Mary J, Dautin N, Vinh J, Friguet B, Ladant D (2004) Essential role of methionine residues in calmodulin binding to Bordetella pertussis adenylate cyclase, as probed by selective oxidation and repair by the peptide methionine sulfoxide reductases. J Biol Chem 279: 30210–30218 [DOI] [PubMed] [Google Scholar]
- Weeks CM, Miller R (1999) Optimizing Shake-and-Bake for proteins. Acta Crystallogr D 55: 492–500 [DOI] [PubMed] [Google Scholar]
- Yahr TL, Vallis AJ, Hancock MK, Barbieri JT, Frank DW (1998) ExoY, an adenylate cyclase secreted by the Pseudomonas aeruginosa type III system. Proc Natl Acad Sci USA 95: 13899–13904 [DOI] [PMC free article] [PubMed] [Google Scholar]
- Yamauchi E, Nakatsu T, Matsubara M, Kato H, Taniguchi H (2003) Crystal structure of a MARCKS peptide containing the calmodulin-binding domain in complex with Ca2+-calmodulin. Nat Struct Biol 10: 226–231 [DOI] [PubMed] [Google Scholar]
- Yap KL, Yuan T, Mal TK, Vogel HJ, Ikura M (2003) Structural basis for simultaneous binding of two carboxy-terminal peptides of plant glutamate decarboxylase to calmodulin. J Mol Biol 328: 193–204 [DOI] [PubMed] [Google Scholar]
Associated Data
This section collects any data citations, data availability statements, or supplementary materials included in this article.
Supplementary Materials
Supplemental Figure 1
Supplemental Figure 2
Supplemental Figure 3
Supplemental Figure 4
Supplemental Figure 5
Supplemental Figure 6
Supplemental Figure 7
Supplemental Table 1
Supplemental Table 2