

Abstract
Examination of nucleotide diversity in 106 mitochondrial genomes of the most geographically widespread human malaria parasite, Plasmodium vivax, revealed a level of diversity similar to, but slightly higher than, that seen in the virulent human malaria parasite Plasmodium falciparum. The pairwise distribution of nucleotide differences among mitochondrial genome sequences supported the hypothesis that both of these parasites underwent ancient population expansions. We estimated the age of the most recent common ancestor (MRCA) of the mitochondrial genomes of both P. vivax and P. falciparum at around 200,000–300,000 years ago. This is close to previous estimates of the time of the human mitochondrial MRCA and the origin of modern Homo sapiens, consistent with the hypothesis that both of these Plasmodium species were parasites of the hominid lineage before the origin of modern Homo sapiens and that their population expansion coincided with the population expansion of their host.
Partial or complete sequences of mitochondrial genomes have proved to be useful markers for population studies in a wide variety of organisms (Avise and Walker 1998; Jorde, Bamshad, and Rogers 1998; Saccone 1994). In the malaria parasites of the genus Plasmodium, the mitochondrial genome is particularly convenient for such studies, since it is only about 6 kb in length and includes only three protein-coding genes: cox3, cox1, and cytb (Wilson and Williamson 1997). In the virulent human malaria parasite P. falciparum, early studies reported a lack of synonymous polymorphism in a small sample of nuclear genes (Rich et al. 1998) and of polymorphism in introns in a small sample of nuclear genes Volkman et al. 2001), and on this basis it was hypothesized that the most recent common ancestor (MRCA) of P. falciparum was quite recent. However, analysis of more extensive data sets revealed abundant polymorphism at synonymous sites and in introns in nuclear genes and supported the hypothesis that P. falciparum has a large long-term effective population size and an ancient origin (Hughes and Verra 2001, 2002; Jongwutiwes et al. 2002; Mu et al. 2002). Likewise, early studies showed a relatively low level of polymorphism in complete mitochondrial genomes of P. falciparum (Conway et al. 2000), but a more extensive survey uncovered more extensive polymorphism (Joy et al. 2003).
Using a small number of complete mitochondrial genomes of P. falciparum, Hughes and Verra (2002) estimated the age of the most recent common ancestor (MRCA) of those genomes at 124,000–173,000 years ago. Based on a much larger data set, Joy and colleagues (2003) presented a somewhat more recent estimate (70,000–98,000 years ago) for the age of MRCA of P. falciparum mitochondrial genomes. However, the latter authors estimated the age of the MRCA incorrectly; what they computed was in fact the mean pairwise divergence time of mitochondrial genomes, which will always be considerably less than the age of the MRCA. Rather, the age of the MRCA of a set of allelic sequences should be estimated from the deepest branching point in their phylogeny. In addition, it is important to remember that, since the mitochondrial genome is inherited as a single gene, the mitochondrial MRCA is not the same as the MRCA of the population or species. Nonetheless, the mitochondrial MRCA represents a minimum estimate of the age of the species.
In comparison to P. falciparum, relatively little is known regarding the population genetics of P. vivax, the most geographically widespread of human malaria parasites. A recent analysis of single nucleotide polymorphisms in the nuclear genome suggested that polymorphism in P. vivax is similar to that in P. falciparum or slightly higher (Feng et al. 2003). In the case of P. falciparum, evolutionary studies have been aided by the availability of an isolate of the chimpanzee malaria parasite P. reichenowi. Since it can plausibly be assumed that the MRCA of P. falciparum and P. reichenowi occurred around the time that human and chimpanzee lineages diverged (5–7 million years ago), P. reichenowi provides a calibration point for estimating divergence times within P. falciparum (Escalante et al. 1998; Hughes and Verra 2001; Joy et al. 2003). Such a reference for calibration has so far been lacking for P. vivax.
A phylogenetic tree based on the mitochondrial cytb gene showed that P. vivax forms part of a monophyletic group of closely related species including the other human malaria parasites P. malariae and P. ovale, along with a number of monkey malaria parasites from Southeast Asia (Escalante et al. 1998). Relationships within this group were not well resolved (Escalante et al. 1998), but a more recent phylogenetic analysis based on the β-tubulin and CDC-2 genes placed P. vivax as a close relative of three Asian monkey malarias (Escalante et al. 2005). We sequenced the complete mitochondrial genome from 105 isolates of P. vivax from around the world, from single isolates of P. malariae, P. ovale, and the Southeast Asian monkey malaria P. knowlesi, and from reference strains of P. simium, P. fragile and P. knowlesi. By examining the pattern of nucleotide diversity among these genomes, we obtained evidence regarding the ancient demography of P. vivax. We applied phylogenetic analysis to these sequences in order to establish the closest relative of P. vivax among these species and in turn used this information to provide the first estimate of the age of the MRCA of the world population of P. vivax.
Materials and Methods
Malarial DNA Samples.
Blood samples were recruited from 105 P. vivax-infected individuals who acquired infections from 9 different countries including Thailand collected during 1996–2001 (n=39), Brasil during 1995–1999 (n=24), China in 1996 (n=12), Indonesia during 2002–2003 (n=11), Vietnam in 1996 (n=7), Bangladesh in 1994 (n=7), Solomon Islands in 1999–2002 (n=3), India in 1999 (n=1) and Papua New Guinea in 2001 (n=1). DNA was extracted from venous blood samples by using QIAamp kit (Qiagen, Germany) or finger-pricked blood spotted onto filter paper by the method described by others (Sakihama et al. 2001). These isolates had been previously analyzed for the presence of single infection with P. vivax by examination of Giemsa-stained thin and thick blood films and subsequently confirmed by species-specific nested polymerase chain reaction as described by others (Kawamoto et al. 2002). All isolates contained a single clone infection as determined by hybridization of the PCR-amplified merozoite surface protein-1 gene (PvMsp-1) from each isolate with allele-specific probes derived from variable blocks 2, 6 and 12 of PvMsp-1 (Putaporntip et al. 2002). DNA samples incorporated for comparison were as follows: clinical isolates with single species infection comprising P. ovale from Thailand, P. malariae from Indonesia and P. knowlesi from a Thai patient (Jongwutiwes et al. 2004); and reference strains comprising P. fragile type strain, P. simium Howler strain, P. knowlesi Malayan strain and P. vivax Salvador 1 strain (MRA-352, MRA-353, MRA-487 and MRA-552, MR4, ATCC Manassas Virginia).
Amplification and DNA Sequencing.
The complete mitochondrial DNA of P. vivax, P. ovale, P. malariae, P. fragile, P. simium and P. knowlesi was amplified using 2 pairs of primers, mt-F/mt-FR and mt-R/mt-RF, generating 2 overlapping fragments of 3.4 and 2.9 kb, respectively. The reaction mixture was in 30 μl containing malarial DNA, 2.5 mM MgCl2, 300 μM each dNTP, 3 μl of 10xLA PCR buffer, 0.3 μM of each primer and 1.25 units of LA TaqTM DNA polymerase (Takara, Japan). The thermal cycler profile contained a pre-amplification denaturation at 94°C for 1 min, 35 cycles of 96°C for 20 sec and 62°C for 5 min and a final extension at 72°C for 10 min (Sakihama et al. 2001). All amplification reactions were performed in Perkin-Elmer 2400 or 9600 thermal cycler (Perkin-Elmer, USA). The PCR-amplified products were purified by using a QIAamp PCR purification kit (Qiagen, Germany) and used as templates for sequencing. DNA sequencing was performed using the BigDyeTM Terminator V3.1 Cycle Sequencing kit on an ABI310 or ABI-Hitachi 3100 DNA sequencer (Applied Biosystems). Sequences were determined directly and from both directions using 23 sequencing primers (Table S1). Singletons and unique insertion/deletion of sequences were validated by sequencing of the PCR products from independent amplification reactions using the same genomic DNA as templates. Sequences have been deposited in the GenBankTM Database under the accession numbers AY598035-AY598143 and AY722797-AY722799.
Statistical Analyses.
In comparative analyses, we used 101 previously published mitochondrial genome sequences from P. falciparum (Genbank loci M76611, PFAMTCYTO, PFA276844 through −7, and AY82924 through −3019) and one from P. reichenowi (PRE251941). We did not include the highly divergent published P. falciparum sequence PFA298788, which may include sequencing errors. Note that most P. falciparum mitochondrial genome sequences are incomplete, with about 1267 base pairs missing from the largest noncoding region.
Sequences were aligned using the CLUSTAL W program (Thompson, Higgins, and Gibson 1994). In calculating evolutionary distances among a set of sequences, any site at which the alignment assumed a gap in any sequence was excluded from all pairwise comparisons. The number of nucleotide substitutions per site (d) in non-coding regions was estimated by the method of Jukes and Cantor (1969), by 2-parameter method, and by method. The Jukes-Cantor model is a simple model that assumes equal probability of each nucleotide change, while the Kimura 2-parameter model estimates separate rates for transitions and transversions, and the Tamura-Nei model incorporates nucleotide content bias. In coding regions, numbers of synonymous nucleotide substitutions per synonymous site (dS) and numbers of nonsynonymous nucleotide substitutions per nonsynonymous site (dN) were estimated by the Nei and Gojobori (1986) method and by method, which attempts to correct for the effects of transitional bias at two-fold degenerate sites.
All evolutionary distances were estimated using the MEGA2 computer program (Kumar et al. 2001); standard errors of pairwise distance estimates were estimated by the bootstrap method (Nei and Kumar 2000). Phylogenetic trees were reconstructed by the neighbor-joining method (Saitou and Nei 1987), and the reliability of clustering patterns in trees was assessed by bootstrapping (Felsenstein 1985). 1000 bootstrap replicates were used. The age of the MRCA was estimated by the linearized-tree method (Takezaki, Rzhetsky, and Nei 1985), applied to both non-coding regions and synonymous sites in codons.
In estimates of the age of the MRCA, we used the comparison of P. falciparum and P. reichenowi as a calibration. P. falciparum and P. reichenowi are sister taxa (Escalante and Ayala 1994), and the common ancestor of P. falciparum and P. reichenowi was assumed to have occurred at the same time as the common ancestor of human and chimpanzee. This assumption has been made in numerous previous studies and has yielded estimates of rates of nucleotide substitution similar to those for other eukaryotes (Escalante et al. 1998; Hughes and Verra 2001; Joy et al. 2003). We used two estimates (5 million years ago and 7 million years ago) for the time of the MRCA of human and chimpanzee. In order to test the molecular clock hypothesis, we used model-free relative rate test. We tested the equality of rates in P. falciparum and P. reichenowi using P. knowlesi and P. vivax as outgroups; similarly, we tested the equality of rates in P. knowlesi and P. vivax sequences using P. falciparum and P. reichenowi as outgroups. In all cases, the test failed to reject the hypothesis of a constant rate. All estimates of the age of the MRCA were based on the combined nucleotide divergence at non-coding sites and at synonymous sites in coding regions, corrected for multiple hits by the Jukes-Cantor model. The latter model was used because this simple model and more complex models yielded essentially identical results and because the simpler model is expected to have a lower variance of estimation (Nei and Kumar 2000).
The mismatch distribution (the distribution of the pairwise number of differences between sequences) was analyzed as an indicator of ancient population expansion as suggested by Rogers and Harpending (1992). The expected mismatch distribution under constant population size was estimated by the equation Fi ≈ θi / (θ+ 1)i +1 (Rogers and Harpending 1992), where Fi is the expected frequency of pairwise comparisons showing i differences, and θ is estimated by the observed mean of pairwise differences.
Results
The phylogenetic tree based on combined non-coding sequences from the mitochondrial genome (Figure 1) showed that all genomes from P. vivax were closely related to one another; no branches within the P. vivax cluster received strong bootstrap support. The single P. simium sequence in our data set fell within the P. vivax cluster (Figure 1), and the cluster containing P. vivax and P. simium received 100% bootstrap support (Figure 1). This result is consistent with the conclusion of Leclerc et al. (2004), based on microsatellite loci, that P. simium is indistinguishable from P. vivax. P. knowlesi clustered most closely with P. vivax and P. simium, and this pattern received 100% bootstrap support (Figure 1).
Figure 1.
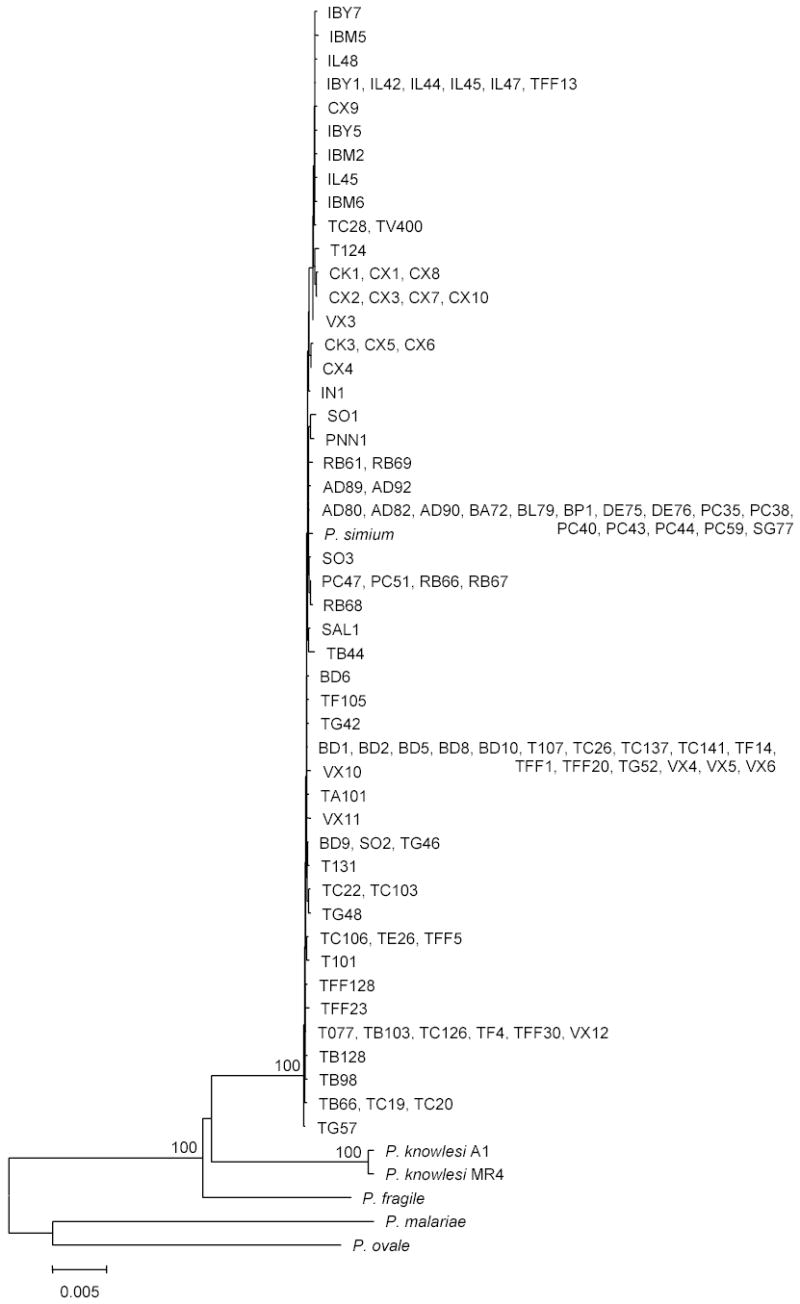
Neighbor-joining tree based on Kimura 2-prameter distance at 2617 aligned nucleotide sites in non-coding portions of the mitochondrial genome of Plasmodium vivax and related species. Numbers on the branches represent the percent of 1000 boostrap pseudo-samples supporting the branch; only values ≥ 95% are shown.
The mean number of pairwise nucleotide differences at 5986 aligned nucleotide sites among P. vivax mitochondrial genome sequences was 4.90 ± 1.10 S.E. (Figure 2A). The distribution of pairwise differences showed a pattern characteristic of a population expansion and was significantly different from that expected under constant population size (P < 0.001; Figure 2A). The mean number of pairwise nucleotide differences among P. falciparum mitochondrial genome sequences was 1.88 ± 0.68 at 4700 aligned nucleotide sites. As in P. vivax, the distribution of pairwise differences in P. falciparum indicated a population expansion and was significantly different from that expected under constant population size (P < 0.001; Figure 2B). The mean proportion of nucleotide differences per site in P. vivax (0.0008 ± 0.0002) was higher than that in P. falciparum (0.0004 ± 0.0001); but the difference was not statistically significant (z-test).
Figure 2.
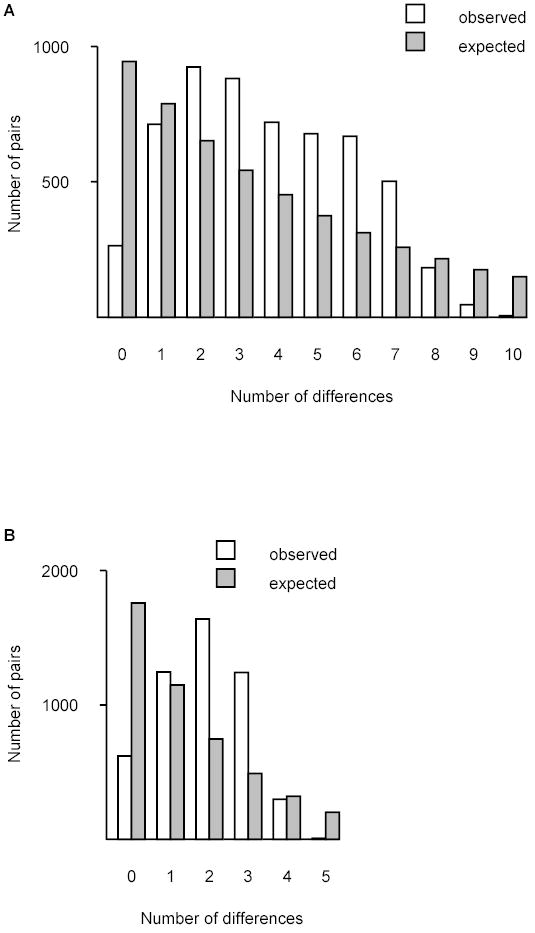
Mismatch distributions for mitochondrial genome sequences of (A) P. vivax and (B) P. falciparum. Observed distributions (clear bars) were compared with that expected under constant population size (shaded bars). In both species, the observed and expected patterns were significantly different. For P. vivax, χ2 = 2076.8, 10 d.f., P < 0.001; for P. falciparum, χ2 = 3129.3, 5 d.f., P < 0.001.
When we examined the numbers of nucleotide substitutions in pairwise comparisons among unique complete mitochondrial genome sequences in P. vivax and in P. falciparum, the patterns were broadly similar (Table 1). The Nei and Gojobori method and Li’s method yielded similar estimates of dS and dN (Table 1). As is expected in most genes because of purifying selection against deleterious nonsynonymous substitutions (Hughes 1999), dS exceeded dN in most comparisons (Table 1). The one exception was cox3 of P. vivax (Table 1), but in this case the difference between dS and dN was not significant (z-test).
Table 1.
Mean sequence distances (± S.E.) in different regions for all pairwise comparisons among unique Plasmodium vivax and P. falciparum mitochondrial genome sequences.
|
P. vivax (N = 48) |
P. falciparum (N = 28) |
|||||||
|---|---|---|---|---|---|---|---|---|
| G + C content (%)1 | Estimation method 2 | dS | dN | G + C content | Estimation method | dS | dN | |
| cox3 | 7.6 | NG | 0.00049 ± 0.00034 | 0.00102 ± 0.00071 | 10.7 | NG | 0.00208 ± 0.00090 | 0.00059 ± 0.00038 |
| Li | 0.00033 ± 0.00023 | 0.00118 ± 0.00088 | Li | 0.00243 ± 0.00057 | 0.00057 ± 0.000036 | |||
| cox1 | 9.0 | NG | 0.00404 ± 0.00166 | 0.00081 ± 0.00046 | 12.3 | NG | 0.00085 ± 0.00042 | 0.00013 ± 0.00009 |
| Li | 0.00465 ± 0.00186 | 0.00079 ± 0.00047 | Li | 0.00093 ± 0.00046 | 0.00013 ± 0.00009 | |||
| cytb | 10.7 | NG | 0.00064 ± 0.00045 | 0.00014 ± 0.00008 | 14.0 | NG | 0.00191 ± 0.00082 | 0.00000 ± 0.00000 |
| Li | 0.00076 ± 0.00053 | 0.00014 ± 0.00008 | Li | 0.00218 ± 0.00087 | 0.00000 ± 0.00000 | |||
| d | d | |||||||
| Non-coding | 37.2 | JC | 0.00057 ± 0.00023 | 37.7 | JC | 0.00040 ± 0.00018 | ||
| K2P | 0.00057 ± 0.00023 | K2P | 0.00040 ± 0.00018 | |||||
| TN | 0.00057 ± 0.00023 | TN | 0.00040 ± 0.00018 | |||||
G + C content was measured at third positions in coding regions and at all positions in non-coding regions
Methods used: NG = Nei and Gojobori (1986); Li = Li (1993); JC = Jukes and Cantor (1969); K2P = Kimura (1980) 2-parameter; TN = Tamura and Nei (1993).
Both P. vivax and P. falciparum showed a very biased nucleotide content at third positions of protein-coding genes (Table 1). In both species, the nucleotide content in non-coding regions was much less biased than at third positions in coding regions. Nonetheless, d in non-coding regions was roughly similar to dS in coding regions (Table 1). Thus, the differences in nucleotide content appeared not to have a major effect on estimation of these quantities. All three models yielded identical estimations for d in non-coding regions (Table 1).
The time of the MRCA was estimated for all P. vivax sequences; for the common ancestor of P. vivax and P. knowlesi; and for all P. falciparum sequences (Table 2). On the basis of the two estimates for the human-chimpanzee divergence, we obtained two separate estimates for the rate of nucleotide substitution (λ) (Table 2); these in turn were used to estimate the time of major branching points within the linearized trees. The sequence divergence between P. vivax and P. knowlesi was surprisingly similar to that between P. falciparum and P. reichenowi (Table 2). Thus, our estimates of the time of the MRCA of P. vivax and P. knowlesi were surprisingly close those for P. falciparum and P. reichenowi (Table 2). Similarly, the divergence at the deepest point in the P. vivax cluster was very similar to that at the deepest point in the P. falciparum cluster (Table 2). These estimates placed the mitochondrial ancestors of both of these parasites at around 200,000–300,000 years ago (Table 2).
Table 2.
Estimated times of the most recent common ancestor (MRCA) of Plasmodium mitochondrial genomes.
| Species | Sequence divergence1 (noncoding + synonymous) | MRCA time estimate |
|
|---|---|---|---|
| λ = 3.6 X 10⁻⁹ subs./site/yr. | λ = 2.6 X 10⁻⁹ subs./site/yr. | ||
| P. falciparum and P. reichenowi | 0.01800 ± 0.00232 | 5,000,0002 | 7,000,0001 |
| P. falciparum | 0.00074 ± 0.00047 | 206,000 | 288,000 |
| P. vivax and P. knowlesi | 0.01867 ± 0.00238 | 5,200,000 | 7,300,000 |
| P. vivax | 0.00078 ± 0.00048 | 217,000 | 304,000 |
Distance from the branch point to the present time in the linearized tree.
Calibration
Discussion
The sequence of 106 complete mitochondrial genomes from P. vivax revealed a level of nucleotide diversity comparable to that in P. falciparum. This is in agreement with the data of Feng et al. (2003), who showed extensive single-nucleotide polymorphism in the nuclear genome of P. vivax. P. vivax was found to be closely related to Asian monkey malarias, consistent with an origin in Asia. A phylogeny based on the nuclear-encoded β-tubulin and CDC-2 genes of 10 species of Plasmodium supported an Asian origin for P. vivax, whose closest relatives were three Asian monkey malarias (P. cynomolgi, P. fieldi, and P. simiovale) (Escalante et al. 2005). ). We estimated the age of the common ancestor of P. vivax and P. knowlesi at 5–7 Mya. This is somewhat earlier than previously discussed estimates for divergence times within the Southeast Asian clade of Plasmodium (Escalante et al. 1998; 2005). However, since the phylogeny of Escalante et al. (2005) shows the branching point of P. vivax and P. knowlesi to be the deepest in this clade, our estimate is consistent with Escalante et al.’s (2005) estimate, based on estimated radiation of their primate hosts, of 1.4–2.5 Mya for the divergence of the closely related species P. cynomolgi and P. inui.
We estimated the ages of the MRCA of mitochondrial genomes in P. vivax and P. falciparum, and the estimates were very similar, around 200,000–300,000 years ago. This age is similar to earlier estimates of the age of the MRCA of P. falciparum based on extensive sequence data from the nuclear genome (Hughes and Verra 2001, 2002; Mu et al. 2002). Moreover, this time is close to the time of the mitochondrial ancestor of modern humans (Nei 1992) and to fossil-based estimates time of origin of modern Homo sapiens in Africa (Stringer and Andrews 1988).
Leclerc et al. (2004) found limited polymorphism at microsatellite loci in P. vivax. The rate of mutation at microsatellite loci is on the order of 10−4 to 10−2 mutations per locus per generation (Lai and Sun 2003). Assuming that generation time in Plasmodium is not greater than one year (Hughes and Verra 2001), it is expected that these loci will become saturated with changes after about 100–10,000 years. Therefore, microsatellite data cannot shed light on the population history of P. vivax before about 10,000 years ago.
Using data from four nuclear-encoded loci, Escalante et al. (2005) recently provided somewhat more recent estimates of the age of the MRCA of P. vivax than those presented here. However, these authors, like Joy et al. (2003), mistakenly used the mean sequence divergence of all pairwise comparisons to estimate MRCA. As mentioned previously, the estimation of the age of the MRCA must be based not on the mean of all pairwise comparisons, but on the deepest branching point of the phylogeny. When the age of the MRCA was estimated for Escalante et al’s data by the linearized tree method based on dS, using the calibration times proposed by Escalante et al. (2005), the estimates (mean for all four loci) of the age of the MRCA were 206,000–314,000 years (A.L. Hughes, unpublished), in good agreement with the present study.
There is ample genetic evidence that a population bottleneck and subsequent ancient population expansion occurred in the origin of modern Homo sapiens (Harpending et al. 1998). It is not surprising that the human mitochondrial MRCA occurred around the same time as this bottleneck, since the probability of fixation of selectively neutral variants increases during a bottleneck (Nei, Maruyama, and Chakraborty 1975). Given that the mitochondrial MRCA of both P. vivax and P. falciparum appear to have occurred in the same period, it might be predicted that these species also underwent population expansion along with their host. This prediction was supported by the mismatch distribution of mitochondrial genome sequences in both species. A parasite bottleneck and subsequent expansion coinciding with those of the host would in turn imply that both P. falciparum and P. vivax were parasites of Homo before the origin of modern Homo sapiens.
In the case of P. falciparum, this hypothesis receives strong support from the fact that the sister species of P. falciparum is P. reichenowi, a chimpanzee parasite (Escalante and Ayala 1994). Thus, P. falciparum apparently represents a lineage that has been parasitic on the hominid lineage since its divergence from chimpanzee. By contrast, the closest relatives of P. vivax are parasites of Southeast Asian primates (Escalante et al. 1998; 2005), strongly suggesting that the origin of P. vivax was in Southeast Asia. However, an Asian origin for P. vivax is problematic because of the high frequency of null alleles for the Duffy blood group antigen (erythrocyte chemokine receptor) in Sub-Saharan African (Carter and Mendis 2002). Duffy negative erythrocytes are resistant to invasion by P. vivax, and the high frequency of the null allele in Africa suggests the result of natural selection over a long association with P. vivax.
This paradox is resolved if P. vivax became a parasite of hominids – presumably in Asia – long before the origin of modern Homo sapiens. By about 1 Mya, Homo erectus is known to have inhabited both Africa and a wide geographic area of southern Asia (Anton 2003). We hypothesize that P. vivax transferred from a monkey host to H. erectus in Southeast Asia sometime before 1 Mya and subsequently spread across southern Asia into Africa through the H. erectus population. This model assumes that P. vivax reached Africa by dispersal through a H. erectus population that was distributed nearly continuously across Africa and southern Asia. Consistent with this hypothesis is the evidence presented here that P. vivax underwent a bottleneck and subsequent expansion around the time of origin of modern Homo sapiens.
Supplementary Material
Acknowledgments
We are grateful to all patients who participated in this study; to MR4 for providing us with malaria parasites contributed by W.E. Collins. This study received financial support from a research grant for the 21st Century: Center of Excellence Program (No. COE17301-F1) from Ministry of Education, Culture, Sports, Science and Technology of Japan; The Hitachi Scholarship Foundation to S.J. and C.P.; and grant GM43940 from the National Institutes of Health to A.L.H.
References
- Anton SC. Natural history of Homo erectus Yearbook Phys. Anthropol. 2003;46:126–170. doi: 10.1002/ajpa.10399. [DOI] [PubMed] [Google Scholar]
- Avise JC, Walker D. Pleistocene phylogeographic effects on avian populations and the speciation process. Proc R Soc Lond B. 1998;265:457–463. doi: 10.1098/rspb.1998.0317. [DOI] [PMC free article] [PubMed] [Google Scholar]
- Carter R, Mendis KN. Evolutionary and historical aspects of the burden of malaria. Clin Microbiol Rev. 2002;15:564–594. doi: 10.1128/CMR.15.4.564-594.2002. [DOI] [PMC free article] [PubMed] [Google Scholar]
- Conway DJ, Fanello C, Lloyd JM, Al-Joubouri BM-AS, Baloch AH, Somanth SD, Roper C, Oduola AMJ, Mulder B, Povoa MM, Singh B, Thomas AW. Origin of Plasmodium falciparum malaria is traced by mitochondrial DNA. Mol Biochem Parasitol. 2000;111:163–171. doi: 10.1016/s0166-6851(00)00313-3. [DOI] [PubMed] [Google Scholar]
- Escalante AA, Ayala FJ. Phylogeny of the malarial genus Plasmodium derived from rRNA gene sequences. Proc Natl Acad Sci USA. 1994;91:11372–11377. doi: 10.1073/pnas.91.24.11373. [DOI] [PMC free article] [PubMed] [Google Scholar]
- Escalante AA, Freeland DE, Collins WE, Lal AA. The evolution of primate malaria parasites based on the gene encoding cytochrome b from the linear mitochondrial genome. Proc Natl Acad Sci USA. 1998;95:8124–8129. doi: 10.1073/pnas.95.14.8124. [DOI] [PMC free article] [PubMed] [Google Scholar]
- Escalante AA, Cornejo OE, Freeland DE, Poe AC, Durrego E, Collins WE, Lal AA. A monkey’s tale: the origin of Plasmodium vivax as a human malaria parasite. Proc Natl Acad Sci USA. 2005;102:1980–1985. doi: 10.1073/pnas.0409652102. [DOI] [PMC free article] [PubMed] [Google Scholar]
- Felsenstein J. Confidence limits on phylogenies: an approach using the bootstrap. Evolution. 1985;39:783–791. doi: 10.1111/j.1558-5646.1985.tb00420.x. [DOI] [PubMed] [Google Scholar]
- Feng X, Carlton JM, Joy DA, Mu J, Furuya T, Suh BB, Wang Y, Barnwell JW, Su X-Z. Single-nucleotide polymorphisms and genome diversity in Plasmodium vivax. Proc Natl Acad Sci USA. 2003;100:8502–8507. doi: 10.1073/pnas.1232502100. [DOI] [PMC free article] [PubMed] [Google Scholar]
- Harpending HC, Batzer MA, Gurven M, Jorde LB, Rogers AR, Sherry ST. Genetic traces of ancient demography. Proc Natl Acad Sci USA. 1998;95:1961–1967. doi: 10.1073/pnas.95.4.1961. [DOI] [PMC free article] [PubMed] [Google Scholar]
- Hughes AL. 1999. Adaptive Evolution of Genes and Genomes. Oxford University Press, New York.
- Hughes AL, Verra F. Very large long-term effective population size in the virulent human malaria parasite Plasmodium falciparum. Proc R Soc Lond B. 2001;268:1855–1860. doi: 10.1098/rspb.2001.1759. [DOI] [PMC free article] [PubMed] [Google Scholar]
- Hughes AL, Verra F. Extensive polymorphism and ancient origin of Plasmodium falciparum. Trends Parasitol. 2002;18:348–351. doi: 10.1016/s1471-4922(02)02290-0. [DOI] [PubMed] [Google Scholar]
- Jongwutiwes S, Putaporntip C, Friedman R, Hughes AL. The extent of nucleotide polymorphism is highly variable across a 3-kb region on Plasmodium falciparum chromosome 2. Mol Biol Evol. 2002;19:1585–1590. doi: 10.1093/oxfordjournals.molbev.a004220. [DOI] [PubMed] [Google Scholar]
- Jongwutiwes S, Putaporntip C, Iwasaki T, Sata T, Kanbara H. Naturally acquired Plasmodium knowlesi malaria in human, Thailand. Emerg Infect Dis. 2004;10:2211–2213. doi: 10.3201/eid1012.040293. [DOI] [PMC free article] [PubMed] [Google Scholar]
- Jorde LB, Bamshad M, Rogers AR. Using mitochondrial and nuclear DNA markers to reconstruct human evolution. Bioessays. 1998;20:126–136. doi: 10.1002/(SICI)1521-1878(199802)20:2<126::AID-BIES5>3.0.CO;2-R. [DOI] [PubMed] [Google Scholar]
- Joy DA, Feng X, Mu J, Furuya F, Chotivanich K, Krettli AU, Ho M, Wang A, White NJ, Suh E, Beerli P, Su X. Early origin and recent expansion of Plasmodium falciparum. Science. 2003;300:318–321. doi: 10.1126/science.1081449. [DOI] [PubMed] [Google Scholar]
- Jukes, T.H. and J.C. Cantor. 1969. Evolution of protein molecules. Pp. 21–132 in Munro, H.N. (ed.) Mammalian protein metabolism. Academic Press, New York.
- Kawamoto F, Win TT, Mizuno S, Lin K, Kyaw O, Tantulart S, Mason DP, Kimura M, Wongsrichanalai C. Unusual Plasmodium malariae-like parasites in southeast Asia. J Parasitol. 2002;88:350–357. doi: 10.1645/0022-3395(2002)088[0350:UPMLPI]2.0.CO;2. [DOI] [PubMed] [Google Scholar]
- Kimura M. A simple method for estimating evolutionary rate of base substitution through comparative studies of nucleotide sequences. J Mol Evol. 1980;16:111–120. doi: 10.1007/BF01731581. [DOI] [PubMed] [Google Scholar]
- Kumar S, Tamura K, Jakobsen B, Nei M, M MEGA2: molecular evolutionary genetics analysis software. Bioinformatics. 2001;17:1244–1245. doi: 10.1093/bioinformatics/17.12.1244. [DOI] [PubMed] [Google Scholar]
- Lai Y, Sun F. The relationship between microsatellite slippage mutation rate and the number of repeat units. Mol Biol Evol. 2003;20:2123–2131. doi: 10.1093/molbev/msg228. [DOI] [PubMed] [Google Scholar]
- Leclerc MC, Durand P, Gauthier C, Patot S, Billotte N, Menegon M, Severini C, Ayala FJ, Renaud F. Meager genetic variability of the human malaria agent Plasmodium vivax. Proc Natl Acad Sci USA. 2004;101:14455–14460. doi: 10.1073/pnas.0405186101. [DOI] [PMC free article] [PubMed] [Google Scholar]
- Li W-H. Unbiased estimates of the rates of synonymous and nonsynonymous substitution. J Mol Evol. 1993;36:96–99. doi: 10.1007/BF02407308. [DOI] [PubMed] [Google Scholar]
- Mu J, Duan J, Markova K, Joy D, Huynh CQ, Branch OH, Li W-H, Su X. Chromosome-wide SNPs reveal an ancient origin for Plasmodium falciparum. Nature. 2002;418:323–326. doi: 10.1038/nature00836. [DOI] [PubMed] [Google Scholar]
- Nei M. Age of the common ancestor of human mitochondrial DNA. Mol Biol Evol. 1992;9:1176–1178. doi: 10.1093/oxfordjournals.molbev.a040785. [DOI] [PubMed] [Google Scholar]
- Nei M, Gojobori T. Simple methods for estimating the number of synonymous and nonsynonymous nucleotide substitutions. Mol Biol Evol. 1986;3:418–426. doi: 10.1093/oxfordjournals.molbev.a040410. [DOI] [PubMed] [Google Scholar]
- Nei. M. and S. Kumar. 2000. Molecular Evolution and Phylogenetics. Oxford University Press, New York.
- Nei M, Maruyama T, Chakraborty R. The bottleneck effect and genetic variability in populations. Evolution. 1975;29:1–10. doi: 10.1111/j.1558-5646.1975.tb00807.x. [DOI] [PubMed] [Google Scholar]
- Putaporntip C, Jongwutiwes S, Sakihama N, Ferreira MU, Kho WG, Kaneko A, Kanbara H, Hattori T, Tanabe K. Mosaic organization and heterogeneity in frequency of allelic recombination of the Plasmodium vivax merozoite surface protein-1 locus. Proc Natl Acad Sci USA. 2002;99:16348–16353. doi: 10.1073/pnas.252348999. [DOI] [PMC free article] [PubMed] [Google Scholar]
- Rich SM, Licht MC, Hudson RR, Ayala FJ. Malaria’s Eve: evidence of a recent population bottleneck throughout the world population of Plasmodium falciparum. Proc Natl Acad Sci USA. 1998;95:4425–4430. doi: 10.1073/pnas.95.8.4425. [DOI] [PMC free article] [PubMed] [Google Scholar]
- Rogers AR, Harpending H. Population growth makes waves in the distribution of pairwise genetic differences. Mol Biol Evol. 1992;9:552–569. doi: 10.1093/oxfordjournals.molbev.a040727. [DOI] [PubMed] [Google Scholar]
- Saccone C. The evolution of mitochondrial DNA. Curr Opin Genet Dev. 1994;4:875–881. doi: 10.1016/0959-437x(94)90073-6. [DOI] [PubMed] [Google Scholar]
- Saitou N, Nei M. The neighbor-joining method: a new method for reconstructing phylogenetic trees. Mol Biol Evol. 1987;4:406–425. doi: 10.1093/oxfordjournals.molbev.a040454. [DOI] [PubMed] [Google Scholar]
- Sakihama N, Mitamura T, Kaneko A, Horii T, Tanabe K. Long PCR amplification of Plasmodium falciparum DNA extracted from filter paper blots. Exp Parasitol. 2001;97:50–54. doi: 10.1006/expr.2000.4591. [DOI] [PubMed] [Google Scholar]
- Stringer CB, Andrews P. Genetic and fossil evidence for the origin of modern humans. Science. 1988;239:1263–1268. doi: 10.1126/science.3125610. [DOI] [PubMed] [Google Scholar]
- Tajima F. Simple methods for testing molecular clock hypothesis. Genetics. 1993;135:599–607. doi: 10.1093/genetics/135.2.599. [DOI] [PMC free article] [PubMed] [Google Scholar]
- Takezaki N, Rzhetsky A, Nei M. Phylogenetic test of the molecular clock and linearized trees. Mol Biol Evol. 1995;12:823–833. doi: 10.1093/oxfordjournals.molbev.a040259. [DOI] [PubMed] [Google Scholar]
- Tamura K, Nei M. Estimation of the number of nucleotide substitutions in the control region of mitochondrial DNA in humans and chimpanzees. Mol. Biol. Evol. 1993;10:512–526. doi: 10.1093/oxfordjournals.molbev.a040023. [DOI] [PubMed] [Google Scholar]
- Thompson JD, Higgins DG, Gibson T. CLUSTALW: improving the sensitivity of progressive multiple sequence alignment through sequence weighting, position-specific gap penalties and weight matrix choice. Nucleic Acids Res. 1994;22:4673–4680. doi: 10.1093/nar/22.22.4673. [DOI] [PMC free article] [PubMed] [Google Scholar]
- Volkman SK, Barry AE, Lyons EJ, Nielsen KM, Thomas SM, Choi M, Thakore SS, Day KP, Wirth DF, Hartl DL. Recent origin of Plasmodium falciparum from a single progenitor. Science. 2001;293:482–484. doi: 10.1126/science.1059878. [DOI] [PubMed] [Google Scholar]
- Wilson RJM, Williamson DH. Extrachromosomal DNA in the Apicomplexa. Microbiol Mol Biol Reviews. 1997;61:1–16. doi: 10.1128/mmbr.61.1.1-16.1997. [DOI] [PMC free article] [PubMed] [Google Scholar]
Associated Data
This section collects any data citations, data availability statements, or supplementary materials included in this article.