Abstract
[α-15N]Lysine-labeled rhodopsin, prepared by expression of a synthetic gene in HEK293 cells, was investigated both by conventional and transverse relaxation optimized spectroscopy-type heteronuclear single quantum correlation spectroscopy. Whereas rhodopsin contains 11 lysines, 8 in cytoplasmic loops and 1 each in the C-terminal peptide sequence and the intradiscal and transmembrane domains, only a single sharp peak was observed in dodecyl maltoside micelles. This result did not change when dodecyl maltoside was replaced by octyl glucoside or octyl glucoside–phospholipid-mixed micelles. Additional signals of much lower and variable intensity appeared at temperatures above 20°C and under denaturing conditions. Application of the transverse relaxation optimized spectroscopy sequence resulted in sharpening of resonances but also losses of signal intensity. The single peak observed has been assigned to the C-terminal Lys-339 from the following lines of evidence. First, the signal is observed in HNCO spectra of rhodopsin, containing the labeled [13C]Ser-338/[15N]Lys-339 dipeptide. Second, addition of a monoclonal anti-rhodopsin antibody that binds to the C-terminal 8 aa of rhodopsin caused disappearance of the peak. Third, truncated rhodopsin lacking the C-terminal sequence Asp-330–Ala-348 showed no signal, whereas the enzymatically produced peptide fragment containing the above sequence showed the single peak. The results indicate motion in the backbone amide groups of rhodopsin at time scales depending on their location in the sequence. At the C terminus, conformational averaging occurs at the nanosecond time scale but varies from microsecond to millisecond in other parts of the primary sequence. The motions reflecting conformational exchange may be general for membrane proteins containing transmembrane helical bundles.
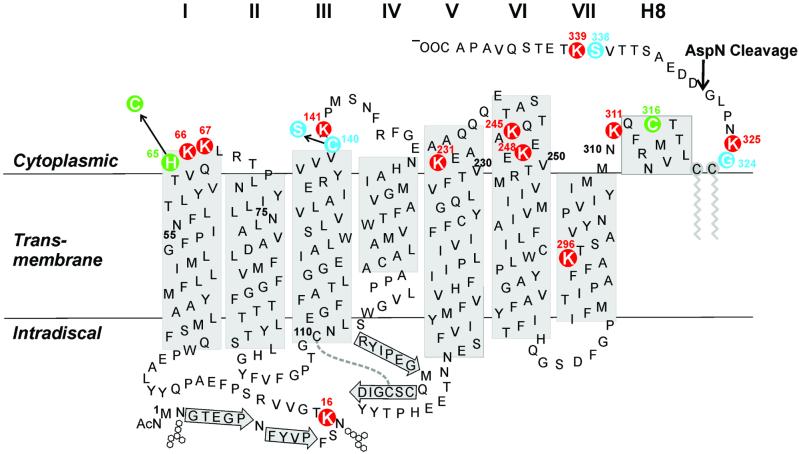
The mammalian photoreceptor rhodopsin is a prototypic member of the superfamily of cell-surface G protein-coupled receptors and, characteristically, contains three domains: the cytoplasmic (CP), the transmembrane (TM), and the intradiscal domains (Fig. 1). 11-cis-Retinal, the inverse agonist, binds in a pocket in the TM domain and is linked to Lys-296 in helix VII via a protonated Schiff base. Light activation causes isomerization of the retinal to the all-trans form leading to helix movements in the TM domain, which bring about a conformational change in the CP domain. Protein–protein interactions required for sensitization and desensitization in the visual system are thus initiated. Precise molecular descriptions of the conformational change in rhodopsin and of its subsequent interactions with proteins are the long range goals of studies on signal transduction in this system.
Figure 1.
A secondary structure model of bovine rhodopsin showing positions of the 11 lysine residues, highlighted in black circles. The model is predominantly based on the crystal structure (2). Transmembrane helices are designated I to VII. The helix in the CP domain, which was observed in the crystal structure, is designated H8. The lengths of helices V and VI are based on EPR studies (27). Beta sheet structure is indicated by arrows. The conserved disulfide bond in the intradiscal domain is shown as a dotted line. Palmitoylation of Cys-322, Cys-323 is shown in gray. The cleavage site for the enzyme AspN is indicated by an arrow. The 11 lysines in rhodopsin are highlighted as red circles. Glycine or serine residues preceding lysines are indicated in blue. In the mutant with disulfide cross link in the CP domain, His-65 was replaced by cysteine, and Cys-140 was replaced by serine. A disulfide bond was formed between Cys-65 and Cys-316, indicated in green.
An important recent advance has been the determination of the three-dimensional x-ray structure of rhodopsin in the dark state (2). Hopefully, structures of the light-activated state and of protein complexes with activated rhodopsin will be forthcoming. For solution structures of proteins and their dynamics, NMR has proved to be a powerful approach in recent years. The technique has proved particularly useful in studies of water-soluble proteins. Although membrane proteins have to be studied as micelles in detergents or detergent–phospholipid mixtures that increase the effective size of the proteins, increasing applications of NMR spectroscopy are being made to hydrophobic polypeptides and proteins (3–5). The recent implementation of transverse relaxation optimized spectroscopy (TROSY) has potentially increased the scope of NMR spectroscopy to membrane proteins by extending the molecular mass size to the range of 100 kDa (6).
Recently, encouraging results on application of NMR spectroscopy to the study of rhodopsin in micelles have been reported (7–9). These studies were made possible by the development of methods for the large-scale expression of isotopically labeled rhodopsin and of rhodopsin mutants. MAS NMR was applied to the study of [15N]lysine-labeled rhodopsin (8). Solution NMR was applied successfully to obtain high resolution 19F NMR spectra of 19F-labeled cytoplasmic rhodopsin mutants in detergent micelles (7), and nuclear Overhauser effects could be observed between 19F labels in the CP domain of rhodopsin (9). Here, we report on a study of [α-15N]lysine-labeled rhodopsin by high-resolution heteronuclear NMR spectroscopy.** Rhodopsin contains 11 lysine residues, 1 lysine in the TM domain, Lys-296, the attachment site of 11-cis retinal, 1 lysine in the intradiscal domain, and 9 lysines in the CP domain (Fig. 1). In theory, assuming a single conformation for rhodopsin in the dark, 11 signals corresponding to the 11 backbone hydrogens attached to α-15N atoms should be expected. However, HSQC spectra of [α-15N]lysine-rhodopsin at 4°C showed a single strong resonance. At temperatures higher than 20°C or in the presence of SDS, additional signals were observed, with small and variable intensity. The single sharp peak has been assigned to Lys-339 near the C terminus. These results indicate the presence of motion, presumably on the microsecond to millisecond time scale in the polypeptide backbone, depending on location in the amino acid sequence. These motions reflecting conformational exchange may be general for proteins forming transmembrane helical bundles.
Materials and Methods
11-cis-Retinal was prepared from all-trans-retinal by using a published procedure (10). Dodecyl maltoside (DM) and octyl glucoside (OG) were purchased from Anatrace (Maumee, OH), and dimyristoyl-phosphatidyl choline (DMPC) was from Avanti Polar Lipids. [α-15N]lysine and [1-13C]glycine were from Cambridge Isotope Laboratories (Cambridge, MA). Anti-rhodopsin monoclonal antibody 1D4 (11) was purified from a myeloma cell line provided by R. S. Molday (University of British Columbia). It was coupled to cyanogen bromide-activated Sepharose 4B (Sigma) as described (12), at a level of ≈10 mg/ml of swollen Sepharose beads. The nonapeptide corresponding to the C-terminal sequence of rhodopsin, the antibody epitope, was prepared by Massachusetts Institute of Technology Biopolymers Laboratory. The sources of all reagents for cell culture have been described (13, 14) with the exception of the cell growth medium (see below).
Buffers used were as follows: buffer A, 137 mM NaCl/2.7 mM KCl/1.8 mM KH2PO4/10 mM Na2HPO4, pH 7.2; buffer B, buffer A plus 1% DM; buffer C, buffer A plus 4% OG; buffer D, 2 mM NaH2PO4/Na2HPO4, pH 6; buffer E, buffer D plus 0.05% DM; buffer F, buffer D plus 1.44% OG; buffer G, 20 mM NaH2PO4/Na2HPO4, pH 6, in 5% D2O (Cambridge Isotope Laboratories); buffer H, 20 mM Tris, pH 8; buffer I, 50 mM Tris, pH 7.2/125 mM NaCl.
UV-Visible Absorption and Fluorescence Spectroscopy.
UV-visible absorption spectra were recorded by using a Perkin–Elmer spectrophotometer (15). The molar extinction value used for rhodopsin was 42,700 M−1·cm−1 (16). Illumination of rhodopsin samples to form Meta II was carried out using >495 nm of light for 10 s.
NMR Spectroscopy.
NMR spectra were obtained at a spectrometer 1H frequency of ≈800 MHz by using a Bruker spectrometer. Data were acquired and analyzed using Bruker UXNMR version 2.1 software. NMR spectra were also obtained at a spectrometer frequency of ≈750 MHz (Varian) at the MIT Francis Bitter Magnet Laboratory. Data acquisition and analysis was then carried out using VNMR version 6.1 software. Different pulse sequences were used as indicated in the text. Data processing and analysis was carried out using FELIX version 98.0.
Preparation of HEK293S Cell Lines Containing the Opsin Genes for Wild-Type and Mutant H65C/C140S.
The preparation of HEK293S stable cell lines containing the opsin gene for wild-type and for mutant H65C/C140S was described previously (refs. 13 and 9, respectively).
Expression of [α-15N]Lysine-Labeled Rhodopsin in HEK293S Cell Lines.
High level expression of the rhodopsin gene was in HEK293 cells as described (13), modified as in ref. 14 following additional modifications. The composition of the media were as in DMEM formulation. However, instead of dissolving the mixture as in refs. 8 and 13, the media were prepared from individual components. Thus, all solutions were prepared as 100× concentrated stock solutions, except glucose, NaCl, glutamine, and [α-15N]lysine, which were added as solids. Furthermore, the glutamine concentration was lowered by one-half. The same amount was then added on day 5 or 6, together with 6 ml of 20% (wt/vol) glucose and 4 ml of 8% (wt/vol) NaHCO3 containing 5 mM sodium butyrate as described (14). Unlabeled amino acids from FBS were removed by dialysis three times against 10 liters of buffer A at 4°C with a dialysis tubing cutoff of 1 kDa as described (8). All further manipulations were as described (14).
Expression of Mutant H65C/C140S in the Presence of [α-15N]Lysine and 1-13C-Glycine in HEK293S Cell Lines.
Mutant H65C/C140S was expressed in HEK293 cells as above, except that both [α-15N]lysine and [1-13C]glycine were added as solids to the medium lacking natural abundance lysine and glycine. This also results in 13C labeling of serines at their carbonyl carbon position because of scrambling of [1-13C]glycine during metabolism (see Results).
Immunoaffinity Purification of [15N]Lysine-Labeled Rhodopsin.
The HEK293S cells were harvested by centrifugation and solubilized in buffer B or C for purification in DM or OG, respectively. After centrifugation, the supernatant layer was added to 1D4-Sepharose beads, the total suspension was packed into a column, and the beads were washed as described (7). Rhodopsin was eluted from 1D4-Sepharose by using buffer E or buffer F containing the nonapeptide epitope as described (7).
Preparation of Samples for NMR Spectroscopy.
Samples obtained after elution from 1D4 Sepharose were concentrated as described (7). The procedure results in increase of the DM concentration from the initial 0.05% in the labeled rhodopsin eluate to 4–7%, whereas the concentration of OG remains 1.44%. The buffer was exchanged to buffer G as described (7). DMPC was added to a sample in OG from a suspension of 20% DMPC in buffer F. SDS was added to a sample in OG from a 10% stock solution to a final concentration of 5%.
Preparation of Disulfide-Bonded Mutant H65C/C140S.
The disulfide bond between cysteines at positions 65 and 316 in the mutant was formed by air oxidation as described (15).
Cleavage of [α-15N]Lysine-Labeled Rhodopsin by the Protease AspN to Form Truncated Rhodopsin and C-Terminal Peptide 330–348.
A sample of [α-15N]Lys-labeled rhodopsin was digested with AspN as follows. AspN (4 μg) dissolved in 25 μl of buffer H was added to the solution of 10.8 mg of rhodopsin in 100 μl of 10% DM detergent micelles in buffer G. To the mixture was added 900 μl of buffer I, and the total mixture was mixed end-over-end for 8 h at room temperature. It was then loaded onto a 48-cm × 1-cm G50–80 size exclusion column, preequilibrated with buffer E. The flow rate was ≈0.05 ml/min. Fractions were collected in ≈0.3–0.4-ml aliquots and analyzed by absorbance spectroscopy.
Measurement of Protein Light Scattering.
Light-scattering experiments were performed on a Protein Solutions microsampler LSR instrument. Irradiation was at 783 nm or 824 nm. Acquisition time was 1–5 s. Before analysis, samples were centrifuged at 60,000 rpm in a Beckman ultracentrifuge for 45–90 min to remove dust particles. Light-scattering data were acquired and analyzed using the Dynamics software (Protein Solutions, Charlottesville, VA).
Results
Micellar Size of Rhodopsin in Detergents.
The radii of rhodopsin-DM micelles and rhodopsin-OG micelles used in NMR experiments were determined by dynamic light scattering. The experiments were performed on samples after recording NMR spectra and after centrifugation to remove dust particles (see Materials and Methods). Trace amounts of material with strong scattering were present in the solutions that could not be removed by passage through a 100-nm filter. The apparent diameter of the DM micelles without rhodopsin at 0.012, 0.1, and 10% were 3.0, 3.1, and 3.4 nm, respectively. The apparent diameter of the OG micelles without rhodopsin at 1, 10, and 20% were 2.2, 4.2, and 4.8 nm, respectively. The apparent diameter for rhodopsin (0.85 mM) in 10% DM was 4–6 nm. This size range is amenable to NMR studies (17).
One-Dimensional Conventional and TROSY-Type HSQC Spectroscopy of [α-15N]Lysine-Labeled Rhodopsin Shows a Single Sharp Peak.
DM as the detergent.
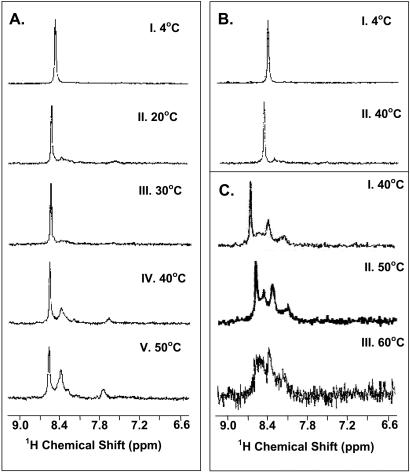
One-dimensional HSQC spectra of [α-15N]lysine-labeled rhodopsin [0.7 mM in 5% (102 mM) DM at 800 MHz] are shown in Fig. 2A. A single sharp peak was observed at ≈8.4 ppm at 4°C (panel I). The same sharp peak was obtained at a higher concentration (1.5 mM) of rhodopsin in 10% DM, the molar ratio of rhodopsin to DM being similar to that in the experiment shown in panel I. Elevation of the DM concentration to 50% caused disappearance of the signal, presumably because of the high viscosity of the solution.
Figure 2.
One-dimensional HSQC spectra of [α-15N]Lys WT rhodopsin at 800 MHz. (A) Conventional HSQC Spectra of rhodopsin in DM at different temperatures. The sample concentration was 0.7 mM, in ≈5% DM (102 mM). Thus, DM was present at 146 molecules per molecule of rhodopsin. Panels I–V, at temperatures 4°C, 20°C, 30°C, 40°C, and 50°C, respectively. (B) TROSY-HSQC spectra in DM at different temperatures. Panels I and II, at temperatures 4°C and 40°C, respectively. (C) Conventional HSQC spectra in 1.5% OG containing 5% SDS at different temperatures. Panels I–III show spectra recorded at temperatures 40°C, 50°C, and 60°C, respectively.
OG as the detergent.
[α-15N]Lys-rhodopsin (22 mg, 2.1 mM) in 25 μl of OG (1.5%, ≈50 mM) was studied at 4°C and 20°C. The spectra observed were indistinguishable from those in Fig. 2A, panels I and II.
OG containing the phospholipid DMPC.
DMPC was added to the OG solution of rhodopsin at molar ratios, OG to DMPC of 1:0.05 to 1:2.5. The spectra again showed the single peak in panel I of Fig. 2A.
Effect of temperature.
Conventional HSQC spectra at temperatures 20°C, 30°C, 40°C, and 50°C are shown in Fig. 2A, panels II–V, respectively. Additional peaks were observed especially at 40°C and 50°C.
TROSY sequence spectra.
Application of this sequence did not reveal any additional resonances. The spectra at 4°C and 40°C, similar to those in Fig. 2A, are shown in Fig. 2B, panels I and II.
Effect of denaturing conditions on the spectra.
SDS (5% final concentration) was added to [α-15N]Lys-rhodopsin (7 mg; 0.67 mM) in OG (1.5%, ≈50 mM). The spectra observed at 40°C, 50°C, and 60°C are shown in Fig. 2C, panels I–III, respectively. Thus, additional peaks were observed. The signal to noise ratio decreased with higher temperatures, possibly because of progressive aggregation of the sample.
Two-Dimensional HSQC Spectra of [α-15N]Lysine Rhodopsin Indicate Exchange Broadening.
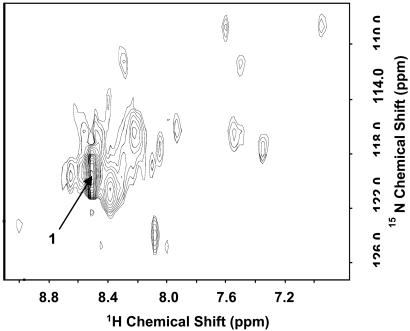
The shapes of the additional signals seen in one-dimensional HSQC spectra of [α-15N]lysine rhodopsin (Fig. 2A) at temperatures above 4°C suggested possible multiple underlying signals. In an attempt to resolve such signals, a two-dimensional spectrum was acquired at 750 MHz. The result is shown in Fig. 3. Thus, a large number of partially resolved signals in addition to signal 1 (see arrow in Fig. 3), the main peak in Fig. 2, were detected. Their intensities were one-tenth or less compared with signal 1. The number and intensity of the signals were strongly temperature-dependent, and a total of more than 11 signals expected for all of the lysines was observed. The result indicated exchange broadening.
Figure 3.
Two-dimensional HSQC spectrum of [α-15N]Lys WT rhodopsin in DM at 750 MHz at 37°C.
Two-Dimensional HSQC Spectra of an [α-15N]Lysine-Rhodopsin Mutant Containing a Disulfide Crosslink Between Cys-65 and Cys-316.
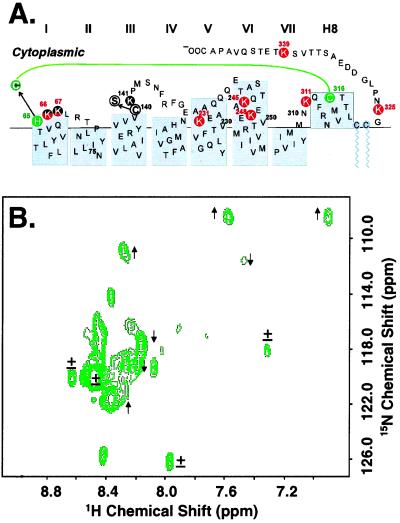
In an attempt to suppress exchange broadening, a conformational constraint was introduced in the CP domain by using the previously described Cys-65–Cys-316 disulfide crosslinked mutant of rhodopsin (Fig. 4A). The HSQC spectrum of the crosslinked [α-15N]lysine rhodopsin mutant is shown in Fig. 4B. The two-dimensional spectrum was very similar to that of [α-15N]lysine-rhodopsin shown in Fig. 3. Line-width analysis of selected resolved signals, however, indicated subtle differences between the spectrum of the wild type (WT) and that of the mutant with disulfide cross link. Whereas signal 1 and several other signals (indicated by ± in Fig. 4B) had similar line widths (26–28 Hz), some signals increased and some decreased in line widths in the mutant (Fig. 4B). These differences in line widths of the signals support the conclusion of exchange broadening.
Figure 4.
(A) Secondary structure of the CP portion of a bovine rhodopsin mutant with a disulfide cross link between Cys-65 and Cys-316 (green). The mutant contains the engineered H65C and C140S mutations. (B) Two-dimensional HSQC spectrum of [α-15N]Lys-rhodopsin mutant shown in A. The spectrum was recorded at 750 MHz at 37°C. Indicated by arrows are signals that show increase (↑) or decrease (↓) in line width when compared with the WT (Fig. 3); ± indicates no change.
The Single Signal in [α-15N]Lys-Rhodopsin Originates from Lys-339 in the C-Terminal Peptide Sequence.
The signal 1 is observed in HNCO spectra of [13C]Ser-338–[15N]Lys-339, [13C]Gly-324–[15N]Lys-325, and [13C]Ser-140–[15N]Lys-141 double-labeled rhodopsin.
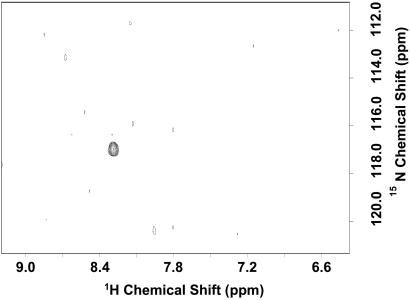
A standard method of signal assignment in large proteins employs a CN double-labeling strategy. The strategy combines 13C labeling of an amino acid at its carbonyl carbon position with 15N labeling of the amino acid at the α-position of the 13C-labeled amino acid. HNCO spectroscopy correlates protons attached to 15N if the latter is covalently attached to 13C. Thus, a cross peak is generated for any 13C-labeled amino acid that is immediately followed in the sequence by a 15N-labeled amino acid. The rhodopsin mutant H65C/C140C was expressed in the presence of [α-15N]lysine and [1-13C]glycine. Scrambling of the label in glycine would also lead to serines being 13C labeled. The use of the H65C/C140S mutant in this experiment would give three relevant dipeptide sequences, Ser-338–Lys-339, Gly-324–Lys-325, and Ser-140–Lys-141, as opposed to the WT, which contains only two. Fig. 1 highlights the three dipeptide sequences in rhodopsin. The HNCO spectrum shown in Fig. 5 gave a single cross peak. This corresponded to the position of Lys-339. The result also showed that although scrambling of label during amino acid metabolism was efficient, no additional cross peaks were detectable.
Figure 5.
HNCO spectrum of the [α-15N]Lys, [13C]Gly (Ser) double-labeled rhodopsin mutant carrying H65C/C140S mutations (Fig. 1).
Addition of anti-rhodopsin antibody-1D4 to [α-15N]lysine-rhodopsin causes disappearance of the signal in the spectrum.
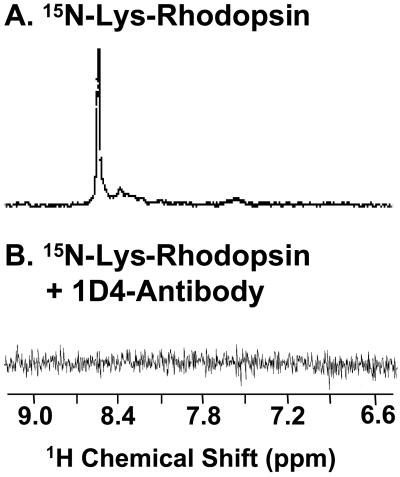
Lys-339 is located close to the C terminus of rhodopsin (Fig. 1). The last eight amino acids in the C terminus are also the binding site for the monoclonal anti-rhodopsin antibody 1D4. Therefore, addition of the antibody to the labeled rhodopsin may be expected to affect the signal if it originated from Lys-339. As seen in the spectra shown in Fig. 6, the presence of the antibody caused complete disappearance of the signal.
Figure 6.
Spectra of [α-15N]Lys-rhodopsin in the absence (A) and presence (B) of anti-rhodopsin antibody 1D4. Antibody 1D4 (50 mg) was added to a sample of 7 mg of rhodopsin in OG.
The C-terminal peptide Asp-330–Ala-348 containing [15N]Lys-339 alone shows signal 1 in the two-dimensional NMR spectrum.
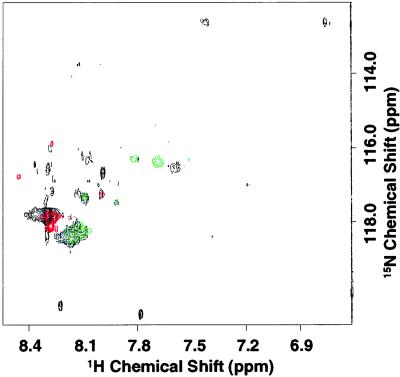
Truncated [15N]Lys-rhodopsin obtained after cleavage of the protein by the enzyme AspN (Fig. 1) contains 10 15N-labeled lysines, whereas the C-terminal peptide Asp-330–Ala-348 (see Materials and Methods) contains only the lysine at position 339. The spectra of the truncated rhodopsin and the peptide are overlaid on to the spectrum of holo-rhodopsin in Fig. 7. Signal 1 was absent in the spectrum of the truncated rhodopsin, whereas it was present in the spectrum of the C-terminal peptide. Not all resonances that were observed in addition to signal 1 in the holo-protein were reproduced in the spectrum of the truncated rhodopsin. Further, the peptide showed several signals with smaller intensity besides signal 1. The reason for this observation requires further investigation, but it does not affect assignment of signal 1 to Lys-339.
Figure 7.
Conventional HSQC spectra at 37°C of [α-15N]Lys-rhodopsin, truncated rhodopsin after AspN digestion, and the peptide Asp-330–Ala-348. Holo-protein (black), the peptide (red), and the truncated rhodopsin (green) are shown.
Discussion
Initial promising results for the application of NMR methods to the study of rhodopsin structure have been reported recently. Solid state NMR using [ɛ-15N]lysine-labeled rhodopsin gave definitive information on the structure of the electrostatic bond between protonated Schiff base at Lys-296 and the Glu-113 counterion (8, 18). Further, 19F-solution NMR spectra of a series of rhodopsin cysteine mutants with 19F labels placed along the CP face in DM, OG, and OG/DMPC mixed micelles showed distinct chemical shifts (7), and 19F-NOE were observed between two 19F labels in the cytoplasmic face (9). These results encouraged the hope that the use of heteronuclei such as 15N and 13C placed in the peptide backbone sequences of rhodopsin may yield insightful results, especially because of the recent advance in the use of the TROSY sequence, which has significantly extended the size limit for the study of water-soluble proteins (17). Further, examples of application of NMR spectroscopy to the study of membrane proteins, i.e., OmpX and OmpA in short chain phospholipid micelles, have also been reported (19, 20).
Here, we have reported on the first solution NMR study of rhodopsin labeled with [α-15N]lysine (Fig. 1). Despite the presence of 11 cysteines in rhodopsin, a single sharp signal (signal 1) was obtained under a variety of conditions described in Results. Unequivocal assignment of this resonance to Lys-339 in the C-terminal rhodopsin sequence has been made from the following three lines of evidence. In the first strategy, rhodopsin carrying labels in [α-15N]lysine and [13C]glycine was prepared. Metabolic scrambling of the 13C label resulted in efficient labeling of serine residues as well. Three Gly-Lys or Ser-Lys peptide bonds are present in rhodopsin, [13C]Ser-338–[15N]Lys-339, [13C]Gly-324–[15N]Lys-325, and [13C]Ser-140–[15N]Lys-141. HNCO spectra correlated a [13C]carbonyl resonance to signal 1, and the result restricted the signal to Lys-339, Lys-325, or Lys-141. Of these three lysines, assignment of the signal to Lys-339 was made unambiguously from the following two experiments. First, addition of the monoclonal anti-rhodopsin antibody 1D4 with epitope at the C terminus caused disappearance of the peak. Second, signal 1 was present in HSQC spectra of the peptide 330–348 formed from rhodopsin after enzymatic cleavage at Gly-329, and not in the resulting truncated rhodopsin. The unusually sharp line width of the signal and the 1H chemical shift of ≈3.8 ppm demonstrated large mobility of the C-terminal peptide sequence of rhodopsin. This result is in agreement with previous evidence. Spin labels attached to engineered cysteine residues in the C-terminal sequence exhibit EPR spectra with mobility similar to that of free spin labels in solution (21). Further, the amino acids in the C terminus in rhodopsin are hardly visible in the available x-ray diffraction data and have very high B factors (2).
In addition to the predominant signal 1, a number of further resonances were observed at temperatures above 20°C. However, both in conventional and TROSY-type 1H–15N HSQC spectra of the [α-15N]Lys backbone-labeled rhodopsin, these resonances showed marked variation in intensity. 1H–15N HSQC spectra of 15N-labeled rhodopsin in which motions in the CP domain were restricted by formation of the Cys-65–Cys-316 disulfide cross link only showed alterations in the line widths of some of the signals (Fig. 4). The weakness of the signals corresponding to the majority of the lysines present in the wild-type protein does not seem to be due to the large size of the rhodopsin-detergent micelles. Light scattering indicated the micellar size to be in the range of 100–120 kDa, which should be amenable to NMR analysis, in particular for one- and two-dimensional conventional HSQC spectroscopy. We conclude that the low intensity of the majority of signals, even in conventional HSQC spectra, is because of exchange broadening. In line with this conclusion, we saw no gain in sensitivity by using the TROSY scheme; in fact some of the resonances were lost beyond the detection limit. This observation is as expected for a system with exchange contributions to the T2 relaxation. The lack of TROSY enhancement could also be due, in principle, to lack of perdeuteration of our samples. Perdeuteration can significantly enhance the quality of TROSY spectra of high molecular weight proteins (22), and it would have been desirable to use perdeuterated samples of rhodopsin in the present work. However, this is not feasible at this time using our mammalian expression system.
The weakness of the signals corresponding to the majority of the lysines cannot be due to misfolding or unfolding of rhodopsin. The rhodopsin-DM mixed micelle system has proved to be the best for stabilizing the three-dimensional fold in all of the extended structure–function studies carried out to date. The best operational criterion for rhodopsin correctly folded with 11-cis-retinal is the A280 to A500 ratio around 1.6 (23). In the present work, aliquots of the NMR samples taken after recording the spectra were analyzed by UV/Vis absorbance spectroscopy. The A280/A500 ratio was preserved throughout, showing that the correctly folded structure of rhodopsin was intact. Furthermore, we performed an unfolding experiment, the result of which is shown in Fig. 2C, using [15N]lysine-labeled rhodopsin in OG micelles (DM micelles cannot be used because the high concentration would require addition of very large concentrations of SDS). OG-rhodopsin mixed micelles analyzed by NMR spectroscopy gave results identical to those obtained with DM-rhodopsin mixed micelles, namely only one signal being observed. However, upon addition of SDS and raising the temperature to unfold the protein, additional signals appeared. These signals showed sharper line widths than were observed at the same temperature in DM without SDS (Fig. 2). This result indicates that the unfolding of rhodopsin causes increased flexibility of [15N]lysine backbone groups, shifting the time regime of conformational averaging from the microsecond–millisecond time scale to nanosecond time scales.
The conformational exchange invoked to explain our results may have generality in multihelical transmembrane proteins. Whereas clean signals with comparable intensity were reported in HSQC spectra of the membrane proteins OmpA and OmpX proteins, evidence for microsecond–millisecond exchanges was observed for OmpA in short chain phospholipid micelles. However, it should be noted that both of the above membrane proteins have predominantly β-sheet structure. NMR structures of helical membrane proteins have so far been determined for molecules with small molecular weight containing only one or two TM helices (e.g., ref. 5). In contrast, NMR studies of bacteriorhodopsin, a 7-TM helical protein, and diacylglycerol kinase containing multiple helices, showed line broadening that varied with amino acid position in the sequence of the proteins, suggesting conformational exchange on the intermediate NMR time scale (24–26). Conformational exchanges in bacteriorhodopsin, a 7-TM helical protein, which also undergoes light-induced conformational changes, and in rhodopsin, may be required to allow functional conformational changes to occur.
In summary, we have reported an investigation of [α-15N]lysine-labeled rhodopsin in detergent micelles by both conventional and TROSY-type high resolution NMR experiments. A single predominant signal was observed in all spectra and was assigned to Lys-339 at the mobile C terminus. However, we failed to obtain well resolved signals corresponding to the other individual lysines in rhodopsin, and we ascribe this result to microsecond–millisecond time scale motions in the rhodopsin backbone. These results may restrict NMR application to multihelix transmembrane proteins and receptors in general.
Acknowledgments
We thank Professor U. L. RajBhandary (Biology, Massachusetts Institute of Technology) for valuable discussions. Enthusiastic assistance of Ms. Judy Carlin in the preparation of the manuscript is acknowledged. This work was supported by National Institutes of Health Grant GM28289 (to H.G.K.) and a Howard Hughes Predoctoral Fellowship (to J.K.-S.).
Abbreviations
- DM
dodecyl maltoside
- CP
cytoplasmic
- TM
transmembrane
- TROSY
transverse relaxation optimized spectroscopy
- DMPC
dimyristoyl-phosphatidyl choline
- OG
octyl glucoside
- WT
wild type
Footnotes
This is paper no. 50 in the series “Structure Function in Rhodopsin.” Paper no. 49 is ref. 1.
References
- 1.Altenbach C, Klein-Seetharaman J, Cai K, Khorana H G, Hubbell W L. Biochemistry. 2001;40:15493–15500. doi: 10.1021/bi011545o. [DOI] [PubMed] [Google Scholar]
- 2.Palczewski K, Kumasaka T, Hori T, Behnke C A, Motoshima H, Fox B A, Le Trong I, Teller D C, Okada T, Stenkamp R E, et al. Science. 2000;289:739–745. doi: 10.1126/science.289.5480.739. [DOI] [PubMed] [Google Scholar]
- 3.Marassi F M, Opella S J. Curr Opin Struct Biol. 1998;8:640–648. doi: 10.1016/s0959-440x(98)80157-7. [DOI] [PMC free article] [PubMed] [Google Scholar]
- 4.Henry G D, Sykes B D. Methods Enzymol. 1994;239:515–535. doi: 10.1016/s0076-6879(94)39020-7. [DOI] [PubMed] [Google Scholar]
- 5.MacKenzie K R, Prestegard J H, Engelman D M. Science. 1997;276:131–133. doi: 10.1126/science.276.5309.131. [DOI] [PubMed] [Google Scholar]
- 6.Pervushin K, Riek R, Wider G, Wuthrich K. Proc Natl Acad Sci USA. 1997;94:12366–12371. doi: 10.1073/pnas.94.23.12366. [DOI] [PMC free article] [PubMed] [Google Scholar]
- 7.Klein-Seetharaman J, Getmanova E V, Loewen M C, Reeves P J, Khorana H G. Proc Natl Acad Sci USA. 1999;96:13744–13749. doi: 10.1073/pnas.96.24.13744. [DOI] [PMC free article] [PubMed] [Google Scholar]
- 8.Eilers M, Reeves P J, Ying W, Khorana H G, Smith S O. Proc Natl Acad Sci USA. 1999;96:487–492. doi: 10.1073/pnas.96.2.487. [DOI] [PMC free article] [PubMed] [Google Scholar]
- 9.Loewen M C, Klein-Seetharaman J, Getmanova E V, Reeves P J, Schwalbe H, Khorana H G. Proc Natl Acad Sci USA. 2001;98:4888–4892. doi: 10.1073/pnas.051633098. [DOI] [PMC free article] [PubMed] [Google Scholar]
- 10.Knowles A, Priestley A. Vision Res. 1978;18:115–116. doi: 10.1016/0042-6989(78)90086-x. [DOI] [PubMed] [Google Scholar]
- 11.MacKenzie D, Arendt A, Hargrave P, McDowell J H, Molday R S. Biochemistry. 1984;23:6544–6549. doi: 10.1021/bi00321a041. [DOI] [PubMed] [Google Scholar]
- 12.Oprian D D, Molday R S, Kaufman R J, Khorana H G. Proc Natl Acad Sci USA. 1987;84:8874–8878. doi: 10.1073/pnas.84.24.8874. [DOI] [PMC free article] [PubMed] [Google Scholar]
- 13.Reeves P J, Thurmond R L, Khorana H G. Proc Natl Acad Sci USA. 1996;93:11487–11492. doi: 10.1073/pnas.93.21.11487. [DOI] [PMC free article] [PubMed] [Google Scholar]
- 14.Reeves P J, Klein-Seetharaman J, Getmanova E V, Eilers M, Loewen M C, Smith S O, Khorana H G. Biochem Soc Trans. 1999;27:950–955. doi: 10.1042/bst0270950. [DOI] [PubMed] [Google Scholar]
- 15.Yang K, Farrens D L, Altenbach C, Farahbakhsh Z T, Hubbell W L, Khorana H G. Biochemistry. 1996;35:14040–14046. doi: 10.1021/bi962113u. [DOI] [PubMed] [Google Scholar]
- 16.Hong K, Hubbell W L. Proc Natl Acad Sci USA. 1972;69:2617–2621. doi: 10.1073/pnas.69.9.2617. [DOI] [PMC free article] [PubMed] [Google Scholar]
- 17.Riek R, Pervushin K, Wuthrich K. Trends Biochem Sci. 2000;25:462–468. doi: 10.1016/s0968-0004(00)01665-0. [DOI] [PubMed] [Google Scholar]
- 18.Creemers A F, Klaassen C H, Bovee-Geurts P H, Kelle R, Kragl U, Raap J, de Grip W J, Lugtenburg J, de Groot H J. Biochemistry. 1999;38:7195–7199. doi: 10.1021/bi9830157. [DOI] [PubMed] [Google Scholar]
- 19.Fernandez C, Hilty C, Bonjour S, Adeishvili K, Pervushin K, Wuthrich K. FEBS Lett. 2001;504:173–178. doi: 10.1016/s0014-5793(01)02742-9. [DOI] [PubMed] [Google Scholar]
- 20.Fernandez C, Adeishvili K, Wuthrich K. Proc Natl Acad Sci USA. 2001;98:2358–2363. doi: 10.1073/pnas.051629298. [DOI] [PMC free article] [PubMed] [Google Scholar]
- 21.Langen R, Cai K, Altenbach C, Khorana H G, Hubbell W L. Biochemistry. 1999;38:7918–7924. doi: 10.1021/bi990010g. [DOI] [PubMed] [Google Scholar]
- 22.Pervushin K. Q Rev Biophys. 2000;33:161–197. doi: 10.1017/s0033583500003619. [DOI] [PubMed] [Google Scholar]
- 23.De Grip W J. Methods Enzymol. 1982;81:197–207. doi: 10.1016/s0076-6879(82)81032-x. [DOI] [PubMed] [Google Scholar]
- 24.Oxenoid K, Sonnichsen F D, Sanders C R. Biochemistry. 2001;40:5111–5118. doi: 10.1021/bi0029090. [DOI] [PubMed] [Google Scholar]
- 25.Orekhov V, Abdulaeva G V, Musina L, Arseniev A S. Eur J Biochem. 1992;210:223–229. doi: 10.1111/j.1432-1033.1992.tb17412.x. [DOI] [PubMed] [Google Scholar]
- 26.Orekhov V, Pervushin K V, Arseniev A S. Eur J Biochem. 1994;219:887–896. doi: 10.1111/j.1432-1033.1994.tb18570.x. [DOI] [PubMed] [Google Scholar]
- 27.Altenbach C, Yang K, Farrens D L, Farahbakhsh Z T, Khorana H G, Hubbell W L. Biochemistry. 1996;35:12470–12478. doi: 10.1021/bi960849l. [DOI] [PubMed] [Google Scholar]


