Abstract
Juvenile diabetes (type 1) is an autoimmune disease in which CD4+ T cells play a major role in pathogenesis characterized by insulitis and β cell destruction leading to clinical hyperglycemia. To date, no marker for autoimmune T cells has been described, although it was previously demonstrated that autoimmune mice have a large population of CD4+ cells that express CD40. We show here that established, diabetogenic T cell clones of either the Th1 or Th2 phenotype are CD40-positive, whereas nondiabetogenic clones are CD40-negative. CD40 functionally signals T cell clones, inducing rapid activation of the transcription factor NFκB. We show that autoimmune diabetes-prone nonobese diabetic mice have high levels of CD40+CD4+ T cells in the thymus, spleen, and importantly, in the pancreas. Finally, as demonstrated by adoptive transfers, CD4+CD40+ cells infiltrate the pancreatic islets causing β-cell degranulation and ultimately diabetes.
CD40 has been identified as a signaling molecule of the Fas/TNF receptor family whose expression is associated with antigen presenting cells (APC) (1–3). CD40 activates numerous signaling pathways such as NFκB (4) with multiple functional results. In addition to generally being anti-apoptotic (5), CD40 signals monocytes to synthesize and secrete inflammatory cytokines, e.g., IL-1β and tumor necrosis factor-α (2, 6). In B cells, CD40 induces cell proliferation, expression of adhesion molecules (7, 8), ICAM, VCAM, and VLA-4 (9), and RAG1- and RAG2-mediated antibody-class switching (10), significant to B cell autoantibody production. Subsequently, CD40 was directly implicated in autoimmune disease from the perspective of the APC, and recently it was shown that blockade of CD40–CD40L interactions prevented insulitis and diabetes in female nonobese diabetic (NOD) mice (11).
The role of CD40 in autoimmunity has been expanded further in that the expression of CD40 on T cells has been demonstrated (12–15). It was shown that autoimmune-prone strains of mice have substantially large numbers of CD40+CD4+ T cells in the periphery, whereas normal strains have low levels (12). The ligand for CD40 and CD40L (CD154) is inducible on T helper (Th) cells (16), thus allowing CD40L bearing T cells to interact with CD40+ T cells in the periphery.
A good example of T cell-mediated autoimmune disease is type 1 diabetes. The NOD mouse has been used extensively as a model for human type 1 autoimmune diabetes, and it has been established that T cells are critically important for pathogenesis of the disease. For instance, NOD mice spontaneously develop diabetes, but athymic NOD mice, and NOD.scid mice lacking T or B cells, do not develop disease. Furthermore, adoptive transfer of diabetogenic CD4+ T cell clones to young NOD or NOD.scid recipients rapidly induces disease (17–19). Having proposed a potential role for CD40+ T cells in autoimmunity, the current work examines the pathogenic potential of these cells in the NOD mouse.
Materials and Methods
Animals.
NOD, NOD.scid, and T cell receptor transgenic (TCR-Tg) mice were bred and maintained at the University of Colorado Health Sciences Center for Laboratory Animal Care. All animals were maintained in a pathogen-free environment.
T Cell Clones.
All T cell clones were generated from NOD mice as described (18–20). Before staining experiments, T cell clones were freshly restimulated with antigen-APC (20) for 4 days and expanded in an IL-2-containing subculture for 4 days. Th1 T cell clones included the diabetogenic clones BDC-2.5, BDC-6.3, BDC-4.38, BDC-5.10.3, and the nondiabetogenic T cell clone BDC-2.4 (20). Th2 T cell clones included the diabetogenic clone 2.5TCRTg/T2-X and the nondiabetogenic clone, 2.5TCRTg/T2-X.E10 (19).
Antibody Staining and Flow Cytometry.
T cell clones were collected after restimulation and subculture; after washing with PBS, the cells (1 × 10⁶) were treated with 2.4.G2 (an Fcɛ-blocking antibody) at 2 μg/ml, followed by staining with FITC-conjugated 1C10 (21), anti-CD40, or an isotype control. Cells were washed three times in PBS/5% FCS.
For primary cells, T cells were isolated from spleen, thymus, or pancreas of recently diabetic NOD mice. Tissues were mashed through a sieve, passed over lympholyte and then over nylon wool. Before staining, T cells were treated with 2.4.G2 at 2 μg/ml to block nonspecific antibody binding. Cells (1 × 10⁶) were triply stained either with directly phycoerytherin (PE)-conjugated antibody against CD3 (145.2C11, PharMingen) or PE-conjugated TCRαβ (H57.597, PharMingen) vs. directly conjugated anti-CD4 (H129.19, Cychrome, PharMingen) and with directly FITC-conjugated anti-CD40 (1C10). Staining buffer was PBS/5% FCS. CD40 expression was determined from gated CD4+CD3+ cells. Thymocytes immediately ex vivo from 3-week-old NOD mice or BALB/c mice were treated as before with 2.4.G2, anti-Fc receptor, and then with directly conjugated anti-CD4 (Cychrome), anti-CD8 (PE, PharMingen) and anti-CD40 (FITC) or FITC-isotype control (PharMingen). All staining antibodies were used at 1 μg/ml in PBS/5% FBS. Cells were washed three times in staining buffer. In all experiments, cells were gated on forward vs. side scatter to remove dead/dying cells and, therefore, nonspecific antibody-binding cells from analysis. Cells were examined on a Becton-Dickinson FACScalibur flow cytometer and analyzed with CELLQUEST software.
Electrophoretic Mobility Shift Assays.
The T cell clones, BDC-2.5 and BDC-2.4, were stimulated/expanded with antigen/APC as described (20). Resting T cell clones were harvested, passed through lympholyte to remove dead cells, including irradiated APCs, and then 3 × 10⁶ T cells were plated and allowed to sit overnight at 37°C. After the resting phase, T cells were left untreated, or were CD40-crosslinked for 1 h. Nuclear extracts were prepared by swelling cells in hypotonic buffer (10 mM Hepes, pH 7.9/1.5 mM MgCl2/10 mM KCl with 2 μM PMSF/1 μg/ml aprotinin/0.3 μg/ml leupeptin at 2 μM/0.5 mM DTT) for 20 min on ice, homogenizing the cells, and collecting nuclei. Nuclear proteins were extracted in low-salt buffer (20 mM Hepes, pH 7.9/0.2 mM EDTA/25% glycerol/1.5 mM MgCl2/20 mM KCl, including protease inhibitors) followed by the addition of a half volume of hypertonic buffer (same as above but containing 1 M KCl). Protein concentrations were determined by using a Bio-Rad protein assay, and extracts were frozen at −80°C. Extracts, 2.0 μg per sample, were incubated with 9 fmol 32P-labeled NFκB double-stranded consensus oligonucleotide, 5′-AGTTGAGGGGACTTTCCCAGG-3′ (Promega). Samples were electrophoresed through 4% polyacrylamide Tris-glycine-buffered gels, and gels were dried and exposed to film.
Adoptive Transfers and Histology.
Spleen cells isolated from recently diabetic NOD or from diabetic BDC-2.5TCR-Tg mice were stained with Cychrome-anti-CD4 (H129.19) and sorted into CD4lo and CD4hi populations with a MoFlo Cell Sorter (Cytomation, Fort Collins, CO). Cells were gated on forward vs. side scatter to remove clumped or doublet cells and then were counted, washed with PBS/5% FCS, and suspended in Hanks' balanced salt solution (HBSS). Staining after sorting confirmed CD40+ and CD40− T cells. For each experiment, two 9-day-old female NOD.scid recipients per treatment group were injected intra-peritoneally (i.p.) with 2 × 10⁶ up to 1 × 10⁷ sorted cells. Mice were monitored weekly by urine glucose test for diabetes. After 35 days, mice were killed, and pancreatic tissue was removed for histology. Tissues were fixed in 10% formalin/PBS for 24 h, followed by 70% ethanol for 24 h. Tissues were then paraffin embedded and sectioned. Sections were stained with hematoxylin/eosin to detect lymphocytes or with aldehyde/fuschin to show granules containing insulin.
Results
Diabetogenic T Cell Clones Express CD40 Whereas Nondiabetogenic T Cell Clones Are CD40−.
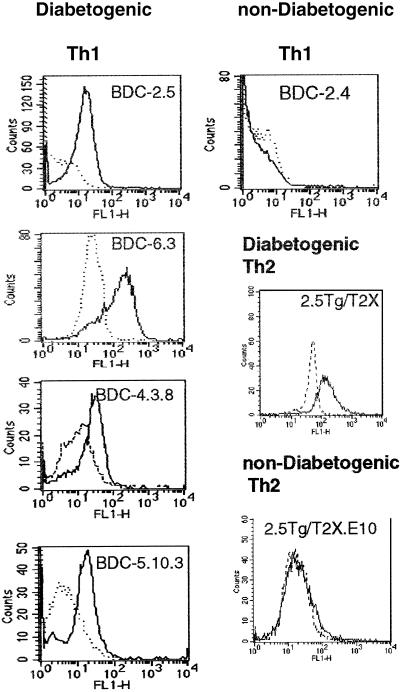
Numerous studies postulate the importance of CD40 in autoimmunity, including a critical role in type 1 diabetes (11, 22). Having previously demonstrated that CD40 is functionally expressed on CD4+ T cells and may have an important role in pathogenesis of autoimmune disease (12), we examined a panel of islet-reactive CD4+ Th1 and Th2 clones for CD40 expression (Table 1). The T cell clones, BDC-2.5, BDC-6.3, BDC-5.10.3, and BDC-4.12 are all highly diabetogenic and rapidly induce insulitis and β-cell destruction upon transfer to young (<2-week old) NOD recipients (17, 20). We demonstrate by flow cytometry that the diabetogenic clones express CD40 whereas a nondiabetogenic clone, BDC-2.4, isolated from the same diabetic NOD spleen as BDC-2.5, is completely CD40− (Table 1 and Fig. 1C).
Table 1.
CD40 expression on NOD T cell clones
| Clone | TCR | Islet reactive | Th phenotype | Diabetogenic | CD40-expressing |
|---|---|---|---|---|---|
| BDC-2.5 | Vβ4Vα1 | + | Th1 | + | + |
| BDC-6.3 | Vβ4Vα13 | + | Th1 | + | + |
| BDC-5.10.3 | Vβ4Vα(n.d.)* | + | Th1 | + | + |
| BDC-4.38 | (n.d.)* | + | Th1 | + | + |
| BDC-2.4 | (n.d.)* | − | Th1 | − | − |
| 2.5TCR-Tg/T2X | Vβ4Vα1 | + | Th2 | + | + |
| 2.5TCR-Tg/T2-X.E10 | Vβ4Vα1 | + | Th2 | − | − |
n.d., not determined.
Figure 1.
Expression of CD40 on diabetogenic T cell clones. Islet-specific T cell clones were maintained with bi-weekly restimulation with irradiated NOD splenocytes, NOD islet cells, and IL-2 as described (20). Cells (1 × 10⁶) were pretreated with 2 μg/ml 2.4.G2 to block nonspecific antibody binding and stained with 1 μg/ml FITC-conjugated 1C10 (21) in PBS/5% FCS staining buffer, followed by three washes. Rat IgG2 isotype controls (dashed line) are included. Th1 T cells: diabetogenic clones, BDC-2.5, BDC-6.3, BDC-4.38, BDC-5.10.3, and nondiabetogenic Th1 clone BDC-2.4. Th2 T cells: diabetogenic Th2 clone 2.5TCRTg/T2-X and nondiabetogenic clone 2.5TCRTg/T2X-E10.
Interestingly, CD40 expression on T cell clones does not correlate with T helper phenotype. The Th2 cell clone, 2.5TCRTg/T2-X, is highly diabetogenic in young NOD mice (19), and it expresses CD40 (Table 1 and Fig. 1). However, the nondiabetogenic Th2 clone, 2.5TCRTg/T2-X.E10, derived from the Tg/T2-X T cell line, was CD40−. Thus CD40 expression segregates with the pathogenicity of T cell clones but is not influenced by the Th subtype.
CD40 Signals Activate NFκB in a Diabetogenic T Cell Clone.
NFκB activation is essential in T cell-mediated autoimmunity (23). CD40 signals activate NFκB in CD40 bearing cells (24–26), and, therefore, we determined the functional signaling capacity of CD40 to activate NFκB in CD40+ BDC-2.5 compared with CD40− BDC-2.4 T cells.
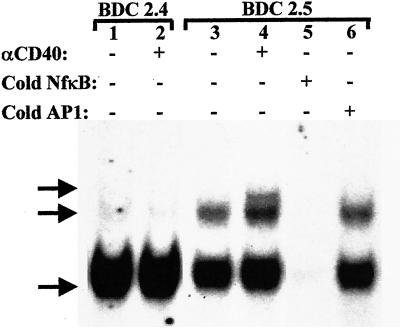
NFκB is composed of hetero-/homodimers of the rel proteins p65, p50, p52, Rel-b, or C-Rel. Receptor–ligand interactions such as CD40-CD40L induce cytoplasmic activation of NFκB. It has been reported that a proteasomal abnormality prevents p50 and p52 processing in NOD lymphocytes, but NFκB activation was demonstrated (27). Mobility shift assays for NFκB activation typically reveal three bands as shown in Fig. 2. There were no changes in NFκB activation in CD40− BDC-2.4 T cells treated with anti-CD40 compared with untreated controls (Fig. 2). The BDC-2.4 clone demonstrates an activated lower NFκB band in the resting state (Fig. 2, lane 1). In contrast, CD40 engagement on BDC-2.5 for 1 h increased the intensity of the lowest NFκB band above that of untreated BDC-2.5 cells, substantially increased intensity of the middle NFκB band, and induced expression of a third band (lanes 3 and 4 as indicated). Competition assay using cold NFκB oligos demonstrate that all three bands are NFκB (lane 5). The use of the irrelevant AP-1 cold oligo (lane 6) confirms that the binding specificity of the nuclear proteins is specific for the NFκB oligo because it did not compete with the NFκB signal. Constitutive levels of the faster migrating NFκB band are detected in both T cell clones, possibly reflecting that these cells are terminally differentiated. Also, because NFκB is a transcription factor found in numerous enhancer regions including those involved in ‘housekeeping’ (28) and cell cycle (29), background activation levels are expected. These data demonstrated there was no difference in NFκB activation state in CD40− BDC-2.4 before and after anti-CD40 treatment, whereas CD40 engagement on BDC-2.5 induced changes in NFκB activation profiles, providing biochemical evidence of CD40 expression on diabetogenic T cells.
Figure 2.
NFκB electrophoretic mobility shift assay. Resting cells were harvested from flasks of BDC-2.5 and BDC-2.4 T cell clones were cultured for 2 weeks. The cells (2 × 10⁶) were incubated overnight in RPMI/10% FCS and then were left unstimulated or were stimulated with biotinylated anti-CD40, 5 μg/ml, followed by streptavidin, 1 μg/ml, for 1 h. Nuclear protein extracts were incubated with 8.75 fmol [32P]NFκB oligo. The protein complexes were electrophoresed through SDS/4% PAGE, and the gels were dried and exposed to film for 6 h. Lane 1: unstimulated BDC-2.4; lane 2, anti-CD40-stimulated BDC-2.4; lane 3, unstimulated BDC-2.5; lane 4, anti-CD40-stimulated BDC-2.5; lane 5, cold NFκB oligo competition; lane 6, nonspecific oligo competition (8.75 fmol AP-1 oligo). Arrows indicate the three NFκB specific bands.
CD4+CD40+ T Cells in NOD Mice.
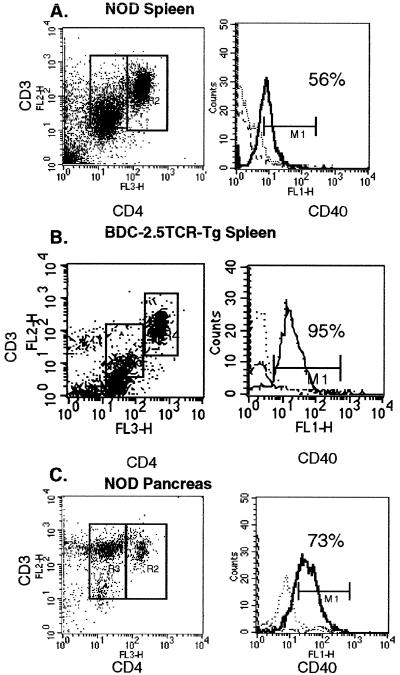
Because diabetogenic T cell clones isolated from NOD mice express CD40, we wanted to address the pathogenic potential of CD40+ T cells in NOD mice. To investigate this potential, we examined peripheral T cells and thymocytes for CD40 expression relative to the expression of both CD4 and CD3. T cells isolated from spleen and pancreas of diabetic NOD mice, stained immediately ex vivo, demonstrated two distinct CD4+ populations, designated CD4hi and CD4lo (Fig. 3A). Importantly, detection of the two distinct CD4+ populations depended on which anti-CD4 antibody was used. The antibody, H129.19, described under Materials and Methods, readily discriminated between the two populations of CD4+ cells; however, staining with GK1.5, a commonly used anti-CD4 antibody, resulted in one broad peak on the flow cytometric histogram (data not shown). CD4hi and CD4lo cells in NOD mice have been described previously, but with less distinct separation of the two populations (30), perhaps because of differences in reagents. Both CD4hi and CD4lo populations expressed CD3, with somewhat lower levels of CD3 being observed in the CD4lo cells (Fig. 3A). Each population comprised about 20% of total splenic cells, and both populations expressed TCRαβ (data not shown). In diabetic NOD mice, more than half of the splenic CD3+CD4lo population stained with CD40 (56%), whereas 73% of the CD3+CD4lo isolated from pancreas of prediabetic NOD mice were CD40+ (Fig. 3C). The CD3+CD4hi population contained only about 7% CD40+ cells. Neither population of CD3+CD4+ cells expressed surface Ig (Ig), the B220 B cell marker, or Mac-1 (CD11b), a macrophage marker (data not shown). In addition to investigating T cells from diabetic NOD mice, we examined splenic T cells from the BDC-2.5TCR-Tg TCR transgenic mouse derived from the diabetogenic T cell clone, BDC-2.5 (34). As shown in Fig. 3B, splenic T cells from diabetic BDC-2.5TCR-Tg mice are distributed into CD4lo and CD4hi as seen in NOD spleen. Significantly however, the CD4lo T cell population is 95% CD40+ in the Tg spleen as compared with about half of the CD4lo population in NOD.
Figure 3.
CD40 Expression on NOD Splenic and Pancreatic T Cells. Cell suspensions were prepared from diabetic NOD spleen and pancreas and from diabetic BDC-2.5TCR-Tg spleens and then were passed over nylon wool to isolate T cells. Cells were treated with 2.4.G2 at 2 μg/ml to block nonspecific binding and stained as described in Materials and Methods (1 × 10⁶ cells were combined with directly conjugated Cychrome anti-CD4 (L3T4), PE anti-CD3, and FITC anti-CD40) and gated on forward vs. side scatter to remove nonspecific antibody binding cells from analysis. Dot plots are CD4 vs. CD3 stained T cells, and 15,000 events were acquired. Histograms represent CD40 expression in the gated regions, wherein the dotted line is isotype control, the dashed line is from the CD4hi cells, and the solid line is from the CD4lo cells.
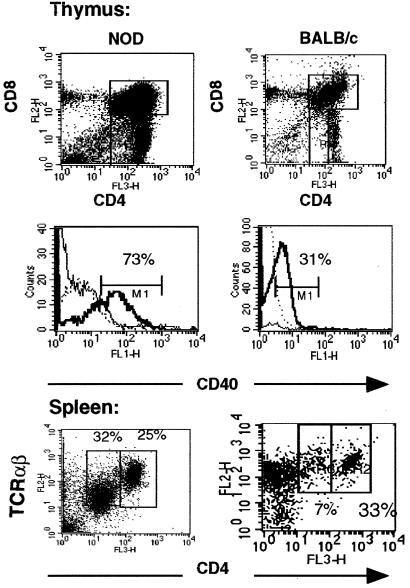
Because CD40hiCD4lo T cells may represent a unique subset of T cells and, thus, may arise early in T cell development, we examined NOD thymocytes for CD40 expression. The CD4/CD8 ratio of NOD thymocytes is similar to that of other mouse strains, e.g., BALB/c (Fig. 4A). However, there was a more pronounced CD4loCD8− population of cells in NOD thymus not detected in age-matched BALB/c. The majority of these NOD CD4lo cells (73%) express CD40, whereas in BALB/c mice, CD40 expression occurs only on CD4+CD8+ double-positive cells (31% are CD40+). In the NOD, less than 5% of the CD4+CD8+ cells expressed CD40 (see the solid, thin line of histogram of Fig. 4). These data suggest that CD40hiCD4+ T cells in autoimmune-prone NOD mice develop differently than in normal BALB/c mice. In the periphery, purified T cells from spleens of diabetic NOD mice were compared with those from age-matched BALB/c controls (Fig. 4B). In diabetic NOD animals, 32% of purified T cells were CD4loCD40hi, whereas only 7% of T cells from BALB/c mice were CD4loCD40hi. In addition, the CD4loCD40hi T cells in NOD spleen were intermediate in TCR expression.
Figure 4.
Expression of CD40 on NOD and BALB/c thymocytes and splenic T cells. Thymus tissue and spleens were excised from 12-week-old NOD and BALB/c female mice. Thymocytes were passed over lympholyte and stained immediately. Splenic cells were passed over nylon-wool columns to purify total T cells. Cells were treated with 2.4.G2, then stained with PE-anti-CD8, CyChrome-anti-CD4, and FITC-anti-CD40 or FITC-isotype control all at 1 μg/ml for 30 min on ice. Cells were washed 3× in PBS/5% BSA. Thymus: dot plots represent the CD4 vs. CD8 profile, and histograms represent CD40 expression in each gated region. In both cases, 15,000 events were acquired for analysis. In NOD thymocytes, CD40 expression occurred on CD4lo8− (bold solid line) and much less in the double-positive CD4+8+ T cells (solid line). In BALB/c, CD40 expression was found on CD4+8+ double-positive cells exclusively (bold line). Dashed-line histogram is isotype control. Splenic T cells were stained with directly conjugated Cychrome anti-CD4 (H129.19) and PE anti-TCRαβ (H57.597).
CD4loCD40hi T Cells Adoptively Transfer Autoimmune Disease.
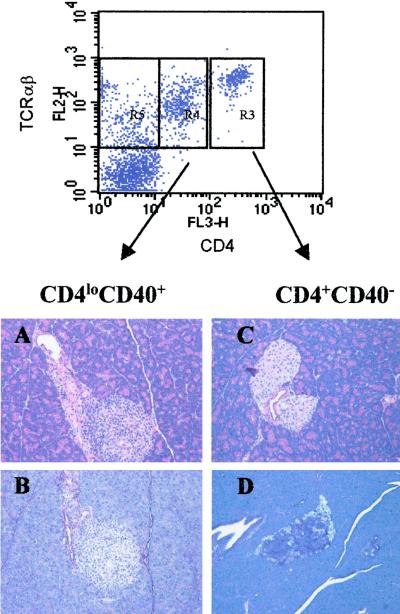
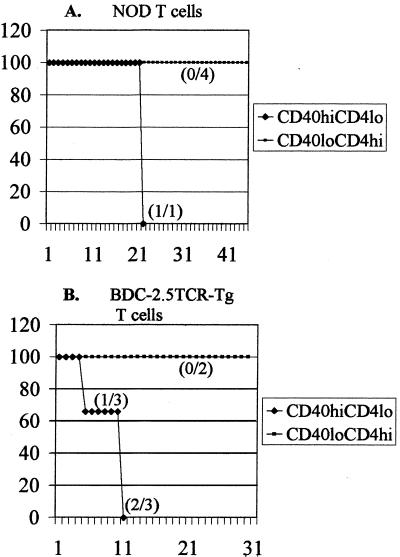
To further test the pathogenic potential of CD4loCD40hi T cells, we carried out adoptive transfer experiments with sorted populations of CD4loCD40hi and CD4hiCD40lo T cells from spleens of diabetic NOD animals into NOD.scid recipients. CD4loCD40hi and CD4hiCD40lo T cells from a diabetic NOD were sorted by gating on CD4 and 3 × 10⁶ cells of each population were transferred into 9-day-old NOD.scid recipients. The mice were monitored for insulitis and diabetes onset for 35 days. Histological analysis of pancreatic sections revealed extensive insulitis as demonstrated by lymphocytic infiltration (Fig. 5A) and β-cell degranulation (Fig. 5B) in islets of all mice receiving CD4loCD40hi T cells. These experiments were repeated four times. Levels of infiltration and degranulation correlated directly to the numbers of CD4loCD40hi T cells transferred (Table 2); i.e., with more cells transferred, the number of infiltrated and degranulated islets was greater (Table 2). In contrast, animals treated with splenic CD4hiCD40lo cells showed little islet infiltration (Fig. 5C and Table 2) or β-cell degranulation (Fig. 5D and Table 2), regardless of the number of cells transferred. In one experiment with 1 × 10⁷ purified CD4loCD40hi T cells followed by a booster of 1 × 10⁷ purified CD4loCD40hi T cells one-week later, the recipient developed clinical diabetes 22 days after initial injection (Fig. 6A). Because these transfer experiments were severely constrained by low cell numbers, we could transfer only small numbers of cells to only two recipients per experiment. Nevertheless, the development of severe insulitis, and eventually diabetes in one mouse receiving CD4loCD40hi T cells, suggests that with greater numbers of cells and longer time periods, more animals would become hyperglycemic. We further investigated the diabetes-inducing potential of CD4loCD40hi T cells through adoptive transfer experiments in NOD.scid recipients with splenic T cells isolated from the BDC-2.5TCR-Tg mouse. The CD4loCD40hi T cells isolated from diabetic Tg mice induced diabetes in 100% of recipients (three of three) within 11 days, whereas recipients of CD4hiCD40lo T cells from Tg mice showed no signs of pathogenicity in a 45-day time period (Fig. 6B).
Figure 5.
CD4loCD40hi T cells infiltrate and degranulate NOD.scid β-cells. CD4hi and CD4lo cells were sorted from a diabetic NOD spleen. A sample of each population was stained after sorting to confirm the expression of CD40. CD4lo cells were >90% CD40+ and CD4hi cells were <5% CD40+. T cells were washed, and 3 × 10⁶ of each sorted population were suspended in 50 μl HBSS and injected into two 9-day-old recipients per experiment. Recipients were monitored daily by urine or blood glucose levels for hyperglycemia. At 35 days after injection, animals were killed, and pancreata were removed for histology. Pancreata were fixed in formalin for paraffin embedding, sectioned, and stained with hematoxylin and eosin (A and C) to designate T cells and with aldehyde-fuchsin (B and D), which stains insulin-containing granules. (A and B) Representative pancreatic sections from CD4loCD40hi-treated NOD.scid mice. (C and D) Sections from CD4hiCD40lo-treated NOD.scids. Experiments were done a total of five times.
Table 2.
CD4loCD40hi T cells induce severe insulitis and diabetes in NOD.scid recipients linearly
| T cells | Infiltrate score | Granulation score | Cells transferred |
|---|---|---|---|
| CD4loCD40hi | 3.0 | 0.4 | 107 × 2* |
| 3.0 | 1.5 | 107 | |
| 2.3 | 0.9 | 5 × 10⁶ | |
| 1.7 | 2.0 | 3 × 10⁶ | |
| 1.6 | 2.5 | 2 × 10⁶ | |
| CD4hiCD40lo | 0.3 | 3.0 | 107 × 2 |
| 0.1 | 2.8 | 107 | |
| 0.1 | 2.8 | 5 × 10⁶ | |
| 0.0 | 3.0 | 3 × 10⁶ | |
| 0.25 | 2.6 | 2 × 10⁶ |
CD4loCD40hi T cells induce severe insulitis and diabetes in NOD.scid recipients correlating to the numbers of cells injected. Pancreata from experiments described in Figs. 5 and 6 were fixed and stained as described in the legend to Fig. 5. Histology was scored for T cell infiltrate and granulation using a 3-point system described (20).
Clinical diabetes.
Figure 6.
CD4loCD40hi T cells induce diabetes. (A) CD4loCD40hi and CD4hiCD40lo T cells were sorted from spleens of diabetic NOD mice. Purified CD4loCD40hi or CD4hiCD40lo T cells were injected i.p. 1 × 10⁷ cells per injection into 9-day-old NOD.scid recipients; a second injection of 1 × 10⁷ cells was made 1 week later. None of the control CD4hiCD40lo recipients (0/4 and 0/2) became diabetic over the 45-day experimental period. One recipient of diabetic NOD CD4loCD40hi T cells became diabetic at 22 days after injection. The graph represents the percentage of animals from two different experiments that became diabetic over a 45-day experimental period. (B) CD4loCD40hi and CD4hiCD40lo T cells were isolated from spleens of diabetic BDC-2.5TCR-Tg mice, and a single injection of 1 × 10⁷ cells was made. One of three recipients of TCR-Tg CD4loCD40hi T cells became diabetic at 5 days, and two others became diabetic at 11 days (disease incidence 3/3). None of the CD4hiCD40lo control mice became diabetic. By combining the adoptive transfer experiments and performing a χ2 test on diabetes of the tested mice, the data achieve a P < 0.05.
Discussion
Based on the findings presented here, we propose the identification of a unique population of CD4+ T cells expressing CD40 and low levels of CD4 that mediate autoimmune diabetes. We show that diabetogenic T cell clones are CD40+, whereas nondiabetogenic T cell clones are CD40−. Additionally, diabetogenic Th1 and Th2 clones express CD40, suggesting that CD40 expression is a determinant for pathogenicity. Further evidence of the pathogenic potential of CD4loCD40hi T cells was demonstrated. We determined that CD40 functionally signals a diabetogenic T cell clone to rapidly activate the transcription factor NFκB. NFκB is activated more rapidly in Th1 cells compared with Th2 cells (32), and, moreover, it has been reported that NFκB activation favors a Th1 autoimmune response (23, 33). The importance of NFκB activation to autoimmune disease has been illustrated in experiments wherein blocking NFκB activation completely prevented collagen-induced arthritis (23). Our results showing NFκB activation after CD40 engagement on diabetogenic T cell clones further extends the role for NFκB in autoimmune disease.
If CD40 is a marker for diabetogenic T cells, then CD40+ T cells should be detectable in NOD mice. We determined that CD4loCD40hi T cells could be isolated from spleens of diabetic NOD mice, and importantly, were present in the pancreas of recently diabetic NOD mice. The CD4loCD40hi population expressed TCRαβ but not markers for APCs, suggesting a T cell lineage. The T cell phenotype was confirmed by purifying CD3+ T cells from spleens of NOD and demonstrating that they contained both CD4hiCD40lo and CD4loCD40hi cells. Furthermore, we detected CD4loCD40hi T cells in the thymus of young NOD mice. In control BALB/c thymus, CD40hi cells can be detected in the CD4+CD8+ double positive (DP) compartment, whereas NOD mice have few CD40+ DP thymocytes. In the periphery, NOD mice have a substantially large population of CD4loCD40hi T cells in spleen (56% of the CD4 population), but in BALB/c mice, that number is much smaller (17%). This fact suggests that, developmentally, the CD4loCD40hi-expressing population is unique to autoimmunity.
Functional differences between CD4hi and CD4lo T cells have been demonstrated previously by Lejon and Fathman (30). In that system, NOD.scid mice were reconstituted with CD8+ cells followed by transfer of CD4lo or CD4hi cells. It was found that CD4hi cells isolated from pancreas work with or “help” CD8 cells, resulting in diabetes, whereas transfer of CD4hi cells from spleen did not induce disease. In our experiments, CD8+ T cells were not involved because we transferred sorted CD4+ T cells isolated from spleen to NOD.scid recipients. We found that the CD4loCD40hi cells successfully and reproducibly induced infiltration and β-cell degranulation in islets whereas the CD4hiCD40lo population had no effect. Ultimately, we showed that these unique T cells induced clinical diabetes. This result provides unequivocal evidence that the CD4loCD40hi subset of T cells in the NOD mouse is pathogenic.
Acknowledgments
This work was supported by Juvenile Diabetes Foundation International Advanced Postdoctoral Fellowship 10–2000-273 (to D.H.W.) and National Institutes of Health Grant AI 44482 (to K.H.).
Abbreviations
- APC
antigen presenting cells
- NOD
nonobese diabetic
- Th
T helper
- TCR-Tg
T cell receptor transgenic
- PE
phycoerytherin
Footnotes
This paper was submitted directly (Track II) to the PNAS office.
References
- 1.Noelle R. Clin Immunol Immunopathol. 1995;76:5203–5207. doi: 10.1016/s0090-1229(95)90234-1. [DOI] [PubMed] [Google Scholar]
- 2.Wagner D H, Jr, Stout R D, Suttles J. Eur J Immunol. 1994;24:3148–3154. doi: 10.1002/eji.1830241235. [DOI] [PubMed] [Google Scholar]
- 3.Banchereau J, Bazan F, Blanchard D, Briere F, Galizzi J P, van Kooten C, Liu Y J, Rousset F, Saeland S. Annu Rev Immunol. 1994;12:881–920. doi: 10.1146/annurev.iy.12.040194.004313. [DOI] [PubMed] [Google Scholar]
- 4.Tsukamoto N, Kobayashi N, Azuma S, Yamamoto T, Inoue J. Proc Natl Acad Sci USA. 1999;96:1234–1239. doi: 10.1073/pnas.96.4.1234. [DOI] [PMC free article] [PubMed] [Google Scholar]
- 5.Poe J, Wagner D H, Jr, Stout R D, Suttles J. J Immunol. 1997;159:846–852. [PubMed] [Google Scholar]
- 6.Suttles J, Stout R. Immunol Today. 1997;17:487–492. doi: 10.1016/0167-5699(96)10060-i. [DOI] [PubMed] [Google Scholar]
- 7.Kotowicz K, Dixon G, Klein N, Peters M, Callard R. Immunology. 2000;100:441–448. doi: 10.1046/j.1365-2567.2000.00061.x. [DOI] [PMC free article] [PubMed] [Google Scholar]
- 8.Kansas G S, Tedder T F. J Immunol. 1991;147:4094–4102. [PubMed] [Google Scholar]
- 9.Devine L, Lightman S, Greenwood J. Immunology. 1996;88:456–462. doi: 10.1046/j.1365-2567.1996.d01-666.x. [DOI] [PMC free article] [PubMed] [Google Scholar]
- 10.Castigli E, Young F, Carossino A, Alt F, Geha R. Int Immunol. 1996;8:405–411. doi: 10.1093/intimm/8.3.405. [DOI] [PubMed] [Google Scholar]
- 11.Balasa B, Krahl T, Patstone G, Lee J, Tisch R, McDevitt H O, Sarvetnick N. J Immunol. 1997;159:4620–4627. [PubMed] [Google Scholar]
- 12.Wagner D H, Jr, Newell E, Sanderson R, Freed J H, Newell M K. Int J Mol Med. 1999;4:231–242. doi: 10.3892/ijmm.4.3.231. [DOI] [PubMed] [Google Scholar]
- 13.Armitage R J, Tough T W, Macduff B M, Fanslow W C, Spriggs M K, Ramsdell F, Alderson M R. Eur J Immunol. 1993;23:2326–2331. doi: 10.1002/eji.1830230941. [DOI] [PubMed] [Google Scholar]
- 14.Armitage R J, Maliszewski C R, Alderson M R, Grabstein K H, Spriggs M K, Fanslow W C. Semin Immunol. 1993;5:401–412. doi: 10.1006/smim.1993.1046. [DOI] [PubMed] [Google Scholar]
- 15.Fanslow W C, Clifford K N, Seaman M, Alderson M R, Spriggs M K, Armitage R J, Ramsdell F. J Immunol. 1994;152:4262–4269. [PubMed] [Google Scholar]
- 16.Lederman S, Yellin M, Krichevsky A, Belko J, Lee J, Chess L. J Exp Med. 1992;175:1091–1101. doi: 10.1084/jem.175.4.1091. [DOI] [PMC free article] [PubMed] [Google Scholar]
- 17.Haskins K, McDuffie M. Science. 1990;249:1433–1436. doi: 10.1126/science.2205920. [DOI] [PubMed] [Google Scholar]
- 18.Peterson J, Pike B, Dallas-Pedretti A, Haskins K. Immunol. 1995;85:455–460. [PMC free article] [PubMed] [Google Scholar]
- 19.Poulin M, Haskins K. J Immunol. 2000;164:3072–3078. doi: 10.4049/jimmunol.164.6.3072. [DOI] [PubMed] [Google Scholar]
- 20.Haskins K, Portas M, Bergman B, Lafferty K, Bradley B. Proc Natl Acad Sci USA. 1989;86:8000–8004. doi: 10.1073/pnas.86.20.8000. [DOI] [PMC free article] [PubMed] [Google Scholar]
- 21.Heath A W, Wu W W, Howard M C. Eur J Immunol. 1994;24:1828–1834. doi: 10.1002/eji.1830240816. [DOI] [PubMed] [Google Scholar]
- 22.Biancone L, Cantaluppi V, Camussi G. Int J Mol Med. 1999;3:343–353. doi: 10.3892/ijmm.3.4.343. [DOI] [PubMed] [Google Scholar]
- 23.Seetharaman R, Mora A, Nabozny G, Boothby M, Chen J. J Immunol. 1999;163:1577–1583. [PubMed] [Google Scholar]
- 24.Francis D, Karras J, Ke X, Sen R, Rothstein T. Int Immunol. 1995;7:151–161. doi: 10.1093/intimm/7.2.151. [DOI] [PubMed] [Google Scholar]
- 25.Strom L, Laurencikiene J, Miskiniene A, Severinson E. Scand J Immunol. 1999;49:523–532. doi: 10.1046/j.1365-3083.1999.00539.x. [DOI] [PubMed] [Google Scholar]
- 26.Garceau N, Kosaka Y, Masters S, Hambor J, Shinkura R, Honjo T, Noelle R. J Exp Med. 2000;191:381–386. doi: 10.1084/jem.191.2.381. [DOI] [PMC free article] [PubMed] [Google Scholar]
- 27.Hayashi T, Faustman D. Mol Cell Biol. 1999;19:8646–8659. doi: 10.1128/mcb.19.12.8646. [DOI] [PMC free article] [PubMed] [Google Scholar]
- 28.Khan F, Varma G, Vijay I. Glycobiology. 1999;9:797–806. doi: 10.1093/glycob/9.8.797. [DOI] [PubMed] [Google Scholar]
- 29.Seitz C, Deng H, Hinata K, Lin Q, Khavari P. Cancer Res. 2000;60:4085–4092. [PubMed] [Google Scholar]
- 30.Lejon K, Fathman C G. J Immunol. 1999;163:5708–5714. [PubMed] [Google Scholar]
- 31.Iouzalen N, Andreae S, Hannier S, Triebel F. Eur J Immunol. 2001;31:2885–2891. doi: 10.1002/1521-4141(2001010)31:10<2885::aid-immu2885>3.0.co;2-2. [DOI] [PubMed] [Google Scholar]
- 32.Dorado B, Portoles P, Ballester S. Eur J Immunol. 1998;28:2234–2244. doi: 10.1002/(SICI)1521-4141(199807)28:07<2234::AID-IMMU2234>3.0.CO;2-2. [DOI] [PubMed] [Google Scholar]
- 33.Aronica M, Mora A, Mitchell D, Finn P, Johnson J, Sheller J, Boothby M. J Immunol. 1999;163:5116–5124. [PubMed] [Google Scholar]
- 34.Katz J, Wang B, Haskins K, Benoist C, Mathis D. Cell. 1993;74:1089–1100. doi: 10.1016/0092-8674(93)90730-e. [DOI] [PubMed] [Google Scholar]


