

Abstract
The [URE3] infectious protein (prion) of Saccharomyces cerevisiae is a self-propagating amyloid form of Ure2p. The C-terminal domain of Ure2p controls nitrogen catabolism by complexing with the transcription factor, Gln3p, whereas the asparagine-rich N-terminal “prion” domain is responsible for amyloid filament formation (prion conversion). On filament formation, Ure2p is inactivated, reflecting either a structural change in the C-terminal domain or steric blocking of its interaction with Gln3p. We fused the prion domain with four proteins whose activities should not be sterically impeded by aggregation because their substrates are very small: barnase, carbonic anhydrase, glutathione S-transferase, and green fluorescent protein. All formed amyloid filaments in vitro, whose diameters increased with the mass of the appended enzyme. The helical repeat lengths were consistent within a single filament but varied with the construct and between filaments from a single construct. CD data suggest that, in the soluble fusion proteins, the prion domain has no regular secondary structure, whereas earlier data showed that in filaments, it is virtually all β-sheet. In filaments, the activity of the appended proteins was at most mildly reduced, when substrate diffusion effects were taken into account, indicating that they retained their native structures. These observations suggest that the amyloid content of these filaments is confined to their prion domain-containing backbones and imply that Ure2p is inactivated in [URE3] cells by a steric blocking mechanism.
An infectious protein (prion) is an altered form of a cellular protein that has lost its normal function but has acquired the ability to convert the normal form into the altered (prion) form. This concept originates from work on the transmissible spongiform encephalopathies of mammals (1). PrP is a protein essential to scrapie propagation and is found in an amyloid form in the brains of diseased animals (2–5). Furthermore, purification of the infectious material results in purification of the amyloid form of PrP (6, 7), suggesting that this altered form of PrP (PrPSc) is a prion. Amyloid is a polymerized, nonnative, conformational state of proteins, characterized by filamentous form, high β-sheet content, protease resistance, and special staining properties (8).
In yeast, the nonchromosomal gene [URE3] (9) was identified as a prion form of the Ure2 protein on the basis of its unusual genetic properties, which met three rigorous criteria for a prion (ref. 10, reviewed in ref. 11). Parallel evidence showed that the nonchromosomal gene [PSI] is a prion form of Sup35p (10). Ure2p is a regulator of nitrogen catabolism that acts in the cytoplasm by complexing with the GATA transcription factor Gln3p, preventing entry of the latter into the nucleus (12–18). Ure2p1–65 suffices to carry out the prion domain functions (19, 20), but Ure2p1–80 is even more efficient (21). The Ure2p C-terminal domain (Ure2p66–354 or Ure2p90–354) is similar in sequence and structure to glutathione S-transferases (GSTs) (14, 22, 23) and carries out the nitrogen regulation function (14, 19, 20).
Extensive evidence now supports the view that the [URE3] prion is a self-propagating amyloid form of Ure2p. Ure2p was found to be partially protease-resistant in extracts of [URE3] cells (19), providing the first biochemical evidence for yeast prions and the first link to amyloid. Ure2p is aggregated in [URE3] cells, and this aggregation is directed by the prion domain (15). Ure2p can form amyloid filaments in vitro, and again their formation depends on the prion domain (24). Moreover, the properties of the Ure2p amyloid formed in vitro (24) correspond closely to those of Ure2p in [URE3] cells and extracts (15, 19, 25).
The mechanism by which inactivation of Ure2p accompanies filament formation has not been determined. One possibility is that a conformational alteration of the C-terminal domain is caused by its incorporation into filaments, resulting in loss of function. This model is in line with evidence for a refolding of PrP on converting to its amyloid form, PrPSc (26, 27), and is suggested by some spectroscopic data on Ure2p (refs. 24 and 28, but see Discussion). Alternatively, the assembly of Ure2p into filaments may simply mask the region that binds to Gln3p, thus preventing this interaction by steric blocking.
We proposed that the Ure2p filament has a backbone consisting of stacked β-sheet-rich prion domains, surrounded by C-terminal domains (the “backbone” hypothesis) (24, 25). In support of this model, the N-terminal region of Ure2p is protease-resistant both in extracts of [URE3] cells and in amyloid formed in vitro, whereas the C-terminal domain is protease-sensitive (19, 24). Moreover, antibody-binding studies indicated that in filaments, the prion domain was buried, whereas the C-terminal domain was exposed (25). In terms of this model, the two inactivation mechanisms differ as to whether refolding propagates into the C-terminal domain when the protein is assembled into filaments.
To investigate this question, we fused the Ure2 prion domain with several enzymes whose substrates were small. The “backbone” hypothesis predicts that such constructs should also form filaments, provided that the appended protein is not too large. The steric blocking mechanism of Ure2p inactivation (which invokes no refolding of its functional domain) would predict that these fusion proteins should remain active in the filamentous state, because access of substrates to their active sites should not be blocked. We find that activity of these enzymes is at most mildly inhibited by filament formation and to a degree predictable by substrate diffusion effects.
Methods
Plasmids.
Plasmid pMT1002, derived from pTN44 (29), for expression of barnase was a generous gift from R. W. Hartley (National Institutes of Health, Bethesda). NdeI and NotI sites between the phoA signal sequence and the barnase gene were introduced by using the QuikChange site-directed mutagenesis kit (Stratagene) and primers 5′-tattagcggccgcgcacaggttatcaacacg-3′ and 5′-ataagcatatgggcttttgtcacaggggt-3′. Subcloning of an NdeI/NotI URE2 fragment (corresponding to residues 1–65) derived from pH467 (obtained from H. Edskes, National Institutes of Health) into the modified pMT1002 produced pUB1. This construct codes for a fusion protein consisting of amino acids 1–65 of Ure2p followed by the complete barnase protein (Ure21–65-barnase).
The carbonic anhydrase III gene (CA III) cloned into pET-17b via NdeI and BamHI sites (30) was a generous gift of R. L. Levine (National Institutes of Health). From this plasmid the only NotI restriction site was removed by religation after digestion with XhoI and EcoRV. A new NotI restriction site was then introduced in front of the CA gene by using the QuikChange site-directed mutagenesis kit (Stratagene) and primers 5′-cagctccatatgtatatctccttcttaa-3′ and 5′-aatatagcggccgcatggctaaggagtggggt-3′. Subcloning of the same NdeI/NotI fragment of the URE2 gene as described above produced pUB2, which codes for Ure21–65 followed by the complete CA protein.
The Schistosoma japonicum GST gene was cloned by PCR from the plasmid pYEX 4T-1 (CLONTECH), adding NotI and BamHI restriction sites. This fragment was subcloned into pUB2 by exchanging the CA gene with the amplified GST gene, producing pUB4. This construct codes for Ure21–65 followed by the complete GST protein.
By using an enhanced mutant of green fluorescent protein (GFP; ref. 31), an expression plasmid (with a thrombin site) for the production of Ure21–80-SDDDDKGGR-GFP (S65G, S72A)-H6K was constructed and kindly supplied by H. Edskes. Each fusion protein construct was confirmed by sequencing.
Expression and Purification of Fusion Proteins.
To produce Ure21–65-barnase or barnase, cells of Escherichia coli XL1 blue containing the appropriate plasmid were diluted 1:2000 from a stationary culture into 1 liter of TB medium [12 g/l tryptone/24 g/liter yeast extract/0.5% (v/v) glycerol/12.5 g/liter K2HPO4/2.8 g/liter KH2PO4] containing ampicillin (0.1 mg/ml) at 37°C and grown for 16 h. The cultures were chilled on ice, and acetic acid was added to 5%. Cells were removed by centrifuging at 4,000 × g for 15 min, and (NH4)2SO4 to 80% saturation was added to the supernatant. After centrifugation at 25,000 × g for 1 h., the pellet was resuspended in ≈10 ml of water and dialyzed overnight against 20 mM Na citrate (pH 5.5). Insoluble material was removed by centrifugation at 40,000 × g for 30 min. The supernatant was applied to an Uno-S6 column (Bio-Rad), and essentially pure protein was eluted with a gradient of 20 mM sodium citrate (pH 5.5) to 20 mM sodium phosphate/200 mM NaCl (pH 8.0). CA and Ure21–65-CA were expressed and purified essentially as described (30).
To express Ure21–65-GST and Ure21–80-GFP, E. coli BL21 cells containing the respective plasmids were grown in 1 liter of LB medium containing ampicillin (0.1 mg/ml) at 30°C. Expression was induced at an OD550 of ≈1.0 by adding isopropyl β-d-thiogalactoside (IPTG) to a final concentration of 1 mM. Cells were further grown at 30°C for 16 h, harvested by centrifugation (4,000 × g, 15 min), resuspended in ≈20 ml of buffer A (50 mM Tris Cl/200 mM NaCl, pH 8.0) containing a protease inhibitor mixture (Complete, Roche Molecular Biochemicals), and disrupted by high pressure. Insoluble material was removed by centrifugation at 40,000 × g for 1 h. Ure21–65-GST was recovered from the soluble fraction by adding 5 ml of glutathione Sepharose 4B (Amersham Biosciences). The Sepharose was washed 3 times with 50 ml of buffer A, and purified Ure21–65-GST was released by 3 extractions with 5 ml of 10 mM glutathione in buffer A. The three supernatant fractions were combined. To recover Ure21–80-GFP from the extract, a 20-ml column of Ni-NTA Superflow (Qiagen, Chatsworth, CA) was used according to the recommendations of the manufacturer.
As a reference, Ure2p N-terminally tagged with His-6 followed by a thrombin site, resulting in the sequence, MH6MYPRGN-Ure2, was used. All proteins were frozen in liquid nitrogen shortly after purification and stored at −80°C to avoid filament formation.
Filament Assembly.
Protein solutions, usually in buffer A, at concentrations of 0.1–1.0 mg/ml were incubated on a shaker at 4°C. Precipitation was visible after a time that ranged from 16 h to 3 weeks, depending on the protein. Filaments also formed in PBS (pH 7.4) and in 50 mM Tris Cl/1 mM EDTA (pH 7.7). Sonication to disperse and fragment filaments was carried out in 5 30-sec bursts in a Branson 200 Ultrasonic Cleaner, with cooling on ice for 15 sec between bursts.
Enzyme Assays.
Barnase activity was measured by the hydrolysis of the relatively small fluorogenic substrate fluorescein-dArGdAdA-TAMRA (32–34). Increase of fluorescence was measured in a Perkin–Elmer LS50B fluorescence spectrophotometer at room temperature. The initial rate of these reactions was determined at protein concentrations between 0.02–0.5 nM and substrate concentrations between 5–150 nM.
CA activity was measured by the commonly used assay that gives one unit as the amount of enzyme required to reduce by one-half the time required to lower the pH of a defined solution [4 ml of CO2-saturated water mixed with 6 ml 20 mM Tris Cl (pH 8.0) at 25°C] from pH 8.3 to 6.3 at 0–4°C (ref. 30; Worthington manual). Activity units were then calculated as U = 2(T0-T)/T, where T0 (T) is the time required without (with) CA.
Ure21–65-GST was assayed in 100 mM sodium phosphate (pH 6.5) with the two standard GST substrates, 1-chloro-2,4-dinitrobenzene (CDNB) and glutathione (GSH) (35), and by monitoring the appearance of the product at 340 nm in a Spectronic (Westbury, NY) Genesys 2 spectrophotometer at room temperature. GSH was directly dissolved in assay buffer, whereas appropriate stock solutions in ethanol were prepared for CDNB such that the concentration of ethanol in the assay mixture was always 5% (vol/vol). The initial rate of the reactions was determined and corrected for the reaction without enzyme (in each case, less than 0.2%). The specific activity was measured as the mean of values obtained at several enzyme concentrations between 4–16 μg/ml.
The concentrations of all proteins except Ure21–80-GFP were determined by measuring the absorbance at 280 nm, using extinction coefficients calculated according to Pace et al. (36). Before determination of absorbance, filaments were denatured in 7.5 M guanidinium hydrochloride for half an hour at room temperature to avoid interference from light scattering.
Spectroscopy.
UV absorption spectra for protein concentration measurements were recorded on a Genesys 2 spectrophotometer (Spectronic). Fluorescence spectra of Ure21–80-GFP were determined in a Perkin–Elmer LS50B fluorescence spectrophotometer in buffer A. Protein concentrations were about 50 μg/ml. The concentration of Ure21–80-GFP was determined by the “base-denatured chromophore” method (37, 38).
CD spectra were recorded in a 1-mm path quartz cell with a Jasco (Easton, MD) J-715 spectropolarimeter. Protein concentrations were 0.2–0.3 mg/ml, with the exact concentration determined in each case by absorption at 280 nm.
Electron Microscopy (EM).
Drops of filament suspensions at concentrations of 0.1 and 0.5 mg/ml of protein usually in buffer A were adsorbed to EM grids bearing thin carbon films and stained with 1% uranyl acetate. Specimens were observed in a Zeiss EM 902 (Leica, Deerfield, IL).
Results
Purification of Recombinant Fusion Proteins.
We cloned four chimeric proteins that had the Ure2p prion domain fused with barnase, CA, GST, and GFP, respectively. When expressed in E. coli, each fusion protein was found in the soluble fraction after the cell extract was clarified by centrifugation at 40,000 × g for 1 h. The proteins were purified to >85% purity as judged by SDS/PAGE (Fig. 1).
Figure 1.
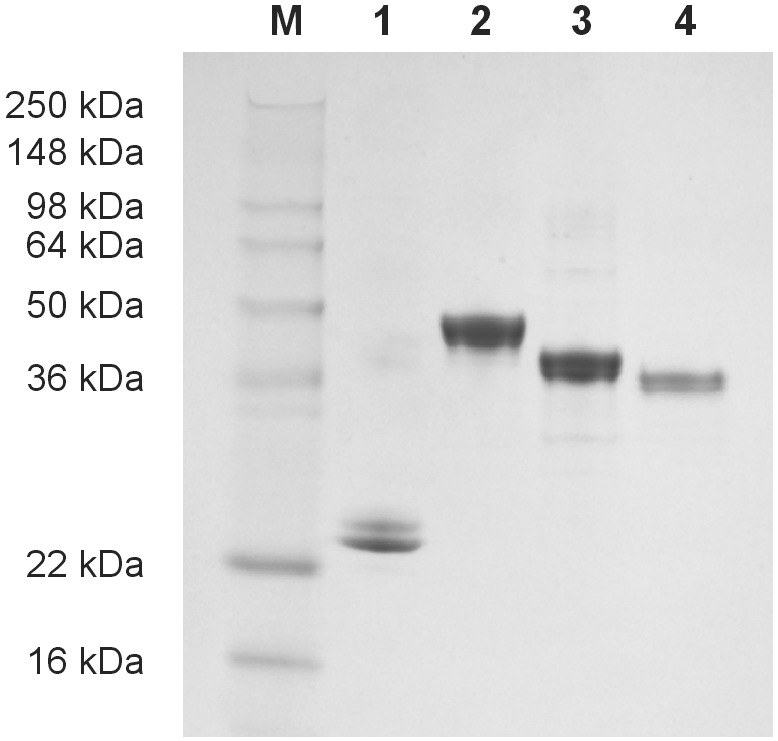
Purified chimeras of the Ure2p prion domain fused with four other proteins. The fusion proteins were expressed in E. coli, purified, and analyzed by SDS/PAGE on a 10–20% gel with Coomassie blue staining. (Lane 1) Ure21–65-barnase; (lane 2) Ure21–80-GFP; (lane 3) Ure21–65-CA; and (lane 4) Ure21–65-GST. M, molecular weight markers. For all fusion proteins, some slight proteolytic trimming was observed. Protracted incubation at 4C° (e.g., for initial filament formation) leads to further proteolytic shortening, but only the largest (full or near-full-length) molecules were incorporated into the amyloid filaments.
Amyloid Filament Formation.
All four purified fusion proteins formed visible precipitates on incubation at 4°C in a standard buffer [50 mM Tris/200 mM NaCl (pH 8.0)]. Ure21–65-GST and Ure21–80-GFP formed precipitates rapidly (overnight), whereas Ure21–65-barnase and Ure21–65-CA required 2–3 weeks. Seeding with preformed aggregates shortened this incubation time to about 24 h. The aggregates were SDS-resistant at room temperature and did not enter SDS/PAGE gels without prior heating of the samples. Aggregates of the four fusion proteins and Ure2p bound Congo red and showed gold-green birefringence (data not shown). The appearance was similar to the amyloid formed by Aβ peptide 1–28 in PBS at 4°C for 2 days. As a negative control, aggregates of heat-denatured Ure2p66–354 bound Congo red, but no birefringence was detected.
Structural Characterization of Fusion Protein Filaments.
When examined by negative-staining EM (Fig. 2), the precipitates were found to consist of filaments in each case (Ure21–65-GST also formed amorphous aggregates under some conditions). The filaments were distinctive in appearance for each fusion protein but were also polymorphic for a single fusion protein. Table 1 and Fig. 2 summarize the various types of filaments identified for the four fusion proteins as well as for Ure2p. The distribution between different types obtained for a given fusion protein was somewhat variable from preparation to preparation but all types listed were reproducibly observed.
Figure 2.

Amyloid filaments of proteins containing the Ure2p prion domain visualized by negative-staining EM. The filaments were assembled in vitro under uniform conditions from purified soluble protein and negatively stained with uranyl acetate. Some filaments exhibit well defined axial repeats: on examples, the repeats are marked with black dots. With Ure21–80-GFP (Upper Middle and Right), this periodicity gives the filaments a corkscrew appearance whose repeat distance varies from filament to filament. The diameter of unitary (A-type) filaments varies according to the construct (Table 1). Some thicker filaments (B-type) consist of two or more A-type filaments wrapped around a common axis. Ure21–65-barnase produces only B-type filaments. [Bar = 150 nm.]
Table 1.
Filament polymorphism of fusion proteins compared to Ure2p
| Protein | Type* | Diameter,† nm | Repeat length, nm | Frequency,¶ % |
|---|---|---|---|---|
| Ure21–65-barnase | B | 26 ± 2 | 180 ± 20 | 100 |
| Ure21–80-GFP | A | 19 ± 2 | 50–200‡ | 88 |
| B | 32 ± 2 | 60–200‡ | 12 | |
| Ure21–65-CA | A | 18 ± 2 | 40–60‡ | 87 |
| B | 38 ± 2 | 40–300‡ | 13 | |
| Ure21–65-GST | A | 24 ± 5 | Not detected | 100 |
| Ure2p | — | 30 ± 5 | 55 ± 10§ | — |
Type description: A = apparent single filament; B = bundle of tightly associated type A filaments.
Errors given are one standard deviation based on at least 20 measurements.
For some of the filaments no repeat was detected.
Rare event: for most filaments no repeat could be detected.
Frequencies can vary substantially between different preparations. The values given here are averages for all preparations done. In each case more than 100 filaments were counted.
The main species of filaments obtained with Ure21–65-CA and Ure21–80-GFP, which we call type A, was about 18 nm in diameter—significantly narrower than the corresponding filaments produced with Ure21–65-GST (≈24 nm) or Ure2p (≈30 nm) (cf. Fig. 2, Table 1, and ref. 24). These preparations also contained filaments of approximately twice this width (type B), which appear to be tightly associated bundles of two or three type A filaments. In some preparations of Ure21–80-GFP filaments, the type A polymers exhibited a long-range helical repeat, giving them a corkscrew appearance. The repeat distance was consistently maintained within a given filament but varied markedly from filament to filament (cf. Fig. 2 Upper/Middle).
Ure21–65-barnase filaments differed in that they were always paired or in larger aggregates (i.e., they were type B). These bundles had a more pronounced tendency to aggregate than did filaments of any other fusion protein. Moreover, they exhibited a distinctive narrowing and widening with a crossover distance of ≈180 nm (Fig. 2 Upper Left). Measuring their diameters as the width at the narrowest point (crossover) or half their width at the widest point of type B double filaments, the basic A-type filaments are the narrowest of any studied (13 nm).
Some Ure21–65-CA filaments and an occasional Ure2p filament exhibited axial periodicities, albeit less conspicuously than Ure21–80-GFP or Ure21–65-barnase and with different repeat distances (Table 1).
Activity of Fusion Proteins in Filaments.
Before measuring the activity of filaments, soluble protein was removed by repeated centrifugation and washing steps. We tested the washed filaments for residual soluble protein by native gel electrophoresis but detected no such bands in lanes heavily loaded with protein; the limit of detection was <1.5%. The activities of the various filament preparations are summarized in Table 2, normalized to the specific activity of the corresponding soluble fusion proteins. In general, we observed mild reductions in specific activity for the enzymes that may be accounted for mainly as substrate diffusion effects (see below). GFP remained fluorescent with slightly modulated spectral characteristics.
Table 2.
Relative specific activities of fusion proteins in soluble and amyloid form
| Enzyme fused to prion domain | Enzyme w/o prion domain, % | Soluble fusion protein, % | Amyloid filaments, % | Assay used for activity determination |
|---|---|---|---|---|
| Barnase | 111 | 100 | 15 ± 10 | Hydrolysis of fluoresceine-dArGdAdA-TAMRA |
| CA III | 98 | 100 | 7 ± 5 | Drop of pH in a saturated CO2 solution |
| GST | 128 | 100 | 80 | Reaction of 1-chloro-2,4-dinitrobenzene and GSH |
| GFP | ND | 100 (emission at 512 nm) | 130 (emission at 515 nm) | Fluorescence |
All data are normalized to the activity of soluble fusion protein. Standard deviation is less than 10%, if not otherwise stated, and at least four measurements were done for each enzyme preparation (two independent preparations for Ure21–80-GFP). ND, not determined.
The specific activities of Ure21–65-barnase and Ure21–65-CA decreased by a factor of about 10 in the filamentous state. Sonication of the Ure21–65-barnase filaments restored their activity more than 3-fold; this was a result of filament dispersal, not the production of monomers by sonication, the latter possibility being excluded by native gel analysis (data not shown). Thus, the size of the aggregates affects the reduction in specific activity, suggesting that substrate diffusion might underlie this effect. Both enzymes are known to work near the diffusion limit (39, 40). In both assays, it is unfortunately not possible to increase the substrate concentration to conditions where diffusion should have minimal effect. For barnase, the availability of substrate, and for CA, the solubility of CO2 in water, are limiting. However, when Ure21–65-barnase was assayed at temperatures from 15°C to 45°C, the reaction rate was found to increase with temperature about 2-fold faster for filaments than for the soluble fusion protein, affording a further strong indication that diffusion is the rate-limiting factor. In contrast, GST is not a diffusion-limited enzyme and in this case it is possible to use higher substrate concentrations (although there is a solubility limit of about 20 mM for 1-chloro-2,4-dinitrobenzene). Accordingly, Ure21–65-GST showed an activity decrease of only 20% in the filamentous state. In contrast, the amorphous aggregates of Ure21–65-GST had almost no enzymatic activity (<2.5% specific activity).
GFP does not catalyze an enzymatic reaction but absorbs and emits photons. Its fluorescence excitation and emission wavelength and intensity strongly depend on the environment near the fluorophore, and denatured GFP shows virtually no fluorescence (41, 42). In filamentous Ure21–80-GFP, the fluorescence emission maximum shifted by 3 nm from 512 to 515 nm, and the intensity increased by ≈30% (Fig. 3). However, the excitation wavelength did not change, being 501 nm in both cases.
Figure 3.
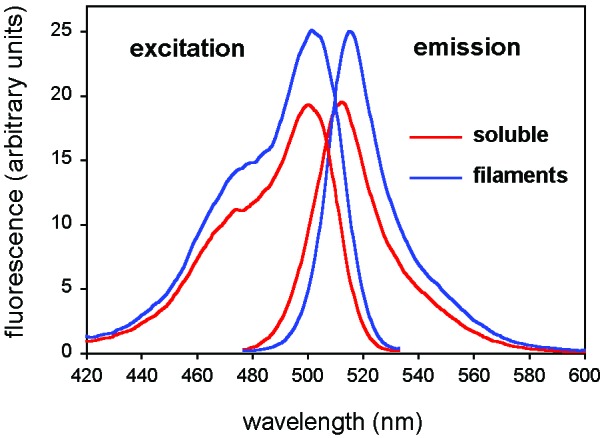
Fluorescence spectra of Ure21–80-GFP in amyloid filaments and in soluble form. The small differences between the spectra probably represent slight conformational changes in the GFP fold imposed by its incorporation into filaments, but the generally close resemblance between the spectra indicate that its fold is largely preserved.
Conformation of Fusion Proteins.
We used far-UV CD spectroscopy to compare the fusion proteins to the original (unfused) enzymes. Light scattering prevented the recording of data of comparable quality from filaments. Fig. 4 shows CD spectra of soluble Ure21–65-barnase, barnase, Ure21–65-CA, CA, Ure2p, and Ure266–354. The difference spectra have very small amplitudes in each case and show significant signals only in a minimum at around 200 nm (Fig. 4, last image). This finding indicates that the structures of the enzymes are largely unaffected by the N-terminal fusion. The difference spectra can be interpreted as deriving from the prion domain. They show that, in the soluble forms of the fusion proteins, the prion domain is largely unstructured, i.e., it has no sizeable content of β-sheet or α-helix.
Figure 4.

CD spectra of Ure2p prion domain fused with barnase and CA. In the top two images, the spectra of the soluble fusion proteins are compared with the spectra of the unfused enzymes. In the third image, spectra of Ure2p and its C-terminal domain Ure2p66–354 are compared. These spectra are affected little by the presence of the prion domain although this moiety accounts for about 35% of the mass of Ure21–65-barnase. In the last image, the difference spectra, corresponding to the prion domain contribution, are shown, including that for the prion domain in soluble Ure2p. None of the spectra indicates a substantial content of secondary structure. The differences among them may reflect small conformational differences between the prion domain in close proximity to the respective folded domains or slight changes associated with the formation of small aggregates before filament formation, which proceeds at different rates for the respective constructs.
Discussion
Ure2p could be inactivated on prion conversion by a conformational alteration of the C-terminal domain or by steric blocking of its interaction with Gln3p. We fused the Ure2 prion domain with four different proteins—CA, barnase, GST, and GFP—to test for amyloid filament formation and concomitant retention of function. Their substrates—CO2, a small oligonucleotide, the tripeptide glutathione, and light, respectively—are small enough that access to the enzyme should not be prevented by aggregation into filaments.
Filament Assembly by Ure2p-Enzyme Fusion Proteins.
A Ure21–65-GFP fusion protein can associate with Ure2p prion filaments in [URE3] cells but tends to cure the prion (15). Ure21–65 fused to the C terminus of GST forms filaments in vitro (28), and the Sup35 prion domain coupled to GFP (43) or the glucocorticoid receptor forms aggregates in vivo (44). We expected our N-terminal fusions to form filaments in vitro because Ure2p amyloid formation seems to be driven by the stacking of prion domains (24). In fact, all four fusion proteins did form filaments. Although there is little doubt that the prion domain was primarily responsible for their assembly, the C-terminal appendage affected the structure of the resulting filaments as well as their kinetics of assembly.
Filament Diameter, Helicity, and Aggregation Depend on the C-Terminal Appendage.
The fusion protein filaments vary in diameter, helical repeat length, and propensity for lateral aggregation (Fig. 2; Table 1). These properties depend on the appendage and, in particular, for diameter and aggregation, on its size. Barnase, a 12-kDa monomer, produced the narrowest filaments (≈13 nm). CA and GFP are both globular monomers of similar mass, ≈30 kDa, and their respective A-type filaments have indistinguishable diameters of ≈19 nm. (The wider B-type filaments seem to consist of two, or in some cases, three closely associated A-type filaments). This trend was continued with GST and Ure2p: their functional domains are dimers of subunits of 26 and 40 kDa, respectively, and their amyloid filaments had diameters of 24 and 30 nm. Thus, bundling aside, filament diameter increases with the size of the appendage, as also seen for filaments of Sup35p (45). This trend suggests that the packing arrangements of prion domains in the filament backbones may be similar in each case, although there cannot be a single universal arrangement as judged by the observed variations in filament structure.
Ure21–65-barnase has the smallest appendage and the strongest tendency to bundle. In fact, these filaments had to be dispersed by sonication to allow EM observation. This correlation suggests that the surface of the backbone is sticky so that aggregation is heightened when more of the backbone surface is exposed (i.e., is shielded by a smaller appendage). The extreme case is filaments of the prion domain alone that were multiply bundled (24).
The filaments are also polymorphic in helical repeat length, expressed either as an inter-crossover distance in B-type filaments (barnase), a corkscrew repeat in A-type filaments (GFP), or a more subtle repeat (CA, Ure2p). This observation was surprising, because this repeat would be expected to reflect properties of the prion domain that is common to all constructs. However, the repeat also varies substantially among filaments of a given construct—most evidently for Ure21–80-GFP (cf. Fig. 2). Nonetheless, the repeats are uniform within a given filament, suggesting that once assembly is initiated with a particular stacking geometry, the same arrangement is maintained within the growing filament. We suspect that a limited variation in stacking arrangements is possible and the one used in a given filament can be affected either by the peripheral packing of appendages or by the (fortuitous) specifics of initiation. This kind of polymorphism has been observed for amyloid filaments (46) and was also described for filaments of Sup35p (45). We conjecture that a diversity of filament geometries may be the explanation of prion “strains.” These strains are differences in the properties of isolates of scrapie (or other mammalian-transmissible spongiform encephalopathies), [PSI+], or [URE3] not attributable to sequence or modification differences in the prion protein or genetic differences in the host (47–49).
Effect of Amyloid Filament Formation on Enzymatic Activity.
Barnase and CA are near-diffusion-limited enzymes (39, 40), meaning that the rate of the enzyme reaction is determined by the rate at which substrate diffuses to the active sites. Aggregation should decrease the apparent activity of such an enzyme because the substrate has further to diffuse to reach the enzyme. An average soluble enzyme processes substrate in its neighborhood (solution volume/number of molecules). An average Ure21–65-barnase filament contains ≈1,800 molecules (U.B., unpublished results), so that, given the same number of molecules in the same volume, each filament must degrade the substrate from an 1,800-fold larger volume. The radius of this neighborhood is ≈12-fold larger than for a single molecule so that an average substrate molecule will have to diffuse ≈12-fold further to reach a filament. Thus, barnase should appear ≈12-fold less active in filaments, without its intrinsic activity having been affected. Although simplistic, this calculation yields a factor close to the observed reduction in activity, suggesting that diffusion is primarily responsible. This inference is further supported by the observations (i) of recovery of activity on filament sonication, and (ii) that increasing the temperature of the reaction had a greater effect on the activity of filaments than of the soluble enzyme.
In contrast to barnase and CA, GST is not diffusion-limited, and there was only a modest ≈20% decrease in its activity on filament formation. GFP acts on photons, and thus should be unaffected unless the amyloid formation affects its conformation. In fact, filaments of this fusion protein showed increased emission intensity and increased emission wavelength compared with the soluble form, indicating some slight alteration in the structure or environment of the GFP moiety on its incorporation into amyloid filaments.
Conformational Changes and Prion Conversion.
PrP shows pronounced increase in β-sheet structure on conversion to the scrapie form (26, 27). The mature native molecule (PrPC) has a largely α-helical C-terminal domain (residues 124–231) and an unstructured N-terminal region (residues 23–123) (50–52). Thus far, the structure of the protein in its filamentous form (PrPSc) has eluded precise determination—as with other amyloids—but at least part of the N-terminal domain assumes a β-sheet structure. It is believed that this β-sheet conformation propagates into the N-terminal α-helix of the normal form (residues 144–154) with the remainder of the C terminus unchanged in the amyloid state (see review ref. 53). However, as we find for Ure2 fusion proteins, the C-terminal structure of PrP may be essentially unchanged, with only the initially unstructured part of the molecule assuming β-sheet structure.
Amyloid Filament Formation by Ure2p Chimeras Involves Major Conformational Changes of the Prion Domain and Little if any Conformational Change in the Appended Domains.
Our differential CD measurements comparing the soluble fusion proteins with the corresponding unfused enzymes (Fig. 4) indicate an absence of regular secondary structure (α-helix or β-sheet) in the prion domain, consistent with a disordered state, as has been proposed (54–56). In contrast, amyloid filaments of the Ure21–65 prion domain were found by Raman spectroscopy to consist of β-sheets, and filaments of full-length Ure2p had enough β-sheet content to accommodate an all-β-sheet prion domain (24). Taken together, current data suggest that the prion domain is largely disordered in the soluble state of the intact proteins (Ure2p and fusions) and adopts an almost entirely β-sheet conformation in the filamentous state.
In contrast to this transformation of the prion domain, the retention of enzymatic activity by the fusion proteins in filaments implies that their structures are essentially preserved. The β-sheet amyloid of the prion domain may nonetheless propagate short distances into the N termini of the appended enzymes, because the first six residues of GFP are dispensable for activity (57). Deletion of the first 28 residues of human CA II (58% identical to the rat CA III used here) inactivates the enzyme, whereas shorter deletions of up to 24 residues destabilize but do not result in a direct loss of activity of the enzyme (58). The most N-terminal residue of barnase known to be essential is Lys-27, whose mutation affects kcat without affecting substrate binding (59). However, as barnase is only 111 residues long, it is likely that conversion of the N-terminal-long α-helical segment to β-sheet structure would affect its activity.
A conformational change in the C-terminal domain was suggested by secondary structure studies based on Raman spectroscopy of Ure2p in amyloid (24) and a study in which Ure21–65 was fused to the C terminus of GST (28). The resulting fusion protein formed amyloid filaments in vitro in which the GST moiety was estimated to have an increased β-sheet content as measured by Fourier transform infrared spectroscopy. However, both of these spectroscopic studies were limited by substantial error margins, and uncertainty as to the full extent of the prion domain: operationally, it may extend as far as residue 94 (21–23). Further, more definitive, measurements of the fusion protein conformations in filaments would be helpful in illuminating this question.
Steric Blocking Mechanism of Ure2p Inactivation.
The foregoing experiments imply that the structures of the appended enzymes are at most modulated very slightly by incorporation into filaments, to judge by the small alteration in the fluorescence of GFP and the small reductions in specific activity that are not accounted for by substrate diffusion. Does this conclusion extend also to Ure2p? In principle, the free energy of β-sheet formation in amyloids should be capable of melting some preexisting protein structures. However, the enzymes studied here evidently resist such invasion. Denaturation of Ure2p or its C-terminal domain has a ΔG of about 12 kcal/mol (54), whereas that of barnase is about 9 kcal/mol (60), and CA is about 12 kcal/mol (61). Thus, Ure2p is of similar stability as two of the model proteins used in this study and should therefore be similarly resistant to unfolding by amyloid invasion. On this basis, we propose that Ure2p is inactivated not by conformational change but rather by steric impedance of its interaction with Gln3p, on filament formation. This proposal is supported by the observation that this interaction involves residues 151–330 of Ure2p (62), which account for a substantial fraction of its surface.
The properties of natural and synthetic prions involving the Sup35p prion domain are consistent with our model for inactivation by steric blocking. The [PSI+] prion of Sup35p also involves aggregation (43, 63), possibly as a result of amyloid formation (45, 64). To promote translation termination, Sup35p must associate with Sup45p, the other subunit of the translation termination factor, and then with the translating polysomes (65, 66). An artificial prion was made by fusing the Sup35p prion domain to the glucocorticoid receptor (44). Failure of the aggregated form of the fusion protein to migrate to the nucleus because of the large size of the aggregates could explain its inactivation. In contrast, a Ure21–65-β-galactosidase fusion protein, whose substrate is a small molecule, was not inactivated in vivo on introduction of [URE3] into the cells (19).
Finally, it is also possible that the Ure2p–Gln3p interaction is itself diffusion-limited. Like the Ure2-barnase and Ure2-CA fusion proteins, the apparent decrease in Ure2p activity in [URE3] cells may be a result of the sequestration of the Ure2 protein in one part of the cytoplasm (25).
Acknowledgments
We thank Dr. Peter McPhie for making available a CD spectrometer and for guidance in its use; Drs. Herman K. Edskes and Kimberly L. Taylor (National Institutes of Health) for the Ure21–80-GFP protein; Drs. Robert Hartley, Rodney Levine, and Geumsoo Kim (National Institutes of Health) for making available the barnase and CA clones and for advice on the enzymatic assays; and Dr. Benjamin Schuler for help with Congo red staining. U.B. was supported by a fellowship from the Deutscher Akademischer Austauschdienst (DAAD).
Abbreviations
- CA
carbonic anhydrase
- GST
glutathione S-transferase
- GFP
green fluorescent protein
- EM
electron microscopy
Footnotes
This contribution is part of the special series of Inaugural Articles by members of the National Academy of Sciences elected on May 2, 2000.
References
- 1.Griffith J S. Nature (London) 1967;215:1043–1044. doi: 10.1038/2151043a0. [DOI] [PubMed] [Google Scholar]
- 2.Dickinson A G, Meikle V M H, Fraser H. J Comp Pathol. 1968;78:293–299. doi: 10.1016/0021-9975(68)90005-4. [DOI] [PubMed] [Google Scholar]
- 3.Merz P A, Somerville R A, Wisniewski H M, Iqbal K. Acta Neuropathol. 1981;54:63–74. doi: 10.1007/BF00691333. [DOI] [PubMed] [Google Scholar]
- 4.Prusiner S B, McKinley M P, Bowman K A, Bendheim P E, Bolton D C, Groth D F, Glenner G G. Cell. 1983;35:349–358. doi: 10.1016/0092-8674(83)90168-x. [DOI] [PubMed] [Google Scholar]
- 5.Bueler H, Aguzzi A, Sailer A, Greiner R-A, Autenried P, Aguet M, Weissmann C. Cell. 1993;73:1339–1347. doi: 10.1016/0092-8674(93)90360-3. [DOI] [PubMed] [Google Scholar]
- 6.Bolton D C, McKinley M P, Prusiner S B. Science. 1982;218:1309–1311. doi: 10.1126/science.6815801. [DOI] [PubMed] [Google Scholar]
- 7.Prusiner S B. Prion Biology and Diseases. Plainview, NY: Cold Spring Harbor Lab. Press; 1999. [Google Scholar]
- 8.Kirschner D A, Damas A, Teplow D. J Struct Biol. 2000;130:101–383. doi: 10.1006/jsbi.2000.4293. [DOI] [PubMed] [Google Scholar]
- 9.Lacroute F. J Bacteriol. 1971;106:519–522. doi: 10.1128/jb.106.2.519-522.1971. [DOI] [PMC free article] [PubMed] [Google Scholar]
- 10.Wickner R B. Science. 1994;264:566–569. doi: 10.1126/science.7909170. [DOI] [PubMed] [Google Scholar]
- 11.Wickner R B, Taylor K L, Edskes H K, Maddelein M-L, Moriyama H, Roberts B T. J Struct Biol. 2000;130:310–322. doi: 10.1006/jsbi.2000.4250. [DOI] [PubMed] [Google Scholar]
- 12.Drillien R, Aigle M, Lacroute F. Biochem Biophys Res Commun. 1973;53:367–372. doi: 10.1016/0006-291x(73)90671-2. [DOI] [PubMed] [Google Scholar]
- 13.Cooper T G, Ferguson D, Rai R, Bysani N. J Bacteriol. 1990;172:1014–1018. doi: 10.1128/jb.172.2.1014-1018.1990. [DOI] [PMC free article] [PubMed] [Google Scholar]
- 14.Coschigano P W, Magasanik B. Mol Cell Biol. 1991;11:822–832. doi: 10.1128/mcb.11.2.822. [DOI] [PMC free article] [PubMed] [Google Scholar]
- 15.Edskes H K, Gray V T, Wickner R B. Proc Natl Acad Sci USA. 1999;96:1498–1503. doi: 10.1073/pnas.96.4.1498. [DOI] [PMC free article] [PubMed] [Google Scholar]
- 16.Cardenas M E, Cutler N S, Lorenz M C, Di Como C J, Heitman J. Genes Dev. 1999;13:3271–3279. doi: 10.1101/gad.13.24.3271. [DOI] [PMC free article] [PubMed] [Google Scholar]
- 17.Beck T, Hall M N. Nature (London) 1999;402:689–692. doi: 10.1038/45287. [DOI] [PubMed] [Google Scholar]
- 18.Hardwick J S, Kuruvilla F G, Tong J K, Shamji A F, Schreiber S L. Proc Natl Acad Sci USA. 1999;96:14866–14870. doi: 10.1073/pnas.96.26.14866. [DOI] [PMC free article] [PubMed] [Google Scholar]
- 19.Masison D C, Wickner R B. Science. 1995;270:93–95. doi: 10.1126/science.270.5233.93. [DOI] [PubMed] [Google Scholar]
- 20.Masison D C, Maddelein M-L, Wickner R B. Proc Natl Acad Sci USA. 1997;94:12503–12508. doi: 10.1073/pnas.94.23.12503. [DOI] [PMC free article] [PubMed] [Google Scholar]
- 21.Maddelein M-L, Wickner R B. Mol Cell Biol. 1999;19:4516–4524. doi: 10.1128/mcb.19.6.4516. [DOI] [PMC free article] [PubMed] [Google Scholar]
- 22.Bousset L, Beirhali H, Janin J, Melki R, Morera S. Structure (London) 2001;9:39–46. doi: 10.1016/s0969-2126(00)00553-0. [DOI] [PubMed] [Google Scholar]
- 23.Umland T C, Taylor K L, Rhee S, Wickner R B, Davies D R. Proc Natl Acad Sci USA. 2001;98:1459–1464. doi: 10.1073/pnas.041607898. [DOI] [PMC free article] [PubMed] [Google Scholar]
- 24.Taylor K L, Cheng N, Williams R W, Steven A C, Wickner R B. Science. 1999;283:1339–1343. doi: 10.1126/science.283.5406.1339. [DOI] [PubMed] [Google Scholar]
- 25.Speransky V, Taylor K L, Edskes H K, Wickner R B, Steven A. J Cell Biol. 2001;153:1327–1335. doi: 10.1083/jcb.153.6.1327. [DOI] [PMC free article] [PubMed] [Google Scholar]
- 26.Caughey B W, Dong A, Bhat K S, Ernst D, Hayes S F, Caughey W S. Biochemistry. 1991;30:7672–7680. doi: 10.1021/bi00245a003. [DOI] [PubMed] [Google Scholar]
- 27.Pan K-M, Baldwin M, Nguyen J, Gasset M, Serban A, Groth D, Mehlhorn I, Huang Z, Fletterick R J, Cohen F E, Prusiner S B. Proc Natl Acad Sci USA. 1993;90:10962–10966. doi: 10.1073/pnas.90.23.10962. [DOI] [PMC free article] [PubMed] [Google Scholar]
- 28.Schlumpberger M, Willie H, Baldwin M A, Butler D A, Herskowitz I, Prusiner S B. Protein Sci. 2000;9:440–451. doi: 10.1110/ps.9.3.440. [DOI] [PMC free article] [PubMed] [Google Scholar]
- 29.Okorokov A L, Hartley R W, Panov K I. Protein Expression Purif. 1994;5:547–552. doi: 10.1006/prep.1994.1075. [DOI] [PubMed] [Google Scholar]
- 30.Kim G, Slengut J, Levine R L. Arch Biochem Biophys. 2000;377:334–340. doi: 10.1006/abbi.2000.1793. [DOI] [PubMed] [Google Scholar]
- 31.Cormack B P, Valdivia R H, Falkow S. Gene. 1996;173:33–38. doi: 10.1016/0378-1119(95)00685-0. [DOI] [PubMed] [Google Scholar]
- 32.Hartley R W. Methods Enzymol. 2001;341:599–611. doi: 10.1016/s0076-6879(01)41179-7. [DOI] [PubMed] [Google Scholar]
- 33.Zelenko O, Neumann U, Brill W, Pieles U, Moser H E, Hofsteenge J. Nucleic Acids Res. 1994;22:2731–2739. doi: 10.1093/nar/22.14.2731. [DOI] [PMC free article] [PubMed] [Google Scholar]
- 34.Kelemen B R, Klink T A, Behlke M A, Eubanks S R, Leland P A, Raines R T. Nucleic Acids Res. 1999;27:3696–3701. doi: 10.1093/nar/27.18.3696. [DOI] [PMC free article] [PubMed] [Google Scholar]
- 35.Habig W H, Pabst M J, Jakoby W B. J Biol Chem. 1974;249:7130–7139. [PubMed] [Google Scholar]
- 36.Pace C N, Vajdos F, Fee L, Grimsley G, Gray T. Protein Sci. 1995;4:2411–2423. doi: 10.1002/pro.5560041120. [DOI] [PMC free article] [PubMed] [Google Scholar]
- 37.Ward W W, Cody C, Hart R C, Cormier M J. Photochem Photobiol. 1980;31:611–615. [Google Scholar]
- 38.Ward W W. In: Bioluminescence and Chemiluminescence: Basic Chemistry and Analytic Applications. DeLuca M, McElroy D W, editors. New York: Academic; 1981. pp. 235–242. [Google Scholar]
- 39.Jonsson B, Wennerstrom H. Biophys Chem. 1978;7:285–292. doi: 10.1016/0301-4622(78)85005-4. [DOI] [PubMed] [Google Scholar]
- 40.Day A G, Parsonage D, Ebel S, Brown T, Fersht A R. Biochemistry. 1992;31:6390–6395. doi: 10.1021/bi00143a005. [DOI] [PubMed] [Google Scholar]
- 41.Ward W W, Bokman S H. Biochemistry. 1982;21:4535–4540. doi: 10.1021/bi00262a003. [DOI] [PubMed] [Google Scholar]
- 42.Prendergast F G. Methods Cell Biol. 1999;58:1–18. doi: 10.1016/s0091-679x(08)61945-7. [DOI] [PubMed] [Google Scholar]
- 43.Patino M M, Liu J-J, Glover J R, Lindquist S. Science. 1996;273:622–626. doi: 10.1126/science.273.5275.622. [DOI] [PubMed] [Google Scholar]
- 44.Li L, Lindquist S. Science. 2000;287:661–664. doi: 10.1126/science.287.5453.661. [DOI] [PubMed] [Google Scholar]
- 45.Glover J R, Kowal A S, Shirmer E C, Patino M M, Liu J-J, Lindquist S. Cell. 1997;89:811–819. doi: 10.1016/s0092-8674(00)80264-0. [DOI] [PubMed] [Google Scholar]
- 46.Goldsbury C S, Wirtz S, Müller S A, Sunderji S, Wicki P, Aebi U, Frey P. J Struct Biol. 2000;130:217–231. doi: 10.1006/jsbi.2000.4259. [DOI] [PubMed] [Google Scholar]
- 47.Fraser H. J Comp Pathol. 1973;83:29–40. doi: 10.1016/0021-9975(73)90024-8. [DOI] [PubMed] [Google Scholar]
- 48.Derkatch I L, Chernoff Y O, Kushnirov V V, Inge-Vechtomov S G, Liebman S W. Genetics. 1996;144:1375–1386. doi: 10.1093/genetics/144.4.1375. [DOI] [PMC free article] [PubMed] [Google Scholar]
- 49.Schlumpberger M, Prusiner S B, Herskowitz I. Mol Cell Biol. 2001;21:7035–7046. doi: 10.1128/MCB.21.20.7035-7046.2001. [DOI] [PMC free article] [PubMed] [Google Scholar]
- 50.Riek R, Hornemann S, Wider G, Billeter M, Glockshuber R, Wuthrich K. Nature (London) 1996;382:180–182. doi: 10.1038/382180a0. [DOI] [PubMed] [Google Scholar]
- 51.James T L, Liu H, Ulyanov N B, Farr-Jones S, Zhang H, Donne D G, Kaneko K, Groth D, Mehlhorn I, Prusiner S B, Cohen F E. Proc Natl Acad Sci USA. 1997;94:10086–10091. doi: 10.1073/pnas.94.19.10086. [DOI] [PMC free article] [PubMed] [Google Scholar]
- 52.Riek R, Hornemann S, Wider G, Glockshuber R, Wuthrich K. FEBS Lett. 1997;413:282–288. doi: 10.1016/s0014-5793(97)00920-4. [DOI] [PubMed] [Google Scholar]
- 53.Alonso D O V, Daggett V. Adv Protein Chem. 2001;57:107–137. doi: 10.1016/s0065-3233(01)57020-5. [DOI] [PubMed] [Google Scholar]
- 54.Perrett S, Freeman S J, Butler P J G, Fersht A R. J Mol Biol. 1999;290:331–345. doi: 10.1006/jmbi.1999.2872. [DOI] [PubMed] [Google Scholar]
- 55.Thual C, Bousset L, Komar A A, Walter S, Buchner J, Cullin C, Melki R. Biochemistry. 2001;40:1764–1773. doi: 10.1021/bi001916l. [DOI] [PubMed] [Google Scholar]
- 56.Galani D, Fersht A R, Perrett S. J Mol Biol. 2002;315:213–227. doi: 10.1006/jmbi.2001.5234. [DOI] [PubMed] [Google Scholar]
- 57.Li X, Zhang G, Ngo N, Zhao X, Kain S R, Huang C-C. J Biol Chem. 1997;272:28545–28549. doi: 10.1074/jbc.272.45.28545. [DOI] [PubMed] [Google Scholar]
- 58.Aronsson G, Martensson L G, Carlsson U, Jonsson B H. Biochemistry. 1995;34:2153–2162. doi: 10.1021/bi00007a008. [DOI] [PubMed] [Google Scholar]
- 59.Mossakowska D E, Nyberg K, Fersht A R. Biochemistry. 1989;28:3843–3850. doi: 10.1021/bi00435a033. [DOI] [PubMed] [Google Scholar]
- 60.Serrano L, Kellis J T, Cann P, Matouschek A, Fersht A R. J Mol Biol. 1992;224:783–804. doi: 10.1016/0022-2836(92)90562-x. [DOI] [PubMed] [Google Scholar]
- 61.Cupo P, El-Deiry W, Whitney P L, Awad W M. J Biol Chem. 1980;255:10828–10833. [PubMed] [Google Scholar]
- 62.Kulkarni A A, Abul-Hamd A T, Rai R, El Berry H, Cooper T G. J Biol Chem. 2001;276:32136–32144. doi: 10.1074/jbc.M104580200. [DOI] [PMC free article] [PubMed] [Google Scholar]
- 63.Paushkin S V, Kushnirov V V, Smirnov V N, Ter-Avanesyan M D. EMBO J. 1996;15:3127–3134. [PMC free article] [PubMed] [Google Scholar]
- 64.King C-Y, Tittmann P, Gross H, Gebert R, Aebi M, Wuthrich K. Proc Natl Acad Sci USA. 1997;94:6618–6622. doi: 10.1073/pnas.94.13.6618. [DOI] [PMC free article] [PubMed] [Google Scholar]
- 65.Zhouravleva G, Frolova L, LeGoff X, LeGuellec R, Inge-Vectomov S, Kisselev L, Philippe M. EMBO J. 1995;14:4065–4072. doi: 10.1002/j.1460-2075.1995.tb00078.x. [DOI] [PMC free article] [PubMed] [Google Scholar]
- 66.Stansfield I, Jones K M, Kushnirov V V, Dagkesamanskaya A R, Poznyakovski A I, Paushkin S V, Nierras C R, Cox B S, Ter-Avanesyan M D, Tuite M F. EMBO J. 1995;14:4365–4373. doi: 10.1002/j.1460-2075.1995.tb00111.x. [DOI] [PMC free article] [PubMed] [Google Scholar]