

Abstract
A completely automatic computerized technique for the quantitative estimation of the deamidation rates of any protein for which the three-dimensional structure is known has been developed. Calculations of the specific deamidation rates of 170,014 asparaginyl residues in 13,335 proteins have been carried out. The calculated values have good quantitative reliability when compared with experimental measurements. These rates demonstrate that deamidation may be a biologically relevant phenomenon in a remarkably large percentage of proteins.
Keywords: asparaginyl residue deamidation‖coefficient of deamidation‖deamidation index
Changes in peptide and protein structure through the spontaneous nonenzymatic deamidation of glutaminyl and asparaginyl residues have been observed in many in vitro and in vivo experiments. Rates of deamidation of individual amide residues depend upon primary sequence, three-dimensional (3D) structure, and solution properties such as pH, temperature, ionic strength, and buffer ions (1–8).
Deamidation at neutral pH introduces a negative charge at the deamidation site and sometimes also leads to β isomerization. These alterations in structure affect the properties of peptides and proteins in chemically and biologically important ways. It has been suggested that in vivo deamidation of proteins serves as a molecular timer of biological events and as a mechanism for postsynthetic production of unique proteins of biological significance (2, 4, 6, 7, 9, 10). In the case of in vivo protein turnover, the use of deamidation as a molecular timer has been experimentally demonstrated (11–13).
Progress in the understanding of deamidation and its potential biological importance has been impeded by the lack of reliable and useful experimental and theoretical information about the deamidation of most proteins. Experimental studies of the deamidation of individual proteins are laborious and time consuming. Until recently, there were no other means by which to estimate the deamidation rates of specific amides.
The deamidation rates of individual Asn residues in a protein can now be reliably predicted as a result of two recent advances. First, the sequence-controlled Asn deamidation rates of most of the 400 possible near-neighbor combinations in pentapeptide models have been measured (10); the deamidation rates of a representative group of Gln pentapeptides have been determined (N.E.R. & A. B. Robinson, unpublished work); and the relevance of these rate libraries has been established (14). Second, these rates and the 3D structures of proteins with well characterized deamidations have been combined to produce a computation method that correctly predicts the deamidation rates of most Asn residues for which the 3D structure is known (15). This method has been shown to be ≈95% reliable in predicting relative deamidation rates of Asn residues within a single protein, and it is also useful for the prediction of absolute deamidation rates. It has been used to estimate the deamidation rates of 1,371 asparaginyl residues in 126 human proteins (16).
This semiempirical method for estimating deamidation rates (15) depends, however, upon manual observations of a set of 3D characteristics of the protein structure near each amide residue in the protein. These observations are laborious and subject to human error. In using this method, approximately 4 h of work by an experienced investigator with a computer-based 3D-structure viewer is required to determine the deamidation rates of the amides in a typical protein.
The computerized deamidation estimation method reported herein automatically determines essentially the same 3D characteristics as the manual method, with some significant refinements. It is, however, much faster, more reliable, and more convenient. During 4 h of continuous computation with a Pentium IV computer, the deamidation rates for the entire Brookhaven 3D protein database of 13,335 amide-containing protein structures with 170,014 asparaginyl residues have been calculated by this technique. These estimated deamidation rates, which include all amide-containing protein structures in the Brookhaven Protein Data Bank as of April 2001, have been deposited at www.deamidation.org. The computer program is also freely available at this Internet site, so investigators can compute these values for additional proteins.
These calculations provide new insights into the nature of protein deamidation. Moreover, this new method contains subroutines for automatic refinement of the calculation procedure as new experimental deamidation rates become available and also allows automatic calculation of additional estimated protein deamidation rates as new 3D structures are determined.
Materials and Methods
Calculation Method.
Deamidation coefficients (CD) for individual amides and deamidation indexes (ID) for individual proteins were determined by a fully computerized procedure similar to the manual technique reported (15). Some parts of the calculation method were refined, and all of the adjustable parameters were automatically optimized. The computer program was written with Microsoft C++. The program uses Swiss Protein Data Bank Viewer to detect α-helices and β-sheets. The calculations were made by means of a Pentium IV computer with Microsoft WINDOWS 2000.
The deamidation coefficient, CD, is defined as CD = (0.01) (t1/2)[ef(Cm,CSn,Sn)], where t1/2 is the primary structure half-life (10, 14), Cm is a structure proportionality factor, CSn is the 3D structure coefficient for the nth structure observation, Sn is that observation, and f(Cm,CSn,Sn) = Cm[(CS1)(S1) + (CS2)(S2) + (CS3)(S3) − (CS4,5)(S4)/(S5) + (CS6)(S6) + (CS7)(S7) + (CS8)(S8) + (CS9)(S9) + (CS10)(1 − S10) + (CS11)(5 − S11) + (CS12)(5 − S12)]. The structure observations, Sn, are those that impede deamidation, including hydrogen bonds, α-helices, β-sheets, and peptide inflexibilities.
For Asn in an α-helical region:
S1 = distance in residues inside the α-helix from the NH2 end, where S1 = 1 designates the end residue in the helix, 2 is the second residue, and 3 is the third residue. If the position is 4 or greater, S1 = 0.
S2 = distance in residues inside the α-helix from the COOH end, where S1 = 1 designates the end residue in the helix, 2 is the second residue, and 3 is the third residue. If the position is 4 or greater or S1 ≠ 0, then S2 = 0.
S3 = 1 if Asn is designated as completely inside the α-helix because it is 4 or more residues from both ends. If the Asn is completely inside, S3 = 1, S1 = 0, and S2 = 0. If S1 ≠ 0 or S2 ≠ 0, then S3 = 0.
For flexibility of a loop including Asn between two adjacent anti-parallel β-sheets:
S4 = number of residues in the loop. If the flexible region is not bounded on both sides by β-sheets with at least four hydrogen bonds between opposite NH and C=O groups, then this parameter is not used, so S4 = 0.
S5 = number of hydrogen bonds in the flexible region + 1.
For hydrogen bonds:
S6 = the number of hydrogen bonds to the Asn sidechain C=O group. Acceptable values are 0, 1, and 2. Hydrogen bonds that are used in S8 are not counted.
S7 = the number of hydrogen bonds to the Asn sidechain NH2 group. Acceptable values are 0, 1, and 2.
S8 = the number of hydrogen bonds to the backbone N in the peptide bond on the COOH side of Asn. Acceptable values are 0 and 1. This nitrogen is used in the five-membered succinimide ring intermediate.
S9 = the number of other hydrogen bonds that need to be broken to form the succinimide ring. The number of these bonds is estimated by first determining the angle through which the amide residue bond between the α carbon and the backbone carbonyl carbon would need to be rotated to align the backbone in the optimum configuration for forming the succinimide ring. This angle is then divided by 180° to give a number R between 0 and 1, where 0 is perfectly aligned and 1 is the worst alignment, requiring the greatest change in backbone position.
Residues that require greater chain movement to deamidate usually must break hydrogen bonds farther from the amide residue, so all hydrogen bonds are counted that are less than (R)(CR) from the Cα of the amide residue to either hydrogen bond atom and that are no more than five residues along the chain from the amide. The value of CR was optimized at 4.97 Å. Hydrogen bonds that are counted in S6, S7, or S8 are excluded from S9.
For Asn situated so that no α-helix, β-sheet, or disulfide bridge structure is between the Asn and the end of the peptide chain, and the Asn is 20 residues or less from the chain end:
S10 = 1 if the number of residues between the Asn and the nearest such structure is 3 or more. If the number of intervening residues is 2, 1, or 0, or if the Asn is not between a structure and the chain end, then S10 = 0. This parameter accounts for extra flexibility of the protein chain near the end. It is assumed that, in addition to the factors specifically included in these Sn, residues in the middle of proteins are additionally restrained, and that this part of the restraint is removed for amides near the end of the chain.
If the Asn lies near in sequence to any α-helix, β-sheet, or disulfide bridge structures:
S11 = the number of residues between the Asn and the structure on the NH2 side, up to a maximum of 5. Values of 0, 1, 2, 3, 4, and 5 are acceptable.
S12 = the number of residues between the Asn and the structure on the COOH side, up to a maximum of 5. Values of 0, 1, 2, 3, 4, and 5 are acceptable.
Hydrogen bonds between the usual atoms were assumed if the bond length was 4.1 Å or less, and the angle of the hydrogen bond was no more than 180° greater than the optimum nor 55° less than the optimum. This 4.1 Å value was determined by optimization and is greater than normally accepted for a hydrogen bond. The extra length may be caused by hydrogen-bond interactions that occur at different times because of flexibility in the protein. In most cases, the protein backbone must move to some extent to form the succinimide ring. If hydrogen bonds were assigned beyond the space available to accommodate the van der Waals radius of all of the hydrogen atoms, then the surplus bonds were rejected. For these rejections, the longest bonds with the most strained angles were removed.
X-ray crystal structures do not usually give hydrogen atom positions. For consistency, therefore, the hydrogen atom coordinates in NMR and neutron diffraction structures were not used.
The presence of hydrogen atoms was assumed wherever hydrogen atoms are ordinarily found in protein structures. In some cases, particularly –OH and –NH2 groups, the orientation of the hydrogen atoms is uncertain. It was assumed that they would be positioned, where possible, to form the best hydrogen bonds.
The number of hydrogen atoms and donor groups available limits the number of hydrogen bonds. For example, an –OH group cannot have more than one hydrogen bond with atoms that are only hydrogen-bond acceptors. In cases where more than one donor or acceptor was available for forming a particular hydrogen bond, the one with the best characteristics was chosen. This choice involved a compromise between the optimum bond angle and optimum bond length.
All primary structure t1/2 values used were those published (10, 14), except for sequences that have not been experimentally measured. Those included Asn with carboxyl-side Pro, Asn, Gln, or residues that are not among the ordinary 20, Asn without a free amide as a result of binding to metals or other moieties, and other unusual sequences. Estimates of t1/2 values for these were approximated from those measured (10, 14).
The approximated values were: Asn-Pro, 500; Asn-Hyp, 500; Asn-Asn, 40; Asn-Gln, 60; bound Asn, 500; Asn-Xxx, where Xxx is carboxyl terminal, 1/2 of pentapeptide value; Yyy-Asn-Xxx, where Yyy is not one of the ordinary 20 amino acid residues but is instead Mse, Ini, Llp, Pca, Cgu, Tyq, Tyy, Tpq, Cea, or Cme, mean value for the ordinary amino acids at Yyy (10); Yyy-Asn-Xxx, where Xxx is Tyq, Tyy, or Tpq, same value as for Tyr; Xxx is Cea or Cme, same value as for Cys; where Xxx is Ini, same value as for Arg; Asn as carboxylamide terminal, 40; Asn as carboxyl terminal, 500; Asn as amino terminal, 2/3 pentapeptide values; and Xxx-Asn-Mse, 4/3 Met value.
Structures for 22 proteins from the Brookhaven Protein Data Bank combined with their relative Asn instabilities (15, 16) were used in the optimization of the coefficients Cm and CSn. These structures included all of the Asn residues in rabbit aldolase chain A, 1ADO; human angiogenin chain A, 1B1I; pig c-amp-dependent protein kinase chain A and chain I, 1CDK; mouse epidermal growth factor, 1EGF; rat fatty acid binding protein, 1LFO; human fibroblast growth factor chain A, 2AFG; Aspergillus awamorii glucoamylase, 3GLY; human growth hormone, IHGU; 1HGU; Escherichia coli hpr-phosphocarrier protein, 1HDN; human insulin chain A and chain B, 2HIU; mouse interleukin 1β, 2MIB; chicken lysozyme chain A, 1E8L; bovine ribonuclease A chain A, 1AFK; Ustilago sphaerogena ribonuclease U2, 1RTU; bovine seminal ribonuclease chain A, 11BG; human thioltransferase, 1JHB; human triosephosphate isomerase chain A, 1HTI; bovine trypsin, 1MTW; bovine DNase chain A, 2DNJ; and human vascular endothelial growth factor chain A, 2VPF. Horse heart cytochrome c (2GIW) was used, except for Lys-Asn 54-Lys, which is reported to be accelerated by a 3D structure change caused by an earlier single deamidation (11, 12). No 3D structure is available for this singly deamidated form. Human hypoxanthine guanine phosphoribosyltransferase chain A (1BZY) was used except for Lys-Asn 106 Asp, which is held by 3D structure in exact position for the succinimide intermediate in the deamidation reaction and is, therefore, accelerated.
The coefficients Cm and CSn were optimized by means of the deamidation resolving power (Dp) method (15, 17). The optimized values were Cm = 0.48, CS1 = 1.0, CS2 = 3.1, CS3 = 10, CS4,5 = 1.5, CS6 = 0, CS7 = 0.5, CS8 = 3.2, CS9 = 1.9, CS10 = 2.0, CS11 = 0.26, and CS12 = 0.62. The DP was found to be 96.5%.
The protein deamidation index is defined as ID = [Σ(CDn)−1]−1, where CDn is CD for the nth Asn residue. Therefore, (100)(ID) is an estimate of the initial deamidation halftime for the protein with all Asn residues considered.
The coefficients of deamidation, CDn, and deamidation index, ID, for each protein were calculated by means of computer programs that are available for use at www.deamidation.org. These can be used for any new protein in the following way.
Primary sequence data for the protein in the format of the “SEQRES” section of the Brookhaven Protein Data Bank and 3D data—including the x, y, and z coordinates for each atom—in the format of the “ATOM” and “CONECT” sections of Brookhaven Protein Data Bank are automatically computer-entered into the program. No manual entry of data are required. Note that if no coordinates are entered for the atoms of a particular residue, it is assumed that this residue is unrestrained and does not participate in a unique 3D structure, which can modulate deamidation. After the data are entered, the computer program calculates the CDn and ID values for the protein. The program output includes these values and also the values of Sn for each amide residue, so that the investigator can know the details about the calculation of CDn for each amide.
This calculation method is conceptually general. The molecular rearrangements necessary for formation of a cyclic deamidation intermediate are usually impeded by protein structure. Those structural impediments have been parameterized. The success of the method does not, however, prove the cyclic imide reaction mechanism, because other mechanisms may be similarly impeded.
Only relative deamidation rates, in the form of reports about which amides have been observed to be deamidated in 22 proteins under a wide variety of conditions, have been used to calibrate the method by optimizing the coefficients, Cm and CSn. No rate measurements were used for the optimization. Rate of deamidation measurements in 13 proteins at 37°C were used only to test and verify the method (16). Nine of these 13 proteins are in the set of 22 coefficient calibration proteins, and 4 are not.
At no time in its development was this calculation method adapted to any specific aspect of the structures of these 26 individual proteins. The method fails, therefore, for Asn-106 of human hypoxanthine guanine phosphoribosyltransferase chain A, which is a rare example in which deamidation is actually accelerated by 3-D structure. In this case, Asn-106 is held by 3-D structure in exactly the correct position for the deamidation reaction, so the reaction is enhanced. Although a term could be added to the calculation method to allow for this, it would detract from the generality of the method, and Asn-106 is the only case of this type presently known.
Results and Discussion
The most important results of this work are in the estimated deamidation rates of individual proteins. These calculations provide reliable estimates of instability with respect to deamidation for the Asn residues in all of the amide-containing proteins in the Brookhaven protein 3D structure database and are easily performed for any other protein for which a 3D structure becomes available.
In addition, these calculations provide some general insights about deamidation and its prevalence in proteins, as illustrated in Fig. 1, Fig. 2, Fig. 3, Table 1, and Table 2.
Figure 1.
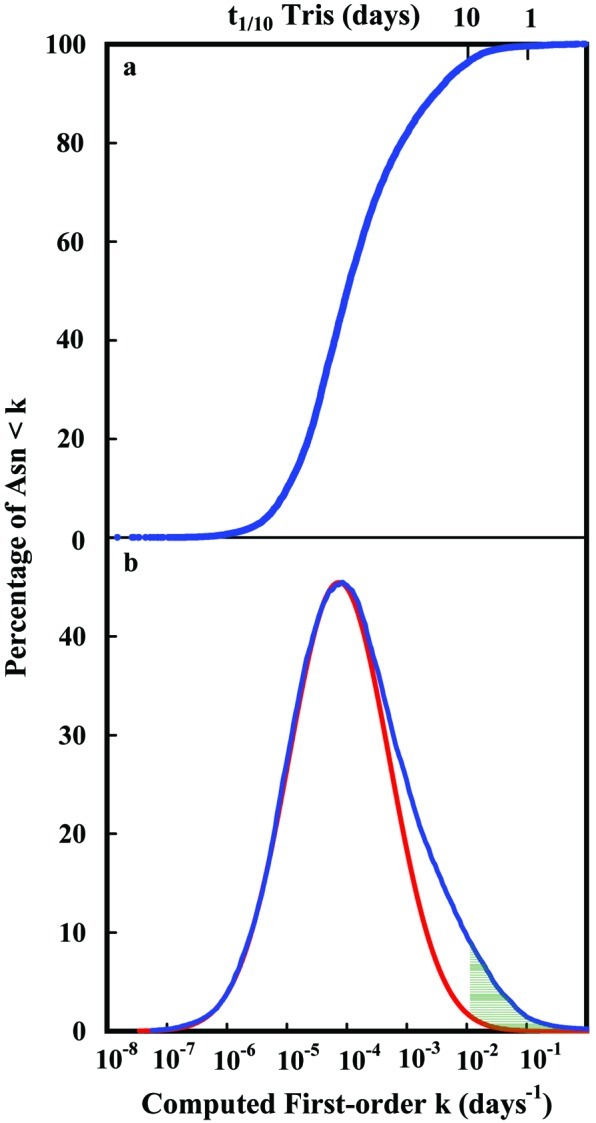
(a) Cumulative distribution function of the calculated first-order rate constants for deamidation of the 131,809 Asn residues in 10,369 proteins used in Table 1. Asn residues involved in the initial deamidation of these proteins are a relatively small part of the complete set. The computed percentage of the Asn residues that are 1/10 deamidated after 10 days in pH 7.4, 37°C, 0.15 M Tris⋅HCl is 4%, as shown. (b) Differentiated values of the distribution function in a showing the special class of unstable Asn residues present in these proteins. Also shown with a red line is a Gaussian function that fits the distribution function, except for that part arising from the especially unstable Asn residues. The shaded area contains those Asn residues computed to be 1/10 or more deamidated in 10 days in pH 7.4, 37°C, 0.15 M Tris⋅HCl.
Figure 2.
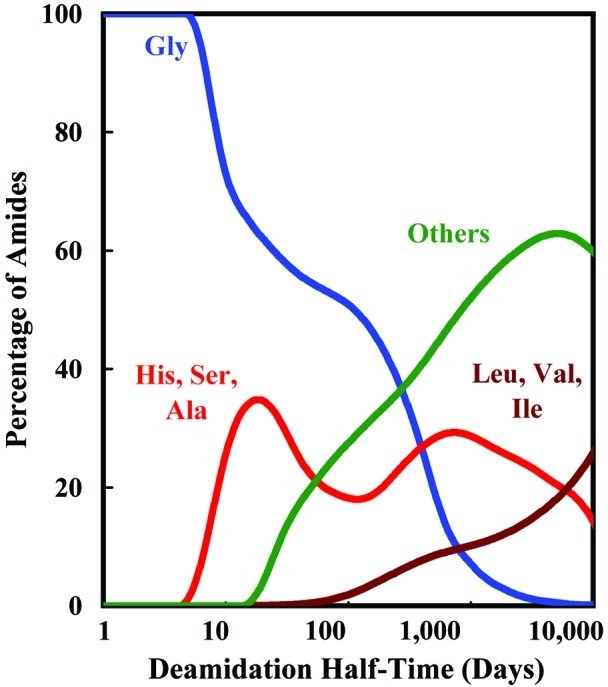
Percentage of deamidating amides of the 131,809 Asn residues in 10,369 proteins used in Table 1 vs. deamidation half-time for Asn-Gly sequences; Asn-His, Asn-Ser, and Asn-Ala sequences; all sequences other than Asn-Gly, Asn-His, Asn-Ser, Asn-Ala, Asn-Leu, Asn-Val, and Asn-Ile; and Asn-Leu, Asn-Val, and Asn-Ile sequences. As deamidation halftime increases, more sequences contribute to deamidation. Except for a small number of especially sterically unhindered Asn residues, these deamidation halftimes strongly depend upon primary and 3D structures. These values are estimated for pH 7.4, 37°C, 0.15 M Tris⋅HCl and would be faster in vivo at 37°C.
Figure 3.

Deamidation resolving power, Dp vs. 3D structure coefficient Cm for 192 Asn residues in 22 proteins. The optimum value of Cm = 0.48 provides the most reliable estimated relative deamidation rates as compared with the experimental values for these proteins.
Table 1.
Percentages of residues and proteins in asparagine deamidation ranges
| Timer | Amides, cumulative no. | Amides, % | Proteins, % |
|---|---|---|---|
| Tris 1/2 time, days | |||
| <1 | 20 | 0.02 | 0.19 |
| <2.5 | 162 | 0.12 | 1.5 |
| <5 | 473 | 0.36 | 3.7 |
| <10 | 695 | 0.53 | 5.6 |
| <25 | 1659 | 1.3 | 13 |
| <50 | 3591 | 2.7 | 25 |
| <100 | 7080 | 5.4 | 41 |
| Phos. 1/10 time, days | |||
| <1 | 538 | 0.41 | 4.3 |
| <2.5 | 1101 | 0.84 | 8.8 |
| <5 | 2208 | 1.7 | 17 |
| <10 | 5029 | 3.8 | 32 |
| <25 | 10798 | 8.2 | 52 |
| <50 | 16340 | 12 | 64 |
| <100 | 23652 | 18 | 75 |
Table 2.
Percentages of carboxyl side residues in asparagine deamidation ranges
| Residue | %, <5 days | %, <10 days | %, <25 days | %, <100 days |
|---|---|---|---|---|
| Tris 1/2 time | ||||
| Gly | 4.2 | 6.0 | 11 | 38 |
| His | 0.46 | 2.4 | 7.7 | |
| Ser | 0.19 | 2.3 | 9.8 | |
| Ala | 1.3 | 5.6 | ||
| Cys | 0.23 | 1.1 | ||
| Thr | 0.10 | 2.0 | ||
| Asp | 0.060 | 4.8 | ||
| Lys | 0.014 | 1.8 | ||
| Glu | 3.0 | |||
| Gln | 1.7 | |||
| Arg | 1.6 | |||
| Asn | 1.5 | |||
| Phe | 1.1 | |||
| Met | 0.93 | |||
| Tyr | 0.89 | |||
| Trp | 0.37 | |||
| Leu | 0.33 | |||
| Phosphate 1/10 time | ||||
| Gly | 14 | 27 | 53 | 87.3 |
| His | 3.6 | 5.9 | 12 | 33.2 |
| Ser | 2.9 | 8.1 | 14 | 34.6 |
| Ala | 1.9 | 4.2 | 7.2 | 17.9 |
| Cys | 0.23 | 0.84 | 2.6 | 7.3 |
| Thr | 0.14 | 1.5 | 4.2 | 12.3 |
| Asp | 0.93 | 1.9 | 6.8 | 19.0 |
| Lys | 0.071 | 1.2 | 4.4 | 10.4 |
| Glu | 0.057 | 1.6 | 5.3 | 13.1 |
| Gln | 0.041 | 1.4 | 3.9 | 10.1 |
| Arg | 0.035 | 1.0 | 3.4 | 9.4 |
| Asn | 0.15 | 1.4 | 5.0 | 13.5 |
| Phe | 0.46 | 2.3 | 7.3 | |
| Met | 0.036 | 0.75 | 2.4 | 5.4 |
| Tyr | 0.038 | 0.36 | 1.2 | 5.4 |
| Trp | 0.16 | 0.74 | 5.0 | |
| Leu | 0.26 | 1.3 | 5.4 | |
| Val | 0.01 | 2.80 | ||
| Ile | 0.013 | 1.3 |
These estimated deamidation rates depend upon peptide rates that were experimentally determined in pH 7.4, 37°C, 0.15 M Tris⋅HCl buffer and upon calculations that estimate the relative contributions of primary and 3D structure. Therefore, the estimated deamidation rates are for pH 7.4, 37°C, 0.15 M Tris⋅HCl buffer. These baseline solution conditions were chosen because Tris catalyzes deamidation to a much lesser extent than most other buffers. Phosphate buffers and the solute mixtures typically found in living things usually increase deamidation rates at least two or three-fold as compared with those in Tris (16). The deamidation halftimes shown in Figs. 1 and 2 are, thus, longer than those expected in living things at 37°C.
Fig. 1a shows the cumulative distribution function of the estimated first-order deamidation rate constants in 131,809 asparaginyl residues in 10,369 proteins, whereas Fig. 1b shows the derivative of the function in 1a, with the unusually unstable amides illustrated. For these figures, 2,966 redundant protein structures in the Brookhaven Protein Data Base have been excluded. These curves and those for human proteins (16) are qualitatively and quantitatively similar. In the course of this work, these functions also have been calculated for mouse, rat, chicken, Bacillus subtilis, and Escherichia coli proteins. Although not identical, these distributions are all quite similar, with mouse, B. subtilis, and E. coli having somewhat higher numbers of unstable amides in their proteins as compared with human, rat, and chicken.
As has been reported for human proteins (16), deamidation is not a random consequence of the presence of Asn residues in proteins. The fast deamidations summarized in Fig. 1 result from a set of Asn residues with unusual primary and 3D structures, which comprise about 5% of the total. These need not have been incorporated in protein structures, because most individual Asn deamidation rates are slower.
Whereas both the amino side and carboxyl side residues immediately adjacent to the amide residues affect deamidation rates, the carboxyl side residue is more important (10). Asn deamidation at neutral pH has been reported to proceed primarily by means of a succinimide mechanism, which involves an intermediate ring structure on the carboxyl side of the deamidating residue (18–20). Fig. 2 illustrates the relative importance of the different carboxyl side residues as a function of protein deamidation halftime. Although there are rare reported instances of 3D structures that increase deamidation rates, most rates are determined by primary structure as modulated through slowing by 3D structure. Therefore, only Asn-Gly sequences in locations that are relatively sterically unhindered provide Tris deamidation halftimes of less than about 6 days. Most Asn-Gly sequences have longer halftimes because of 3D effects.
Primary structure deamidation rates in Tris for Asn-His, Asn-Ser, and Asn-Ala peptide sequences range from 6 to 32 days (10, 14), so these sequences and additional, more hindered Asn-Gly sequences dominate this deamidation halftime range and that immediately higher. Within 100-day halftimes, all other sequences except for Asn-Leu, Asn-Val, Asn-Ile, and Asn-Pro significantly contribute. The estimated deamidation halftimes between 100 and 10,000 days are qualitatively and semiquantitatively useful, but these rates lack the direct experimental verification available for the shorter halftimes (16). Other processes such as additional deamidation mechanisms, side chain oxidation, peptide bond cleavage, and racemization also become more important at the longer time intervals. These deamidation halftimes are likely to be at least 2- to 3-fold shorter in biological systems at 37°C (16).
Each of the curves in Fig. 2 contains a subgroup of amides that are close to the ends of the proteins. These subgroups arise from Asn sequences with relatively short deamidation halftimes, as a result of their positions near the ends of protein chains, where they are largely free of constraining 3D effects. The Asn residues that have been reported to control the turnovers of rat cytochrome c (11, 12) and rabbit muscle aldolase (13) are of this type. In both of these cases, there is marked preferential in vivo degradation of the deamidated protein molecules. Because the estimated range of Asn deamidation halftimes available in these subgroups is between 0.2 days and more than 200 days under most in vivo conditions at 37°C, and they are free of 3D constraints, this type of Asn residue is especially well suited for biological purposes.
Fig. 3 illustrates, by means of the parameter Cm, the optimization routines that were used for all of the parameters in these calculations. By using the deamidation resolving power technique (15, 17), all suitable and published experimental relative deamidation observations of proteins are used to optimize each adjustable 3D parameter. The relative proportions of primary and 3D structure effects are determined by optimization of the illustrated parameter Cm as shown in Fig. 3. At the optimum value of Cm = 0.48, the experimental deamidation rates are 96.5% correctly ordered by the calculations. The remaining 4% of disorder includes amides wherein the inhibitory effects of 3D structure are imperfectly estimated by this calculation method and those where the experiments themselves are in error. Moreover, most of the deamidation rates of the imperfectly ordered 4% of Asn residues are estimated approximately correctly.
Optimization of the deamidation resolving power at 96.5% requires both primary and 3D structure. When primary structure alone is used, Dp = 79.8%. With 3D structure alone, Dp = 64.3%.
Table 1 shows the percentages of 131,809 asparaginyl residues in 10,369 proteins with 37°C Tris buffer and phosphate buffer deamidation halftimes in various ranges and the percentages of proteins with at least one amide with a deamidation halftime within those ranges. Phosphate is a stronger catalyst of deamidation than is Tris (6, 7, 16, 21). The phosphate deamidation halftimes are estimated for Table 1 as 1/2 the Tris halftimes (16). Under in vivo conditions at 37°C, deamidation halftimes would be expected to be, on average, even shorter than those estimated in Table 1 for phosphate (16). As shown, about 17% of all proteins are estimated to have at least one amide that is 1/10 or more deamidated after 5 days in phosphate at 37°C. Approximately 4.3% are 1/10 or more deamidated after 1 day. At 37°C in vivo, these percentages are expected to be higher (16). Accelerated protein turnover of deamidated forms and other factors can obscure the observation of these deamidations in ordinary experiments on protein preparations extracted from living things.
Table 2 provides quantitative summaries for 131,809 specific Asn-Xxx sequences. For example, Table 2 shows that 12% of all Asn-His sequences are estimated to be at least 1/10th deamidated after 25 days in 37°C phosphate buffer. In addition to these values, Table 2 also illustrates that it is not possible to usefully determine the relative deamidation rates of specific amides within a protein on the basis of primary sequence alone. Whereas the effects of primary sequence are evident, even in the simplest case of Asn-Gly, most deamidation halftimes are substantially determined by a combination of primary and 3D structure.
The calculations reported herein include only Asn residue deamidation. The rates of deamidation of glutaminyl residue, Gln, containing pentapeptides have recently been determined for a set of 60 Gln peptides with a representative range of sequences (N.E.R. & A. B. Robinson, unpublished work). Gln deamidation, like Asn deamidation, depends strongly upon the residue on the carboxyl side of the amide, with Gln-Gly being the fastest to deamidate. Deamidation halftimes for Gln-Gly sequences in pH 7.4, 37°C, 0.15 M Tris⋅HCl buffer are in the range of 400–600 days (N.E.R. & A. B. Robinson, unpublished work). The values for other sequences are substantially longer. Amino terminal Gln is, however, expected to deamidate more rapidly to the pyrrolidone. Gln residues do not, therefore, significantly affect most of the deamidation index calculations reported herein. As with Asn, Gln deamidation is accelerated by phosphate buffer (5, 6).
Gln deamidations over periods of many years in vivo in slow-turnover proteins of long-lived organisms such as human eye lens proteins (22) can be of substantial biological significance. Gln-Gly sequences in sterically unhindered locations of proteins that lack shorter-lived Asn residues also affect the deamidation index. Where buffer ion or other deamidation catalysts are present, Gln deamidation can be more significant. Deamidation is currently being experimentally studied in many proteins under in vivo and in vitro circumstances. For examples, see refs. 21–25.
Conclusions
Experimental (10, 14) and semiempirical computational (15, 16) advances have made possible reliable estimates of the deamidation rates of asparaginyl residues in proteins under biologically relevant conditions. These estimates, which require knowledge of the 3D structure of each molecule, are in accord with the known in vivo and in vitro experimental data and have been previously applied to 126 proteins of human origin (16).
It is reported herein that this method for estimating deamidation rates (15) has been fully computerized, further refined, and completely applied to the entire 170,014 Asn residues of the 13,335 amide-containing protein structures in the Brookhaven Protein Data Bank of 3D structures as of April 2001. These computed deamidation rates are available on the Internet at www.deamidation.org.
These calculation procedures make possible further refinements in the adjustable parameters, as more experimental data becomes available. Fully automatic deamidation estimates for additional proteins also may be made, as their 3D structures are determined. With the computer programs now freely available on the Internet at www.deamidation.org, an investigator can automatically enter the standard sequence and 3D parameters for any protein and calculate the deamidation coefficients and deamidation index for that protein.
The estimated deamidation rates apply directly to pH 7.4, 37°C, 0.15 M Tris⋅HCl buffer. Deamidation proceeds at a minimal rate under these conditions. There are no reported experimental deamidation rates at 37°C that are not the same as or faster than these computed Tris rates (16). The range of reported experimental values at 37°C is between the Tris rates and about 3-fold faster, depending upon solvent conditions. The average is about 2-fold faster.
The computed rates show that significant amounts of deamidation may be expected to occur in a substantial percentage of proteins under physiological conditions. Deamidation can control in vivo protein turnover. This result was found to be the case in cytochrome c (11, 12) and in rabbit muscle aldolase (13, 26, 27).
Many other biological processes such as homeostasis, development, and aging require timers, which are, as yet, unknown. Because protein deamidation rates can be genetically programmed throughout the range from a few hours to hundreds of years, and the deamidation rates found in proteins include many that are within the biologically significant range, deamidation is a good candidate for the timing of many biological processes.
Deamidation also provides a means of producing postsynthetic varieties of proteins that are biologically useful and of timing their release into in vivo systems.
Moreover, intermolecular effects resulting from in vivo protein locations such as in aggregates, membranes, and other organelles can further enhance the versatility exhibited herein in the intramolecular control of deamidation. A possible example of this has been reported for cytochrome c (6, 12).
Proteins contain amide residue clocks. These residues are found in almost all proteins, and amide residue clocks are found to be set to timed intervals of biological importance, even though settings to longer times are not only available, but also make up most of the genetically available settings. Deamidation changes protein structures in fundamentally important ways. If deamidation were not of pervasive and positive biological importance, these clocks would have been set to time intervals that are long with respect to the lifetimes of living things. The fact that they are found to be set instead to biologically relevant time intervals strongly supports the original hypothesis (2, 4, 6, 7, 9, 10) that amides play, through deamidation, a special biologically important role.
Acknowledgments
I thank Drs. H. B. Gray, R. B. Merrifield, and A. B. Robinson for advice and encouragement, the A. Reynolds Morse Foundation for their grant support, and a Caltech Special Institute Fellowship for financial support. Additional information, including computer programs, deamidation coefficients, and deamidation indexes for all proteins in the Brookhaven Protein Data Bank of 3D structures as of April 2001, is available at www.deamidation.org.
Abbreviations
- 3D
three dimensional
- ID
deamidation index
- CD
deamidation coefficient
- Dp
deamidation resolving power
References
- 1.Flatmark T. Acta Chem Scand. 1964;18:1656–1666. [Google Scholar]
- 2.Robinson A B, McKerrow J H, Cary P. Proc Natl Acad Sci USA. 1970;66:753–757. doi: 10.1073/pnas.66.3.753. [DOI] [PMC free article] [PubMed] [Google Scholar]
- 3.Robinson A B, Scotchler J W, McKerrow J H. J Am Chem Soc. 1973;95:8156–8159. doi: 10.1021/ja00805a032. [DOI] [PubMed] [Google Scholar]
- 4.Robinson A B. Proc Natl Acad Sci USA. 1974;71:885–888. doi: 10.1073/pnas.71.3.885. [DOI] [PMC free article] [PubMed] [Google Scholar]
- 5.Scotchler J W, Robinson A B. Anal Biochem. 1974;59:319–322. doi: 10.1016/0003-2697(74)90040-2. [DOI] [PubMed] [Google Scholar]
- 6.Robinson A B, Rudd C. Curr Top Cell Reg. 1974;8:247–295. doi: 10.1016/b978-0-12-152808-9.50013-4. [DOI] [PubMed] [Google Scholar]
- 7.Robinson A B, Scotchler J W. Int J Pept Protein Res. 1974;6:279–282. doi: 10.1111/j.1399-3011.1974.tb02385.x. [DOI] [PubMed] [Google Scholar]
- 8.McKerrow J H, Robinson A B. Anal Biochem. 1971;42:565–568. doi: 10.1016/0003-2697(71)90074-1. [DOI] [PubMed] [Google Scholar]
- 9.Robinson A B, Robinson L R. Proc Natl Acad Sci USA. 1991;88:8880–8884. doi: 10.1073/pnas.88.20.8880. [DOI] [PMC free article] [PubMed] [Google Scholar]
- 10.Robinson N E, Robinson A B. Proc Natl Acad Sci USA. 2001;98:944–949. doi: 10.1073/pnas.98.3.944. [DOI] [PMC free article] [PubMed] [Google Scholar]
- 11.Flatmark T, Sletten K. J Biol Chem. 1968;243:1623–1629. [PubMed] [Google Scholar]
- 12.Robinson A B, McKerrow J H, Legaz M. Int J Pept Protein Res. 1974;6:31–35. doi: 10.1111/j.1399-3011.1974.tb02355.x. [DOI] [PubMed] [Google Scholar]
- 13.McKerrow J H, Robinson A B. Science. 1974;183:85. doi: 10.1126/science.183.4120.85. [DOI] [PubMed] [Google Scholar]
- 14.Robinson N E, Robinson A B, Merrifield R B. J Peptide Res. 2001;57:483–493. doi: 10.1034/j.1399-3011.2001.00863.x. [DOI] [PubMed] [Google Scholar]
- 15.Robinson N E, Robinson A B. Proc Natl Acad Sci USA. 2001;98:4367–4372. doi: 10.1073/pnas.071066498. [DOI] [PMC free article] [PubMed] [Google Scholar]
- 16.Robinson N E, Robinson A B. Proc Natl Acad Sci USA. 2001;98:12409–12413. doi: 10.1073/pnas.221463198. [DOI] [PMC free article] [PubMed] [Google Scholar]
- 17.Robinson A B, Pauling L. Clin Chem. 1974;20:961–965. [PubMed] [Google Scholar]
- 18.Bornstein P, Balian G. J Biol Chem. 1970;245:4854–4856. [PubMed] [Google Scholar]
- 19.Meinwald Y C, Stimson E R, Scheraga H A. Int J Pept Protein Res. 1986;28:79–84. doi: 10.1111/j.1399-3011.1986.tb03231.x. [DOI] [PubMed] [Google Scholar]
- 20.Geiger T, Clarke S. J Biol Chem. 1987;262:785–794. [PubMed] [Google Scholar]
- 21.Yüksel K, Gracy R W. Arch Biochem Biophys. 1986;248:452–459. doi: 10.1016/0003-9861(86)90498-4. [DOI] [PubMed] [Google Scholar]
- 22.Takemoto L, Boyle D. J Biol Chem. 2000;275:26109–26112. doi: 10.1074/jbc.M002809200. [DOI] [PubMed] [Google Scholar]
- 23.Solstad T, Flatmark T. Eur J Biochem. 2000;267:6302–6310. doi: 10.1046/j.1432-1327.2000.01715.x. [DOI] [PubMed] [Google Scholar]
- 24.Sun A, Yuksel K U, Gracy R W. Arch Biochem Biophys. 1995;322:361–368. doi: 10.1006/abbi.1995.1476. [DOI] [PubMed] [Google Scholar]
- 25.Capasso S, Salvadori S. J Pept Res. 1999;54:377–382. doi: 10.1034/j.1399-3011.1999.00111.x. [DOI] [PubMed] [Google Scholar]
- 26.Midelfort C F, Mehler A H. Proc Natl Acad Sci USA. 1972;69:1816–1819. doi: 10.1073/pnas.69.7.1816. [DOI] [PMC free article] [PubMed] [Google Scholar]
- 27.Lai C Y, Chen C, Horecker B L. Biochem Biophys Res Commun. 1970;40:461–468. doi: 10.1016/0006-291x(70)91031-4. [DOI] [PubMed] [Google Scholar]