

Abstract
Neuroglobin (Ngb) is a recently discovered protein in vertebrate brain tissue that belongs to the globin family of proteins. It has been implicated in the neuronal response to hypoxia or ischemia, although its physiological role has been hitherto unknown. Ngb is hexacoordinate in the ferrous deoxy form under physiological conditions. To bind exogenous ligands like O2 and CO, the His E7 endogenous ligand is displaced from the sixth coordination. By using infrared spectroscopy and nanosecond time-resolved visible spectroscopy, we have investigated the ligand-binding reaction over a wide temperature range (3–353 K). Multiple, intrinsically heterogeneous distal heme pocket conformations exist in NgbCO. Photolysis at cryogenic temperatures creates a five-coordinate deoxy species with very low geminate-rebinding barriers. The photodissociated CO is observed to migrate within the distal heme pocket even at 20 K. Flash photolysis near physiological temperature (275–353 K) exhibits four sequential kinetic features: (i) geminate rebinding (t < 1 μs); (ii) extremely fast bimolecular exogenous ligand binding (10 μs < t < 1 ms) with a nontrivial temperature dependence; (iii) endogenous ligand binding (100 μs < t < 10 ms), which can be studied by using flash photolysis on deoxy Ngb; and (iv) displacement of the endogenous by the exogenous ligand (10 ms < t < 10 ks). All four processes are markedly nonexponential, suggesting that Ngb fluctuates among different conformations on surprisingly long time scales.
Globins are proteins that bind dioxygen and other small ligands at the central iron of a heme prosthetic group embedded in a highly conserved α-helical “globin” fold. Hemoglobin (Hb) and myoglobin (Mb) are the most prominent members of this protein family (1). Interrelations among structure, dynamics, and function in globins have been investigated in great detail, most likely more thoroughly than for any other protein family. Mb especially has, for a long time, served as a paradigm in the biological physics of proteins (2, 3).
Recently, two new members have joined the globin family, cytoglobin (4) and neuroglobin (Ngb) (5). The latter consists of a single chain of 151 aa. Ngb, which occurs in neurons, has less than 25% sequence identity with Mb or Hb but nevertheless displays all key determinants of the globin fold (6). It has moderate oxygen affinity and seems most closely related to the globin found in the glial cells of the annelid Aphrodite (7). The discovery of a six-coordinate heme in the deoxy form of Ngb (5), with the His E7 side chain occupying the sixth coordination, came somewhat as a surprise because it was believed for a long time that a pentacoordinate heme iron, with a vacant ligand-binding site, was a common characteristic of globins. In recent years, however, hexacoordinate globins also have been isolated from bacteria, unicellular eukaryotes, and plants [nonsymbiotic Hbs, nsHbs (8, 9), and truncated Hbs, trHbs (10)]. In these proteins, the exogenous ligand has to compete with an intramolecular side chain for the binding site, and therefore, hexacoordination appears as a novel mechanism for regulating ligand-binding affinity. As of yet, no precise physiological role has been assigned to hexacoordinate globins. A recent study has reported an up-regulation of Ngb under conditions of hypoxia or ischemia, thus promoting neuronal survival (11).
To understand the function of Ngb in the vertebrate brain and that of hexacoordinate globins in general, a thorough investigation of the structure, dynamics and ligand-binding (equilibrium and kinetic) properties is a prerequisite. First kinetic studies on Ngb at room temperature have reported extremely fast CO and O2 association to the pentacoordinate deoxy form (12, 13). The two papers disagreed, however, by a factor of 1,000 in the His dissociation rate from the hexacoordinate deoxy form, which essentially governs exogenous ligand binding at physiological temperature. Here, we present a ligand-binding study of NgbCO in the infrared and visible spectral regions over a wide range of temperature (3–353 K). The results are quite peculiar when compared with HbCO or MbCO and provide important insights into both structural and dynamic properties in Ngb's reaction with ligands.
Materials and Methods
Protein Expression and Purification.
Murine Ngb was produced in Escherichia coli strain BL21(DE3)pLys by using pET3a expression plasmids. Cells were grown aerobically at 27°C in 2× YT medium (16 g/liter tryptone/10 g/liter yeast extract/5 g/liter NaCl) containing 50 μg/ml ampicillin and 25 μg/ml chloramphenicol to an absorption of 1 at 550 nm. The culture was induced by adding 0.4 mM isopropyl-1-thio-d-galactopyranoside (IPTG), and expression was continued overnight. The cells were harvested at 4°C by centrifugation at 7,000 rpm (Heraeus Sepatech Rotor 14.290) and frozen to −20°C. After thawing, the cells were resuspended in lysis buffer containing 50 mM Tris⋅HCl, 1 mM EDTA, 100 mM NaCl (pH 8) and stirred at room temperature for 30 min. After addition of deoxycholic acid (4 mg/g cells), the suspension was heated to 37°C for 15 min. The lysate was stirred for another 30 min at room temperature after the addition of DNase (20 μg/g cells). Lysate and cell debris were separated by centrifugation at 20,000 rpm (Sorvall Rotor SS34) for half an hour. The supernatant was loaded on a DEAE Sepharose anion-exchange column equilibrated with Tris⋅HCl (20 mM, pH 8). After washing the unbound material with the same buffer, the protein was eluted with buffer containing 75 mM NaCl. The fractions containing Ngb were pooled and concentrated by Amicon filtration (YM10) and passed through a Sephacryl S-200 HR gel filtration column using 150 mM sodium phosphate buffer. Protein fractions were pooled and dialyzed against water, then lyophilized and stored at −20°C until needed.
FTIR and Temperature Derivative Spectroscopy (TDS).
Protein powder was dissolved at a concentration of ≈15 mM in cryosolvent (75% glycerol/25% potassium phosphate buffer, vol/vol), stirred under a CO atmosphere, and reduced with sodium dithionite. A few microliters of solution were sandwiched between two CaF2 windows (diameter of 25.4 mm) separated by a 75-μm thick mylar washer. The sample temperature was adjustable in the range between 3–320 K by using a closed-cycle helium cryostat (SRDK-205AW, Sumitomo, Tokyo, Japan) and a digital temperature controller (model 330, Lake Shore Cryotronics, Westerville, OH). Transmission spectra in the mid-IR (1,800–2,400 cm−1, 2 cm−1 resolution) were collected with a Fourier transform infrared (FTIR) spectrometer (IFS 66v/S, Bruker, Karlsruhe, Germany). Samples were photolyzed with a continuous wave, frequency doubled Nd:YAG laser (Forte 530–300, Laser Quantum, Manchester, UK).
Ligand dynamics was studied by using temperature-derivative spectroscopy (TDS; refs. 14–16). After photolysis, the temperature was continuously increased (here from 3 K) at a rate of 5 mK/s while FTIR spectra were recorded. The temperature-dependent spectral changes during the course of the experiment were caused by ligand rebinding and migration within the protein. From transmittance spectra, ℐ(ν,T), at successive temperatures, FTIR absorbance difference spectra, Δ𝒜(ν,T), were calculated, yielding the spectral changes occurring within 200 s (and 1 K). These data are plotted as two-dimensional (contour) maps.
Flash Photolysis Experiments.
For low-temperature experiments, the protein was dissolved in a mixture of 75% glycerol/25% potassium phosphate (vol/vol, pH 7.5) to a final concentration of ≈15 μM. Measurements around physiological temperature were performed in a 0.1 M sodium phosphate buffer (pH 8). After reducing with sodium dithionite, the solution was equilibrated with a CO/N2 atmosphere with different CO partial pressures. The sample was loaded in a 10 × 10 × 2.5 mm3 PMMA cuvette in thermal contact with a home-built copper sample holder in a closed-cycle helium cryostat (model 22, CTI Cryogenics, Mansfield, MA) equipped with a Lake Shore Cryotronics model 330 digital temperature controller. Photolysis was achieved by a 6-ns (full width at half maximum) pulse from a frequency doubled, Q-switched Nd:YAG laser (model Surelite II, Continuum, Santa Clara, CA). Optical absorbance changes upon flash photolysis were monitored at 436 nm in the Soret region by using light from a tungsten source passed through a monochromator and the sample. Intensities were measured with a photomultiplier tube (model R5600U, Hamamatsu, Middlesex, NJ) and recorded with a digital storage oscilloscope from 10 ns to 50 μs (model TDS 520, Tektronix) and a home-built logarithmic time-base digitizer (Wondertoy II) from 2 μs to 100 s. Three or more single transients were averaged at each temperature.
Experimental Results and Interpretation
Heme Pocket Heterogeneity and Ligand Dynamics.
The stretch bands of bound and photodissociated CO, displayed as FTIR photolysis difference spectra in Fig. 1, are known to be sensitive markers of the structural heterogeneity and ligand dynamics in the heme pocket because of their exquisite sensitivity to local electric fields. At pH 7.3, essentially two major bands are observed, A1 at 1,940 cm−1 and A2 at 1,980 cm−1, that are associated with two different heme pocket conformations, as reported from Raman studies (17). At pH 5.3, additional bands appear: A0 at 1,970 cm−1 and A3 at 1,925 cm−1. CO bands near 1,940 cm−1 are frequently observed in globins; they are typical for a heme pocket environment in which the Nɛ hydrogen of the distal His (His E7) is located close to the CO oxygen. Without a strong distal heme pocket interaction, the CO stretch band is at ≈1,967 cm−1, as observed at lower pH, when the His E7 imidazole protonates (in NgbCO, pK ≈ 4.5, unpublished results) and swings out of the heme pocket (18). Bands at even higher wave numbers have been reported for Mb mutants that place negative charges close to the ligand oxygen (for instance, H64W at 1,969 cm−1 or H64V/V68T at 1,984 cm−1; ref. 19). The high-frequency A2 band of NgbCO at 1,980 cm−1 could, for instance, arise from a strong interaction of the π-electron system of phenylalanine B10 with the bound ligand.
Figure 1.

FTIR photolysis difference spectra of NgbCO. Solid line, sample pH 5.3, photolysis at 3 K; dashed line, sample pH 7.3, photolysis at 3 K; and dotted line, sample pH 7.3, cooled slowly under illumination from 140 K.
Upon photolysis at 3 K, two bands, B0 at 2,136 and B1 at 2,128 cm−1, are prominent in the spectral region of the photodissociated CO in both the low and high pH sample, whereas a small B2 band at 2,115 cm−1 is only present at high pH. If, instead of photolyzing at 3K, we cool the sample slowly (5 mK/s) under illumination from 140 to 3 K, a completely different spectrum appears, which is characterized by a strong band at 2,134 cm−1 (denoted C in Fig. 1). Apparently, the distal heme pocket is spacious and allows the ligand to migrate among different docking sites, as has been observed earlier in Mb mutants (20–23).
TDS data after photolysis at 3 K are plotted as contour maps in Fig. 2. The map of heme-bound CO (Fig. 2A) shows strong rebinding already at 3 K, implying very low activation-energy barriers for geminate rebinding from the heme pocket. A pronounced kinetic hole burning shift (24, 25) with temperature in A1, ranging from 1,937 to 1,947 cm−1, reflects substantial heterogeneity of the CO environment in this bound-state conformation.
Figure 2.

TDS maps of NgbCO, pH 7.3, after 1-s photolysis at 3 K; IR stretch bands of (A) the heme-bound CO and (B) the photodissociated CO within the protein. Contours are spaced logarithmically; solid (dashed) lines represent absorbance increase (decrease).
In the map of the photodissociated CO (Fig. 2B), rebinding (and possibly exchange to B0) depletes B2 and a fraction of B1 below 15 K. Positive contours near 2,134 cm−1 around 20 K represent ligand migration from a site associated with the B0 band to an alternate site, denoted C, with markedly increased effective recombination barriers. Rebinding occurs predominantly from this site above 30 K, as seen from the tail of negative contours at 2,134 cm−1 toward higher temperatures in Fig. 2B.
Low Temperature Ligand-Binding Kinetics.
In Fig. 3A, absorbance changes at 436 nm after photodissociation are shown for temperatures between 20 and 120 K. The kinetics are nonexponential and remarkably fast, comparable to those measured earlier on protoheme (26). We have fitted the data with a two-state model that invokes a static distribution of activation enthalpy barriers, g(H), between bound and photoproduct state, so that the survival probability in the (five-coordinate) deligated state is given by
 |
1 |
The measured absorbance change, Δ𝒜(t), is taken to be proportional to N(t). In the analysis, we have chosen the Γ-distribution, a model distribution suitable for power-law kinetics (27). For thermally activated barrier crossing, the dependence of the rebinding rate coefficient, k(H,T), on temperature T is given by the transition-state expression
 |
2 |
with frequency factor A, reference temperature T0 taken to be 100 K and gas constant R. At very low temperatures, quantum-mechanical tunneling becomes important (28, 29). Therefore, the global nonlinear least-squares fit of this model to the data was limited to the temperature range between 40 and 120 K. Moreover, a deviation from the power-law behavior is apparent at longer times for a minor fraction of the total population. These data were thus excluded from the fit.
Figure 3.

Flash photolysis kinetics of NgbCO in 75% glycerol/25% buffer, pH 7.5, from 20–300 K. (A) Symbols represent experimental data from 20–120 K in 20-K intervals; lines represent calculated kinetics from global fit (including temperatures 40–120 K) with the Γ-distribution of activation enthalpy barriers shown in the inset as a solid line (dotted line represents distribution as determined from the TDS data). (B) Experimental data at 160 K (□), 200 K (●), and 240, 260, 280, and 300 K in ascending order.
The lines in Fig. 3A are calculated with Eqs. 1 and 2 after nonlinear least-squares fitting of the parameters to the experimental data. Note that the kinetics at 20 K are indeed faster than predicted from the fit (dashed line), implying significant quantum tunneling. The Γ-distribution peaking at 1.1 ± 0.2 kJ/mol is depicted in Fig. 3A Inset. Also shown is the g(H) distribution resulting from the TDS data in Fig. 2A (dotted line), which was calculated by using the preexponential A = 107.8±0.5 s−1, as determined from the kinetics (14). The TDS distribution, amplitude normalized to the Γ-distribution, shows significantly more population with higher barriers. These results—the slowing of the data in Fig. 3A at long times and the observed exchange in the CO stretch bands in the TDS map in Fig. 2B—provide consistent evidence for ligand migration in the distal heme pocket of Ngb to alternate sites from where rebinding is markedly slowed.
Kinetic data between 160 and 300 K are plotted in Fig. 3B. From 120 K to 200 K, rebinding speeds up further, but less than what would be predicted from the Γ-distribution. Above 200 K, rebinding slows, and additional, nonexponential steps appear in the kinetics at longer times. They gain weight and population with increasing temperature. We characterize them by fitting the absorbance changes with Gaussian rate distributions on a logarithmic time scale, ƒ(logλ),
 |
3 |
An Arrhenius analysis [2] of the peak positions of the Gaussian distributions corresponding to the first step (i.e., the dominant contribution) yields an activation enthalpy of 49 ± 7 kJ/mol, which is close to that of the viscosity of our cryosolvent (45 kJ/mol; ref. 30). We will show below that this step arises from bimolecular binding of CO.
Ligand Binding at Physiological Temperature.
The slow kinetic processes were investigated with flash photolysis in the range 275–353 K using samples dissolved in aqueous buffer equilibrated at three different partial pressures of CO (0.05, 0.35, and 1 bar). Fig. 4A presents data in the time range between 1 μs and 100 s at selected temperatures for the sample with the lowest CO concentration. The kinetics at all temperatures and CO pressures are characterized by two well separated steps. Both steps are nonexponential even at the highest temperatures. We note that a fast, geminate phase is also present on the nanosecond scale. As an example, we show this component at 275 K in the inset of Fig. 4A. The kinetics at 290 K for the three CO concentrations are depicted in Fig. 4B. The first kinetic step, characterized by a distribution of rate coefficients, ƒ(logλ1), depends sensitively on the CO concentration and is, therefore, unambiguously assigned to bimolecular binding. The second step, however, depends only weakly on the CO concentration.
Figure 4.

Flash photolysis kinetics of NgbCO (open symbols) and deoxy Ngb (filled symbols) in phosphate buffer, pH 7.5. (A) NgbCO equilibrated with 0.05 bar CO at selected temperatures between 275–353 K. Solid lines, fit with a two-Gaussian rate distribution. (Inset) Geminate phase at 275 K. (B) NgbCO at different CO pressures and deoxy Ngb at 290 K.
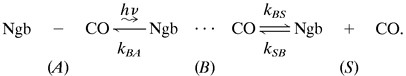
The temperature dependence of the kinetics was analyzed by fitting the data with a sum of two Gaussian rate distributions on a logarithmic scale [3]. The fit results are shown as solid lines in Fig. 4, and the average rate coefficients 〈λ1〉 (peak position of the Gaussian) are plotted in Fig. 5A for all three CO concentrations.§ For 1 bar CO, the rate coefficients increase with temperature up to 293 K and saturate beyond. This behavior can be explained by a three-well model that includes a bound state A, a geminate state B, with CO still in the protein, and a state S, in which the CO has escaped into the solvent:
 |
4 |
In this model, the observed temperature dependence of the (average) bimolecular rate coefficient 〈λ1〉 arises from a crossover between the low and high temperature limiting cases: at low temperature, geminate rebinding (B→A) dominates as ligand escape (B→S) and entry (S→B) are slow. Hence, the entry process controls the apparent bimolecular rate, λ1 ≈ kSB (25, 31). At high temperature, however, the inner barrier between states B and A governs the kinetics, λ1 ≈ kBA × PB, with the (weakly temperature-dependent) pocket occupation factor PB = (kSB/kBS).
Figure 5.

Arrhenius plot of (average) rate coefficients from flash photolysis data on NgbCO, MbCO (mutant H64L), and deoxy Ngb in aqueous solution. (A) Bimolecular CO binding. (B) His binding. (C) NgbCO, second kinetic step. Details are given in the text.
Below 293 K, the curves for 0.35 and 0.05 bar CO are essentially parallel to the 1 bar curve but are shifted by factors of 3 and 20, respectively, as expected for a pseudo-first-order reaction. Averaging the data from all three CO concentrations yields an activation enthalpy of 17.5 ± 1 kJ/mol, which is similar to that of the viscosity of water (17 kJ/mol; ref. 32). In water and glycerol/water, the activation enthalpies of bimolecular ligand binding track those of the viscosity; hence, we conclude that the dynamics associated with ligand return into the protein is governed by the solvent viscosity.
Most surprising, however, is the difference in the temperature dependencies of 〈λ1〉 above 293 K for the different CO pressures. Unlike the 1 bar data, those at 0.05 bar do not saturate but continue to speed up with temperature; the data at 0.35 bar interpolate between the two other curves. This behavior is in blatant disagreement with an ordinary second-order reaction of two reactants in thermal equilibrium. However, it can be explained by noticing that the time from photodissociation until rebinding depends on the CO concentration. At 0.05 bar, the protein can relax longer from the five-coordinate photoproduct intermediate to the deoxy equilibrium state than at 1 bar. Consequently, the peculiar temperature dependence of the bimolecular rates in Fig. 5A implies that the overall binding rate of the deligated, pentacoordinate species increases slowly with time. At the highest temperatures, ligand binding is only 4-fold (instead of 20-fold) slower at 0.05 bar than at 1 bar CO pressure.
For comparison, we also include in Fig. 5A rebinding rate coefficients of MbCO mutant H64L, which is known for the fastest bimolecular ligand binding among all Mb mutants studied so far (19). Yet, at 275 K, it is a factor of 3 slower than NgbCO at the same ligand pressure. Unlike NgbCO, the kinetics of H64L MbCO at 0.05 and 1 bar CO pressure are—within the error of the data—shifted by a factor of 20 at all temperatures and completely exponential.
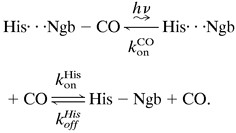
After the bimolecular phase, the kinetics flatten because of binding of the endogenous His ligand, which is finally replaced by the CO, according to the following scheme:
 |
5 |
Fig. 5B displays the average rate coefficient for binding of the endogenous His E7 ligand, k . These data were obtained from flash photolysis of hexacoordinate deoxy Ngb, which can be photodissociated with low nanosecond yield (≈5%, see Fig. 4B). The data show a dominant decay plus additional features at longer times. This complex behavior suggests a high degree of flexibility in the structure on the distal side, so that other distal residues can compete with His E7 for the sixth coordination. This view is supported by the fact that the deoxy form of the H64L Ngb mutant, which lacks the distal His, shows a Soret band with a major peak at 423 nm and only a shoulder at 440 nm, the wavelength typical for a pentacoordinate deoxy heme (12). Moreover, mutant studies of Synechocystis Hb, another globin with hexacoordinate deoxy form, likewise show alternative ligands binding at the sixth coordination (33). The solid line represents a fit with Eq. 2, yielding a preexponential, A = 108.1±0.9 s−1, similar to that of the low temperature geminate rebinding, and an average enthalpy barrier H = 35 ± 5 kJ/mol. Also shown are data that were extracted from the NgbCO kinetics (Fig. 4A). To calculate these data, we took a decrease in the slope of the kinetics (in the double-logarithmic plot) after the bimolecular phase by a factor of 2 as a simple, heuristic criterion to assign a time and thus a rate coefficient to the process of His binding.
Finally, in Fig. 5C we show the average apparent rate coefficients for the second kinetic step, 〈λ2〉. Assuming a three-state scheme according to Eq. 5, with two kinetic processes well separated in time, this rate coefficient is given by
 |
6 |
The latter approximation holds if the second step is small, so that CO binding is much faster than the internal His binding, which applies at higher CO concentrations. Indeed, the different CO partial pressures behave qualitatively as expected from Eq. 6. The solid line is a fit with Eq. 2, from which the Arrhenius parameters for His dissociation, preexponential A = 1017.5±0.8 s−1 and an average barrier H = 106 ± 5 kJ/mol, were obtained.
Discussion and Conclusions
The spectroscopic and kinetic data presented here exhibit a number of features that provide insight into structural, dynamic, and functional properties of Ngb. The CO stretch spectra in the infrared reveal a pronounced distal pocket heterogeneity with multiple bound conformations and multiple CO-docking sites among which the CO can migrate. A strong kinetic hole burning in the A1 substate signals further heterogeneity within each conformation. Geminate ligand binding is extremely fast, implying a very small enthalpy barrier at the heme iron. Slow structural relaxations and fluctuations on the time scale of the ligand-binding reaction even at physiological temperatures are evident from the CO concentration dependence and the nonexponential character of the kinetics.
The three-dimensional structure of Ngb is not yet available. Therefore, we compare our present findings with structural data on a nonsymbiotic plant Hb (rice Hb1) that is expected to share similarities with Ngb (34). In this hexacoordinate structure, the distal heme pocket is large and thus should allow for ligand migration. The electron density of the Phe B10 in the distal pocket is very low because of substantial disorder, and the entire CD corner is disordered because of the distal His binding to the heme iron. The multitude of IR bands suggests a similar heterogeneity also in Ngb. The Phe B10 side chain in rice Hb1 is very close to the distal His, causing unfavorable steric interactions, which may enhance His dissociation from the heme iron upon O2 or CO binding. In NgbCO, the strong kinetic hole burning in A1 also suggests a significant perturbation of His E7 because of Phe B10 or another neighboring residue.
In rice Hb1, the heme iron is slightly displaced toward the distal heme pocket (≈0.2 Å), owing to a staggered proximal imidazole (His F8) with respect to the pyrrole nitrogens. The extremely low geminate rebinding barriers determined in this work are consistent with an iron displacement toward the distal side because it is generally assumed that the iron position with respect to the heme plane is an important structural coordinate governing the ligand-binding barrier (25, 35–37).
We also noticed differences between rice Hb1 and Ngb. Whereas many side chains in the CD corner of rice Hb1 are apolar, Ngb contains a substantial number of polar residues in this part of the sequence (5). The time-dependent, nonexponential kinetics of CO association imply major structural changes, most likely the unfolding or rearrangement of the CD corner in response to ligand dissociation. This process may be related to Ngb's hitherto unknown function. At a micromolar expression level, an oxygen storage function may seem unlikely. Alternative possibilities are detoxification of substances involved in hypoxic-ischemic injury or oxygen sensing. Structural changes on the surface of Ngb upon replacement of the endogenous by an exogenous ligand can markedly change the interaction with other proteins and thus be relevant in the context of an O2-sensing function.
Acknowledgments
We thank Drs. T. Burmester and T. Hankeln (University of Mainz, Germany) for the Ngb expression system. This work was supported by the Deutsche Forschungsgemeinschaft (Sonderforschungsbereich 569, Graduiertenkolleg 328, and Ni-291/3-1).
Abbreviations
- Ngb
neuroglobin
- TDS
temperature derivative spectroscopy
- FTIR
Fourier transform infrared
- TDS
temperature-derivative spectroscopy
Footnotes
The data have to be divided by the CO ligand concentration (1 atm ≈ 1 mM) to obtain the often-quoted bimolecular rate coefficients. For example, 〈k (CO)〉 = 55 × 106 M−1 s−1 at 298 K and 1 atm CO, which is slightly less than the 72 × 106 M−1 s−1 reported by Dewilde et al. (12) from an exponential fit of kinetic data. An exponential analysis is—strictly speaking—not appropriate for nonexponential processes. We also note that the smooth, nonexponential kinetics in Fig. 5 cannot be explained by two discrete protein conformations, which had been suggested earlier (12).
References
- 1.Antonini E, Brunori M. Hemoglobin and Myoglobin in Their Reactions with Ligands. Amsterdam: North–Holland; 1971. [Google Scholar]
- 2.Frauenfelder H, Sligar S G, Wolynes P G. Science. 1991;254:1598–1603. doi: 10.1126/science.1749933. [DOI] [PubMed] [Google Scholar]
- 3.Frauenfelder H, Wolynes P G, Austin R H. Rev Mod Phys. 1999;71:S419–S430. [Google Scholar]
- 4.Burmester T, Ebner B, Weich B, Hankeln T. Mol Biol Evol. 2002;275:416–421. doi: 10.1093/oxfordjournals.molbev.a004096. [DOI] [PubMed] [Google Scholar]
- 5.Burmester T, Weich B, Reinhardt S, Hankeln T. Nature (London) 2000;407:520–523. doi: 10.1038/35035093. [DOI] [PubMed] [Google Scholar]
- 6.Bashford D, Chothia C, Lesk A M. J Mol Biol. 1987;196:199–216. doi: 10.1016/0022-2836(87)90521-3. [DOI] [PubMed] [Google Scholar]
- 7.Dewilde S, Blaxter M, Vanhauwaert M L, Vanfleteren J, Esmans E L, Marden M, Griffon N, Moens L. J Biol Chem. 1996;271:19865–19870. doi: 10.1074/jbc.271.33.19865. [DOI] [PubMed] [Google Scholar]
- 8.Duff S M G, Wittenberg J B, Hill R D. J Biol Chem. 1997;272:16746–16752. doi: 10.1074/jbc.272.27.16746. [DOI] [PubMed] [Google Scholar]
- 9.Hargrove M S. Biophys J. 2000;79:2733–2738. doi: 10.1016/S0006-3495(00)76512-X. [DOI] [PMC free article] [PubMed] [Google Scholar]
- 10.Wittenberg J B, Bolognesi M, Wittenberg B A, Guertin M. J Biol Chem. 2002;277:871–874. doi: 10.1074/jbc.R100058200. [DOI] [PubMed] [Google Scholar]
- 11.Sun Y, Jin K, Mao X O, Zhu Y, Greenberg D A. Proc Natl Acad Sci USA. 2001;98:15306–15311. doi: 10.1073/pnas.251466698. [DOI] [PMC free article] [PubMed] [Google Scholar]
- 12.Dewilde S, Kiger L, Burmester T, Hankeln T, Baudin-Creuza V, Aerts T, Marden M C, Caubergs R, Moens L. J Biol Chem. 2001;276:38949–38955. doi: 10.1074/jbc.M106438200. [DOI] [PubMed] [Google Scholar]
- 13.Trent J T, Watts R A, Hargrove M S. J Biol Chem. 2001;276:30106–30110. doi: 10.1074/jbc.C100300200. [DOI] [PubMed] [Google Scholar]
- 14.Berendzen J, Braunstein D. Proc Natl Acad Sci USA. 1990;87:1–5. doi: 10.1073/pnas.87.1.1. [DOI] [PMC free article] [PubMed] [Google Scholar]
- 15.Mourant J R, Braunstein D P, Chu K, Frauenfelder H, Nienhaus G U, Ormos P, Young R D. Biophys J. 1993;65:1496–1507. doi: 10.1016/S0006-3495(93)81218-9. [DOI] [PMC free article] [PubMed] [Google Scholar]
- 16.Nienhaus G U, Mourant J R, Chu K, Frauenfelder H. Biochemistry. 1994;33:13413–13430. doi: 10.1021/bi00249a030. [DOI] [PubMed] [Google Scholar]
- 17.Couture M, Burmester T, Hankeln T, Rousseau D L. J Biol Chem. 2001;276:36377–36382. doi: 10.1074/jbc.M103907200. [DOI] [PubMed] [Google Scholar]
- 18.Müller J D, McMahon B H, Chien E Y T, Sligar S G, Nienhaus G U. Biophys J. 1999;77:1036–1051. doi: 10.1016/s0006-3495(99)76954-7. [DOI] [PMC free article] [PubMed] [Google Scholar]
- 19.Li T, Quillin M L, Phillips G N, Jr, Olson J S. Biochemistry. 1994;33:1433–1446. doi: 10.1021/bi00172a021. [DOI] [PubMed] [Google Scholar]
- 20.Ostermann A, Waschipky R, Parak F G, Nienhaus G U. Nature (London) 2000;404:205–208. doi: 10.1038/35004622. [DOI] [PubMed] [Google Scholar]
- 21.Brunori M, Vallone B, Cutruzzolà F, Travaglini-Allocatelli C, Berendzen J, Chu K, Sweet R M, Schlichting I. Proc Natl Acad Sci USA. 2000;97:2058–2063. doi: 10.1073/pnas.040459697. [DOI] [PMC free article] [PubMed] [Google Scholar]
- 22.Lamb D C, Nienhaus K, Arcovito A, Draghi F, Miele A E, Brunori M, Nienhaus G U. J Biol Chem. 2002;277:11636–11644. doi: 10.1074/jbc.M109892200. [DOI] [PubMed] [Google Scholar]
- 23.Nienhaus K, Lamb D C, Deng P, Nienhaus G U. Biophys J. 2002;82:1059–1067. doi: 10.1016/s0006-3495(02)75465-9. [DOI] [PMC free article] [PubMed] [Google Scholar]
- 24.Campbell B F, Chance M R, Friedman J M. Science. 1987;238:373–376. doi: 10.1126/science.3659921. [DOI] [PubMed] [Google Scholar]
- 25.Steinbach P J, Ansari A, Berendzen J, Braunstein D, Chu K, Cowen B R, Ehrenstein D, Frauenfelder H, Johnson J B, Lamb D C, et al. Biochemistry. 1991;30:3988–4001. doi: 10.1021/bi00230a026. [DOI] [PubMed] [Google Scholar]
- 26.Alberding N, Austin R H, Chan S S, Eisenstein L, Frauenfelder H, Gunsalus I C, Nordlund T M. J Chem Phys. 1976;65:4701–4711. [Google Scholar]
- 27.Young R D, Bowne S F. J Chem Phys. 1984;81:3730–3737. [Google Scholar]
- 28.Alberding N, Austin R H, Beeson K W, Chan S S, Eisenstein L, Frauenfelder H, Nordlund T M. Science. 1976;192:1002–1004. doi: 10.1126/science.1273579. [DOI] [PubMed] [Google Scholar]
- 29.Alben J O, Beece D, Bowne S F, Eisenstein L, Frauenfelder H, Good D, Marden M C, Moh P P, Reinisch L, Reynolds A H, Yue K T. Phys Rev Lett. 1980;44:1157–1160. [Google Scholar]
- 30.Beece D, Eisenstein L, Frauenfelder H, Good D, Marden M C, Reinisch L, Reynolds A H, Sorensen L B, Yue K T. Biochemistry. 1980;19:5147–5157. doi: 10.1021/bi00564a001. [DOI] [PubMed] [Google Scholar]
- 31.Austin R H, Beeson K W, Eisenstein L, Frauenfelder H, Gunsalus I C. Biochemistry. 1975;14:5355–5373. doi: 10.1021/bi00695a021. [DOI] [PubMed] [Google Scholar]
- 32.Lide D R. CRC Handbook of Chemistry and Physics. 75th Ed. Boca Raton, FL: CRC; 1994. [Google Scholar]
- 33.Hvitved A N, Trent J T, Premer S A, Hargrove M S. J Biol Chem. 2001;276:34714–34721. doi: 10.1074/jbc.M105175200. [DOI] [PubMed] [Google Scholar]
- 34.Hargrove M S, Brucker E A, Stec B, Sarath G, Arredondo-Peter R, Klucas R V, Olson J S, Phillips G N. Structure (London) 2000;8:1005–1014. doi: 10.1016/s0969-2126(00)00194-5. [DOI] [PubMed] [Google Scholar]
- 35.Agmon N, Hopfield J J. J Chem Phys. 1983;79:2042–2053. [Google Scholar]
- 36.Šrajer V, Reinisch L, Champion P M. J Am Chem Soc. 1988;110:6656–6670. [Google Scholar]
- 37.Ormos P, Szaraz S, Cupane A, Nienhaus G U. Proc Natl Acad Sci USA. 1998;95:6762–6767. doi: 10.1073/pnas.95.12.6762. [DOI] [PMC free article] [PubMed] [Google Scholar]