

Abstract
Early erythroid progenitors known as CFU-e undergo multiple self renewal cell cycles. The CFU-e developmental stage ends with the onset of erythroid terminal differentiation (ETD). The transition from CFU-e to ETD is a critical cell fate decision that determines erythropoietic rate. Here we review recent insights into the regulation of this transition, garnered from flow cytometric and single-cell RNA sequencing studies. We find that the CFU-e/ETD transition is a rapid S phase-dependent transcriptional switch. It takes place during an S phase that is much shorter than in preceding or subsequent cycles, as a result of globally-faster replication forks. Further, it is preceded by cycles in which G1 becomes gradually shorter. These dramatic cell cycle and S phase remodeling events are directly linked to regulation of the CFU-e/ETD switch. Moreover, regulators of erythropoietic rate exert their effects by modulating cell cycle duration and S phase speed. Glucocorticoids increase erythrooietic rate by inducing the CDK inhibitor p57KIP2, which slows replication forks, inhibiting the CFU-e/ETD switch. Conversely, erythropoietin promotes induction of ETD by shortening the cycle. S phase shortening was reported during cell fate decisions in non-erythroid lineages, suggesting a fundamentally new developmental role for cell cycle speed.
Introduction
Red cells account for 84% of the 30 trillion cells that make up the human body, making them the most abundant cell type 1. Following a circulation time of ~120 days, red cells undergo senescence, and so need to be replenished continuously, at a rate of 2 million new red cells per second. This impressive rate is further upregulated, by up to 10 fold, in response to stresses that threaten tissue oxygen tension, including cardiorespiratory illness, high altitude, blood loss, and anemia of various etiologies. The study of erythropoiesis contributes to our understanding of fundamental biological mechanisms, and is also central to human health: globally, anemia resulting from nutritional deficiencies, malaria, chronic disease, cancer, or hereditary hemoglobinopathies accounts for 8.8% of all disability 2.
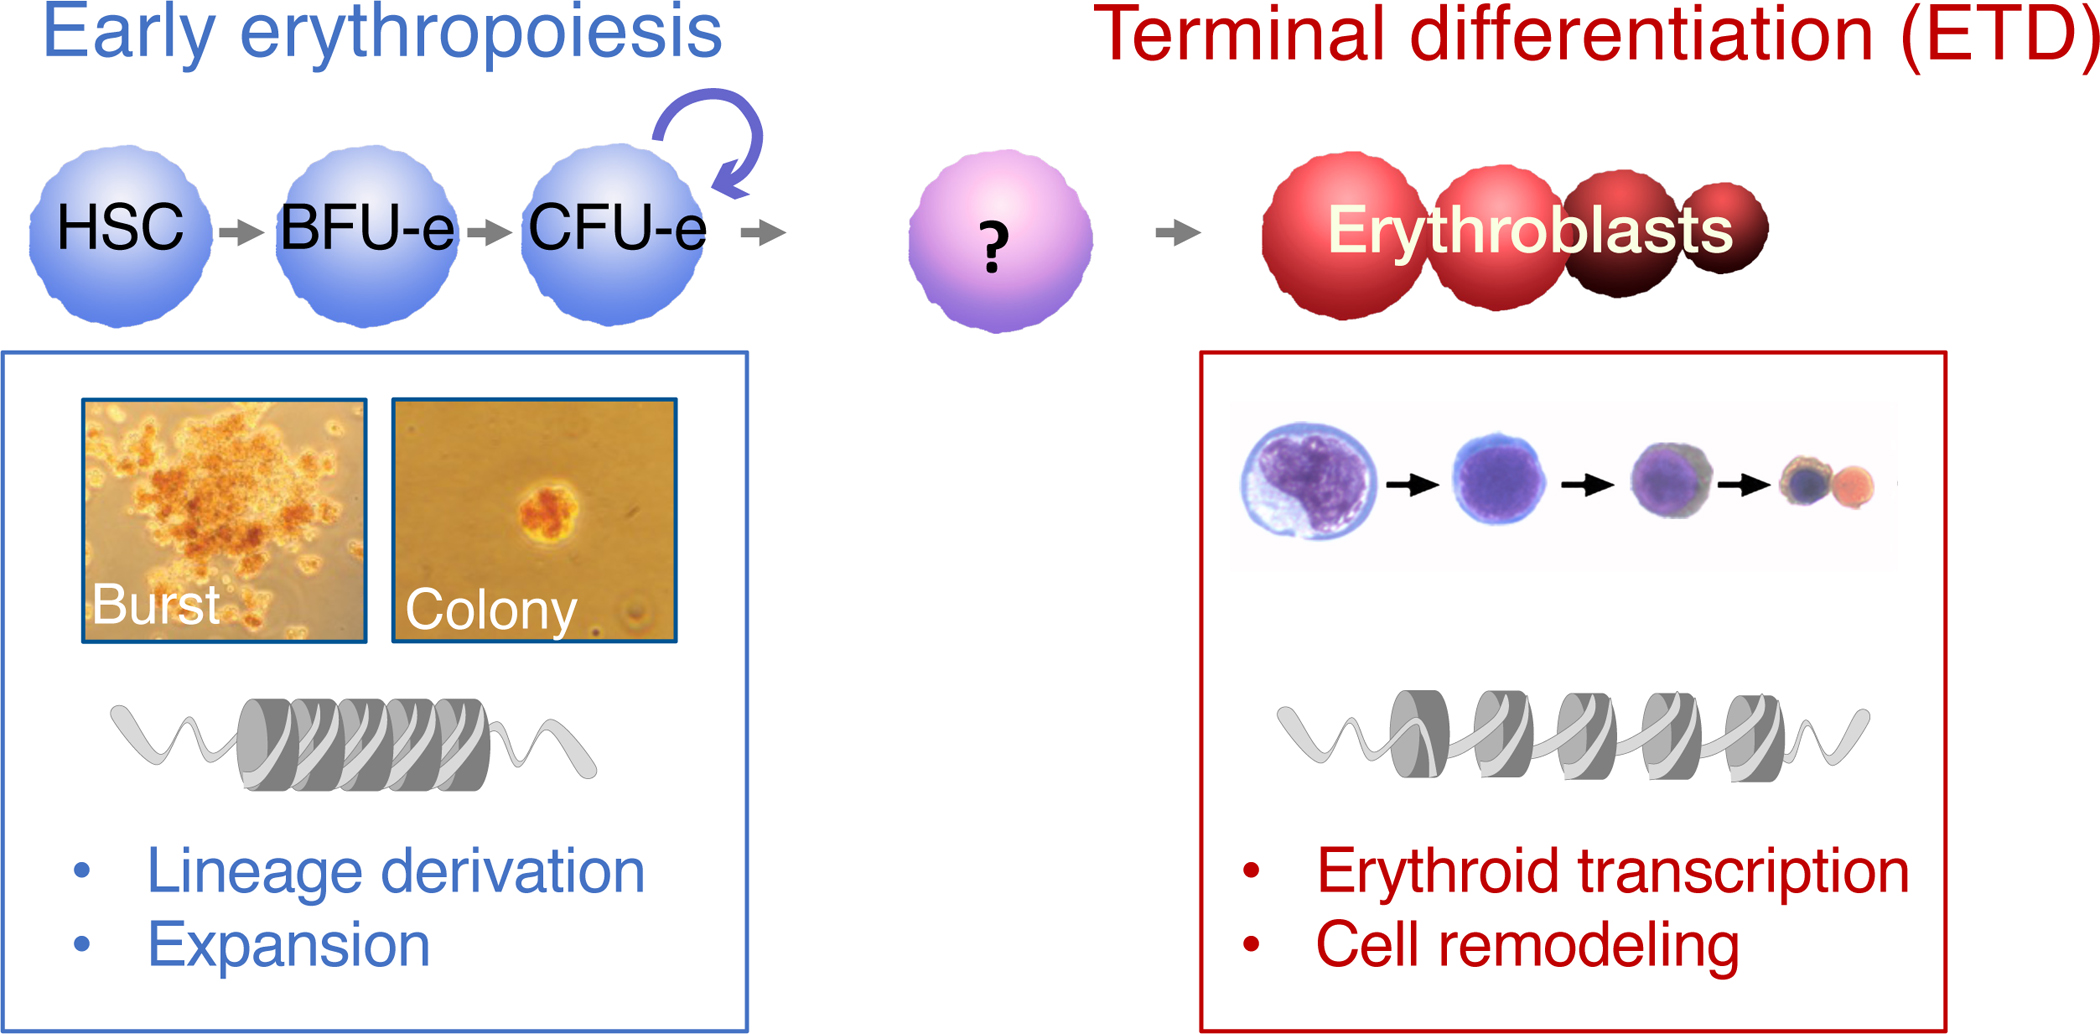
Mammalian erythropoiesis can be broadly divided into two phases, early erythropoiesis, and erythroid terminal differentiation (ETD) (Figure 1). In early erythropoiesis, erythroid lineage-committed progenitors are derived from stem cells and multipotential progenitors, and undergo self-renewal cell division, expanding the progenitor pool. In ETD, erythroblasts express erythroid genes and undergo a limited number of maturational cell divisions, ultimately enucleating to form reticulocytes.
Figure 1. Principal stages of erythropoiesis.
Early erythroid progenitors are defined by their colony forming potential. Erythroblasts during terminal differentiation (ETD) are defined by their morphology. Flow cytometric approaches that make use of FSC and of the cell surface markers CD71 and Ter119 permit prospective isolation of differentiation-stage-specific erythroblasts.
Early erythroid progenitors were first recognized based on their colony forming potential, which falls into 2 broad categories: early rare cells, that in vitro each give rise to a ‘burst’ (a large aggregate of smaller erythroid cell clusters), named burst-forming-unit erythroid (BFU-e) 3–5; and later, more numerous progenitors, that each form a single, small erythroid cell cluster or colony (colony forming unit, CFU-e) 6–8. CFU-e undergo expansion, principally regulated by the hormones erythropoietin (Epo), stem cell factor (SCF) 9–12 and glucocorticoids (GC) 7, 13–15. Unlike their erythroblast progeny, CFU-e do not yet express significant levels of classic erythroid genes such as globins, and are not morphologically recognizable.
The direct prospective isolation of BFU-e and CFU-e from erythropoietic tissue has eluded investigators for decades. As a result, it was difficult to determine precisely when and how CFU-e progenitors lose their self-renewal ability and transition to ETD. This transition is clearly a central regulatory event in erythropoiesis, since it determines the size of the CFU-e progenitor pool and therefore determines erythropoietic rate. The advent of flow cytometry, and most recently single-cell transcriptomics, have revealed unexpected mechanisms that play a role in the critical cell fate decision in which CFU-e activate the ETD process, which are the subject of this review.
The transition from CFU-e to ETD is an S phase-dependent switch
The first critical clues regarding the mechanism of the CFU-e to ETD transition came from flow-cytometric studies that suggested how to identify cells that are in the process of undergoing this transition in the mouse fetal liver (FL) 16. At mid-gestation, over 95% of FL cells are erythroid, making it an excellent model for the study of erythropoiesis. Using the cell surface marker Ter119, an erythroid-specific epitope, together with CD71, the transferrin receptor, we subdivided the FL into 6 subsets, S0 to S5 (Figure 2). Colony formation assays and morphological analysis show that the S0 and S1 subsets contain all of the CFU-e activity in the FL, and that S2 to S5 contain erythroblasts in ETD (Figure 2). It became clear early, however, that, although CFU-e in S0 and S1 give rise to similar colonies in vitro, they are nevertheless fundamentally different. The first line of evidence came from flow cytometric examination of FLs from embryos that lack the erythropoietin receptor (EpoR) 17. Erythroid development in these mutant FLs arrests at the transition from S0 to S1, suggesting that, unlike S0, CFU-e in S1 are dependent on EpoR signaling (Figure 3). The second line of evidence came from cell cycle analysis, in which we subjected embryos to a brief pulse of bromodeoxyuridine, a thymidine analog, in vivo. Together with a DNA dye, this allowed us to resolve the cell cycle phase of each cell. Surprisingly, unlike S0, nearly all S1 cells were in S phase of the cycle.
Figure 2. The mouse fetal liver as a developmental model for studying erythropoiesis.
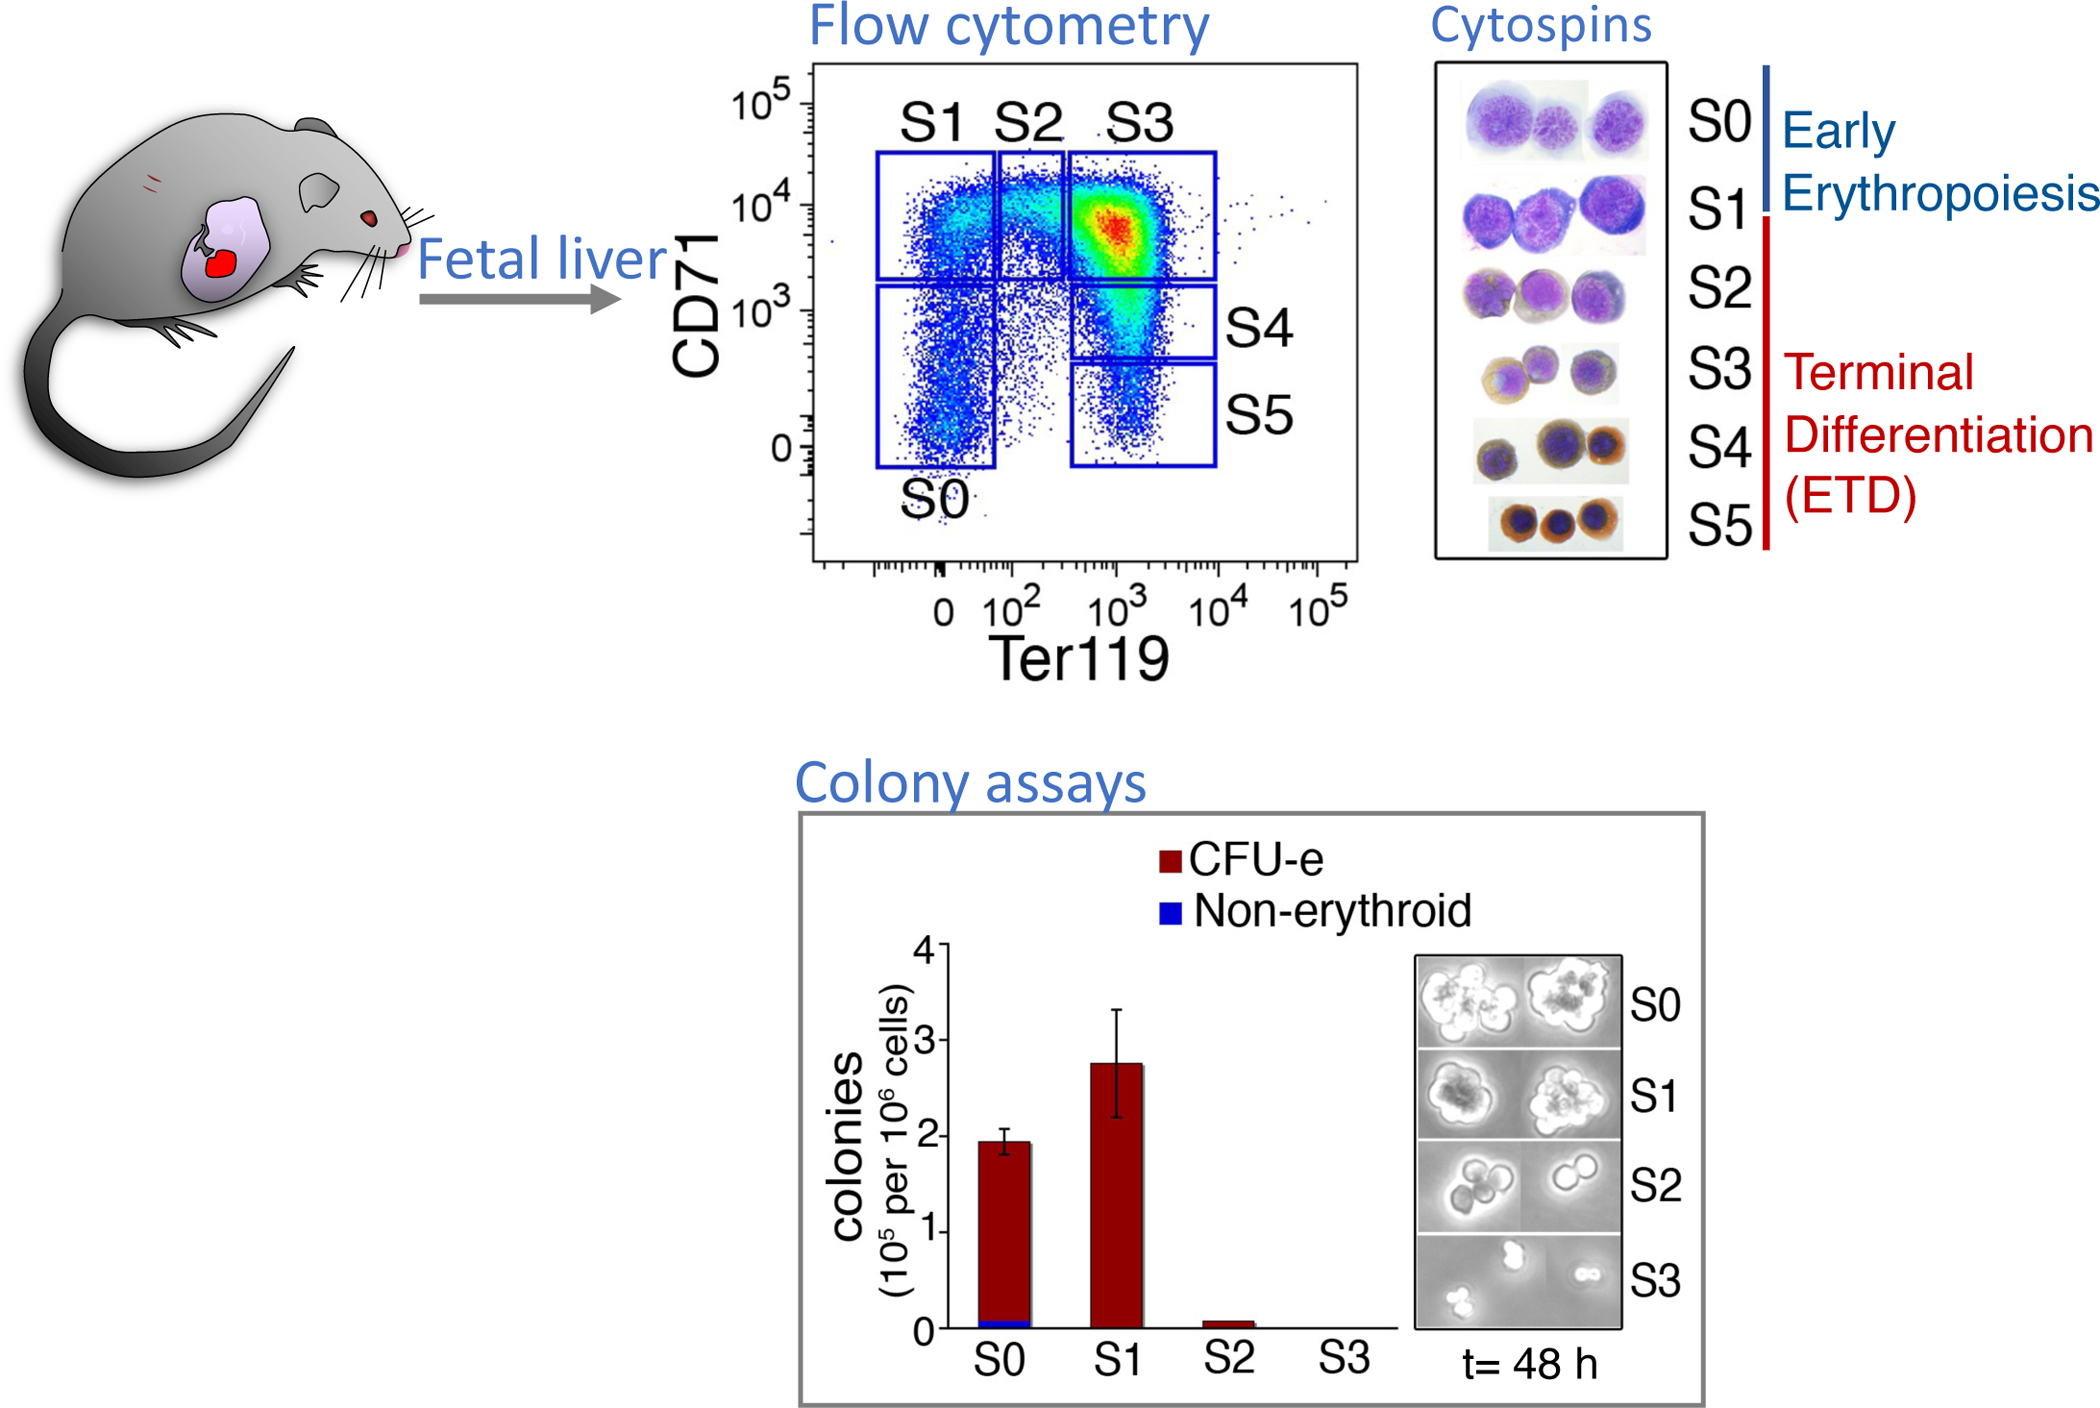
At mid-gestation, the FL is largely an erythroid tissue. Subsets S0 and S1 contain all of the FL CFU-e; subsets S2 to S5 contain erythroblasts in terminal differentiation. Adapted from Pop et al 2010 16.
Figure 3. Onset of Epo/EpoR dependence at the transition from S0 to S1.
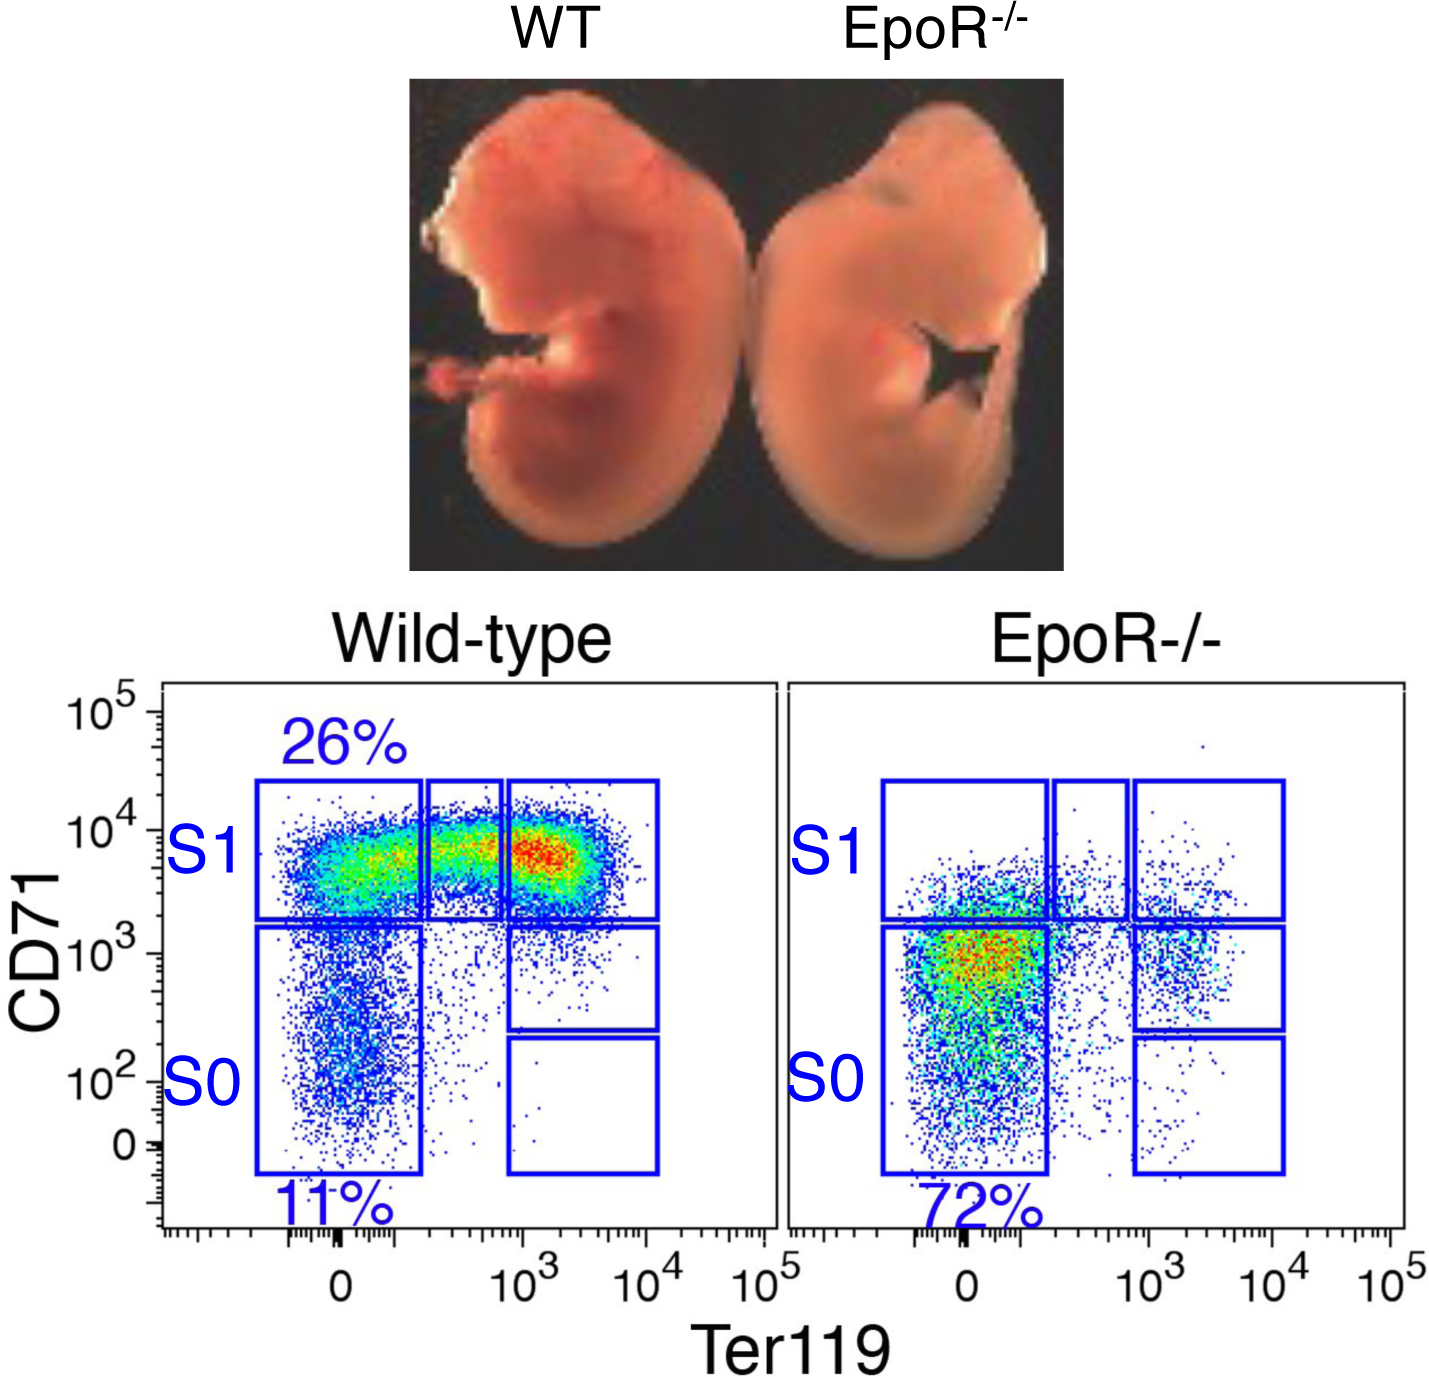
Top panel shows mid-gestation (embryonic day 12.5) littermate embryos. The Epor−/− embryo is pale and has a poorly developed, pale liver. Flow cytometric analysis of the Epor−/− FL shows developmental arrest at the S0/S1 transition 16.
This result and further work 16 showed that the transition from S0 to S1 marks an S-phase dependent cell fate decision where CFU-e cells commit to entering ETD (Figure 4) 16. This decision takes place during S phase of the last generation of the CFU-e stage, coincident with CD71 upregulation. By the time the same cells are ready to undergo mitosis, they have begun to express Ter119 and have transitioned to S2. The S1 subset is therefore a brief, dynamic developmental window, containing cells in S phase of a decisive cycle. We found that the S0/S1 transition is a complex, multi-layered cell fate switch. In addition to marking the onset of EpoR dependence and induction of ETD genes (such as globins, Alas2 and Slc4a1), it is also the time when chromatin at erythroid gene loci undergoes reconfiguration. Chromatin reconfiguration is reflected by a change in the timing of replication of the ß-globin locus, changes in post-translational histone tail modifications, and altered chromatin accessibility at the ß-globin LCR 16 and in erythroid loci elsewhere in the genome 18.
Figure 4. The CFU-e/ETD transition is an S-phase dependent transcriptional switch.
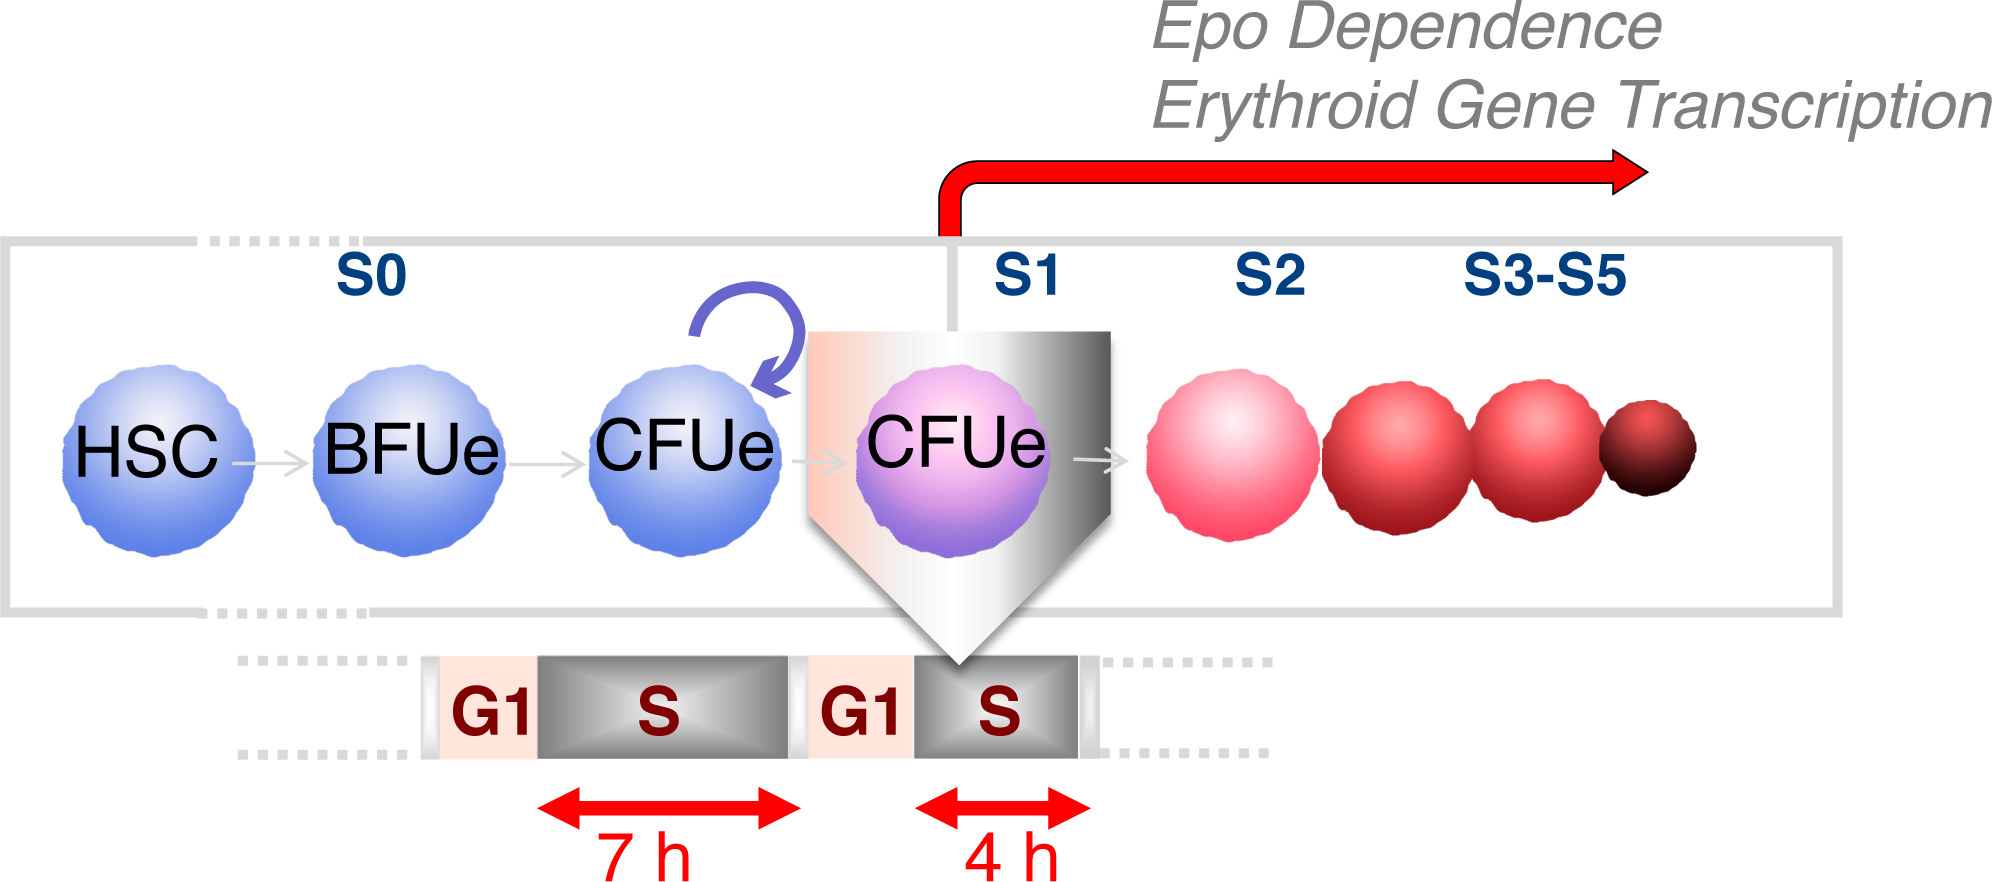
The CFU-e/ETD transition coincides with the transition from S0 to S1, and is an S-phase dependent transcriptional switch. It takes place in early S phase of the last CFU-e generation 16. The S0/S1 transition is characterized by a short cycle lasting only 6 hours, and by a short S phase, lasting only 4 hours. The preceding cycles in S0 have an average duration of 15 hours and an S phase that is 7 hours long 19.
Intriguingly, the cell cycle in which CFU-e transition to ETD is unusually short, including a faster S phase, that lasts only 4 hours, compared with a much longer S phase in either preceding or subsequent cycles 19, 20. The underlying mechanisms and context of this shorter cycle will be discussed below.
Single-cell RNA sequencing of hematopoietic progenitors
As may be appreciated from Figure 4, the S0 subset is heterogeneous, containing several hematopoietic lineages and developmental stages, including all of the elements of early erythropoiesis. This raised a key question: does the transition from CFU-e to ETD actually take place at the S0/S1 junction? Since our studies combined all of the cells in S0 into a single population that was then compared with S1, it remained possible that incremental changes within the S0 subset would be masked. To address this possibility, we needed to find a way of breaking up the S0 subset into its individual components. However, a full delineation of the early erythroid trajectory had not yet been achieved, and it was not known how to isolate BFU-e and CFU-e progenitors prospectively.
In 2015, advances in microfluidics approaches for single-cell RNA sequencing (scRNAseq) suggested a way forward 21, 22. In collaboration with one of the pioneers of this approach, Dr. Allon Klein, we undertook single-cell transcriptomic analysis of all early, Kit+ hematopoietic progenitors in mouse adult bone marrow and fetal liver 23 (Figures 5, 6). Figure 5 shows a Spring plot 24, a 2-dimensional force-directed graph projection of the multi-dimensional gene expression data, in which each dot is a single cell, and proximity between cells reflects similarity in their transcriptomes. Both the bone marrow (BM) and FL progenitors form continuous, branching graphs, that are topologically similar, except that the erythroid branch is particularly prominent in the FL. Cells expressing marker genes of multipotential progenitors (MPP) are in the center of each graph; and each of seven branches terminates with cells expressing genes of a mature blood lineage.
Figure 5. Spring plots of mouse bone marrow (BM) and fetal liver (FL).
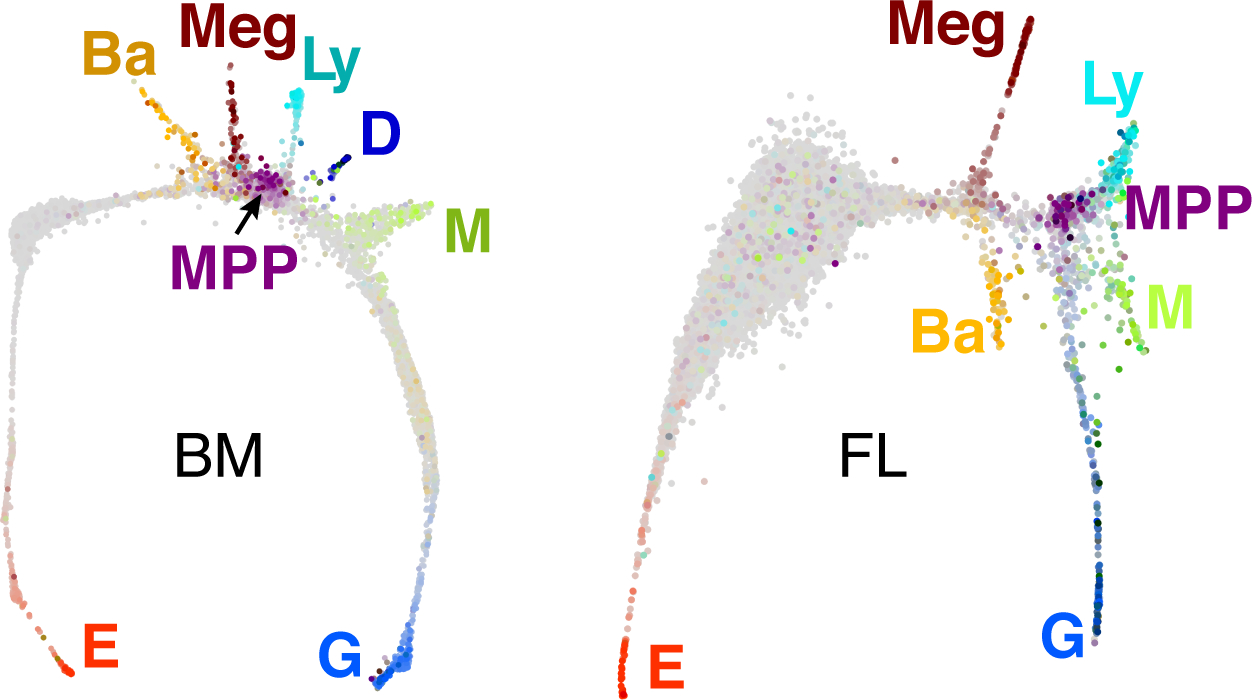
Force-directed graph projections 24 of Kit+ BM and FL hematopoietic single-cell transcriptomes, each represented by one dot. Proximity of dots indicates transcriptome similarity. Cells that are in color (non grey) are either multipotential progenitors (MPP) or express marker genes of mature blood lineages, as follows: E, erythroid; Ba, basophil or mast cell; Meg, megakaryocytic; Ly, lymphocytic; D, dendritic; M, monocytic; G, granulocytic.
Figure 6. Predictions of Population Balance Analysis.
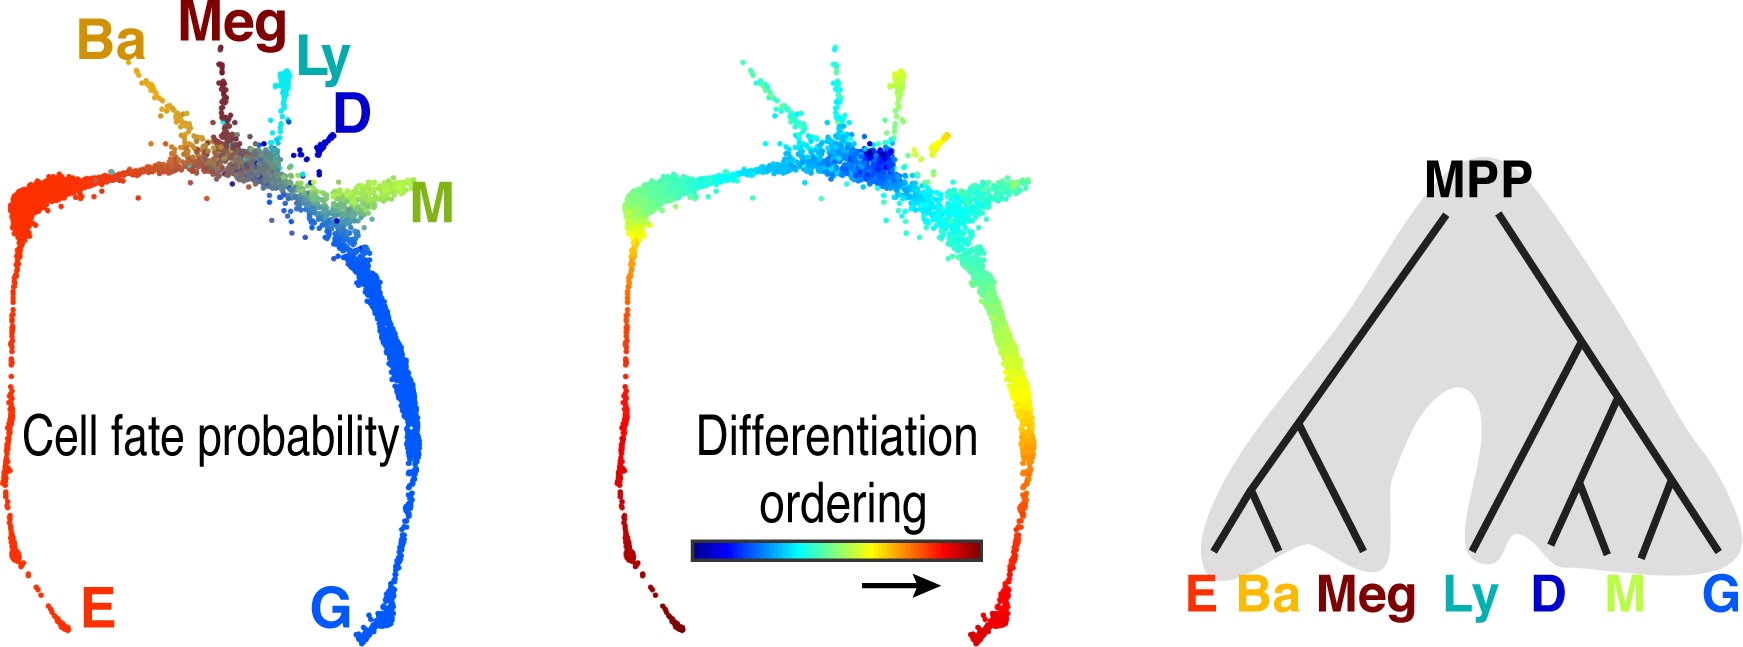
The left panel represents the dominant cell fate probabilities of each cell, colored as indicated (key as in Figure 5). Note that cells in branches are largely committed to one specific lineage, whereas the central area of the graph contains cells with substatial probabilites for more than one lineage. The central panel illustrates predicted differentiation ordering of cells. The right panel illustrates the predicted differentiation hierarchy, based on co-occurrence of specific cell fates in individual transcriptomes (above a threshold probabilitiy). The resuting topology is similar to the classical hierarchy, differing principally in showing differentiation to be a continuous process.
The graphs in Figure 5 are ‘snapshots’ in time that contain a continuum of cell states, from MPP to differentiated blood cells. These snapshots may be used to predict the path taken by MPP as they diversify into the seven blood lineages. To this end, the Klein laboratory developed a novel algorithm, Population Balance Analysis (PBA) 23, 25. Making use of the entire BM gene-expression landscape, PBA assigns each cell with differentiation ‘potential’ and also with a set of seven cell fate probabilities, of attaining each of the seven ultimate cell fates. A cell early in its differentiation path has high potential and substantial probabilities of attaining any of several cell fates; a cell within a given branch of the graph has low probability for any lineage other than the one that terminates its branch, and can be considered a ‘committed’ progenitor (Figure 6). Analysis of correlations between any two or more predicted cell fates suggested the path that MPP take in their differentiation, and showed it to be hierarchical (Figure 6, right panel). MPP diverge early, to take on either a lympho-myeloid or a megakaryocytic/ basophil-mast cell/ erythroid potential. This topology resembles older models of hematopoiesis, derived from colony formation assays and from flow cytometry. The principal difference between the classical hierarchy 26–28, and that derived from scRNAseq by us 23 and by others 29–31, is that the latter is continuous, suggesting that hematopoietic differentiation is a process of incremental continuous change between numerous cell states, as opposed to the classical view, which postulated transition between a small number of discrete states.
The scRNAseq topology also revealed novel associations between cell fates that were previously unknown. These include an association between the basophil/ mast cell fates and the erythroid branch, predicting the existence of bi-potential progenitors with both cell fates (Figures 5, 6). An initial single-cell fate assay experiment confirmed this and other predictions 23, which were also observed by other groups 29, 31.
Analysis of the erythroid trajectory using single-cell RNA sequencing
We defined the erythroid trajectory, starting with MPP, as consisting of cells whose probability of committing to the erythroid fate increases with increasing distance from MPP (Figure 7A). Based on transcriptome information, we devised a novel flow cytometry strategy that allowed us to isolate cells in specific contiguous segments of the erythroid trajectory, and to test their cell fate potential in vitro. This, together with transcriptome information, allowed us to subdivide the trajectory into 5 segments; MPP, Erythroid/Basophil-mast cell/Megakaryocytic progenitors (EBMP), Early Erythroid progenitors (EEP), functionally corresponding to BFU-e; Committed Erythroid progenitors (CEP), functionally corresponding to CFU-e; and ETD.
Figure 7. scRNAseq analysis of the erythroid trajectory.
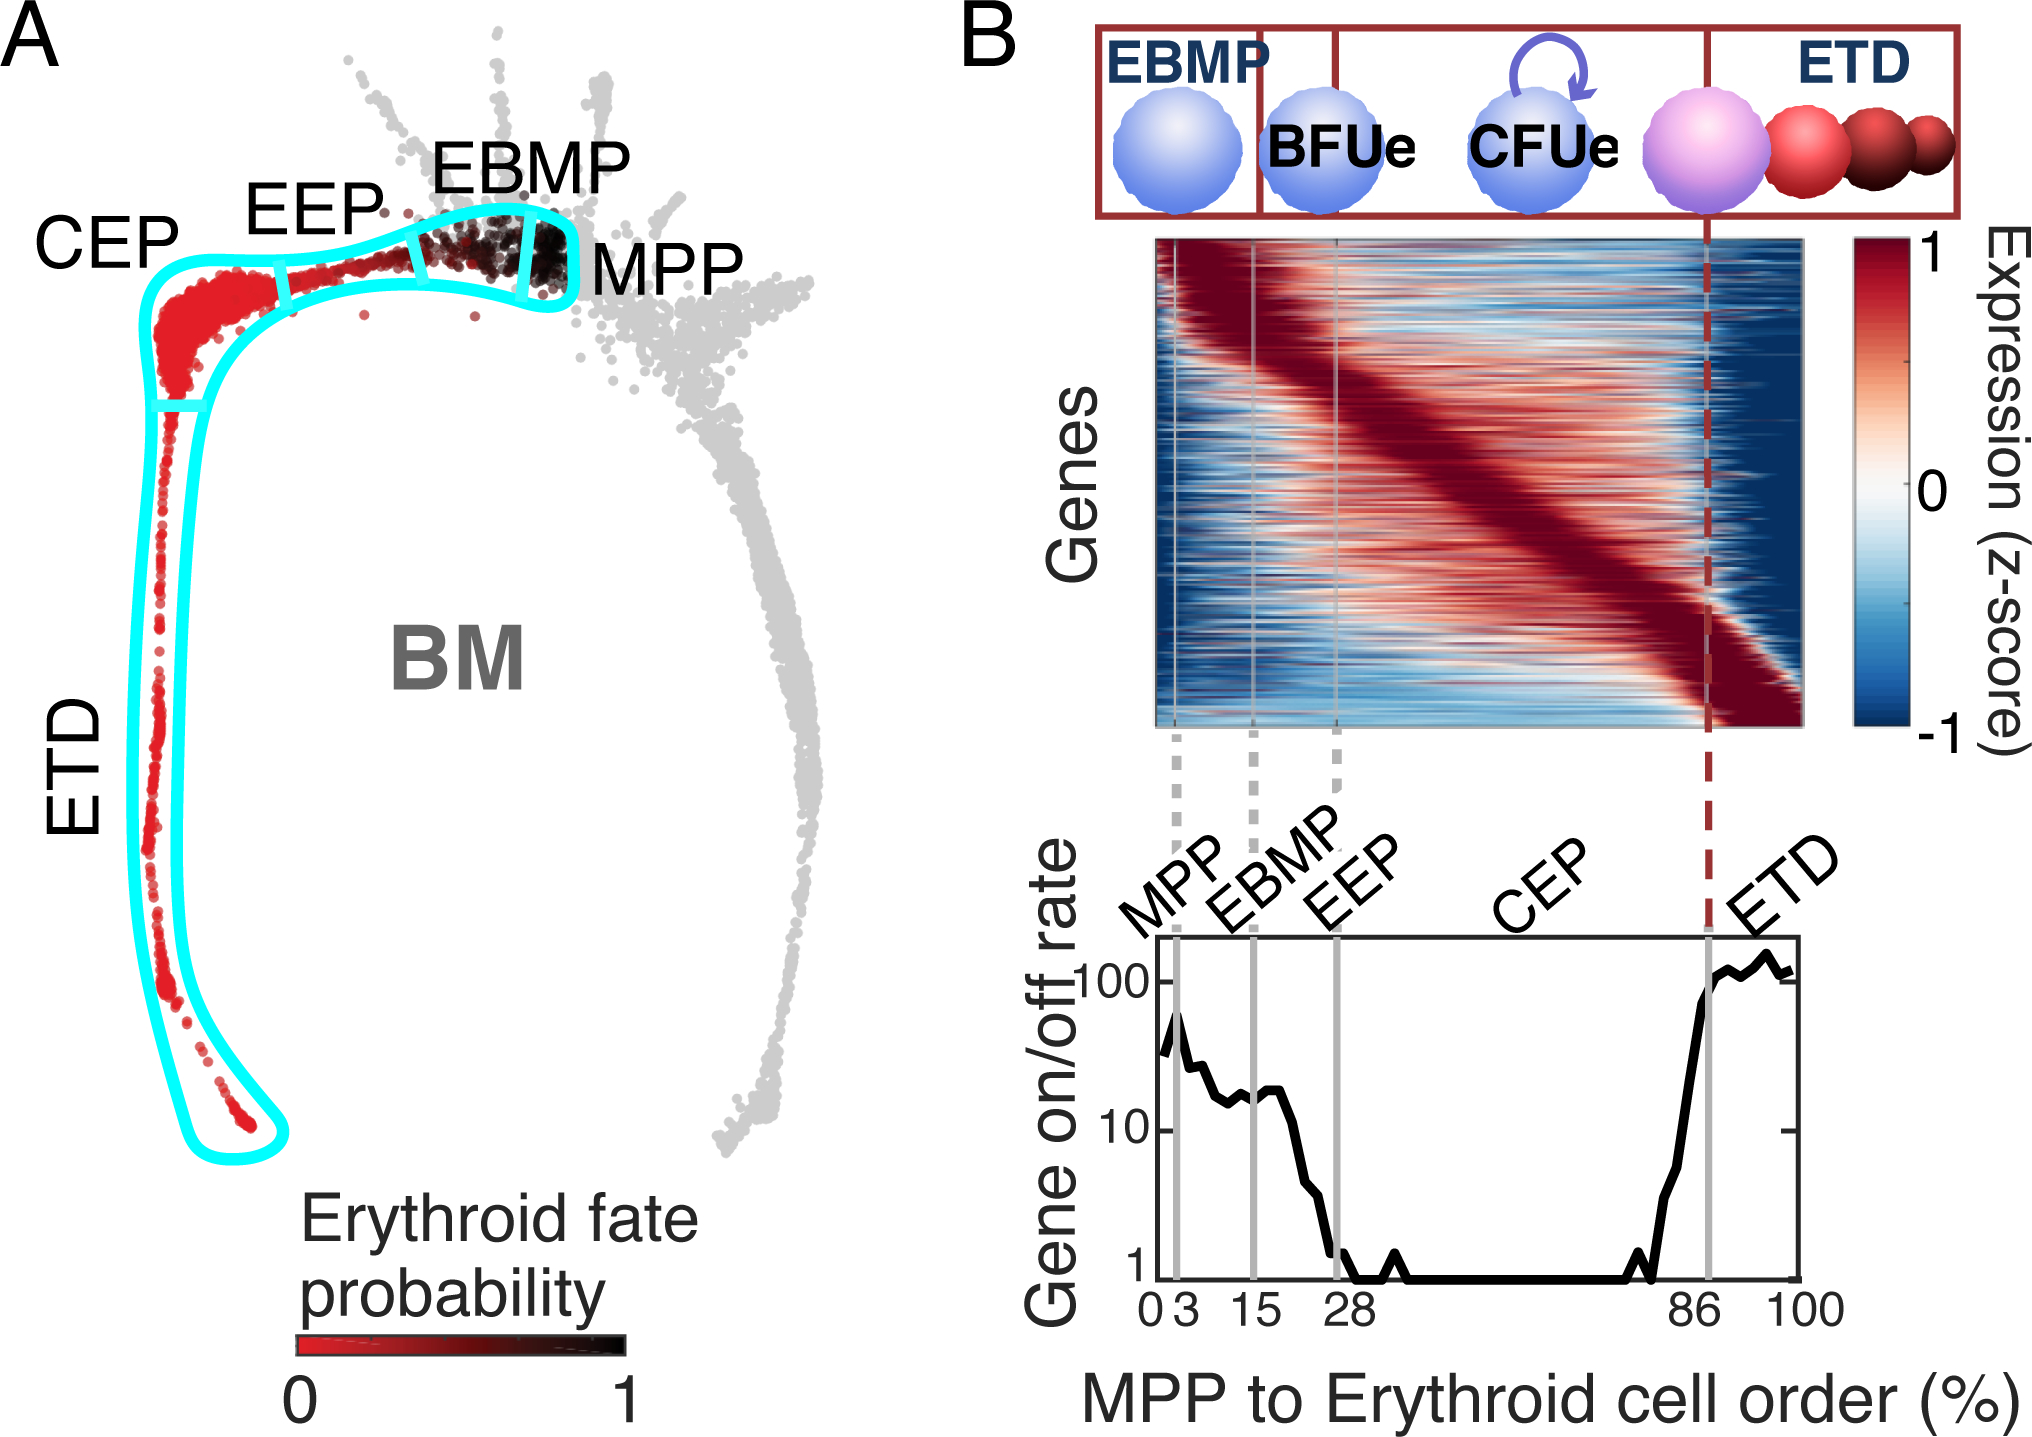
A The erythroid trajectory includes all cells whose erythroid fate probability increases with increasing distance from MPP. It is divided into the following segments, based on transcriptomic and cell fate analysis: MPP, multi-potential progenitors; EBMP, erythroid/basophil-mast cell/megakaryocytic progenitors; EEP, early erythroid progenitors, functionallly BFU-e; CEP, committed erythroid progenitors, functionally CFU-e; ETD, erythroid terminal differentiation.
B The CFU-e to ETD transition is a rapid transcriptional switch. Upper panel: erythroid trajectory cells are arranged along a linear axis. Rows denote differentially expressed genes along the trajectory, in order of their peak expression. Lower panel: the number of genes that turn on or off at each point of the trajectory. These data show that the CFU-e/CEP stage expresses a dedicated transcriptional program, which changes sharply at the switch to ETD (dashed red line).
When arranging erythroid trajectory cells along a linear axis (‘erythroid cell order’ or pseudotime) and visualizing differentially expressed genes, three broad phases stand out (Figure 7B). In the initial phase, encompassing the MPP, EBMP and EEP (BFU-e) stages, there is rapid transcriptional change. Transcriptional activity settles into a stable phase during the CEP (CFU-e) stage, with few genes switching on or off, in line with this being principally a self-renewal or expansion phase. It is interesting to note that the CEP (CFU-e) stage is the result of a dedicated transcriptional program, that is not simply an early version of the subsequent ETD program. The transition from CFU-e to ETD is marked by a sharp transcriptional switch, with multiple genes rapidly turning on or off (Figure 7B, dashed red line at the 86% mark of the pseudotime axis). Thus, scRNAseq provides clear evidence that the CFU-e to ETD transition is a rapid transcriptional switch, taking place within a narrow developmental window.
The transcriptional context of the CFU-e/ETD switch is dominated by the cell cycle
We next examined the erythroid transcriptional pseudotime for the context in which the CFU-e/ETD switch takes place 23. We looked at transcription factors that positively regulate induction of the ETD transcriptional program, including Gata1, Klf1, Tal1, Zfpm1; and transcription factors that are negative regulators of ETD, such as Spi1 (PU.1) and Gata2 (Figure 8, upper panel). Surprisingly, expression changes in these regulators take place well before the CFU-e/ETD transition. For example, Gata1 is induced at the EBMP stage, and Gata2 declines soon after, by the EEP (BFU-e) stage. Therefore, transcription factor expression per se (at least, at the transcript level) does not appear to determine the timing of the CFU-e/ETD switch. Similarly, the timing of the switch cannot be explained by the expression profiles of key erythroid signaling pathways, EpoR, Stat5 or Kit (Figure 8, middle panel), although it clearly coincides with sharp upregulation of Tfrc (CD71), a target of EpoR/Stat5 signaling. The latter is in agreement with our earlier, functional findings that the CFU-e/ETD switch is synchronized with the S0/S1 transition (CD71 upregulation) in the FL 16.
Figure 8. The transcriptional context of the CFU-e/ETD switch.
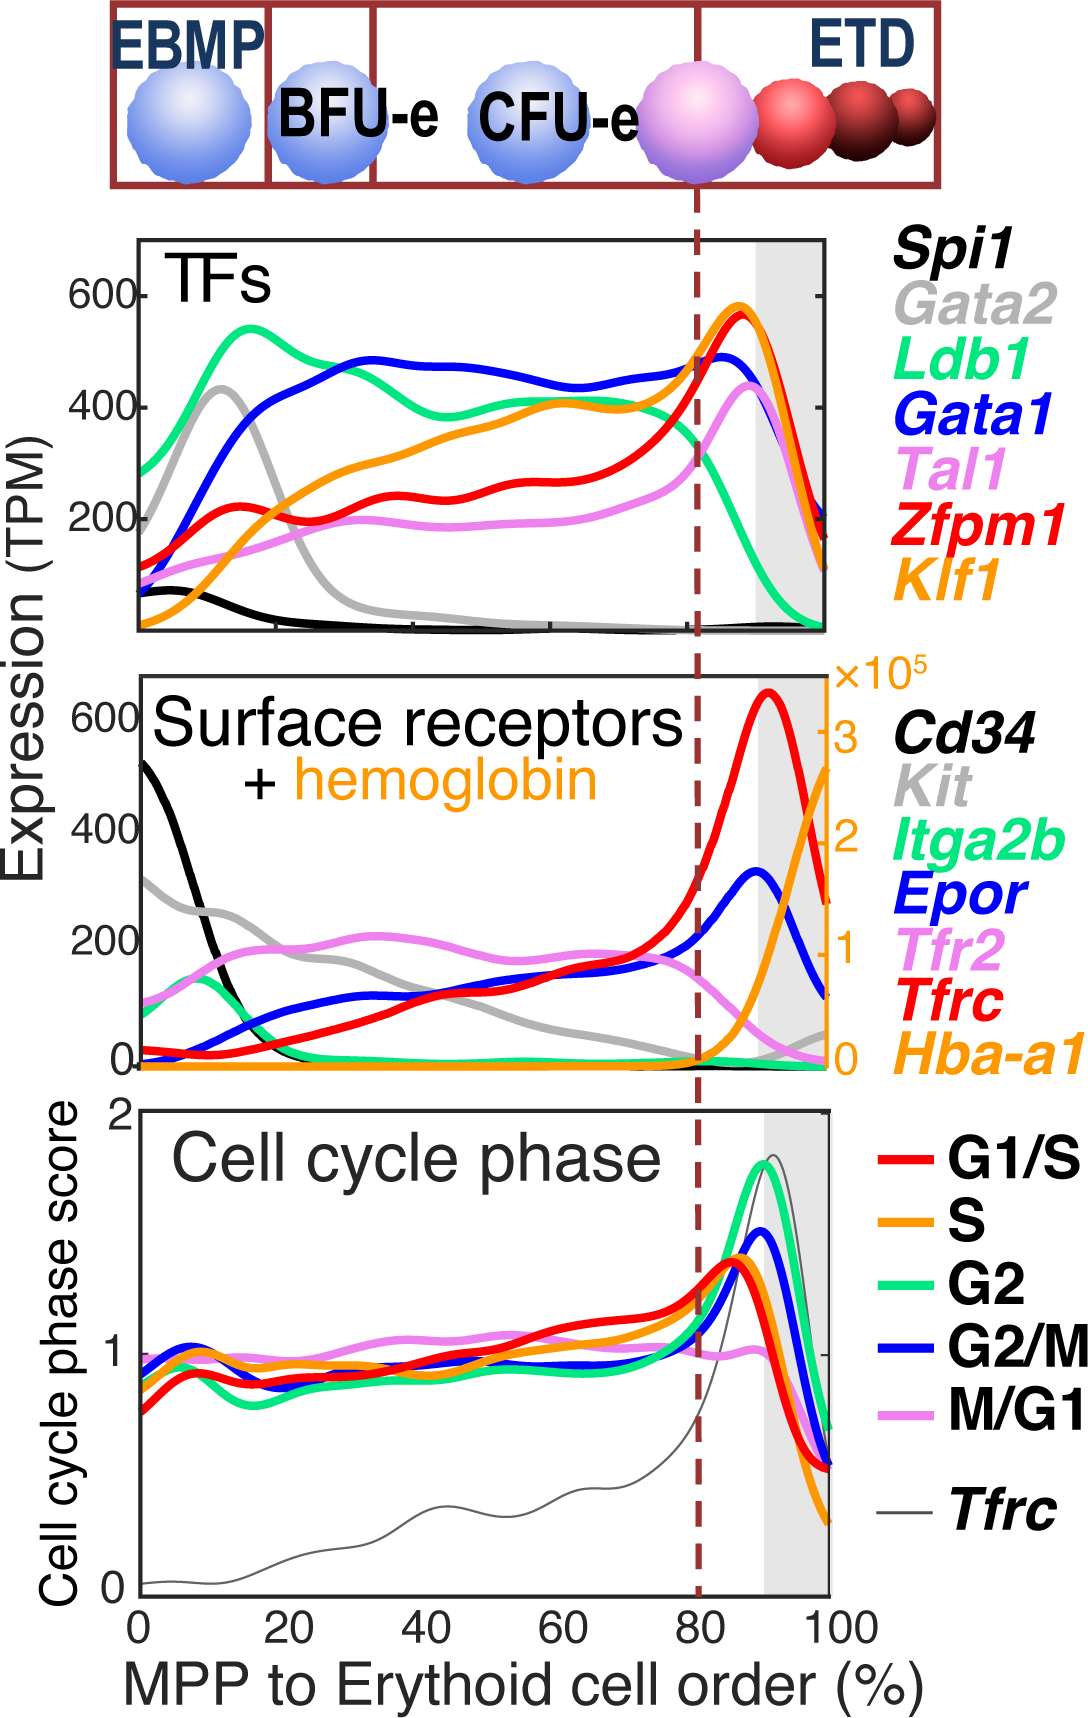
Expression profiles of transcription factors relevant to erythroid differentiation (upper panel) and signaling molecules (middle panel) show that expression of these regulators does not explain the timing of the CFU-e/ETD switch (dashed vertical line). By contast, cell cycle phase, as determined by chatacteristic expression of cell cycle genes, shows synchronization between G1/S and S phase of the cycle and the CFU-e/ETD switch (dashed line).
By contrast with transcription factors and signaling molecules, cell cycle gene expression is highly orchestrated around the CFU-e/ETD switch. In the early part of the erythroid pseudotime, there is little variation in transcriptionally- assigned cell cycle phase, suggesting that cells are cycling asynchronously with respect to their developmental stage. But as cells approach the CFU-e/ETD switch, the fraction assigned to either G1/S or S phase gradually increases, peaking at the switch itself. Further, these peaks are closely followed by peaks in G2, G2/M and M/G1, suggesting that the CFU-e/ETD switch is highly synchronized with a specific cell cycle (Figure 8, lower panel). The peak in S phase gene expression coincides with upregulation of Tfrc (CD71) and is closely followed by induction of ETD genes, exemplified by Hba-a1. These findings provide orthogonal confirmation, at the single-cell transcriptional level, of our earlier data, which showed that the CFU-e/ETD switch is synchronized with, and dependent on, S phase of the cycle 16. Of note, these cell cycle patterns are obtained even when cell cycle genes are removed from the algorithm used to generate the erythroid pseudotime ordering 23.
To investigate in an unbiased way transcriptional change that leads up to, and potentially determines, the CFU-e/ETD switch, we screened for genes whose expression is either highly correlated, or highly anti-correlated, with progression along the erythroid pseudotime. The top scoring gene-ontology groups in this analysis were all related to DNA replication and the cell cycle; in particular, we found that S phase gene expression increases steadily with progression through the EEP (BFU-e) and CEP (CFU-e) stages, peaking at the CFU-e/ETD switch (Figure 9A) 23. Flow cytometric analysis showed that this gene expression pattern is explained by the progressive increase in the fraction of cells in S phase, and a corresponding decrease in G1 cells, during the period preceding the CFU-e/ETD switch (Figure 9B). S phase duration through most of the erythroid trajectory remains constant; therefore, the gradual increase in S phase and decrease in G1 are explained by a gradual shortening of the G1 phase as cells advance through the BFU-e and CFU-e stages towards the CFU-e/ETD switch (Figure 10) 23.
Figure 9. The CFU-e/ETD switch is preceded by gradual shortening in G1 phase of the cycle.
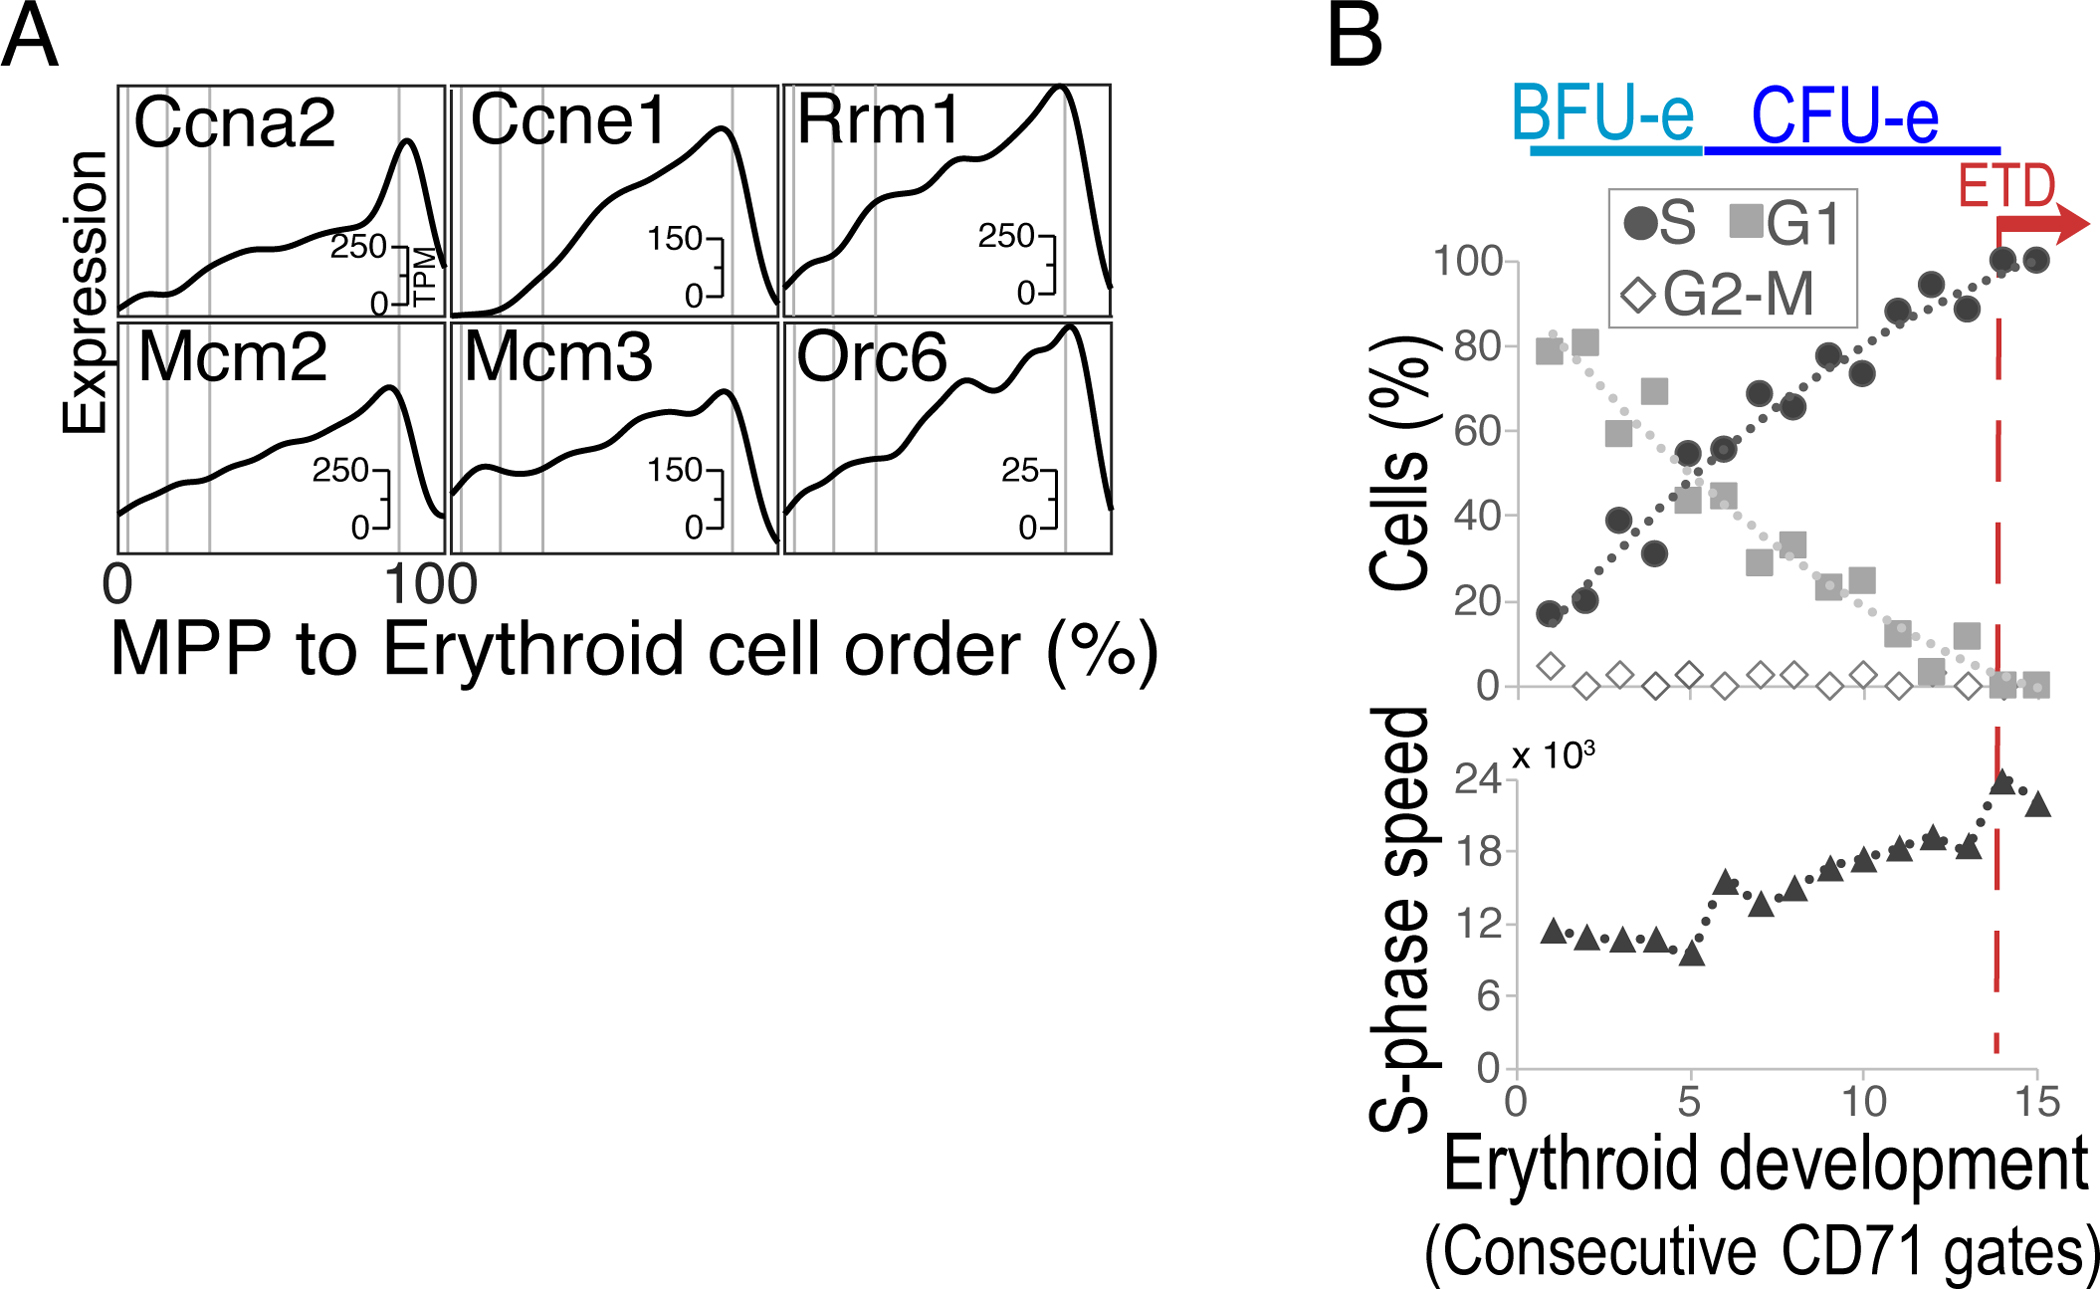
A Cell cycle genes are among the genes whose expression is most highly correlated with progression along the erythroid trajectory. Shown are examples of genes expressed in S phase, whose expression ramps up gradually, peaking at the CFU-e/ETD switch.
B Flow cytometric analysis of cell cycle phase and S phase speed along the erythroid trajectory shows a gradual increase in the fraction of cells in S phase, a complementary decrease of cells in G1, and a relatively constant S phase speed, as cells progress through the trajectory. These findings suggest gradual shortening of G1 phase preceding the CFU-e/ETD switch. The speed of S phase increases abruptly at the switch to ETD (dashed red line).
Figure 10. Regulatory role of the cycle in erythroid developmental decisions.
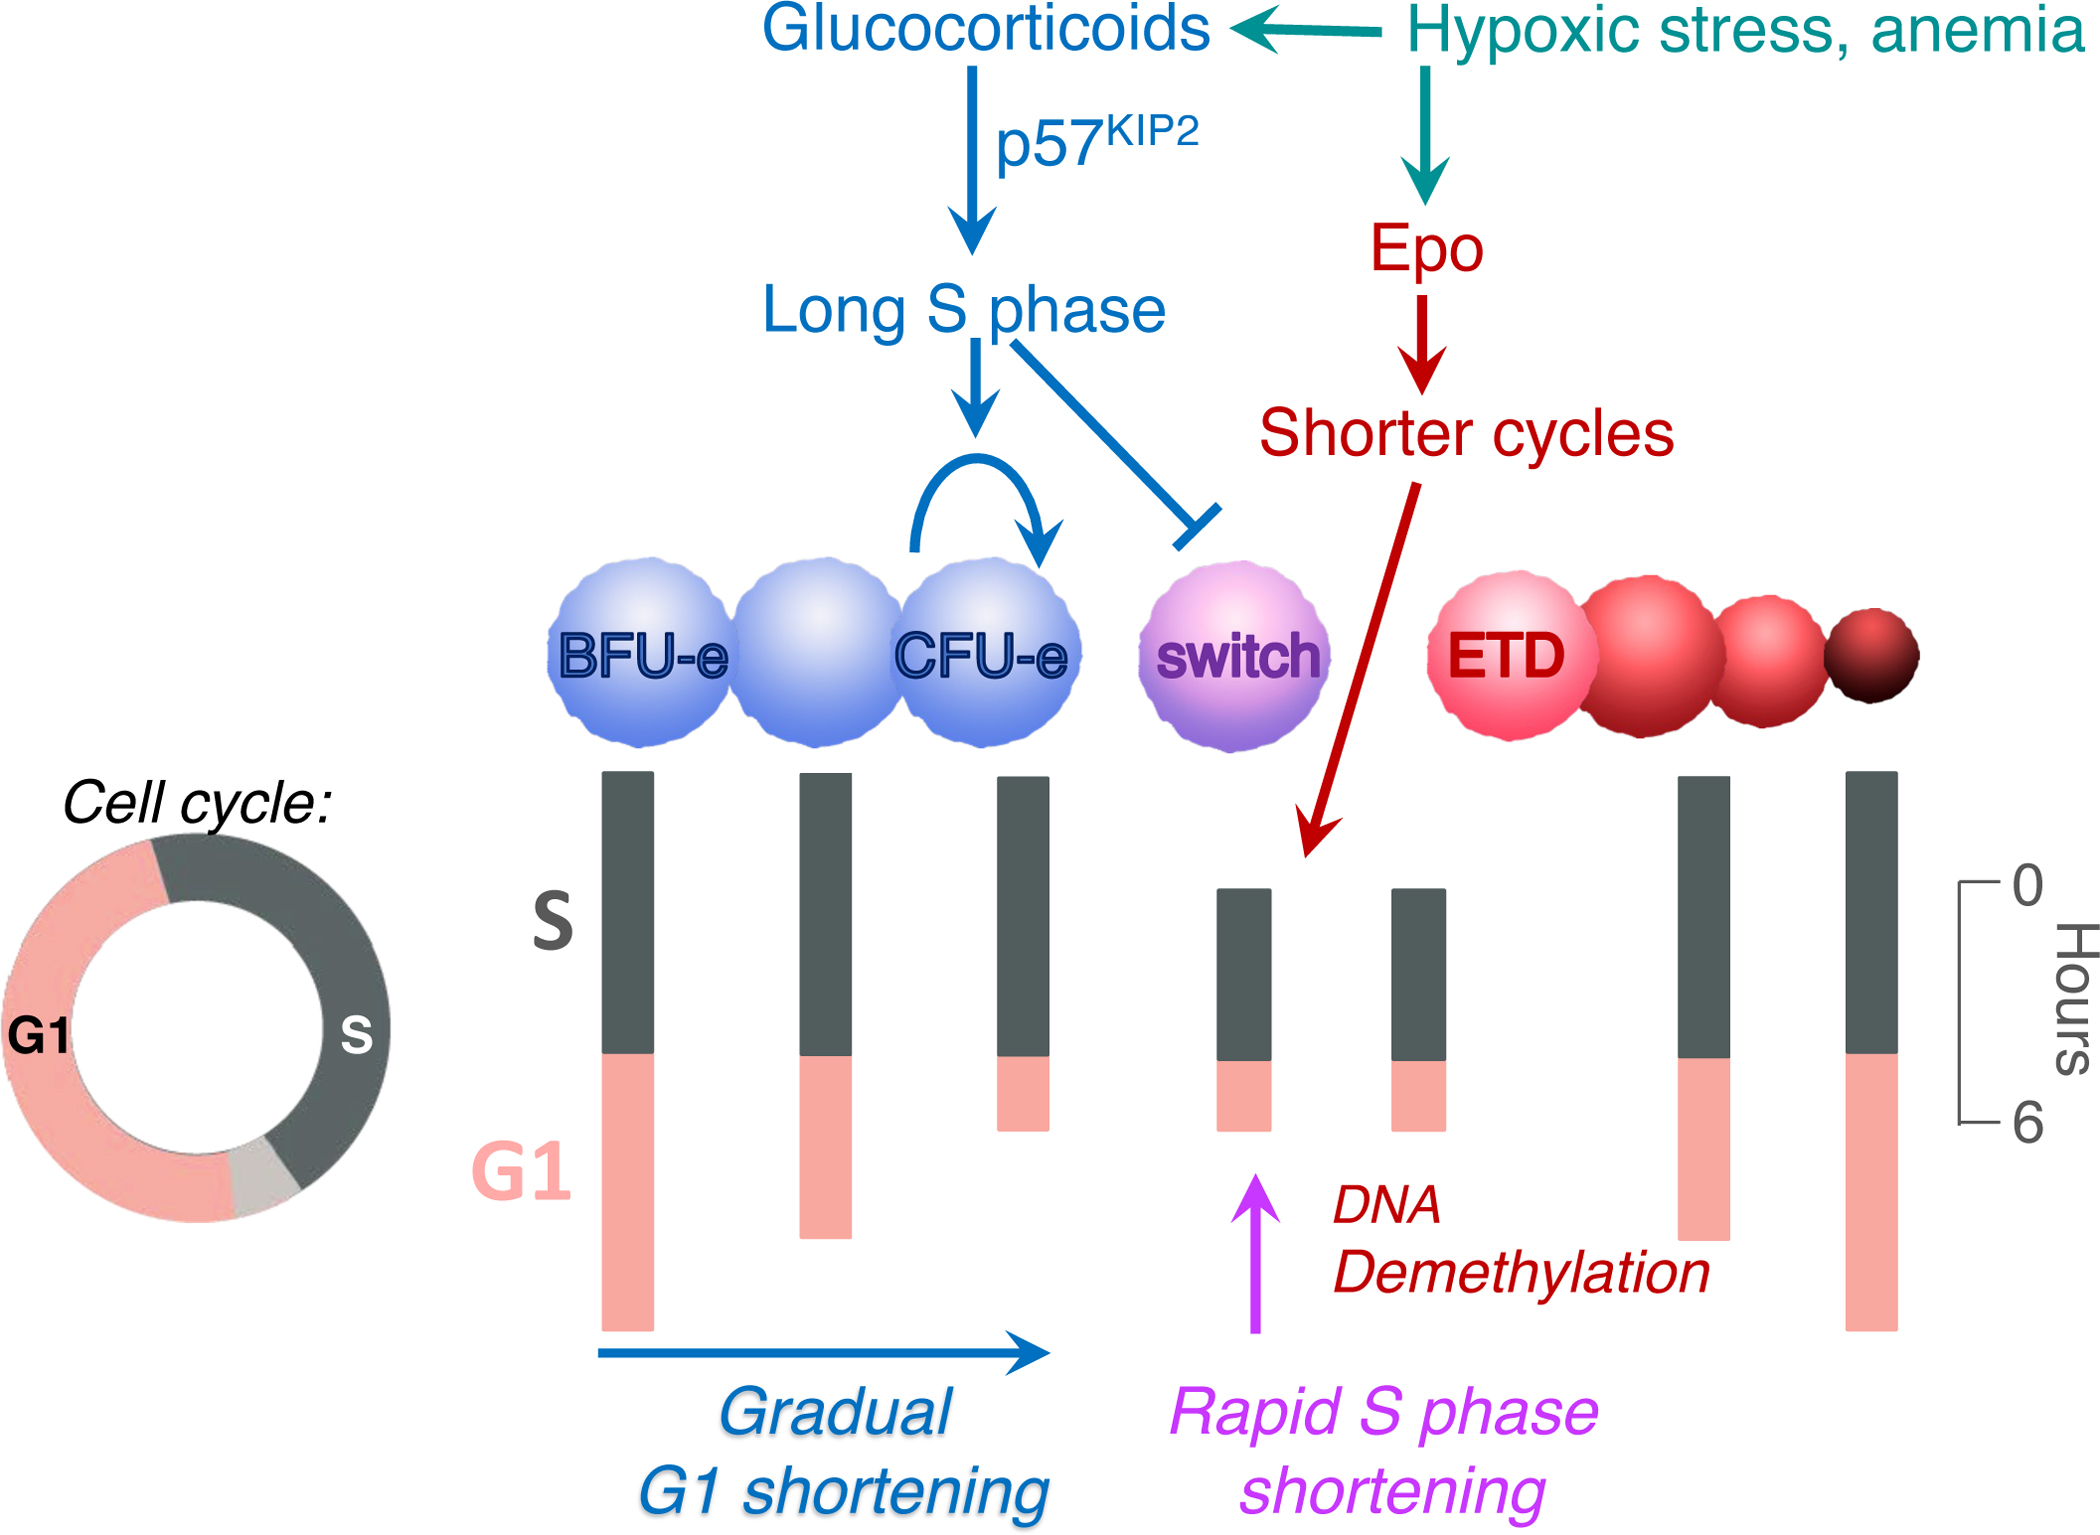
Changes in cell cycle duration throughout the erythroid trajectory. The cycle is represented vertically. S phase speed influences whether CFU-e undergo a transcriptional swtich to ETD: a long S phase inhibits, and S phase shortening promotes, the switch. Glucocorticoids and erythropoietin exert their positive regulation of erythropoietic rate in response to stress through regulation of S phase and cell cycle speeds.
Taken together, both transcriptional and functional approaches suggest remarkable remodeling of the cell cycle that takes place in lock step with developmental events of the erythroid trajectory16, 19, 20, 23, 32. We observe cells undergoing gradual shortening in G1 as they progress through the BFU-e and CFU-e stages; this is followed by an abrupt shortening in S phase at the CFU-e/ETD switch. The resulting cycle at the switch is one of the shortest somatic cycles, lasting only 6 hours in adult mouse BM 19, 33. Subsequent to the CFU-e/ETD switch, the cycle gradually elongates again (Figure 10).
Mechanisms regulating cell cycle and S phase duration during erythroid development
We’ve identified two largely independent pathways responsible for the faster cell cycle and short S phase at the CFU-e/ETD switch. First, EpoR signaling via Stat5, which becomes active at the CFU-e/ETD switch 34, decreases doubling time of early erythroblasts both in vitro and in vivo 35. The shorter cycle is the result of shortening in both G1 phase and in S phase, as is evident from measurement of the rate of incorporation of the thymidine analog bromodeoxyuridine (BrdU) into S phase cells 35. Second, the cyclin-dependent kinase inhibitor (CDKI) p57KIP2, which is expressed in S phase of BFU-e and CFU-e progenitors, is downregulated at the CFU-e/ETD switch 19. p57KIP2 slows S phase in CFU-e, and its downregulation leads to shortening of S phase at the switch, as is evident from the prematurely-shortened S phase in p57KIP2 -deleted CFU-e 19.
What is the mechanism that drives faster genome replication during the shortened S phase at the CFU-e/ETD switch (S1 cells in the FL)? In eukaryotes, genome replication is initiated asynchronously at multiple origins of replication, from which replication forks progress in both directions along the linear chromosome. Faster replication can result from increased frequency of origin ‘firing’ per unit time. An extreme example of this mechanism occurs in the early embryos of model organisms, when genome replication is initiated synchronously at closely-spaced origins and completed in minutes 36. Faster replication may also be the result of faster progression of replication forks, a mechanism for which there was no precedent in physiological settings. Surprisingly, single-molecule studies of replicating DNA fibers (‘DNA combing’) showed that the faster S phase at the CFU-e/ETD switch is the result of replication forks progressing at a 50% faster rate 19. Further, replication forks are prematurely faster in p57KIP2 -deleted CFU-e, suggesting that fork progression rate increases at the CFU-e/ETD switch as a result of an increase in CDK activity that occurs with the downregulation of p57KIP2. Fork progression rate was recently found to increase in germinal center B cells receiving T-cell help, which together with our data in the erythroid lineage, suggests that the regulation of replication fork speed may be tied to cell fate decisions in multiple settings 37.
Cell cycle and S phase duration regulate developmental decisions
How are the orchestrated changes in cell cycle structure and speed related to erythroid development? In particular, are they cause or consequence of the specific developmental stages to which they are linked? Although the work to address these questions is ongoing, our results to date suggest that the duration of S phase in CFU-e can determine whether or not they undergo the switch to ETD.
We found that a longer S phase is essential for maintenance of the CFU-e cell state, inhibiting the CFU-e/ETD switch (Figure 10) 19. This effect is exemplified by the mechanism of action of glucocorticoids, which have long been known to be essential for CFU-e expansion during the erythropoietic response to hypoxic stress 14, 15. We found that glucocorticoids enhance expression of p57KIP2 in CFU-e, which in turn slows fork progression and prolongs S phase. Critically, p57KIP2 -deleted CFU-e have a short S phase and fail to undergo self-renewal in culture, but this deficit can be rescued with the addition of a CDK2-inhibiting drug that mimics p57KIP2 19. The induction of p57KIP2 was found to be essential for glucocorticoid responsiveness of human CFU-e 38. Taken together, inhibition of CDK activity by glucocorticoid-induced p57KIP2 leads to prolongation of S phase, which in turn promotes the CFU-e cell state over the switch to ETD, favoring CFU-e expansion. It is worth noting that this effect might appear paradoxical, since CDK inhibition is usually thought of as an anti-proliferative activity. In the context of erythroid differentiation, however, CDK inhibition, by virtue of a longer S phase duration, promotes CFU-e expansion over transition to terminal differentiation,.
The mechanism through which a slower S phase maintains the CFU-e cell state is not known. We hypothesize that a slower S phase may allow a more faithful replication of the epigenetic state, thereby favoring cell state maintenance 39. By contrast, a faster S phase may disrupt the faithful replication of epigenetic marks, potentially facilitating a cell state switch. Support for this hypothesis comes from studies on DNA methylation 20. Starting at the CFU-e/ETD switch, there is gradual, global loss of DNA methylation from essentially all genomic elements in differentiating erythroblasts, reaching an overall loss of approximately 30% of all DNA methylation 20, 40–42. Demethylation is replication dependent, and at the onset of ETD, is also dependent on the very fast S phase in S1 cells. Slowing of this S phase, by partially inhibiting DNA polymerase, prevents demethylation, and in turn slows the induction of ETD genes 20. Therefore, the fast S phase at the CFU-e/ETD switch, by not allowing sufficient time for DNMT1-mediated copying of parental methylation marks to nascent DNA, facilitates the induction of new genes, that is, the switch to a new cell state.
Summary and wider context: the role of the cell cycle in cell fate decisions
Early erythropoiesis is a time of progenitor self-renewal and expansion. The transition from this stage to ETD is a critical event that terminates progenitor expansion, and induces expression of erythroid genes. The decision to transition from the CFU-e stage to ETD determines the size of the CFU-e progenitor pool, and its delay at times of erythropoietic stress increases the size of the CFU-e pool, driving higher erythropoietic rate. Flow cytometric approaches, and more recently, single-cell transcriptomics, have began to shed light on the mechanisms that underly the CFU-e/ETD transition, showing it to be a rapid transcriptional switch that is S phase dependent, and that takes place in S phase of the last CFU-e generation. The S phase in which this switch takes place is shorter and faster than S phase in either preceding or subsequent cycles, as a result of faster progression of replication forks. Both the onset of EpoR and Stat5 signaling, as well as downregulation of the CDKI p57KIP2, are responsible for S phase shortening at the CFU-e/ETD switch.
Developmental pseudotime analysis of single cell transcriptomic data suggests that the developmental profile of transcription factor expression does not explain the timing of the switch. By contrast, the same transcriptomic analysis and functional experiments show that the cell cycle undergoes dramatic remodeling in lock-step with progression along the erythroid trajectory. Thus, gradual shortening of the G1 phase with progression along the BFU-e and CFU-e stages is followed by an abrupt shortening in S phase at the time of the switch.
S phase duration has a causal role in the timing of the CFU-e/ ETD switch. A longer S phase inhibits the switch and maintains CFU-e self-renewal, an effect that explains the long-known action of glucocorticoids. Glucocorticoids promote an increase in erythropoietic rate during hypoxic stress and also when used therapeutically, in Diamond Blackfan Anemia. Glucocorticoids induce p57KIP2 in CFU-e, preventing S phase shortening and promoting CFU-e self renewal, thereby increasing the size of the CFU-e pool and erythropoietic rate (Figure 10). By contrast, a shorter S phase promotes the induction of ETD genes, in part by not allowing sufficient time for the replication of DNA methylation marks during S phase, resulting in DNA demethylation.
What is the relevance of these findings to non-erythroid lineages? Although some aspects of cell cycle regulation had been known to be relevant to development for some time, the relevance of S phase duration is becoming clearer only recently 32. S phase shortening at the onset of mammalian gastrulation had been known for many decades 36, 43–45, but was perhaps considered unique to this critical developmental milestone. Several recent reports now suggest that an increase in S phase speed is found much more broadly, during the switch from self-renewal to differentiation, particularly in neurogenesis, where it was identified in several lineages in the mammalian cortex and olfactory bulb 46–49. The importance of a short S phase during cell fate transitions is also clear from the finding that the reprogramming of somatic cells into iPS cells is much more efficient in cells whose S phase is fast 50, 51.
There are many unanswered questions regarding the underlying mechanisms and causal relationships between the cycle and erythroid development. The findings we describe in this review illustrate both their importance to our understanding of erythropoietic mechanisms as well as to the broader field of developmental biology.
Acknowledgement
MS would like to thank her students, postdoctoral fellows and trainees whose work is discussed in this article, and to thank Yung Hwang, Aishwarya Swaminathan and Ashley Winward for reading the manuscript. This work is supported by NIH grants R01DK130498, R01DK120639 and R01HL141402.
Footnotes
The authors declare that they have no conflict of interest.
References
- 1.Sender R; Fuchs S; Milo R, Revised Estimates for the Number of Human and Bacteria Cells in the Body. PLoS Biol 2016, 14 (8), e1002533. [DOI] [PMC free article] [PubMed] [Google Scholar]
- 2.Kassebaum NJ; Jasrasaria R; Naghavi M; Wulf SK; Johns N; Lozano R; Regan M; Weatherall D; Chou DP; Eisele TP; Flaxman SR; Pullan RL; Brooker SJ; Murray CJ, A systematic analysis of global anemia burden from 1990 to 2010. Blood 2014, 123 (5), 615–24. [DOI] [PMC free article] [PubMed] [Google Scholar]
- 3.Axelrad AA; McLeod DL; Shreeve MM; Heath DS, Properties of cells that produce erythrocytic colonies in vitro. In Hemopoiesis in culture, Robinson WA, Ed. U.S. Government Printing Office: Washington, 1974. [Google Scholar]
- 4.Heath DS; Axelrad AA; McLeod DL; Shreeve MM, Separation of the erythropoietin-responsive progenitors BFU-E and CFU-E in mouse bone marrow by unit gravity sedimentation. Blood 1976, 47 (5), 777–92. [PubMed] [Google Scholar]
- 5.Iscove NN; Sieber F, Erythroid progenitors in mouse bone marrow detected by macroscopic colony formation in culture. Exp Hematol 1975, 3 (1), 32–43. [PubMed] [Google Scholar]
- 6.Gregory CJ; McCulloch EA; Till JE, Erythropoietic progenitors capable of colony formation in culture: state of differentiation. Journal of cellular physiology 1973, 81 (3), 411–20. [DOI] [PubMed] [Google Scholar]
- 7.Gregory CJ; Tepperman AD; McCulloch EA; Till JE, Erythropoietic progenitors capable of colony formation in culture: response of normal and genetically anemic W-W-V mice to manipulations of the erythron. Journal of cellular physiology 1974, 84 (1), 1–12. [DOI] [PubMed] [Google Scholar]
- 8.Gregory CJ, Erythropoietin sensitivity as a differentiation marker in the hemopoietic system: studies of three erythropoietic colony responses in culture. Journal of cellular physiology 1976, 89 (2), 289–301. [DOI] [PubMed] [Google Scholar]
- 9.Broudy VC; Lin NL; Priestely GV; Nocka K; Wolf NS, Interaction of Stem Cell Factor and its receptor c-kit mediates lodgement and acute expansion of hematopoietic cells in the murine spleen. blood 1996, 88, 75–81. [PubMed] [Google Scholar]
- 10.Perry JM; Harandi OF; Paulson RF, BMP4, SCF, and hypoxia cooperatively regulate the expansion of murine stress erythroid progenitors. Blood 2007, 109 (10), 4494–502. [DOI] [PMC free article] [PubMed] [Google Scholar]
- 11.von Lindern M; Schmidt U; Beug H, Control of erythropoiesis by erythropoietin and stem cell factor: a novel role for Bruton’s tyrosine kinase. Cell Cycle 2004, 3 (7), 876–9. [PubMed] [Google Scholar]
- 12.Socolovsky M; Fallon AEJ; Lodish HF, The prolactin receptor rescues EpoR −/− erythroid progenitors and replaces EpoR in a synergistic interaction with c-kit. Blood 1998, 92 (5), 1491–1496. [PubMed] [Google Scholar]
- 13.Papayannopoulou T; Finch CA, On the in vivo action of erythropoietin: a quantitative analysis. J Clin Invest 1972, 51 (5), 1179–85. [DOI] [PMC free article] [PubMed] [Google Scholar]
- 14.Bauer A; Tronche F; Wessely O; Kellendonk C; Reichardt HM; Steinlein P; Schutz G; Beug H, The glucocorticoid receptor is required for stress erythropoiesis. Genes Dev 1999, 13 (22), 2996–3002. [DOI] [PMC free article] [PubMed] [Google Scholar]
- 15.von Lindern M; Zauner W; Mellitzer G; Steinlein P; Fritsch G; Huber K; Lowenberg B; Beug H, The glucocorticoid receptor cooperates with the erythropoietin receptor and c-Kit to enhance and sustain proliferation of erythroid progenitors in vitro. Blood 1999, 94 (2), 550–9. [PubMed] [Google Scholar]
- 16.Pop R; Shearstone JR; Shen Q; Liu Y; Hallstrom K; Koulnis M; Gribnau J; Socolovsky M, A key commitment step in erythropoiesis is synchronized with the cell cycle clock through mutual inhibition between PU.1 and S-phase progression. PLoS Biol 2010, 8 (9). [DOI] [PMC free article] [PubMed] [Google Scholar]
- 17.Wu H; Liu X; Jaenisch R; Lodish HF, Generation of committed erythroid BFU-E and CFU-E progenitors does not require erythropoietin or the erythropoietin receptor. Cell 1995, 83, 59–67. [DOI] [PubMed] [Google Scholar]
- 18.Oudelaar AM; Beagrie RA; Gosden M; de Ornellas S; Georgiades E; Kerry J; Hidalgo D; Carrelha J; Shivalingam A; El-Sagheer AH; Telenius JM; Brown T; Buckle VJ; Socolovsky M; Higgs DR; Hughes JR, Dynamics of the 4D genome during in vivo lineage specification and differentiation. Nature communications 2020, 11 (1), 2722. [DOI] [PMC free article] [PubMed] [Google Scholar]
- 19.Hwang Y; Futran M; Hidalgo D; Pop R; Iyer DR; Scully R; Rhind N; Socolovsky M, Global increase in replication fork speed during a p57KIP2-regulated erythroid cell fate switch. Science Advances 2017, 3, e1700298. [DOI] [PMC free article] [PubMed] [Google Scholar]
- 20.Shearstone JR; Pop R; Bock C; Boyle P; Meissner A; Socolovsky M, Global DNA demethylation during mouse erythropoiesis in vivo. Science (New York, N.Y.) 2011, 334 (6057), 799–802. [DOI] [PMC free article] [PubMed] [Google Scholar]
- 21.Klein AM; Mazutis L; Akartuna I; Tallapragada N; Veres A; Li V; Peshkin L; Weitz DA; Kirschner MW, Droplet barcoding for single-cell transcriptomics applied to embryonic stem cells. Cell 2015, 161 (5), 1187–201. [DOI] [PMC free article] [PubMed] [Google Scholar]
- 22.Macosko EZ; Basu A; Satija R; Nemesh J; Shekhar K; Goldman M; Tirosh I; Bialas AR; Kamitaki N; Martersteck EM; Trombetta JJ; Weitz DA; Sanes JR; Shalek AK; Regev A; McCarroll SA, Highly Parallel Genome-wide Expression Profiling of Individual Cells Using Nanoliter Droplets. Cell 2015, 161 (5), 1202–14. [DOI] [PMC free article] [PubMed] [Google Scholar]
- 23.Tusi BK; Wolock SL; Weinreb C; Hwang Y; Hidalgo D; Zilionis R; Waisman A; Huh JR; Klein AM; Socolovsky M, Population snapshots predict early haematopoietic and erythroid hierarchies. Nature 2018, 555 (7694), 54–60. [DOI] [PMC free article] [PubMed] [Google Scholar]
- 24.Weinreb C; Wolock S; Klein AM, SPRING: a kinetic interface for visualizing high dimensional single-cell expression data. Bioinformatics 2018, 34 (7), 1246–1248. [DOI] [PMC free article] [PubMed] [Google Scholar]
- 25.Weinreb C; Wolock S; Tusi BK; Socolovsky M; Klein AM, Fundamental limits on dynamic inference from single-cell snapshots. Proceedings of the National Academy of Sciences of the United States of America 2018, 115 (10), E2467–E2476. [DOI] [PMC free article] [PubMed] [Google Scholar]
- 26.Akashi K; Traver D; Miyamoto T; Weissman IL, A clonogenic common myeloid progenitor that gives rise to all myeloid lineages. Nature 2000, 404 (6774), 193–7. [DOI] [PubMed] [Google Scholar]
- 27.Kondo M; Weissman IL; Akashi K, Identification of clonogenic common lymphoid progenitors in mouse bone marrow. Cell 1997, 91 (5), 661–72. [DOI] [PubMed] [Google Scholar]
- 28.Adolfsson J; Mansson R; Buza-Vidas N; Hultquist A; Liuba K; Jensen CT; Bryder D; Yang L; Borge OJ; Thoren LA; Anderson K; Sitnicka E; Sasaki Y; Sigvardsson M; Jacobsen SE, Identification of Flt3+ lympho-myeloid stem cells lacking erythro-megakaryocytic potential a revised road map for adult blood lineage commitment. Cell 2005, 121 (2), 295–306. [DOI] [PubMed] [Google Scholar]
- 29.Dahlin JS; Hamey FK; Pijuan-Sala B; Shepherd M; Lau WWY; Nestorowa S; Weinreb C; Wolock S; Hannah R; Diamanti E; Kent DG; Göttgens B; Wilson NK, A single-cell hematopoietic landscape resolves 8 lineage trajectories and defects in Kit mutant mice. Blood 2018, 131 (21), e1–e11. [DOI] [PMC free article] [PubMed] [Google Scholar]
- 30.Nestorowa S; Hamey FK; Pijuan Sala B; Diamanti E; Shepherd M; Laurenti E; Wilson NK; Kent DG; Gottgens B, A single-cell resolution map of mouse hematopoietic stem and progenitor cell differentiation. Blood 2016, 128 (8), e20–31. [DOI] [PMC free article] [PubMed] [Google Scholar]
- 31.Velten L; Haas SF; Raffel S; Blaszkiewicz S; Islam S; Hennig BP; Hirche C; Lutz C; Buss EC; Nowak D; Boch T; Hofmann WK; Ho AD; Huber W; Trumpp A; Essers MA; Steinmetz LM, Human haematopoietic stem cell lineage commitment is a continuous process. Nat Cell Biol 2017, 19 (4), 271–281. [DOI] [PMC free article] [PubMed] [Google Scholar]
- 32.Hwang Y; Hidalgo D; Socolovsky M, The shifting shape and functional specializations of the cell cycle during lineage development. WIREs Mech Dis 2021, 13 (2), e1504. [DOI] [PMC free article] [PubMed] [Google Scholar]
- 33.Eastman AE; Chen X; Hu X; Hartman AA; Pearlman Morales AM; Yang C; Lu J; Kueh HY; Guo S, Resolving Cell Cycle Speed in One Snapshot with a Live-Cell Fluorescent Reporter. Cell reports 2020, 31 (12), 107804. [DOI] [PMC free article] [PubMed] [Google Scholar]
- 34.Porpiglia E; Hidalgo D; Koulnis M; Tzafriri AR; Socolovsky M, Stat5 signaling specifies basal versus stress erythropoietic responses through distinct binary and graded dynamic modalities. PLoS Biol 2012, 10 (8), e1001383. [DOI] [PMC free article] [PubMed] [Google Scholar]
- 35.Hidalgo D; Bejder J; Pop R; Gellatly K; Hwang Y; S MS; Eastman AE; Chen J-J; Zhu LJ; Heuberger JAAC; Guo S; Koury MJ; Nordsborg NB; Socolovsky M, EpoR stimulates rapid cycling and larger red cells during mouse and human erythropoiesis. Nature communications 2021, 12 (1), 7334. [DOI] [PMC free article] [PubMed] [Google Scholar]
- 36.Nordman J; Orr-Weaver TL, Regulation of DNA replication during development. Development (Cambridge, England) 2012, 139 (3), 455–64. [DOI] [PMC free article] [PubMed] [Google Scholar]
- 37.Gitlin AD; Mayer CT; Oliveira TY; Shulman Z; Jones MJ; Koren A; Nussenzweig MC, HUMORAL IMMUNITY. T cell help controls the speed of the cell cycle in germinal center B cells. Science (New York, N.Y.) 2015, 349 (6248), 643–6. [DOI] [PMC free article] [PubMed] [Google Scholar]
- 38.Ashley RJ; Yan H; Wang N; Hale J; Dulmovits BM; Papoin J; Olive ME; Udeshi ND; Carr SA; Vlachos A; Lipton JM; Da Costa L; Hillyer C; Kinet S; Taylor N; Mohandas N; Narla A; Blanc L, Steroid resistance in Diamond Blackfan anemia associates with p57Kip2 dysregulation in erythroid progenitors. J Clin Invest 2020, 130 (4), 2097–2110. [DOI] [PMC free article] [PubMed] [Google Scholar]
- 39.Hu X; Eastman AE; Guo S, Cell cycle dynamics in the reprogramming of cellular identity. FEBS Letters 2019, 593 (20), 2840–2852. [DOI] [PubMed] [Google Scholar]
- 40.Bartholdy B; Lajugie J; Yan Z; Zhang S; Mukhopadhyay R; Greally JM; Suzuki M; Bouhassira EE, Mechanisms of establishment and functional significance of DNA demethylation during erythroid differentiation. Blood Adv 2018, 2 (15), 1833–1852. [DOI] [PMC free article] [PubMed] [Google Scholar]
- 41.Yu Y; Mo Y; Ebenezer D; Bhattacharyya S; Liu H; Sundaravel S; Giricz O; Wontakal S; Cartier J; Caces B; Artz A; Nischal S; Bhagat T; Bathon K; Maqbool S; Gligich O; Suzuki M; Steidl U; Godley L; Skoultchi A; Greally J; Wickrema A; Verma A, High resolution methylome analysis reveals widespread functional hypomethylation during adult human erythropoiesis. J Biol Chem 2013, 288 (13), 8805–14. [DOI] [PMC free article] [PubMed] [Google Scholar]
- 42.Bock C; Beerman I; Lien WH; Smith ZD; Gu H; Boyle P; Gnirke A; Fuchs E; Rossi DJ; Meissner A, DNA methylation dynamics during in vivo differentiation of blood and skin stem cells. Mol Cell 2012, 47 (4), 633–47. [DOI] [PMC free article] [PubMed] [Google Scholar]
- 43.Spradling A; Orr-Weaver T, Regulation of DNA replication during Drosophila development. Annu Rev Genet 1987, 21, 373–403. [DOI] [PubMed] [Google Scholar]
- 44.Foe VE, Mitotic domains reveal early commitment of cells in Drosophila embryos. Development (Cambridge, England) 1989, 107 (1), 1–22. [PubMed] [Google Scholar]
- 45.Duronio RJ, Developing S-phase control. Genes Dev 2012, 26 (8), 746–50. [DOI] [PMC free article] [PubMed] [Google Scholar]
- 46.Arai Y; Pulvers JN; Haffner C; Schilling B; Nusslein I; Calegari F; Huttner WB, Neural stem and progenitor cells shorten S-phase on commitment to neuron production. Nature communications 2011, 2, 154. [DOI] [PMC free article] [PubMed] [Google Scholar]
- 47.Turrero Garcia M; Chang Y; Arai Y; Huttner WB, S-phase duration is the main target of cell cycle regulation in neural progenitors of developing ferret neocortex. The Journal of comparative neurology 2016, 524 (3), 456–70. [DOI] [PMC free article] [PubMed] [Google Scholar]
- 48.Ponti G; Obernier K; Guinto C; Jose L; Bonfanti L; Alvarez-Buylla A, Cell cycle and lineage progression of neural progenitors in the ventricular-subventricular zones of adult mice. Proceedings of the National Academy of Sciences of the United States of America 2013, 110 (11), E1045–54. [DOI] [PMC free article] [PubMed] [Google Scholar]
- 49.Kornack DR; Rakic P, Changes in cell-cycle kinetics during the development and evolution of primate neocortex. Proceedings of the National Academy of Sciences of the United States of America 1998, 95 (3), 1242–6. [DOI] [PMC free article] [PubMed] [Google Scholar]
- 50.Hanna J; Saha K; Pando B; van Zon J; Lengner CJ; Creyghton MP; van Oudenaarden A; Jaenisch R, Direct cell reprogramming is a stochastic process amenable to acceleration. Nature 2009, 462 (7273), 595–601. [DOI] [PMC free article] [PubMed] [Google Scholar]
- 51.Guo S; Zi X; Schulz VP; Cheng J; Zhong M; Koochaki SH; Megyola CM; Pan X; Heydari K; Weissman SM; Gallagher PG; Krause DS; Fan R; Lu J, Nonstochastic reprogramming from a privileged somatic cell state. Cell 2014, 156 (4), 649–62. [DOI] [PMC free article] [PubMed] [Google Scholar]