Abstract
We measured daily gene expression in heads of control and period mutant Drosophila by using oligonucleotide microarrays. In control flies, 72 genes showed diurnal rhythms in light-dark cycles; 22 of these also oscillated in free-running conditions. The period gene significantly influenced the expression levels of over 600 nonoscillating transcripts. Expression levels of several hundred genes also differed significantly between control flies kept in light-dark versus constant darkness but differed minimally between per01 flies kept in the same two conditions. Thus, the period-dependent circadian clock regulates only a limited set of rhythmically expressed transcripts. Unexpectedly, period regulates basal and light-regulated gene expression to a very broad extent.
Forward genetic screens in Drosophila melanogaster have identified at least eight genes [period (per), timeless (tim), cycle (cyc), clock (Clk), vrille (vri), doubletime, cryptochrome (cry), and shaggy] necessary for the normal functioning of the circadian time-keeping system. Null mutations in most of these genes render flies behaviorally arrhythmic in constant conditions, but they otherwise have minimal morphologic phenotype (1). A model for the mechanism by which specific gene products give rise to a stable clock mechanism has been formulated over the past 10 years (2, 3). These clock genes appear to function in a time-delayed transcription-translation feedback loop. A rhythmically expressed subset of the core clock genes (per, tim, and Clk) and a nonrhythmically expressed core clock gene (cyc) are thought to function as the state variables of the oscillator mechanism (4). This model predicts that these core clock genes also should influence the rhythmic expression of “output” genes important in regulating physiologic and biologic processes controlled by the circadian clock (5).
Previous screens for such clock-controlled output genes have yielded varying estimates of their abundance and character in different organisms. An insertional reporter screen in the photosynthetic prokaryote Synechococcus suggested that most genes in this organism are transcribed in circadian fashion (6). Using microarray analysis, Harmer et al. identified 453 genes undergoing rhythmic expression under constant conditions in the plant Arabidopsis thaliana (7), representing ≈6% of the expressed genome. In Drosophila, analysis of 280 expressed sequence tags from the fly head revealed 20 diurnally varying transcripts, the majority of which were extremely rare, long messages of unclear physiologic function (8). The full extent of circadian gene expression is not known in any organism. The recent availability of an oligonucleotide-based microarray containing probes for nearly all known and predicted Drosophila genes allows estimation of the number of clock-controlled genes in the fly. Here we describe results of measuring circadian gene expression in control and period mutant flies in both light-dark (LD) and free-running conditions. While this article was in preparation, three other studies were published describing circadian gene expression in Drosophila heads (9–11). We discuss and reinterpret some of these results in the context of the present analysis.
Materials and Methods
Details of fly stocks, fly collections, and microarray target preparation are provided in Supporting Materials and Methods, which is published as supporting information on the PNAS web site, www.pnas.org.
Data Analysis.
Average difference calls for each gene were calculated by using Affymetrix MICROARRAY ANALYSIS SUITE software. The data on each chip were normalized to the mean expression of that chip. To classify a gene as having circadian expression across two cycles of data, three criteria were applied. First, the gene had to be called present by the analysis software in at least half the time points of each data set. Second, expression was required to be highly reproducible between the data sets as assessed by correlation coefficient (12). Finally, if highly reproducible, the gene needed to show a circadian (as opposed to ultradian) expression pattern by autocorrelation analysis. Further details of the analysis methods are provided in Supporting Materials and Methods.
Results
Analysis of Rhythmic Gene Expression in Control and Period Mutant Fly Heads.
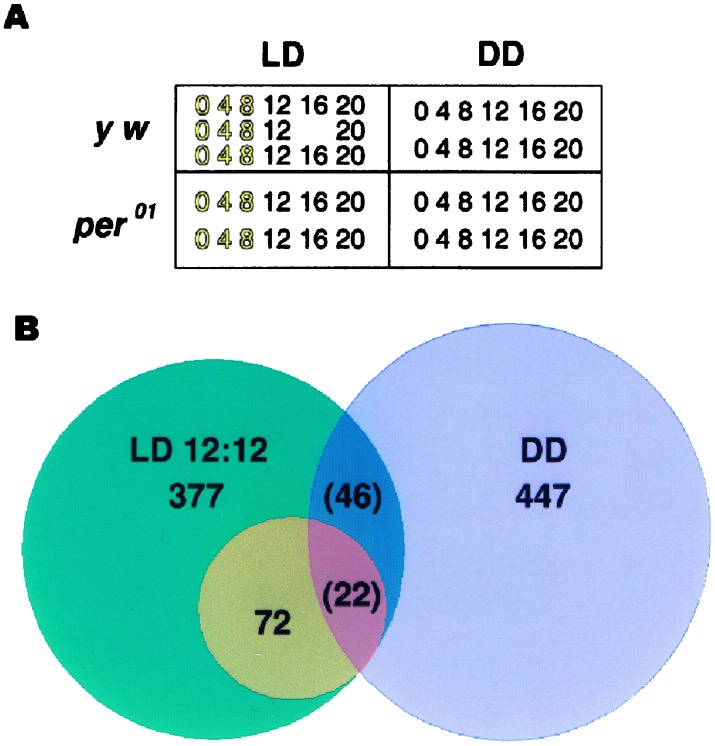
We studied gene expression in control and period null mutant (per01) flies in four conditions: (i) control flies kept in LD 12:12 (ii), control flies kept in dark-dark (DD), (iii) per01 flies kept in LD 12:12, and (iv) per01 flies kept in DD (Fig. 1A). We initially compared two replicate time series for each condition. Control flies had 377 rhythmically expressed genes in LD and 447 rhythmically expressed genes in DD. To estimate the incidence of false-positive results, we performed data-randomization analysis (Fig. 6, which is published as supporting information on the PNAS web site). Approximately 176 genes in LD and 298 genes in DD are expected to show rhythmic expression by chance. Thus in control flies in LD conditions, about half (≈176/377) of the observed, oscillating genes are scored rhythmic by chance. In the absence of additional data, there are no means to discriminate between true and false-positive results. We therefore increased the stringency of our analysis by adding a third 24-h data set for LD 12:12 control flies. We performed three two-set comparisons and found 72 genes that were rhythmic in all comparisons (Fig. 1B). Analysis of the randomized data sets demonstrated that, by chance, only one false-positive gene is expected among these 72. The number 72 also provides a lower limit to the number of detectable, oscillating genes in the fly head. Because our initial estimate from two data sets suggested there were ≈200 true positive, oscillating genes (i.e., the 377 identified genes less the 180 genes that were expected to oscillate by chance), we estimate that the number of true oscillating genes in control LD 12:12 fly heads is between 72 and ≈200.
Figure 1.
(A) Overall experimental design. Numbers in boxes refer to hours of collection for control (y w) and per01 flies; gold numbers indicate times of lights on. (B) Venn-diagram summary of results from control flies. Based on two cycles, 377 circadianly expressed genes were identified in LD, and 447 were identified in DD. Based on three cycles in LD, a subset of 72 genes were identified as diurnally expressed. Twenty-two of these genes were found also to be rhythmic in DD flies.
We also examined two replicate data sets from per01 flies (13) in LD and DD conditions. We found 287 cycling transcripts in per01 LD 12:12. By data randomization described above, we estimate that 182 of these genes show oscillation in this paradigm by chance. The probability of all 287 identified genes occurring by chance was less than 1 × 10⁻⁴. In per01 flies kept in DD conditions, we found 336 cycling transcripts; the probability of all 336 identified genes occurring by chance was greater than 1 × 10⁻².
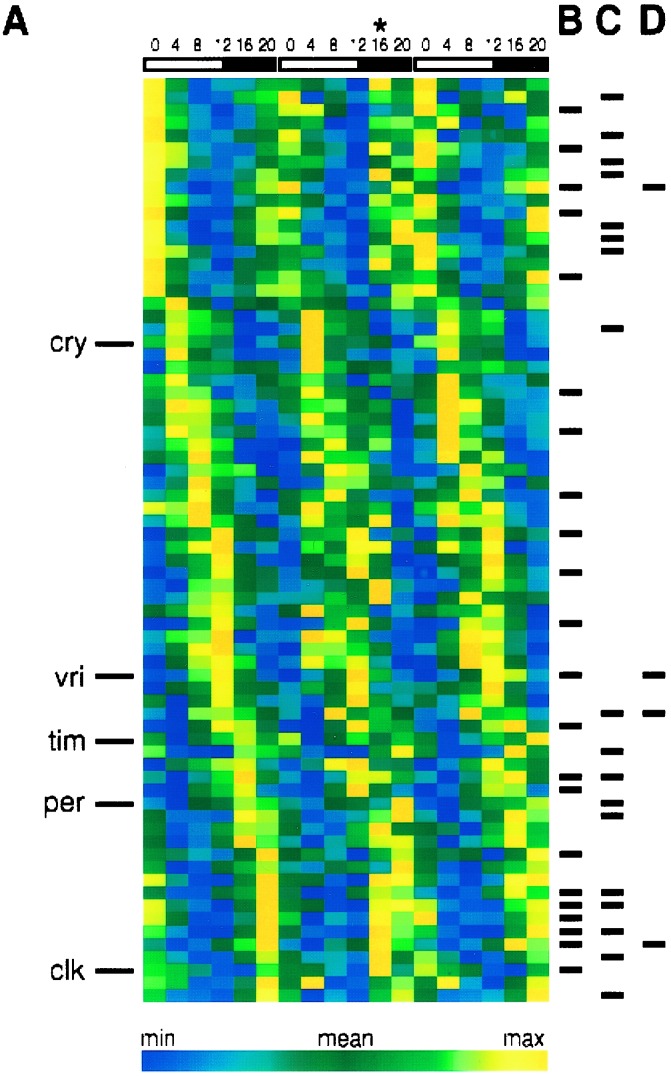
We analyzed the 72 genes showing rhythmic expression in the three LD 12:12 data sets in greater detail (Fig. 2). These genes can be categorized further by their persistent oscillations in constant darkness (22 of the 72 are “clock-driven” genes) or their persistent oscillations in the absence of the period gene in the presence of an LD cycle (18 of the 72 are “masked” genes; ref. 14). Four of the 22 clock-driven genes were also expressed rhythmically in per01 flies kept in LD 12:12 (i.e., these were both clock-driven and masked). A distinct set of 4 of the 22 clock-driven genes also were expressed rhythmically in per01 flies kept in DD. These potentially are clock-independent oscillations and included the circadian gene vrille and a cytochrome P450 enzyme Cyp4d21. Significantly, no gene was found to be expressed rhythmically in all four conditions tested (control LD and DD and per01 LD and DD). The remaining 32 of 72 oscillating genes required both the period gene and an LD cycle for their oscillations (i.e., “period-dependent masking”).
Figure 2.
(A) Phase-ordered expression patterns of the 72 genes identified as diurnally expressed in control flies. The positions of five known rhythmic genes of the circadian system are denoted on the Left. Tick marks show the positions of those diurnally expressed genes also found to be rhythmic in control flies kept in DD (B), per01 flies kept in LD 12:12 (C), and per01 flies kept in DD (D).
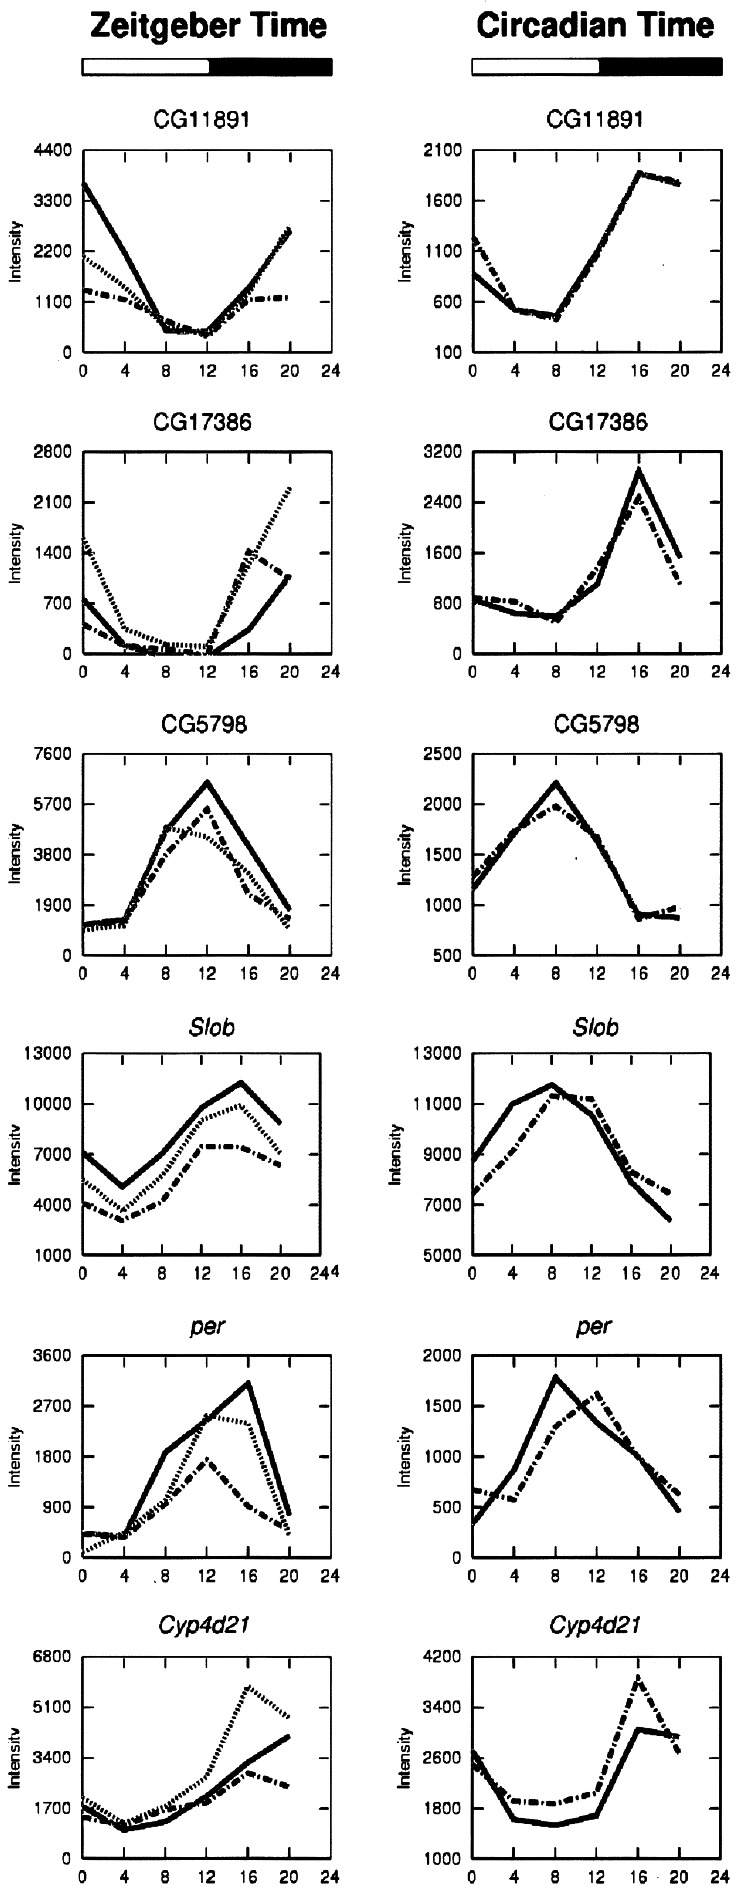
Expression waveforms in LD and DD of a representative subset of the 22 circadianly expressed genes are shown in Fig. 3. The range of phases seen in this set of circadian genes includes peaks at all times of day. Interestingly, 15 of the 22 circadian genes peaked ≈4 h earlier in DD versus LD conditions. The identities, average expression levels, LD and DD peak phases, and proposed functions of the 22 clock-driven genes are shown in Table 1, and the list of the 72 diurnally rhythmic genes is shown in Table 2, which is published as supporting information on the PNAS web site. The average expression levels of the 22 clock-driven genes, considering both LD and DD conditions, varied over nearly a 100-fold range (Affymetrix average difference values from 383 to 25,198). Among these 22 genes, four are known components of the circadian clock (per, tim, vri, and Clk). Three previously described rhythmically expressed genes, Dreg-2 (8), cry (15), and takeout (16) were found in the set of 72 diurnally rhythmic genes.
Figure 3.
Representative circadian expression patterns found in control flies under three cycles in LD (Right) and two cycles in DD (Left).
Table 1.
Identities of the 22 genes displaying strong circadian oscillations in control flies in both LD 12:12 and DD
| Gene | A0 | Phase LD (ZT) | Phase DD (CT) | Expression mean (min:max) | Function |
|---|---|---|---|---|---|
| tim | 0.96 | 12 | 8 | 3,374.9 (876.6:8,390.2) | Circadian rhythm |
| per | 0.94 | 16 | 8 | 957.7 (97.9:2,531.9) | Circadian rhythm |
| vri | 0.84 | 12 | 8 | 3,350.5 (1,564.5:7,146.2) | Circadian rhythm; RNA polymerase II transcription factor |
| Clk | 0.92 | 20 | 20 | 477.2 (44.2:1,098.7) | Circadian rhythm |
| Dreg-2 | 0.86 | 4 | 4 | 1,573.4 (1,112.0:2,107.6) | Haloacid dehalogenase/epoxide hydrolase family |
| puc | 0.94 | 12 | 4 | 1,845.6 (1,157.9:2,814.9) | JUN kinase phosphatase |
| Ugt35b | 0.9 | 0 | 0 | 5,342.6 (2,615.3:8,887.5) | UDP-glucuronosyltransferase |
| Cyp4d21 | 0.91 | 20 | 16 | 2,081.3 (969.8:4,728.8) | Cytochrome P450 |
| Amp | 0.77 | 20 | 0 | 3,323.5 (2,134.5:5,517.0) | Synaptic vesicle endocytosis |
| Pdh | 0.98 | 0 | 20 | 18,375.0 (5,817.3:32,515.9) | Oxidoreductase, acting on the CH-OH group of donors, NAD or NADP as acceptor |
| Slob | 0.99 | 16 | 8 | 6,260.6 (3,054.3:9,768.0) | Potassium channel-binding protein; signal transduction |
| CG5798 | 0.94 | 12 | 8 | 2,732.0 (958.2:6,526.6) | Ubiquitin-specific protease |
| CG7149 | 0.9 | 20 | 16 | 1,949.5 (1,221.4:3,395.0) | Diacylglycerol cholinephosphotransferase |
| CG10091 | 0.88 | 8 | 4 | 1,895.7 (930.5:3,467.3) | Glutathione transferase |
| CG10237 | 0.8 | 20 | 16 | 6,465.7 (3,994.5:12,993.8) | α-Tocopherol transfer protein-like; retinaldehyde binding |
| CG11407 | 0.91 | 20 | 20 | 3,058.6 (1,661.2:6,640.5) | Long-chain fatty acid transporter |
| CG11796 | 0.83 | 4 | 4 | 8,371.2 (4,750.0:11,891.0) | 4-Hydroxyphenylpyruvate dioxygenase |
| CG17386 | 0.98 | 20 | 16 | 533.3 (−47.1:2,319.8) | RNA binding |
| CG9497 | 0.9 | 0 | 16 | 2,642.4 (949.3:5,657.0) | Unknown |
| CG4962 | 0.89 | 12 | 16 | 2,355.6 (431.1:4,998.2) | Unknown |
| CG10553 | 0.85 | 0 | 16 | 1,725.0 (824.9:3,937.9) | Unknown |
| CG11891 | 0.86 | 0 | 16 | 1,425.9 (351.1:3,682.3) | Unknown |
“Phase LD” and “Phase DD” refer to collection times of peak expression. ZT, Zeitgeber time; CT, circadian time. “Expression” lists mean, peak, and trough expression levels across the three LD cycles in microarray fluorescence units. Functional annotations based on Affymetrix annotations and the Gene Ontology database (36).
Analysis of Basal Gene Expression Differences Between Control and Period Mutant Flies.
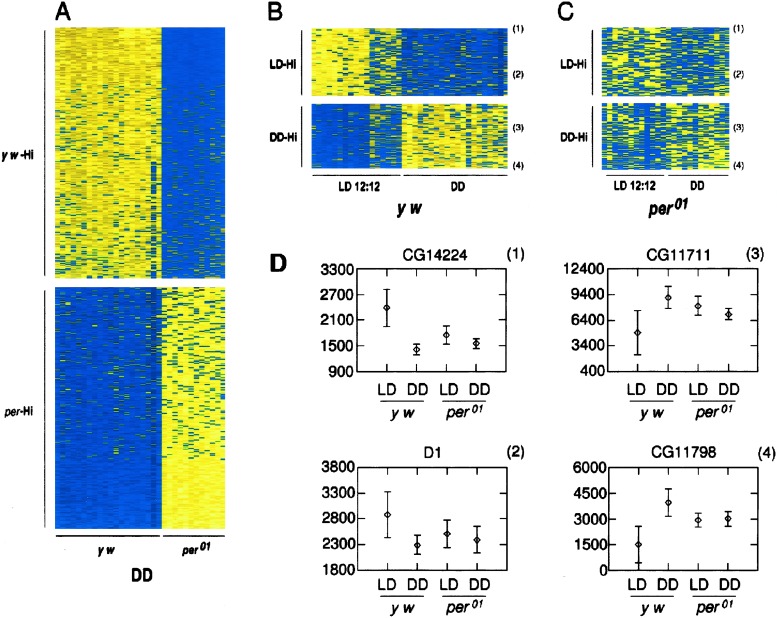
We next determined whether the per-dependent circadian clock or environmental LD conditions affected expression of nonrhythmically expressed genes (Table 3, which is published as supporting information on the PNAS web site). Initially, we compared basal gene expression levels from 20 control and 12 per01 points from flies kept in DD conditions. We identified 650 genes that showed significant differences between genotypes (P < 0.0001, Mann–Whitney U test). Randomization of the data sets indicated an expected mean false-positive incidence of <1. A heat-plot rank profile of these genes is shown in Fig. 4A.
Figure 4.
Basal gene expression is modulated by period and light. “Heat-plot” rank profiles of expression levels of genes exhibiting significant change in basal expression differences between experimental conditions (P < 0.0001, Mann–Whitney U test) are shown. From left to right, entire cycles (6 or 8 time points, in LD or DD) are grouped. (A) Expression levels of 650 genes from DD conditions on each of a total of 32 microarrays (y w, 20; per01, 12). (Upper) Those 330 genes with expression levels significantly higher in control flies (y w-Hi). (Lower) Those 320 genes with expression levels significantly higher in per01(per-Hi). Pseudocolor indicates relative rank order in expression (yellow, highest; blue, lowest). (B) Comparison of control flies kept in LD versus DD. Those 178 genes that exhibit significant differences in expression between LD (17 measurements) and DD (20 measurements) are shown. LD-Hi, higher average expression in LD; DD-Hi, higher average expression in DD. (C) Comparison of per01 flies between LD versus DD (12 measurements each). Other markings are as described for B. (B and C) Data for the same 178 genes, displayed in register. (D) Representative expression levels of individual genes from B and C, as denoted by numbers in parenthesis. Microarray intensity values of control LD (17 points), control DD (20 points), per01flies in LD (12 points), and per01 flies in DD (12 points) conditions are shown as means (+SE).
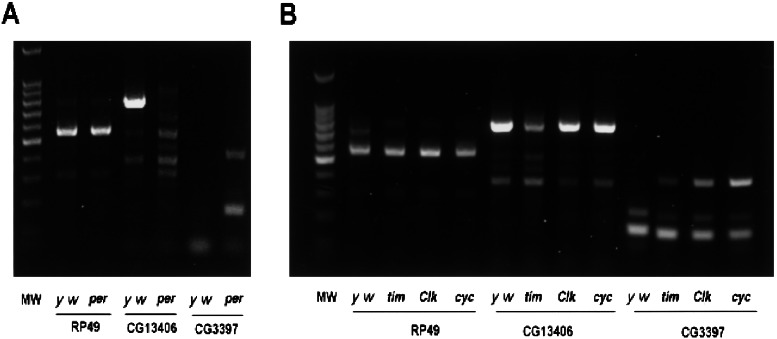
To validate these findings, we analyzed CG3397, which is detected in per01 but not in control flies, and CG13406, which is detected in control but not in per01. By reverse transcription–PCR analysis, each gene was detected only in the genotype predicted by the microarray experiments (Fig. 5A). We next used reverse transcription–PCR to measure the expression levels of these two genes in three other clock gene mutants (Clk, tim, and cyc). CG3397 was expressed strongly in all three mutant flies, suggesting that this gene is activated by any loss of the circadian time-keeping mechanism. In contrast, CG13406 was expressed minimally in tim mutant fly heads but expressed at higher levels in Clk and cyc (Fig. 5B). This gene seems to require both per and tim function for expression but is expressed normally in flies lacking a circadian clock because of Clk or cyc mutation.
Figure 5.
Confirming the influence of period on basal gene expression. (A) Reverse transcription–PCR was performed on total RNA extracted from control and per01 flies pooled from multiple time points in DD. RP49, control; MW, molecular weight markers. (B) Reverse transcription–PCR performed on total RNA from pooled time points of other clock mutant flies (tim, Clk, and cyc) kept in DD conditions.
Finally, we performed an analysis for genes with basal expression levels that were influenced by LD conditions. A total of 178 genes had significant differences in basal expression levels between control flies kept in LD versus DD conditions (P < 0.0001, Mann–Whitney U test). A rank profile of these genes is shown in Fig. 4B. To determine whether per is necessary for this photic regulation, we examined the differences in basal expression levels between per01 flies kept in LD 12:12 and DD conditions. The basal expression levels of only 15 genes were regulated by LD in the per01 flies. It thus seems that basal, aperiodic levels of expression of many genes in the fly are influenced by period either directly or by per-dependent modulation of photic masking effects.
Discussion
The rhythmic genes we have identified under LD and DD conditions display bone fide rhythmic expression. The inclusion of seven known rhythmic genes (per, tim, vri, Clk, Dreg-2, cry, and takeout) in the set of 72 diurnally oscillating genes and four (per, tim, vri, and Clk) in the set of 22 circadianly oscillating genes provides confidence that the autocorrelation method we applied identifies rhythmic gene expression with fidelity.
The true number of circadianly regulated genes in Drosophila can only be estimated; the accuracy of any estimate depends on both methodological constraints and assumptions used in the data analysis. Our estimates of 72–200 robustly oscillating genes in LD 12:12 and a minimum of 22 genes in DD likely underestimate the true number of oscillating genes in the fly head. First, by necessity the choices of A0 minima were determined empirically. In the absence of true positive controls (i.e., rhythmically spiked foreign, polyadenylated message), we relied on the reproducible waveforms of known cycling genes and visual inspection of the records to establish useful minima. Second, current microarray technology does not detect very rare mRNAs. Of the 20 diurnally varying genes identified in the expressed sequence tag screen of Van Gelder et al. (8), at least four were expressed at levels that are undetectable on the present microarray. Similarly, we have used the oligonucleotide microarray to determine average expression levels in whole heads. Genes displaying rhythmic oscillation in only a small subset of head tissues, but statically expressed elsewhere, might escape detection. Third, although the current generation of oligonucleotide gene arrays includes probes for most known and predicted genes, the arrays remain incomplete. For example, several known rhythmic gene sequences including clock regulated gene-1 (17) and several of the Dregs (8) are not represented on the current microarray. Finally, some rhythmically expressed genes such as Dreg-5 (18) show oscillating expression levels only in certain caging and feeding conditions. Analysis of flies kept in other conditions may yield a different estimate for the number of rhythmically expressed genes.
Even considering these caveats, it seems that circadian control of gene expression in Drosophila heads is a limited phenomenon. Our set of 22 circadianly expressed genes includes four of the known clock component genes, per, tim, vri, and Clk. These genes have among the highest amplitude oscillations in the fly head (Table 2), and very few other genes have similarly robust oscillations. This finding suggests that circadian control of gene expression in the fly head does not represent an extension of the autoregulatory feedback loop controlling expression of the core clock genes, as has been proposed (1–4). How the circadian clock controls output behaviors is not known. A neuropeptide, pigment-dispersing factor (pdf), is necessary for coupling the central clock mechanism to behavioral rhythmicity and is hypothesized to represent the transmitter output of the primary pacemaker neurons (19, 20). The pdf gene, however, is not expressed rhythmically (21). We speculate that rhythmic gene expression in the fly head is used primarily as part of the time-keeping mechanism, and that circadian output relies primarily on posttranscriptional or other physiologic mechanisms (22). Indeed, the necessity of the transcription-translation feedback loop in Drosophila for generation of circadian rhythms has been questioned recently (23).
During submission of these data, three parallel studies of circadian gene expression in Drosophila heads were published (9–11). The present study and that of ref. 11 analyzed data representing LD and DD conditions separately. The other two studies combined LD and DD data to analyze circadian gene expression. Each study used unique criteria for identification of rhythmic gene expression. Table 4, which is published as supporting information on the PNAS web site, presents the union of all four lists describing “circadianly rhythmic genes”: 134 genes (9); 158 genes (10); 115 genes (11); 22 genes (this study). The concordance among the three longer lists is very low: 19 genes (24). However, of the 22 circadian genes identified in this study, 18 are scored circadian on at least one of the other three lists. Thus, despite methodological differences, our analysis identified genes with independently reproducible rhythmic expressions.
Of the 340 unique genes scored rhythmic by at least one of the four groups, 84% were listed by only one group. We infer that large subsets of the three other lists represent false-positive results. Most of the genes that were present on any of the other lists but were not scored rhythmic in the present analysis produced weak rhythmicity in our data set; they mostly displayed a random distribution of correlation values (Table 4). Eleven genes were scored rhythmic by all other groups but not by us. Among these genes, five were weakly rhythmic in our data set or were eliminated because of less than 50% “present” calls. In sum, we find that the published data do not yet provide a consistent description of circadian gene expression in Drosophila heads. We propose that the present analysis provides a useful and minimal set of bona fide circadian genes in Drosophila with which to initiate future studies. We offer access to all the raw data used for the analysis of rhythmic gene expression (http://circadian.wustl.edu).
We unexpectedly found that many genes had significantly different levels of basal expression between per and control flies kept in DD. The flies used in those experiments were derived from a y w genetic background, and thus this feature is unlikely to represent a nonspecific strain difference. In previous microarray studies (9–11), similar large effects on basal gene expression were noted in the cases of flies mutant for tim, per, and Clk. The mechanism for this broad regulation of gene expression is unknown, but several hypotheses may be considered. First, the per-dependent circadian clock could control the rhythmic transcription of these genes, but mRNA half-lives could be greater than 24 h, thereby damping circadian rhythmicity. Drosophila mRNAs vary considerably in half-life, with some messages having half-lives over 90 h (25). Second, changes in basal, aperiodic levels of gene expression may represent a widespread compensation to the absence of a circadian clock or the absence of the period gene in particular. Several studies have suggested pleiotropic phenotypes in per mutants that are not attributable directly to the circadian clock (26–30). Finally, these broad-scale effects could result from per01-induced dysregulation of one or more widely acting regulators of gene expression such as poly(A)-binding protein (31). Loss of the per-dependent regulation of this gene leads to a change in its static levels, which then could lead to significant changes in message half-life for a large number of nonoscillating transcripts.
The lighting condition of the flies also altered basal gene expression. Light affects fly behavior through two routes: the circadian clock and direct masking effects. The circadian clock is entrained to external LD cycles, and light can transiently affect gene expression through the clock (32, 33). Even in the absence of a functioning clock, however, flies still show rhythmic behavior when kept in an LD cycle (34). We found that 18 genes of the 72 showing robust oscillations in control flies in LD 12:12 also showed oscillations in a per01 flies in LD 12:12, presumably through direct light-masking effects. Interestingly, 32 genes required both per function and an LD cycle for rhythmicity. We propose the term period-dependent masking to describe this class of genes. Remarkably, nearly 200 genes showed substantial differences in basal expression depending on whether the flies were housed in DD or LD conditions. These effects could be caused either by light acting through the per-dependent clock or its direct masking effect on basal gene expression. Because per01 flies had very few genes showing basal expression differences between LD- and DD-housed conditions, we propose that light's effects on basal expression is mediated primarily through a circadian clock-dependent mechanism. Indeed, these broad-scale changes in light-dependent static gene expression may reflect the mechanism and output of the photoperiodic response. The seasonal photoperiodic response is determined by a comparison between day length and internal circadian clock time. Drosophila exhibits photoperiodic control of ovarian diapause (35). Our data indicate that day length and clock function may be integrated to determine the basal expression levels of numerous genes.
Supplementary Material
Acknowledgments
We thank the Berkeley Drosophila Genome Project for providing the genomic sequences used in this analysis. We also thank Erik Herzog and Louis Muglia for their constructive criticism of the manuscript. Y.L. and G.D.S. are supported by National Institutes of Health (NIH) Grant GM28755. R.N.V.G. is supported by a Research to Prevent Blindness Career Development Award, the Becker/AUPO/RPB Clinician-Scientist Award, and NIH Grant EYK08-00403. P.H.T. is supported by NIH Grant NS-21749 and a grant from the Human Frontier Science Program Organization. The raw data from all oligonucleotide microarrays used in this study may be obtained from http://circadian.wustl.edu.
Abbreviations
- LD
light-dark
- DD
dark-dark
References
- 1.Young M W, Kay S A. Nat Rev Genet. 2001;2:702–715. doi: 10.1038/35088576. [DOI] [PubMed] [Google Scholar]
- 2.Allada R, Emery P, Takahashi J S, Rosbash M. Annu Rev Neurosci. 2001;24:1091–1119. doi: 10.1146/annurev.neuro.24.1.1091. [DOI] [PubMed] [Google Scholar]
- 3.Harmer S L, Panda S, Kay S A. Annu Rev Cell Dev Biol. 2001;17:215–253. doi: 10.1146/annurev.cellbio.17.1.215. [DOI] [PubMed] [Google Scholar]
- 4.Smolen P, Baxter D A, Byrne J H. J Neurosci. 2001;21:6644–6656. doi: 10.1523/JNEUROSCI.21-17-06644.2001. [DOI] [PMC free article] [PubMed] [Google Scholar]
- 5.Dunlap J C. Cell. 1999;96:271–290. doi: 10.1016/s0092-8674(00)80566-8. [DOI] [PubMed] [Google Scholar]
- 6.Liu Y, Tsinoremas N F, Johnson C H, Lebedeva N V, Golden S S, Ishiura M, Kondo T. Genes Dev. 1995;9:1469–1478. doi: 10.1101/gad.9.12.1469. [DOI] [PubMed] [Google Scholar]
- 7.Harmer S L, Hogenesch J B, Straume M, Chang H S, Han B, Zhu T, Wang X, Kreps J A, Kay S A. Science. 2000;290:2110–2113. doi: 10.1126/science.290.5499.2110. [DOI] [PubMed] [Google Scholar]
- 8.Van Gelder R N, Bae H, Palazzolo M J, Krasnow M A. Curr Biol. 1995;5:1424–1436. doi: 10.1016/s0960-9822(95)00280-6. [DOI] [PubMed] [Google Scholar]
- 9.Claridge-Chang A, Wijnen H, Naef F, Boothroyd C, Rajewsky N, Young M W. Neuron. 2001;32:657–671. doi: 10.1016/s0896-6273(01)00515-3. [DOI] [PubMed] [Google Scholar]
- 10.McDonald M J, Rosbash M. Cell. 2001;107:567–578. doi: 10.1016/s0092-8674(01)00545-1. [DOI] [PubMed] [Google Scholar]
- 11.Ueda H R, Matsumoto A, Kawamura M, Iino M, Tanimura T, Hashimoto S. J Biol Chem. 2002;277:14048–14052. doi: 10.1074/jbc.C100765200. [DOI] [PubMed] [Google Scholar]
- 12.Levine J D, Funes P, Dowse H B, Hall J C. BMC Neurosci. 2002;3:1. doi: 10.1186/1471-2202-3-1. [DOI] [PMC free article] [PubMed] [Google Scholar]
- 13.Hamblen M, Zehring W A, Kyriacou C P, Reddy P, Yu Q, Wheeler D A, Zwiebel L J, Konopka R J, Rosbash M, Hall J C. J Neurogenet. 1986;3:249–291. doi: 10.3109/01677068609106855. [DOI] [PubMed] [Google Scholar]
- 14.Mrosovsky N. Chronobiol Int. 1999;16:415–429. doi: 10.3109/07420529908998717. [DOI] [PubMed] [Google Scholar]
- 15.Emery P, So W V, Kaneko M, Hall J C, Rosbash M. Cell. 1998;95:669–679. doi: 10.1016/s0092-8674(00)81637-2. [DOI] [PubMed] [Google Scholar]
- 16.So W V, Sarov-Blat L, Kotarski C K, McDonald M J, Allada R, Rosbash M. Mol Cell Biol. 2000;20:6935–6944. doi: 10.1128/mcb.20.18.6935-6944.2000. [DOI] [PMC free article] [PubMed] [Google Scholar]
- 17.Rouyer F, Rachidi M, Pikielny C, Rosbash M. EMBO J. 1997;16:3944–3954. doi: 10.1093/emboj/16.13.3944. [DOI] [PMC free article] [PubMed] [Google Scholar]
- 18.Van Gelder R N, Krasnow M A. EMBO J. 1996;15:1625–1631. [PMC free article] [PubMed] [Google Scholar]
- 19.Renn S C, Park J H, Rosbash M, Hall J C, Taghert P H. Cell. 1999;99:791–802. doi: 10.1016/s0092-8674(00)81676-1. [DOI] [PubMed] [Google Scholar]
- 20.Taghert P H, Hewes R S, Park J H, O'Brien M A, Han M, Peck M E. J Neurosci. 2001;21:6673–6686. doi: 10.1523/JNEUROSCI.21-17-06673.2001. [DOI] [PMC free article] [PubMed] [Google Scholar]
- 21.Park J H, Hall J C. J Biol Rhythms. 1998;13:219–228. doi: 10.1177/074873098129000066. [DOI] [PubMed] [Google Scholar]
- 22.Edery I. Chronobiol Int. 1999;16:377–414. doi: 10.3109/07420529908998716. [DOI] [PubMed] [Google Scholar]
- 23.Yang Z, Sehgal A. Neuron. 2001;29:453–467. doi: 10.1016/s0896-6273(01)00218-5. [DOI] [PubMed] [Google Scholar]
- 24.Jackson F R, Schroeder A J. Dev Cell. 2001;1:733–742. doi: 10.1016/s1534-5807(01)00100-9. [DOI] [PubMed] [Google Scholar]
- 25.Winkles J A, Grainger R M. J Cell Biol. 1985;101:1808–1816. doi: 10.1083/jcb.101.5.1808. [DOI] [PMC free article] [PubMed] [Google Scholar]
- 26.Andretic R, Chaney S, Hirsh J. Science. 1999;285:1066–1068. doi: 10.1126/science.285.5430.1066. [DOI] [PubMed] [Google Scholar]
- 27.Klarsfeld A, Rouyer F. J Biol Rhythms. 1998;13:471–478. doi: 10.1177/074873098129000309. [DOI] [PubMed] [Google Scholar]
- 28.Sarov-Blat L, So W V, Liu L, Rosbash M. Cell. 2000;101:647–656. doi: 10.1016/s0092-8674(00)80876-4. [DOI] [PubMed] [Google Scholar]
- 29.Kyriacou C P, Hall J C. Proc Natl Acad Sci USA. 1980;77:6729–6733. doi: 10.1073/pnas.77.11.6729. [DOI] [PMC free article] [PubMed] [Google Scholar]
- 30.Alt S, Ringo J, Talyn B, Bray W, Dowse H. Anim Behav. 1998;56:87–97. doi: 10.1006/anbe.1998.0743. [DOI] [PubMed] [Google Scholar]
- 31.Macdonald P. Curr Opin Cell Biol. 2001;13:326–331. doi: 10.1016/s0955-0674(00)00215-5. [DOI] [PubMed] [Google Scholar]
- 32.Albrecht U, Sun Z S, Eichele G, Lee C C. Cell. 1997;91:1055–1064. doi: 10.1016/s0092-8674(00)80495-x. [DOI] [PubMed] [Google Scholar]
- 33.Shigeyoshi Y, Taguchi K, Yamamoto S, Takekida S, Yan L, Tei H, Moriya T, Shibata S, Loros J J, Dunlap J C, Okamura H. Cell. 1997;91:1043–1053. doi: 10.1016/s0092-8674(00)80494-8. [DOI] [PubMed] [Google Scholar]
- 34.Wheeler D A, Hamblen-Coyle M J, Dushay M S, Hall J C. J Biol Rhythms. 1993;8:67–94. doi: 10.1177/074873049300800106. [DOI] [PubMed] [Google Scholar]
- 35.Saunders D S. Invert Neurosci. 1997;3:155–164. doi: 10.1007/BF02480370. [DOI] [PubMed] [Google Scholar]
- 36.Ashburner M, Ball C A, Blake J A, Botstein D, Butler H, Cherry J M, Davis A P, Dolinski K, Dwight S S, Eppig J T, et al. Nat Genet. 2000;25:25–29. doi: 10.1038/75556. [DOI] [PMC free article] [PubMed] [Google Scholar]
Associated Data
This section collects any data citations, data availability statements, or supplementary materials included in this article.


