Abstract
RNA is becoming an important therapeutic target. Many potential RNA targets require secondary or tertiary structure for function. Examples include ribosomal RNAs, RNase P RNAs, mRNAs with untranslated regions that regulate translation, and group I and group II introns. Here, a method is described to inhibit RNA function by exploiting the propensity of RNA to adopt multiple folded states that are of similar free energy. This method, called oligonucleotide directed misfolding of RNA (ODMiR), uses short oligonucleotides to stabilize inactive structures. The ODMiR method is demonstrated with the group I intron from Candida albicans, a human pathogen. The oligonucleotides, L(TACCTTTC) and TLCTLACLGALCGLGCLC, with L denoting a locked nucleic acid residue, inhibit 50% of group I intron splicing in a transcription mixture at about 150 and 30 nM oligonucleotide concentration, respectively. Both oligonucleotides induce misfolds as determined by native gel electrophoresis and diethyl pyrocarbonate modification. The ODMiR approach provides a potential therapeutic strategy applicable to RNAs with secondary or tertiary structures required for function.
RNA is emerging as an important target for therapeutics (1, 2). For example, antisense oligonucleotides, including Vitravene (3) and Gentasense (4, 5), are proving effective (6, 7). Oligonucleotides are a promising class of therapeutics because they can be designed from simple base pairing rules and they have pharmacokinetic properties that are relatively independent of sequence (8). Furthermore, many analogs are synthetically accessible (9). Currently, oligonucleotides in the clinic rely on formation of about 20 base pairs between oligonucleotide and target RNA. Recent insights into RNA folding, however, suggest that RNA can be targeted specifically with shorter oligonucleotides (10–12). Here, we describe a method that exploits the folding properties of RNA to design or screen short oligonucleotides to inhibit RNA function.
Many RNAs require proper tertiary folds to function. Examples include rRNAs (13–15), mRNAs with 5′ untranslated regions that regulate translation (16–18), RNase P (19–21), and group I (22, 23) and group II introns (24–26). These RNAs can have both active and inactive folds that are similar in free energy, and the inactive folds can be trapped kinetically (27–31). Kinetic traps that cause inactivation of catalytic RNAs have been observed in studies of the Tetrahymena thermophila group I intron (27, 29, 32, 33), the hammerhead ribozyme (34), and the hepatitis δ virus ribozyme (31, 35). These traps are often the result of secondary structure rearrangement. Secondary structure prediction (36) can give insights into possible inactive folds that can lead to kinetic traps (29, 31, 37). Although kinetic traps may be disadvantageous for folding studies, these inactive folds can be exploited to design or screen potential therapeutics to inhibit RNA function. Here, we demonstrate a method for targeting functional RNAs at the earliest time—during transcription—by using small oligonucleotides to direct the folding of the Candida albicans group I intron into a nonfunctional fold. This Oligonucleotide Directed Misfolding of RNA (ODMiR) method should be applicable to many RNAs.
Group I self-splicing introns (22, 23) are present in a number of pathogenic organisms, including Candida albicans (38), Pneumocystis carinii (39), and Aspergillus nidulans (40), but have not been found in the human genome. The group I intron from C. albicans is located in the large subunit rRNA precursor, and has been characterized (12, 41). Self-splicing of group I introns from rRNA genes is essential for maturation of ribosomes (42). Thus, inhibition of self-splicing provides a possible therapeutic approach (11, 12, 43, 44). Moreover, self-splicing is easily assayed and thus provides a convenient model system for testing methods for targeting RNA.
Materials and Methods
Buffers.
Transcription buffer contains 40 mM Tris⋅HCl (pH 7.5), 62.5 ng/μl BSA, 5 mM spermidine, 5 mM DTT, 14 mM MgCl2, 1 mM each nucleotide triphosphate, 3 ng linearized C-h plasmid (12) that contains precursor sequence, [α-32P]ATP (30 Ci/mmol; 1 Ci =37 GBq), and 50 units T7 RNA polymerase (New England BioLabs). H0Mg buffer contains 50 mM Hepes (pH 7.5) (25 mM Na+), and 135 mM KCl. H10Mg is H0Mg with 10 mM MgCl2.
Oligonucleotides.
Oligonucleotides were synthesized, deblocked, and purified by standard methods (45–48). Concentrations were determined from predicted extinction coefficients and measured absorbances at 260 or 280 nm at 25°C (49). All oligonucleotides were characterized by MS with a Hewlett Packard 1100 LC/MS Chemstation. Locked nucleic acids (LNAs) were purchased from Proligo LLC and purified by reverse phase chromatography. Masses were confirmed by matrix-assisted laser desorption ionization MS. For LNA/DNA chimeras, LNA residues are denoted with L (e.g., LA), whereas DNA residues are represented only by their bases (e.g., A). Propynylated bases are denoted by a superscript P (e.g., PU). A 2′-O-methyl residue is denoted by m.
Optical Melting Experiments.
Optical melting experiments were completed in 20 mM sodium cacodylate/0.1 mM NaCl/0.5 mM EDTA, pH 7.0. Low NaCl concentration was used because melting temperatures for some duplexes were too high to measure at higher NaCl concentrations. An equal amount of each strand was mixed in buffer and a temperature gradient from 0–90°C was applied. The resulting absorbance versus temperature curves were analyzed with MeltWin (50). For each sequence, at least five different concentrations were analyzed over at least a 10-fold concentration range.
Oligonucleotide Screen and Dose–Response Curves.
Oligonucleotides were initially screened by transcribing the precursor in the presence of 100 μM deoxyoligonucleotide for 1 h at 37°C. Transcription products were separated on 5% polyacrylamide denaturing gels. Results were imaged on a PhosphorImager as described (12). Dose–response curves were then measured for oligonucleotides that limited splicing to 20% or less. Each dose–response curve is an average of at least two assays, reported with standard error. IC50s were determined by fitting dose–response curves with SIGMAPLOT 2001's Logistic, 4 Parameter curve fit. Dose–response curves were also measured in the presence of up to 11 mM bulk RNA from Torula Yeast (Sigma). The concentration of bulk RNA was estimated with an extinction coefficient at 260 nm of 10405 M⋅1⋅cm−1⋅nt−1 obtained by averaging the extinction coefficients for dinucleotides (49).
Native Gel Electrophoresis.
Internally labeled C. albicans ribozyme (12) was purified on a 5% polyacrylamide denaturing gel. The RNA was extracted from the gel by the crush and soak method, 2-butanol concentrated, and ethanol precipitated. Effects of oligonucleotides on folding were assayed by annealing C. albicans ribozyme and 1 μM oligonucleotides in H0Mg buffer at 68°C for 5 min, followed by slow cooling to 37°C. MgCl2 was added to a final concentration of 10 mM, and the samples were allowed to equilibrate at 37°C for 30 min. The samples were placed on ice and loaded on a 7% polyacrylamide native gel containing H10Mg buffer, which was also used as the running buffer.
Diethyl Pyrocarbonate Modification.
The C. albicans ribozyme, 2 μM r(GACUCU) (a mimic of its native substrate), and oligonucleotides were annealed in H0Mg buffer at 68°C for 5 min. The samples were slow cooled to 37°C. MgCl2 was added to a final concentration of 10 mM, and the samples were then incubated at 37°C for 30 min. Diethyl pyrocarbonate (DEPC) was added to a final concentration of 650 mM, and samples were incubated for 20 min at 37°C (37). The reactions were quenched by ethanol precipitation. Sites of modification were detected by primer extension using AMV Reverse Transcriptase (Life Sciences) according to manufacturer's protocol except that samples were annealed in 435 mM NaOOCCH3 instead of water. The ribozyme was sequenced by the Sanger method with reverse transcriptase (51).
Results
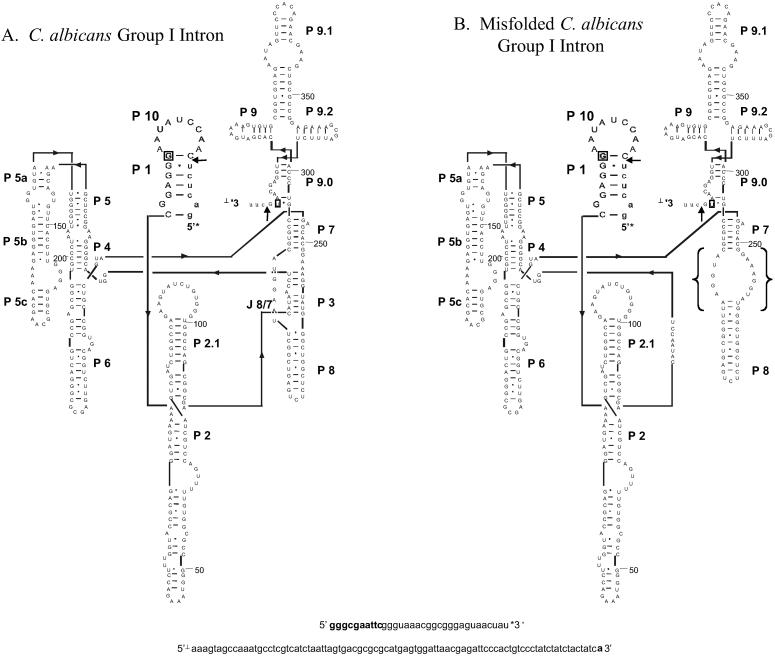
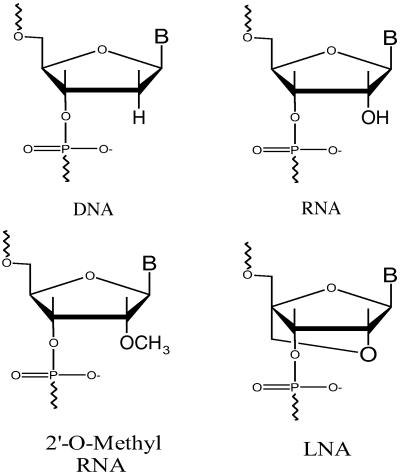
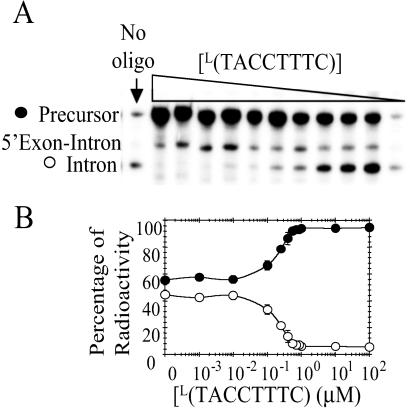
Fig. 1 shows the functional secondary structure of the C. albicans group I intron along with a suboptimal structure predicted by the program rnastructure (36). The suboptimal structure is only 2.2 kcal/mol less stable than the predicted lowest free energy structure, and differs from the functional structure by replacement of P3 with a 5 × 8 nucleotide internal loop. P3 is part of a pseudoknot that is a rate-limiting step in folding of the full length group I intron from T. thermophila (37, 52, 53). This finding suggested that oligonucleotides complementary to nucleotides 252–259 in the internal loop could stabilize this misfold during transcription and thus inhibit self-splicing. This was tested in a transcription mixture by including L(TACCTTTC), where L denotes LNA nucleotides (see Fig. 2). As seen in Fig. 3, L(TACCTTTC) inhibits 50% of self-splicing at 150 nM. Equivalent sequence oligonucleotides with DNA and RNA backbones did not inhibit self-splicing at 100 μM, whereas propynylation of the C5 position of pyrimidines in a DNA oligonucleotide inhibited 50% of self-splicing at 4 μM. Two control molecules, L(CCTTATCT) and L(ACTCACCT), decrease splicing only at concentrations greater than 10 μM. L(CCTTATCT) has the same base composition as the ODMiR oligonucleotide, L(TACCTTTC), but is not complementary to any region of the intron. L(ACTCACCT) is complementary to nucleotides 176–183, which are base paired in helix P5b. To test the specificity of L(TACCTTTC) for the group I intron, Torula Yeast bulk RNA was added to transcription mixtures. Nucleotide concentrations up to 11 mM (≈25,000 times the nucleotide concentration of the group I intron) did not significantly affect the IC50 of L(TACCTTTC) for inhibiting group I intron splicing.
Fig 1.
(A) Secondary structure of the C. albicans group I intron (12). (B) A misfolded secondary structure of the intron predicted by rnastructure (36), with brackets denoting the misfolded region. The intron and truncated exons are depicted in uppercase and lowercase letters, respectively. Arrows point to the splice sites. The C-10/1X ribozyme starts at G11 and ends at U377 as indicated by boxed letters. The 5′ and 3′ exon nucleotides in bold are endogenous to the vector.
Fig 2.
Chemical structures of the nucleotides used in this study.
Fig 3.
Inhibition of C. albicans group I intron self-splicing via ODMiR during transcription. (A) Autoradiogram of a gel for transcriptions in the presence or absence of L(TACCTTTC). (B) Plot of the percentage of intron (○) and precursor (•) as a function of [L(TACCTTTC)]. The control sequences, L(CCTTATCT) and L(ACTCACCT), inhibit splicing only at concentrations >10 μM. All points have error bars, though in some instances they are smaller than the data points.
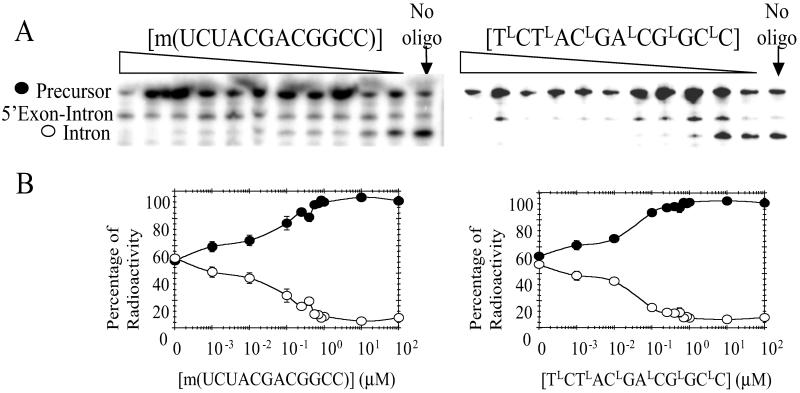
As an alternative to rational design, a library of 33 deoxyoligonucleotides of consecutive 12-mers complementary to the C. albicans group I intron's primary sequence was screened in the transcription assay. At 100 μM concentration, most sequences had little or no effect on splicing. However, d(TCTACGACGGCC), which is complementary to nucleotides 235–246, has an IC50 of 1 μM. Increasing the length of this oligonucleotide by 3 nt in either the 5′ or 3′ direction did not improve the IC50. Shifting the complementarity of the oligonucleotide by 6 nt to the 5′ or 3′ direction in the intron also did not improve the IC50. To improve the IC50 of this molecule, modifications were made to sugar moieties to give 2′-O-methyl oligonucleotides and LNAs (Fig. 2). The 2′-O-methyl analog improved the IC50 to about 50 nM, whereas the oligonucleotide with alternating deoxy and locked sugars, TLCTLACLGALCGLGCLC, gave an IC50 of about 30 nM (Fig. 4). The control sequence ALCTLCGLCALGTLCGLC, which has the same base composition, inhibits self-splicing only at concentrations >10 μM. Addition of up to 11 mM bulk Torula Yeast RNA did not significantly affect the IC50 of TLCTLACLGALCGLGCLC for inhibition of self-splicing.
Fig 4.
Inhibition of C. albicans group I intron self-splicing via ODMiR during transcription. (A) Autoradiogram of a gel for reactions in the presence or absence of m(UCUACGACGGCC) (Left) and TLCTLACLGALCGLGCLC (Right). (B) Plot of the percentage of intron (○) and precursor (•) as a function of [m(UCUACGACGGCC)] (Left) and [TLCTLACLGALCGLGCLC] (Right). The control oligonucleotide, ALCTLCGLCALGTLCGLC, inhibits splicing only at concentrations >10 μM. All concentrations have error bars, though in some instances they are smaller than the data points.
Binding sites for L(TACCTTTC), and TLCTLACLGALCGLGCLC were determined by reverse transcription stops in the presence and absence of oligonucleotide. Stops are observed at binding sites because reverse transcriptase is unable to proceed through the oligonucleotide. L(TACCTTTC) and TLCTLACLGALCGLGCLC bind as designed to nucleotides 176–183 and 235–246, respectively.
The strength of base pairing between several oligonucleotides and their RNA complements was measured by optical melting (Table 1 and Table 2, which is published as supporting information on the PNAS web site, www.pnas.org). As shown in Table 1, stronger base pairing usually provides a lower IC50. The exception is TLCTLACLGALCGLGCLC, which has an IC50 similar to its 2′-O-methyl equivalent even though its base pairing is more favorable by 7 kcal/mol at 37°C.
Table 1.
IC50s for inhibition of self-splicing by ODMiR oligonucleotides and their affinities for binding to a complementary RNA
| Oligonucleotide sequence | Tm, °C | −ΔG°37, kcal/mol | IC50, μM 47 |
|---|---|---|---|
| 5′d(TCTACGACGGCC) | 47 | 8.9 ± 0.2 | 1 |
| 5′m(UCUACGACGGCC) | 66 | 14.7 ± 0.3 | 0.05 |
| 5′TLCTLACLGALCGLGCLC | 81 | 21.8 ± 3.4 | 0.03 |
| 5′r(UACCUUUC) | 30 | 4.9 ± 0.6 | >100 |
| 5′d(PUAPCPCPUPUPUPC) | 52 | 9.1 ± 0.1 | 4 |
| 5′L(TACCTTTC) | 68 | 14.0 ± 0.8 | 0.15 |
The melting curves were measured for binding to 3′r(AGAUGCUGCCGG) (
) or 3′r(AUGGAAAG) (
) in 20 mM sodium cacodylate/0.1 mM NaCl/0.5 mM EDTA, pH 7.0. Tm is for 100 μM total strand concentration.
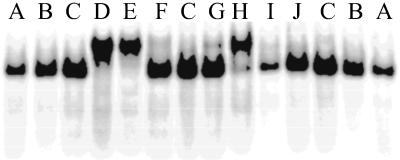
To further test the ability of oligonucleotides to stabilize misfolds, the ribozyme was reannealed in the presence of m(UCUACGACGGCC), TLCTLACLGALCGLGCLC, and L(TACCTTTC), and analyzed by native gel electrophoresis. As shown in Fig. 5, the oligonucleotides decrease mobility through the gel as compared with ribozyme reannealed in the absence of oligonucleotide or in the presence of substrate analogs—r(GACUCU) and r(U6GACUCU), which bind tightly to the ribozyme (12). The r(U6GACUCU) provides a control for the effect of added charge because the total net charge is the same for this molecule as for the longest oligonucleotide tested. Control molecules that contain the same base composition as oligonucleotides that inhibit splicing or that target a site that is completely paired in the native secondary structure, however, do not show reduced mobility (Fig. 5). This finding suggests that molecules that inhibit splicing are misfolding the intron.
Fig 5.
Misfolding of ribozyme detected by native gel electrophoresis. Lane A, ribozyme only; lane B, r(GACUCU); lane C, r(U6GACUCU); lane D, m(UCUACGACGGCC); lane E, TLCTLACLGALCGLGCLC; lane F, ALCTLCGLCALGTLCGLC; lane G, d(PUAPCPCPUPUPUPC); lane H, L(TACCTTTC); lane I, L(CCTTATCT); lane J, L(ACTCACCT). Lanes A, B, and C are standards for properly folded ribozyme. The concentration of all oligonucleotides is 1 μM. Lanes F and I contain molecules that are not complementary to ribozyme, and thus should not induce a misfold. Lane J has an oligonucleotide complementary to nucleotides 175–183 in P5b.
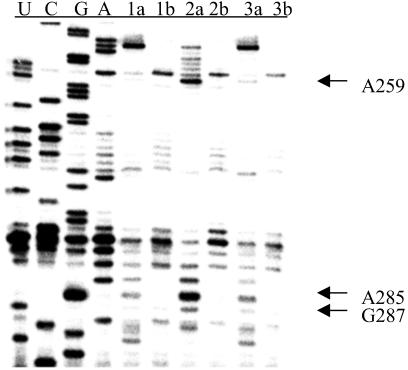
DEPC was used to probe for changes in the structure of the ribozyme when reannealed in the presence of r(GACUCU) and in the absence or presence of oligonucleotides. DEPC modifies the N7 position of A's and G's, thus giving insight into tertiary structure (54, 55). Sites of modification were detected by reverse transcription. When ribozyme was reannealed with r(GACUCU) and either TLCTLACLGALCGLGCLC or L(TACCTTTC), increased modification of N7s is seen at G98–99, G108–109, A112, A114, and A116-A117, when compared with ribozyme reannealed only with r(GACUCU) (Fig. 6). Additional sites of increased modification are seen when ribozyme is annealed with r(GACUCU) and TLCTLACLGALCGLGCLC. These include A259, A285, and G287 (Fig. 7).
Fig 6.
Misfolding of ribozyme detected by DEPC modification. Lanes marked with “a” denote DEPC applied; lanes marked with “b” denote no DEPC. Lanes 1, ribozyme annealed with r(GACUCU) only; lanes 2, ribozyme annealed with ODMiR oligomer TLCTLACLGALCGLGCLC + r(GACUCU); lanes 3, ribozyme annealed with control oligomer ALCTLCGLCALGTLCGLC + r(GACUCU); lanes 4, ribozyme annealed with ODMiR oligomer L(TACCTTTC) + r(GACUCU); lanes 5, ribozyme annealed with control oligomer L(CCTTATCT) + r(GACUCU); lanes 6, ribozyme annealed with control oligomer L(ACTCACCT) + r(GACUCU).
Fig 7.
Misfolding of ribozyme detected by DEPC modification. Lanes marked with “a” denote DEPC applied; lanes marked with “b” denote no DEPC. Lanes 1, ribozyme annealed with r(GACUCU) only; lanes 2, ribozyme annealed with ODMiR oligomer TLCTLACLGALCGLGCLC + r(GACUCU); lanes 3, ribozyme annealed with control oligomer ALCTLCGLCALGTLCGLC + r(GACUCU).
Discussion
RNA is an emerging target for therapeutics, and it is likely that there are many ways of inhibiting RNA function. Oligonucleotides are an attractive class of molecules for targeting RNA because much is known about the principles of molecular recognition between oligonucleotides and RNA. Moreover, oligonucleotide analogs are readily available (9), which facilitates rational design and screening of inhibitors. Moreover, the pharmacokinetic properties of oligonucleotides are relatively independent of sequence (8), which should further simplify the drug discovery process. Here, we demonstrate that oligonucleotide directed misfolding of RNA provides an approach that can be used to target RNA with short oligonucleotides.
Two approaches were used to identify oligonucleotide sequences that inhibit self-splicing in a transcription mixture. Prediction of potential secondary structures suggested an 8-mer complementary to one side of an internal loop in a suboptimal secondary structure (Fig. 1). Site-directed mutations on the T. thermophila group I ribozyme have shown that formation of a similar internal loop slows folding to the active species by interfering with formation of the P3/P7 pseudoknot (29), as was suggested by predictions of secondary structure (37). An RNA 8-mer did not bind tightly enough to stabilize the predicted misfold of the C. albicans intron. Replacing the backbone with LNA, however, provided inhibition of self-splicing with an IC50 of about 150 nM and caused misfolding of ribozyme as revealed by native gel electrophoresis and DEPC modification.
Convenient synthesis of DNA oligonucleotides (46, 47) allowed screening to be used as a second way to identify sequences suitable for the ODMiR approach. Of 33 sequences screened at 100 μM, only 5 significantly affected self-splicing during transcription. The most effective sequence, d(TCTACGACGGCC), also targets a region partially including the P3/P7 pseudoknot. This 12-mer also spans nucleotides involved in known tertiary interactions in group I ribozymes (56–58). Replacing the backbone with 2′-O-methyl or half the backbone with LNA provided inhibitors with IC50s of about 50 nM and 30 nM, respectively. These oligonucleotides also caused misfolding of the ribozyme as revealed by native gel electrophoresis for both (Fig. 5) and by DEPC modification for TLCTLACLGALCGLGCLC (Figs. 6 and 7).
The new DEPC modifications of A112 and A114 seen when ribozyme is annealed with TLCTLACLGALCGLGCLC or L(TACCTTTC) are particularly interesting. By analogy to the T. thermophila group I intron, A112 forms a tertiary contact to A72, whereas A114 forms a U283:A114:U260 base triple (59). Furthermore, when ribozyme is annealed with TLCTLACLGALCGLGCLC, A285 is modified. A285's N7 forms a tertiary contact to the 2′OH of U-3 (60). Accessibility of A285's N7 to DEPC modification suggests that this tertiary contact is perturbed. Evidently, the docking equilibrium of the P1 helix is less favorable in the presence of TLCTLACLGALCGLGCLC. Taken together, the evidence suggests that the presence of TLCTLACLGALCGLGCLC or L(TACCTTTC) perturbs the tertiary structure of the C. albicans group I intron.
Both approaches to identifying oligonucleotide inhibitors gave sequences expected to interfere with formation of the P3/P7 pseudoknot and with other tertiary interactions. Folding of the P3/P7 pseudoknot is known to be a slow step in formation of active ribozyme from full length transcript (29, 37, 52), though this does not necessarily imply that it will be slow during transcription (29, 37, 61). It will be interesting to see if targeting of pseudoknots and/or other tertiary interactions is a general strategy for ODMiR design.
Specificity is a key issue in design of therapeutics. Although 33 deoxyoligonucleotide dodecamers complementary to the C. albicans group I intron were tested, only 5 interfered with self-splicing (binding sites in P2.1, P3, P6, P7, and P9.1). Only 3 of these have IC50s less than 5 μM. Thus, complementarity is not sufficient to provide inhibition. Moreover, addition of up to 11 mM nucleotide concentration of bulk RNA from Torula Yeast does not significantly affect the IC50s of ODMiR oligomers. This finding suggests that oligonucleotides that inhibit an RNA by directing misfolding will not inhibit all other RNAs containing a complementary sequence. Improvements in predicting structure and in understanding of optimal targets for the ODMiR approach should eventually allow computational screening of genome sequences for designing oligonucleotides that will only affect a particular RNA. Moreover, the ODMiR approach should be applicable to any functional RNA that requires a specific secondary or tertiary structure. This includes RNAs that interact with proteins, mRNAs with regulatory untranslated regions, and catalytic RNAs such as RNase P RNAs and group II introns. Thus, the ODMiR approach provides a potentially general method for targeting RNA with short oligonucleotides.
Conclusion
We report a method for inducing nonfunctional misfolds of the C. albicans group I intron during transcription, ODMiR. When the intron is transcribed in the presence of L(TACCTTTC) and TLCTLACLGALCGLGCLC, self-splicing is inhibited by 50% at about 150 and 30 nM oligonucleotide, respectively. DEPC modification of purine N7s shows that these oligonucleotides prevent specific tertiary contacts from being formed in the P3/P7 region. ODMiRs should be applicable to many functional RNAs that require a specific secondary or tertiary structure.
Supplementary Material
Acknowledgments
We thank Mark E. Burkard for suggestions concerning initial library screen. J.L.C. thanks Profs. Karl M. Oberholser and J. Robert Martin. This work was supported by National Institutes of Health Grant GM22939 (to D.H.T).
Abbreviations
DEPC, diethyl pyrocarbonate
LNA, locked nucleic acid
ODMiR, oligonucleotide directed misfolding of RNA
References
- 1.Hermann T. & Westhof, E. (1998) Curr. Opin. Biotechnol. 9, 66-73. [DOI] [PubMed] [Google Scholar]
- 2.Pearson N. D. & Prescott, C. D. (1997) Chem. Biol. 4, 409-414. [DOI] [PubMed] [Google Scholar]
- 3.Galderisi U., Cascino, A. & Giordano, A. (1999) J. Cell. Physiol. 181, 251-257. [DOI] [PubMed] [Google Scholar]
- 4.Thayer A. (2002) Chem. Eng. News 80, 10. [Google Scholar]
- 5.Stein C. A. (2001) Nat. Biotechnol. 19, 737-738. [DOI] [PubMed] [Google Scholar]
- 6.Agrawal S. (1996) Trends Biotechnol. 14, 376-387. [DOI] [PubMed] [Google Scholar]
- 7.Holmlund J. T., Monia, B. P., Kwoh, T. J. & Dorr, F. A. (1999) Curr. Opin. Mol. Ther. 1, 372-385. [PubMed] [Google Scholar]
- 8.Crooke S. T., Graham, M. J., Zuckerman, J. E., Brooks, D., Conklin, B. S., Cummins, L. L., Greig, M. J., Guinosso, C. J., Kornbrust, D., Manoharan, M., et al. (1996) J. Pharmacol. Exp. Ther. 277, 923-937. [PubMed] [Google Scholar]
- 9.Freier S. M. & Altmann, K. H. (1997) Nucleic Acids Res. 25, 4429-4443. [DOI] [PMC free article] [PubMed] [Google Scholar]
- 10.Bevilacqua P. C. & Turner, D. H. (1991) Biochemistry 30, 10632-10640. [DOI] [PubMed] [Google Scholar]
- 11.Testa S. M., Gryaznov, S. M. & Turner, D. H. (1999) Proc. Natl. Acad. Sci. USA 96, 2734-2739. [DOI] [PMC free article] [PubMed] [Google Scholar]
- 12.Disney M. D., Haidaris, C. G. & Turner, D. H. (2001) Biochemistry 40, 6507-6519. [DOI] [PubMed] [Google Scholar]
- 13.Noller H. F., Hoffarth, V. & Zimniak, L. (1992) Science 256, 1416-1419. [DOI] [PubMed] [Google Scholar]
- 14.Nissen P., Hansen, J., Ban, N., Moore, P. B. & Steitz, T. A. (2000) Science 289, 920-930. [DOI] [PubMed] [Google Scholar]
- 15.Carter A. P., Clemons, W. M., Jr., Brodersen, D. E., Morgan-Warren, R. J., Hartsch, T., Wimberly, B. T. & Ramakrishnan, V. (2001) Science 291, 498-501. [DOI] [PubMed] [Google Scholar]
- 16.Miranda-Rios J., Navarro, M. & Soberon, M. (2001) Proc. Natl. Acad. Sci. USA 98, 9736-9741. [DOI] [PMC free article] [PubMed] [Google Scholar]
- 17.Kim Y. G., Su, L., Maas, S., O'Neill, A. & Rich, A. (1999) Proc. Natl. Acad. Sci. USA 96, 14234-14239. [DOI] [PMC free article] [PubMed] [Google Scholar]
- 18.Tang C. K. & Draper, D. E. (1989) Cell 57, 531-536. [DOI] [PubMed] [Google Scholar]
- 19.Houser-Scott F., Ziehler, W. A. & Engelke, D. R. (2001) Methods Enzymol. 342, 101-117. [DOI] [PubMed] [Google Scholar]
- 20.Waugh D. S., Green, C. J. & Pace, N. R. (1989) Science 244, 1569-1571. [DOI] [PubMed] [Google Scholar]
- 21.Stark B. C., Kole, R., Bowman, E. J. & Altman, S. (1978) Proc. Natl. Acad. Sci. USA 75, 3717-3721. [DOI] [PMC free article] [PubMed] [Google Scholar]
- 22.Cech T. R. & Golden, B. L. (1999) in The RNA World, eds. Gesteland, R. F., Cech, T. R. & Atkins, J. F. (Cold Spring Harbor Lab. Press, Plainview, NY), pp. 321–349.
- 23.Michel F. & Westhof, E. (1990) J. Mol. Biol. 216, 585-610. [DOI] [PubMed] [Google Scholar]
- 24.Peebles C. L., Perlman, P. S., Mecklenburg, K. L., Petrillo, M. L., Tabor, J. H., Jarrell, K. A. & Cheng, H. L. (1986) Cell 44, 213-223. [DOI] [PubMed] [Google Scholar]
- 25.Su L. J., Qin, P. Z., Michels, W. J. & Pyle, A. M. (2001) J. Mol. Biol. 306, 655-668. [DOI] [PubMed] [Google Scholar]
- 26.Ferat J. L. & Michel, F. (1993) Nature (London) 364, 358-361. [DOI] [PubMed] [Google Scholar]
- 27.Walstrum S. A. & Uhlenbeck, O. C. (1990) Biochemistry 29, 10573-10576. [DOI] [PubMed] [Google Scholar]
- 28.Uhlenbeck O. C. (1995) RNA 1, 4-6. [PMC free article] [PubMed] [Google Scholar]
- 29.Pan J. & Woodson, S. A. (1998) J. Mol. Biol. 280, 597-609. [DOI] [PubMed] [Google Scholar]
- 30.Treiber D. K., Rook, M. S., Zarrinkar, P. P. & Williamson, J. R. (1998) Science 279, 1943-1946. [DOI] [PubMed] [Google Scholar]
- 31.Chadalavada D. M., Knudsen, S. M., Nakano, S. & Bevilacqua, P. C. (2000) J. Mol. Biol. 301, 349-367. [DOI] [PubMed] [Google Scholar]
- 32.Celander D. W. & Cech, T. R. (1991) Science 251, 401-407. [DOI] [PubMed] [Google Scholar]
- 33.Russell R., Zhuang, X., Babcock, H. P., Millett, I. S., Doniach, S., Chu, S. & Herschlag, D. (2002) Proc. Natl. Acad. Sci. USA 99, 155-160. [DOI] [PMC free article] [PubMed] [Google Scholar]
- 34.Fedor M. J. & Uhlenbeck, O. C. (1990) Proc. Natl. Acad. Sci. USA 87, 1668-1672. [DOI] [PMC free article] [PubMed] [Google Scholar]
- 35.Been M. D., Perrotta, A. T. & Rosenstein, S. P. (1992) Biochemistry 31, 11843-11852. [DOI] [PubMed] [Google Scholar]
- 36.Mathews D. H., Sabina, J., Zuker, M. & Turner, D. H. (1999) J. Mol. Biol. 288, 911-940. [DOI] [PubMed] [Google Scholar]
- 37.Banerjee A. R. & Turner, D. H. (1995) Biochemistry 34, 6504-6512. [DOI] [PubMed] [Google Scholar]
- 38.Mercure S., Rougeau, N., Montplaisir, S. & Lemay, G. (1993) Nucleic Acids Res. 21, 1490. [DOI] [PMC free article] [PubMed] [Google Scholar]
- 39.Sogin M. L. & Edman, J. C. (1989) Nucleic Acids Res. 17, 5349-5359. [DOI] [PMC free article] [PubMed] [Google Scholar]
- 40.Netzker R., Kochel, H. G., Basak, N. & Kuntzel, H. (1982) Nucleic Acids Res. 10, 4783-4794. [DOI] [PMC free article] [PubMed] [Google Scholar]
- 41.Mercure S., Montplaisir, S. & Lemay, G. (1993) Nucleic Acids Res. 21, 6020-6027. [DOI] [PMC free article] [PubMed] [Google Scholar]
- 42.Nikolcheva T. & Woodson, S. A. (1997) RNA 3, 1016-1027. [PMC free article] [PubMed] [Google Scholar]
- 43.Mei H. Y., Cui, M., Lemrow, S. M. & Czarnik, A. W. (1997) Bioorg. Med. Chem. 5, 1185-1195. [DOI] [PubMed] [Google Scholar]
- 44.Miletti K. E. & Leibowitz, M. J. (2000) Antimicrob. Agents Chemother. 44, 958-966. [DOI] [PMC free article] [PubMed] [Google Scholar]
- 45.Wincott F., DiRenzo, A., Shaffer, C., Grimm, S., Tracz, D., Workman, C., Sweedler, D., Gonzalez, C., Scaringe, S. & Usman, N. (1995) Nucleic Acids Res. 23, 2677-2684. [DOI] [PMC free article] [PubMed] [Google Scholar]
- 46.Caruthers M. H., Beaton, G., Wu, J. V. & Wiesler, W. (1992) Methods Enzymol. 211, 3-20. [DOI] [PubMed] [Google Scholar]
- 47.Matteucci M. D. & Caruthers, M. H. (1980) Tetrahedron Lett. 21, 719-722. [Google Scholar]
- 48.Xia T., SantaLucia, J., Jr., Burkard, M. E., Kierzek, R., Schroeder, S. J., Jiao, X., Cox, C. & Turner, D. H. (1998) Biochemistry 37, 14719-14735. [DOI] [PubMed] [Google Scholar]
- 49.Puglisi J. D. & Tinoco, I., Jr. (1989) Methods Enzymol. 180, 304-325. [DOI] [PubMed] [Google Scholar]
- 50.McDowell J. A. & Turner, D. H. (1996) Biochemistry 35, 14077-14089. [DOI] [PubMed] [Google Scholar]
- 51.Sanger F., Nicklen, S. & Coulson, A. R. (1977) Proc. Natl. Acad. Sci. USA 74, 5436-5467. [DOI] [PMC free article] [PubMed] [Google Scholar]
- 52.Zarrinkar P. P. & Williamson, J. R. (1994) Science 265, 918-924. [DOI] [PubMed] [Google Scholar]
- 53.Sclavi B., Sullivan, M., Chance, M. R., Brenowitz, M. & Woodson, S. A. (1998) Science 279, 1940-1943. [DOI] [PubMed] [Google Scholar]
- 54.Peattie D. A. & Gilbert, W. (1980) Proc. Natl. Acad. Sci. USA 77, 4679-4682. [DOI] [PMC free article] [PubMed] [Google Scholar]
- 55.Ehresmann C., Baudin, F., Mougel, M., Romby, P., Ebel, J. P. & Ehresmann, B. (1987) Nucleic Acids Res. 15, 9109-9128. [DOI] [PMC free article] [PubMed] [Google Scholar]
- 56.Doudna J. A. & Cech, T. R. (1995) RNA 1, 36-45. [PMC free article] [PubMed] [Google Scholar]
- 57.Tanner M. A., Anderson, E. M., Gutell, R. R. & Cech, T. R. (1997) RNA 3, 1037-1051. [PMC free article] [PubMed] [Google Scholar]
- 58.Michel F., Ellington, A. D., Couture, S. & Szostak, J. W. (1990) Nature (London) 347, 578-580. [DOI] [PubMed] [Google Scholar]
- 59.Szewczak A. A., Ortoleva-Donnelly, L., Zivarts, M. V., Oyelere, A. K., Kazantsev, A. V. & Strobel, S. A. (1999) Proc. Natl. Acad. Sci. USA 96, 11183-11188. [DOI] [PMC free article] [PubMed] [Google Scholar]
- 60.Pyle A. M., Murphy, F. L. & Cech, T. R. (1992) Nature (London) 358, 123-128. [DOI] [PubMed] [Google Scholar]
- 61.Pan T., Artsimovitch, I., Fang, X. W., Landick, R. & Sosnick, T. R. (1999) Proc. Natl. Acad. Sci. USA 96, 9545-9550. [DOI] [PMC free article] [PubMed] [Google Scholar]
Associated Data
This section collects any data citations, data availability statements, or supplementary materials included in this article.


