

Abstract
The T-cell receptor (TCR) plays a central role in the immune system, and >90% of human T cells present a receptor that consists of the α TCR subunit (TCRA) and the β subunit (TCRB). Here we report an analysis of 63 variable genes (BV), spanning 553 kb of TCRB that yielded 279 single-nucleotide polymorphisms (SNPs). Samples were drawn from 10 individuals and represent four populations—African American, Chinese, Mexican, and Northern European. We found nine variants that produce nonfunctional BV segments, removing those genes from the TCRB genomic repertoire. There was significant heterogeneity among population samples in SNP frequency (including the BV-inactivating sites), indicating the need for multiple-population samples for adequate variant discovery. In addition, we observed considerable linkage disequilibrium (LD) (r2>0.1) over distances of ∼30 kb in TCRB, and, in general, the distribution of r2 as a function of physical distance was in close agreement with neutral coalescent simulations. LD in TCRB showed considerable spatial variation across the locus, being concentrated in “blocks” of LD; however, coalescent simulations of the locus illustrated that the heterogeneity of LD we observed in TCRB did not differ markedly from that expected from neutral processes. Finally, examination of the extended genotypes for each subject demonstrated homozygous stretches of >100 kb in the locus of several individuals. These results provide the basis for optimization of locuswide SNP typing in TCRB for studies of genotype-phenotype association.
Introduction
T lymphocytes generate and/or regulate immune responsiveness through a highly variable T-cell receptor (TCR) composed of two polypeptide subunits. The majority of T cells (>90%) express a receptor composed of the α TCR subunit (TCRA) and the β subunit (TCRB). During differentiation, each T cell recombines its TCR from smaller gene segments spread across the loci. In the human TCRB locus (MIM 186930) this involves the variable (V), diversity (D), joining (J), and constant (C) segments that span 630 kb of chromosome 7 (fig. 1A) (Davis and Bjorkman 1988; Jorgensen et al. 1992; Rowen et al. 1996). Polymorphism in individual TCRB V segments or small portions of TCRB has been analyzed in studies reported elsewhere but not by systematic large-scale resequencing (reviewed in Day et al. 1994; Arden et al. 1995; Rowen et al. 1996). Furthermore, some of the polymorphisms identified in these studies have been associated with progression of autoimmune disease in rheumatoid arthritis (Maksymowych et al. 1992; McDermott et al. 1995) and with changes in both expression and function of the TCRB gene (Charmley et al. 1993; Posnett et al. 1994; De Inocencio et al. 1995). Until a systematic attempt is made to find a dense array of SNPs across the TCRB cluster, the power to detect association between variants in this locus and disease susceptibility will remain low (Day et al. 1994; Rowen et al. 1996). Similarly, detailed knowledge of the patterns of linkage disequilibrium (LD) across the TCRB locus has also had to await a more comprehensive scan for polymorphism, although previous studies with small marker sets have suggested that there may be extensive LD in TCRB (Charmley and Concannon 1995; Charmley et al. 1995). Lastly, resequencing across a tandem array of genes affords a novel opportunity to examine the pattern of segregating variation in the face of potential intergenic exchange.
Figure 1.

Genomic structure, variant mapping to BV genomic structure, and variant mapping to TCRB structure. A, TCRB spans 667 kb and contains 65 variable (V) segments; the diversity, joining, and constant (DJC) segments of the T-cell receptor, as well as several trypsinogen (Try) genes, and a dopamine-β-hydroxylase-like-pseudogene (Do). B, Numbers below the figure denote variants found within each gene feature: promoter, exon 1 and 2, intron and the recombination-signal sequence (RSS). For exons, the first number in parentheses indicates nonsynonymous changes in both pseudogene and functional V segments combined, and the second number indicates nonsynonymous changes in functional V segments only. Arrows indicate the PCR primers. C, Variants mapped to the TCRB structural features: leader peptide (LDR), framework regions (FR1, FR2, FR3), and complementarity-determining regions (CDR1, CDR2, and CDR3). The number of nonsynonymous changes in functional V segments is provided below each structural feature.
Subjects and Methods
Population Samples
DNA samples of 10 individuals from each of four populations—African American, Chinese, Mexican, and Northern European—were drawn from the Coriell Cell Repositories’ Human Diversity Collection. Chimpanzee DNA (BIO2020-CHM) was obtained from Quantum Biotechnologies.
Primer Selection
Primer pairs were chosen to uniquely amplify 63 of the variable gene (BV) segments and pseudogenes in the TCRB locus. Each amplicon included both exons of the BV segment, the intervening intron, the recombination-signal sequence, and any known promoter elements. The average amplicon was 886 bp. To ensure primer specificity, partial matches of primer sequences to the entire TCRB locus were evaluated using a Smith-Waterman alignment tool. All primers for BV segments mismatched at least two of the four bases on the 3′ end of the primer with all other BV genes. To ensure amplicon specificity, all gene-specific assemblies were aligned with reference sequences for all other BV segments, using phrap and cross_match software. For genes belonging to multimember BV gene subfamilies, sequence traces from amplified BV segments were assembled with reference genomic sequences for all other subfamily members (Rowen et al. 1996). All PCR primers and conditions are provided at the Nickerson Laboratory home page.
DNA Amplification and Sequencing
PCR and sequencing reactions were performed in a manner that minimized handling of samples, as described elsewhere (Nickerson et al. 1998). All dye primer sequencing reactions were pooled directly in 96-well plates, precipitated in the microtiter plate, diluted in loading buffer, and directly loaded on an ABI 377 or 373 Prism DNA sequence analyzer.
Sequence Analysis
Analysis was performed as described elsewhere (Nickerson et al. 1998), with the following modifications. All polymorphic sites were identified and genotyped using PolyPhred, version 3.0 (Nickerson et al. 1997). Extensive confirmation of all individual genotypes was performed. First, all genotype calls by PolyPhred were verified independently by two analysts. Second, all genotypes were checked for consistency by comparing them with the opposite-strand genotype or with redundant sequencing reactions. Multiple sequencing coverage was available for 44% of all called genotypes, with >99% confirmation. Third, all SNPs found on one chromosome (a single heterozygote) or two chromosomes (two heterozygotes or a single homozygote) were reamplified and resequenced for confirmation. Fourth, genotypes were also evaluated by comparison with Hardy-Weinberg equilibrium expectations. After Bonferonni correction, none of these tests indicated significant departure. We have consistently found that all polymorphisms identified in this manner can be confirmed by a second, different genotyping assay (Nickerson et al. 1998; Nickerson et al. 2000). Mapping of SNPs onto a common TCRB V segment structure was accomplished using the International ImMunoGeneTics Database Web site. TCRB variants were mapped onto GenBank reference sequences U66059, U66060, and U66061. All variants and genotypes are available at the Nickerson Laboratory Web site. The variants are also available at the Single Nucleotide Polymorphism Database Web site.
Statistical Analysis
Population genetic parameters and tests (π, θ, and Tajima's D) were calculated as described elsewhere (Fullerton et al. 2000). FST statistics (Weir 1996) were calculated using the Genetic Data Analysis (GDA) package. Expected frequencies of minor alleles ± 1 SD, under an infinite-sites model, were generated by sampling from the distribution given by
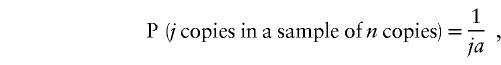 |
where
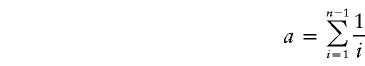 |
(shown as equation 9.69 in Ewens [1979]). The expected number of variants shared across four samples drawn from the same panmictic population was estimated as follows: The entire diploid genotype for each individual sequenced in our data set was randomly assigned to one of four “pseudopopulations” to produce four “populations” of 10 individuals. Each pseudopopulation sample was then scanned for variants. The total number of variants shared by all four populations and the number of population-specific variants were tallied. This process was then repeated 1,000 times to create 95% confidence intervals of the number of variants shared by all four populations and of the number of population-specific variants. This method is formally equivalent to randomly permuting genotypes over populations (Hudson et al. 1992).
Homozygosity Block Analysis
Chromosomal blocks of homozygosity within each individual were assessed as follows: Beginning at one end of TCRB, genotypes at each SNP site were successively tested for homozygosity. When one homozygous genotype was found, successive genotypes were scanned for homozygosity until either a heterozygous genotype or a missing genotype was encountered, at which point the homozygous segment was considered ended. If the distance between the first and last homozygous genotypes was >10 kb, the start and end positions of the segment were recorded. Scanning of the remaining genotypes then resumed. When the next homozygous SNP genotype was encountered, a new scan for homozygosity began. All 279 SNPs were used to assess homozygosity. The same strategy was applied to the simulated data.
Coalescent Simulation
We created genealogical trees, according to the procedure outlined by Hudson (1991) for the coalescent model with infinitely many sites. At each position in a sample of chromosomes, our program (available at the Kruglyak Laboratory Web site) stores the trees that describe the history of these chromosomes from the present sample all the way back to the time of their common ancestor. The gene trees differ across nucleotide positions only when a crossover event has occurred to break up one of the chromosomes. To account for this and to track finite genomic segments, we store the positions and time of each recombination. Between recombinations, the genetic history of the entire region can be described with a single tree structure. In placing crossovers, we assume that recombination occurs at a constant rate of 0.01/Mb per generation. To calculate the coalescence times, we used a constant effective population size of 10,000 individuals. For this study, gene trees were calculated for a sample of 80 chromosomes along a 1-Mb region.
Using the gene trees that were produced by the coalescent model, we placed mutations on the trees, using a constant mutation rate of 2 × 10⁻⁸ per nucleotide per generation. Our method is formally equivalent to placing a Poisson distribution of mutations along each branch, with the Poisson parameter proportional to branch length (Hudson 1991).
Because the region we sequenced was not continuous, we used the sequenced regions as a template for extracting SNPs from our simulation. Starting 100 kb from the 5′ end of our continuous 1-Mb simulated segment, we collected all the SNPs that occurred over the region equal in size to the first continuous sequenced region sampled (851 bases). We then excluded the next region over a distance equal to the gap between the first and second continuous sequenced regions sampled (1,214 bases). This process was continued until we had extracted SNPs from our simulated data over the exact number of regions and total distance sequenced.
Linkage Disequilibrium and Heterogeneity Testing
We calculated association, using three distinct measures of LD: r2 (Sved 1971), d2, and D′ (Lewontin 1964; Devlin and Risch 1995). Because these statistics are subject to substantial variation in small samples when the minor-allele frequencies are very low, we excluded all SNPs with minor-allele frequencies <.1 from our analysis, except as otherwise noted. When both SNPs were heterozygous in either the sample or our simulated data, we used the expectation-maximization algorithm (Hill 1974; Weir 1996) to obtain maximum-likelihood estimates of haplotype frequencies from counts of genotypes. On the basis of the estimates of frequencies of the four gametic types for each SNP pair in each of the four population samples, we tested heterogeneity in LD across population samples, using a permutation test analogous to that of Hudson et al. (1992). First, permutations were performed by randomly assigning each genotype to a population. Then, for each site pair, the LD statistics were calculated, and the largest between-population difference was retained. From 1,000 such permutations, we obtained a null distribution for the maximum between-population difference, and the probability of the observed between-population difference was determined from this null distribution.
Results
Sequence Variation in TCRB
The human TCRB locus contains V, D, J, and C gene segments as well as unrelated smaller genes located at either end of the locus (i.e., a dopamine-β-hydroxylase–like pseudogene [Do] and several trypsinogen genes [Try] [see fig. 1A]). The most abundant gene segments (65 total) are the Vs, which are spread across the locus. Most are 5′ to the D, J, and C segments, but one functional V is located 3′ to the constant regions (Lai et al. 1988). Of the 65 V segments, 46 are functional, and 19 are pseudogenes. For this study, 63 of the V segments were sequenced in 40 individuals. The only segments not scanned were the duplicated copies of BV13S2 (Arden et al. 1995), also known as BV6-2 and BV6-3 (Rowen et al. 1996), which are nearly identical in sequence. Sequence variants were identified in almost all V segments, with the exception of BV7S2 and BV22S1 (BV4-3 and BV2, respectively) (Rowen et al. 1996), both of which encode functional V segments. Overall, 55,848 bp of this 553-kb locus were sampled for variation across 40 individuals. The average spacing between sampled regions was 7.0 ± 4.5 kb.
In total, we identified 279 SNPs in 55,848 bp (i.e., ∼1 SNP every 200 bp). The estimate of overall nucleotide diversity (π) was 10.2 × 10⁻⁴ (table 1), which means that two chromosomes chosen at random will differ an average of once every 980 nucleotides. The Watterson (1975) estimate of θ = 4Nμ, which was based on the number of segregating sites, was 10.1 × 10⁻⁴. Given the number of segregating sites, the per-site heterozygosity was slightly (but not significantly) higher than expected under strict neutrality (Tajima’s D = 0.0153, P>.1 [Tajima 1989]). In fact, the frequency spectrum for the entire data set shows a remarkably good fit to that expected under the infinite-sites model, both within each population (data not shown) and when pooled across populations (fig. 2). Coding sequence showed the highest nucleotide diversity (13.4 × 10⁻⁴), followed by pseudogene sequence (9.6 × 10⁻⁴) and noncoding sequence (8.2 × 10⁻⁴) (table 1); however, given that the 95% confidence intervals overlap, these estimates of diversity across functional classes were not significantly different. These diversity estimates are also similar to the level of polymorphism observed in other recent genomic surveys (Cargill et al. 1999; Halushka et al. 1999; Sachidanandam et al. 2001; Venter et al. 2001).
Table 1.
Sequence Diversity (π) in Different Regions of the TCRB Locus, Stratified by Population[Note]
| RegionScanneda | AfricanAmerican(n = 10) | Chinese(n = 10) | Mexican(n = 10) | NorthernEuropean(n = 10) | Overall(n = 40) |
| Coding | 15.2 (92) | 9.1 (56) | 10.8 (59) | 10.2 (55) | 13.4 (114) |
| Noncoding | 9.2 (67) | 6.2 (44) | 7.3 (47) | 5.5 (47) | 8.2 (84) |
| Pseudogene | 12.5 (69) | 5.7 (39) | 7.5 (44) | 7.0 (42) | 9.6 (81) |
| Overall | 12.0 (228) | 6.9 (139) | 8.4 (150) | 7.4 (144) | 10.2 (279) |
Note.— Data are mean × 10−4 (total number of segregating sites in each category).
The numbers of bases analyzed in each region were 17,227 (coding), 22,534 (noncoding), and 16,087 (pseudogene); and the total number of bases analyzed was 55,848.
Figure 2.

Frequency spectrum for TCRB. Observed minor-allele frequencies at each of the 279 varying sites (filled circles) sorted in descending order; solid bars indicate ± 1 SD of the expected frequencies (line), under an infinite-sites model.
Population Subdivision
Stratification of the sequence variants among populations was evident: only 96 of the 279 variants were shared by all four populations. We performed a computer simulation that randomly reshuffled the 40 observed diploid genotypes into four populations at each site. The results of reshuffling the data 1,000 times produced 95% confidence intervals of 102–142 for the number of SNPs present in all four populations. We conclude that the observed value of 96 has a <5% probability of occurring by chance under the null hypothesis of panmixia and that fewer than the expected number of SNPs are shared across all four population samples.
Of the 183 population-specific sites, 111 were found in only a single population: 86 in the African American population, 13 in the Chinese population, 6 in the Mexican population, and 6 in the Northern European population. Computer resampling produced 95% confidence intervals of 73–87 sites present in single populations, suggesting that the data differ markedly from homogeneity. All population-specific sites in non-African populations were singletons or doubletons, and their rarity suggests that they were recently introduced into the population by mutation.
Both the number of variant sites (S) and the level of nucleotide diversity (π) varied among populations (table 1). The most variable population (African American, π = 12.0 × 10⁻⁴) was nearly twice as diverse as the least variable (Chinese, π = 6.9 × 10⁻⁴). This finding agrees with studies reported elsewhere that indicate greater sequence diversity in populations of African origin (Cavalli-Sforza et al. 1996; Nickerson et al. 1998). Note that because our sample is African American, the observed nucleotide diversity may be elevated partly by admixture and partly by the diverse origin from heterogeneous populations within Africa. Consistent with these findings, FST measures were significantly greater than zero for all population pairs (table 2) (Weir 1996). The estimate of FST over all sites for the four populations was 0.140, indicating that ∼14% of the variation was population specific, a figure in close agreement with other observations (Cavalli-Sforza et al. 1996).
Table 2.
Pairwise Estimates of Population Subdivision (FST)[Note]
| Population | AfricanAmerican | Chinese | Mexican | NorthernEuropean |
| African American | — | |||
| Chinese | .178 | — | ||
| Mexican | .157 | .045 | — | |
| Northern European | .176 | .091 | .151 | — |
Note.— P < .01 (by bootstrapping over sites for FST statistics for all population pairs).
Structural Mapping of Variants
Variation was distributed throughout the sequence of each BV segment, including the promoter, both exons, an intron, and the recombination-signal sequence required for TCRB genomic rearrangement (fig. 1B). Of the 139 variants identified in exonic sequence, 101 (74%) were nonsynonymous (74% and 70% in functional BV segments and pseudogenes, respectively). In contrast, three recent large-scale surveys of human genomic diversity indicate lower fractions of nonsynonymous changes (47%, 54%, and 53%, as reported by Cargill et al. [1999]; Halushka et al. [1999]; Venter et al. [2001], respectively).
To characterize the functional consequences of these coding changes, variants were translated. We found that 7 of the 72 coding changes inactivated otherwise functional BV segments and that one change reactivated a BV segment previously classified as a pseudogene (table 3). In addition, we characterized the population frequency of a large insertion-deletion that removes two functional BV segments (table 3). The frequencies of these inactivating variants suggest that the size of the TCRB V repertoire varies both within and among populations. We found individuals in each population who differed by at least two functional BV segments in their total TCRB gene count. The most extreme example was an individual who had lost 11% (5 of 47) of the BV repertoire.
Table 3.
BV Segment–Inactivating Substitutions
|
Frequency of Inactivating Allele in |
||||||||
| BV Segmenta | dbSNPSS No. | SubstitutionType | Outcome | AfricanAmericans | Chinese | Mexicans | NorthernEuropeans | All |
| BV06S1 (BV7-3) | 458428 | SNP | Mutation of invariant Cysb | .3 | .05 | .06 | .15 | .14 |
| BV08S5 (BV12-2)c | 19641 | SNP | Stopd | .8 | .7 | .65 | .28 | .62 |
| BV09S1 (BV3-1) | 19643 | SNP | Splice-site disruptione | .05 | … | … | … | .01 |
| BV12S2 (BV10-1) | 19660 | SNP | Stopd | .3 | .25 | .2 | .7 | .36 |
| BV13S7 (BV6-8)f | 458517 | SNP | Stopd | .4 | … | … | … | .1 |
| BV20S1 (BV30) | 19678 | SNP | Stopd,g | … | .05 | .25 | .3 | .15 |
| BV21S1 (BV11-1) | 458534 | SNP | Stopd | .05 | … | … | … | .01 |
| BV25S1 (BV16) | 19695 | SNP | Stopd,h | .61 | … | .06 | … | .16 |
| BV07S2-13S2 (BV4-3, BV6-2) | … | 21.5-kb deletion | Deletion of genesi | .7 | .55 | .8 | .5 | .64 |
Previously identified (Luyrink et al. 1993).
Previously identified as pseudogene (Rowen et al. 1996).
All stop codons truncate V segments before CDR3 and thus preclude productive genomic rearrangement.
AG changed to TG in splice acceptor.
Potential pseudogene (Rowen et al. 1996).
Previously identified (Charmley et al. 1993).
Previously identified (Rowen et al. 1996).
Previously identified (Seboun et al. 1989).
The functional significance of the coding variants were also evaluated by mapping changes onto the TCRB consensus structure (Ruiz et al. 2000). The variable region of the TCRB molecule consists of three relatively invariant framework regions (FR), and three hypervariable complementarity-determining regions (CDRs) responsible for antigen recognition (Garboczi et al. 1996; Garcia et al. 1996). Nonsynonymous coding variants were distributed throughout each of the structural elements of the BV segment, including both of the first two CDRs (CDR1 and CDR2) (fig. 1C). Five of these variants (rs [reference SNP] numbers 17248, 361354, 361407, 361462, and 361465) map to the CDR apexes that contact the major histocompatibility complex (MHC) peptides in most of the TCR structures solved to date (Garcia et al. 1999). These variants may alter the avidity or specificity of the TCR. Furthermore, a total of six variants could alter responses to superantigens (SAGs) which circumvent normal MHC peptide activation of T cells by binding to TCRB within and outside its antigen-binding site. Three of the variants mapped to residues in BV20S1 known to contact SAGs (rs numbers 17268, 361461, and 361462), and an additional three mapped to hypervariable region 4 (HV4) involved in SAG contacts (Li et al. 1999) (rs numbers 17244, 361355, and 361383). Nucleotide diversity was not significantly higher in the CDRs than in non-CDR coding sequence (13.1 × 10⁻⁴ vs. 12.7 × 10⁻⁴). This suggests that genomic polymorphism does not contribute to the hypervariability of these regions (Funkhouser et al. 1997); rather, it suggests that the CDR diversity has arisen primarily through divergence among various BV segments (Funkhouser et al. 1997).
Linkage Disequilibrium in TCRB and Coalescent Simulation
According to the common-variant/common-disease hypothesis (Chakravarti 1999), common alleles are likely to underlie genetic susceptibility to common diseases, so common SNPs may be of particular interest in association tests. A sample of 80 chromosomes would generally be adequate to estimate LD across the TCRB locus, but, because this sample was drawn from four populations, it is essential that heterogeneity of LD among populations be tested before pooling. For this purpose, we applied the following permutation test, which makes no assumptions about the evolutionary history of the populations. Using a series of LD statistics (D, D′, d2, and r2), we compared LD for each site pair, with minor-allele frequencies for both sites >.1 among populations, retaining the largest difference in LD between pairs of populations. These values were compared with those generated under a null hypothesis of no population substructure, estimated from 1,000 permutations of the data (i.e., shuffling the population identities while otherwise retaining the data structure [Hudson et al. 1991]). For each permutation, LD statistics were calculated for each site pair in each population; and the largest difference between populations was identified. These permutations generate null distributions, against which the observed LD differences were compared. Figure 3 shows the tail probabilities of the permutation tests for interpopulation differences in r2, showing that 418 (4.7%) of the 8,911 tests had P<.01, and that sites with interpopulation differences in LD tended to cluster. The inference of slight excess population heterogeneity in LD was consistent among various statistical tests of LD, and only r2 is reported here. Restricting the permutation test described above to only those SNPs that segregated in all four populations gives essentially the same result, with 175 (3.5%) of 4,950 tests showing significant heterogeneity in LD at P<.01. This implies that we need to be concerned about spurious appearance of LD when pooling across populations, even if we restrict our analysis to sites present in all subpopulation samples.
Figure 3.

Population heterogeneity in LD. Filled squares indicate where the observed values fall within the null distribution (black squares: P<.01; gray squares: .01 ⩽ P<.05).
We calculated LD between each pair of the 96 sites that (a) had minor-allele frequencies >.1, (b) were shared by all four populations, and (c) for which there was homogeneity in LD across populations (fig. 4A). These sites were present in 45 of the 63 typed BV segments and in 32 of the 46 functional BV segments. On average, LD between common variants extended over considerable distances, with considerable variation about the mean (fig. 4A). The mean value of LD (r2) declined to 0.1 at ∼30 kb, a figure that appears to vary widely across the genome and among population samples (Collins et al. 1999; Huttley et al. 1999; Dunning et al. 2000; Eaves et al. 2000; Goddard et al. 2000; Jorde 2000; Kidd et al. 2000; Pzreworski et al. 2000; Taillon-Miller et al. 2000; Abecasis et al. 2001).
Figure 4.

LD in TCRB. A, LD (r2) observed across the TCRB locus for sites common to all four populations having minor-allele frequencies ⩾.1 plotted against distance. Filled circles indicate r2 for individual site pairs. Large red circles denote the average r2 in 5-kb bins. B, Same as in panel A, except the SNPs used to calculate LD are simulated using a coalescent model that replicates the observed sampling procedure. C, Distribution of LD. In the upper right hand triangle the darkened squares indicate statistically significant LD (P<.01); In the lower left triangle, the darkened squares indicate complete LD (i.e. <4 haplotypes are observed).
To examine the evolutionary process that generates LD in TCRB, we performed coalescent simulations of an extended region that matched the locus in size and nucleotide diversity. Because the observed diversity is in the same range as in other studies of human variation (Cargill et al. 1999; Halushka et al. 1999) we reasoned that TCRB could be described using a model applied to other genomic loci. A model with an effective population size (Ne) of 10,000, a neutral mutation rate of 2 × 10⁻⁸ per generation (4Nμ=8×10⁻⁴), and a per-nucleotide recombination rate of 1 × 10⁻⁸ (4Nc=4×10⁻⁴) produced LD values that declined with distance somewhat faster than those observed, r2>0.1 at ∼25 kb (fig. 4B). There are several potential explanations for the observed difference, including: less recombination than expected (but recombination in single sperm cells suggests that the recombination rate in this region may be slightly higher than average [Day et al. 1994]), natural selection distorting haplotype frequencies, and hidden population structure. Furthermore, a panmictic model is expected to have less LD than one with population founding, extinction, interpopulation migration, or population expansion.
Variation in LD across TCRB
The availability of 96 common SNPs (minor-allele frequency >.10) in 553 kb of sequence (a mean of 1 SNP every 5.8 kb) allowed us to examine the distribution of LD across TCRB at high resolution. To do this, we plotted, on a two-dimensional grid, LD for each pair of common sites exhibiting homogeneous LD across the four populations. Statistically significant LD (P<.01) appeared to show considerable spatial structure, with several “blocks” of LD (fig. 4C). We also examined the pattern of site pairs in complete LD (D′=1, implying that fewer than four two-locus haplotypes were observed) and found similar spatial structure (lower triangle of fig. 4C) compared with that in the blocks of LD.
It is tempting to conclude that the observed spatial variation in LD across TCRB is caused by genuine heterogeneity in the underlying population-genetic forces that shape LD. To test this, we first applied a sliding-window analysis to see whether there was any suggestion of variability across the locus in π and θ. Figure 5A shows estimates of π and θ for each BV segment. A coalescent simulation of 80 alleles sampled from a population with the given θ and 4Nc had a 95% confidence interval (based on 1,000 replicates) of nucleotide-diversity estimates that encompassed the observed variability. To get an idea of the degree of heterogeneity across the region in the extent of population subdivision, we calculated FST for each site (fig. 5B). This plot shows somewhat elevated FST in the middle of the TCR cluster, but again the level of heterogeneity is not greater than that expected under a simple island model.
Figure 5.

Variation in π, θ, and FST spatially across TCRB. A, π (unblackened circles) and θ (blackened diamonds). Each data point represents the statistic for all variant sites within one of the sampled 63 BV segments. B, FST. Each point represents the FST value for one of the 279 variant sites.
The apparent degree of clustering of blocks of LD does not necessarily indicate local depressions in recombination rate, and, in fact, even the simplest model of balance between mutation drift and recombination will generate such blocks. To illustrate this, we performed simulations under a neutral model with homogeneous parameters across the locus. This model is not meant to be an accurate description of TCRB; nonetheless, it provides a good null model, deviations from which would provide a sign of true heterogeneity. For illustration purposes, we generated several replicates of simulated data under this model (fig. 6). All showed some level of spatial structure and apparent heterogeneity in LD, with some replicates showing larger blocks and similar coherence within blocks when compared with the actual data. Although this is not meant to be a statistically rigorous analysis, it does show that the appearance of blocks of sites in LD is not sufficient to warrant suspicion of a recombination cold spot or a selective-sweep event. Rather, coalescent modeling demonstrates that such patterns are easily generated, even when there is perfect homogeneity of forces acting on LD.
Figure 6.

LD of four simulated data sets. Plots are as described in figure 4C. Simulated data sets were generated with the same population size and mutation rate as for figure 4B.
Homozygous Blocks in TCRB
LD statistics across TCRB are related to the amount of recombination that has taken place during the time since the most-recent common ancestor of the entire sample. Even if the ancestry of the sample is ancient—and significant LD is therefore confined to short distances—some chromosomes within the sample will nonetheless share more-recent ancestry. To examine this possibility, we identified and plotted regions of homozygosity across ⩾10 kb in each of the individuals in our sample (fig. 7A). This plot reveals a mosaic structure to the genotypes, and also highlights differences among the populations. When we constructed diploids by randomly drawing pairs of chromosomes from our coalescent simulation, the pattern of blocks of homozygosity seen in the simulations was remarkably like that of the observed data (fig. 7B). The sizes of the blocks of homozygosity that we see are to be expected in the human genome, under reasonable distributions of times to common ancestry (see Clark 1999), but are only detected when studies of sequence variation extend to this scale of breadth and coverage. We identified several individuals who were completely homozygous for all sites within regions of ∼100 kb, and it implies, as surprising as this may seem, common ancestry of an individual's two chromosomes within the last ∼20 generations. The recent identification of estimated haplotypes on a similar scale in TCRA (Moffatt et al. 2000) suggests that a haplotype-based analysis at the scale of the entire TCR may be feasible.
Figure 7.

Homozygosity in TCRB. Segments of ⩾10 kb in which every site is homozygous in an individual are shown in black. A, Each row represents genotype information for one individual. B, Same as in panel A, except the data are from a single unselected coalescent simulation.
Discussion
Our study suggests that mutation in the TCRB locus is consistent with neutral evolutionary processes. One interesting observation was the high proportion of nonsynonymous changes in TCRB (74%) relative to several other large-scale surveys of variation in the human genome (47%, 54%, and 53%) (Cargill et al. 1999; Halushka et al. 1999, Venter et al. 2001). This finding has two potential explanations: (a) the multiplicity of TCRB genes may result in somewhat relaxed constraints on amino acid variation, because loss of function of any one of the genes would have less deleterious consequence than loss of function of single-copy genes or (b) a portion of nonsynonymous changes in TCRB could be selectively favored, because it further diversifies the immune repertoire. Consistent with a relaxed constraint on amino acid variation in the locus, the proportion of nonsynonymous variants that we found closely matches the proportion in the absence of any selection against amino acid changes (76%, assuming all changes are equally likely). Furthermore, we found no evidence of deviation from neutrality in the frequency spectrum of nonsynonymous changes (Tajima’s D=0.0237, P>.10). Chimpanzee sequence from 17 genes was available for comparison, and, by tallying counts of fixed differences versus polymorphic sites among variants that are synonymous versus nonsynonymous, we found that nonsynonymous variants are no more likely to be polymorphic in humans (χ2=0.06, not significant) (McDonald and Kreitman 1991). This suggests an absence of evidence for forces that specifically maintain amino acid polymorphism in the human lineage. Taken together, these results suggest that TCRB is a neutrally evolving multigene family that has generated considerable protein diversity through amino acid differences among gene family members.
Variation in TCRB differs from previous studies of another multigene family, the olfactory receptor (OR) genes. Variation in the OR gene cluster on chromosome 17, which contains both functional receptors and pseudogenes, suggests that weak positive selection may suppress variability in the functional receptors (Gilad et al. 2000). The ratio of polymorphic to fixed variants in OR genes appears to be lower in functional genes than in pseudogenes. This conclusion was supported by a low level of polymorphism to divergence in both functional OR genes and in pseudogenes (as shown by a Hudson/Kreitman/Aguadé test), although this effect was stronger for functional genes. Also, there appeared to be a lower level of nucleotide and haplotype diversity in active OR genes than in pseudogenes. In contrast, nucleotide diversity in TCRB coding regions is higher, but not significantly so, than that observed in intronic and pseudogene sequences. Furthermore, the proportion of polymorphic to fixed variants was not significantly different between coding sequences and pseudogene sequences in TCRB, in contrast to the OR gene cluster. In another study of this OR cluster, Sharon et al. (2000) report a slight excess in the proportion of nonsynonymous variants in OR genes (66%) relative to other genomic loci, but the effect is not as great as that seen in TCRB, a result that further underscores differences between the two loci.
Previous studies of TCRB (Hood et al. 1993) suggest that portions of the locus have a dynamic evolutionary history, including duplication and deletion events, in the primate lineage. Interestingly, we failed to detect new deletions within TCRB: 61 of 63 BV segments could be amplified from all of the 40 samples we examined, and the two genes that were detected as deletion variants (BV7S2 and BV9S2) lie within a previously identified polymorphic 21.5-kb insertion-deletion in TCRB (Seboun et al. 1989). These data suggest that TCRB is relatively stable with respect to gene deletion and that variation in the size of the TCRB repertoire is primarily the result of this insertion, as well as the BV-inactivating variants. The variation in the number of BV gene copies (±11%) suggests that the human genomic BV repertoire is more than sufficient for survival, and the presence of variation in the human TCRB repertoire size is qualitatively similar to the finding of large TCRB deletions in wild populations of mice (Jouvin-Marche et al. 1989).
Taken together, the data we present here, including the evidence of BV segment–inactivating variants, provides an excellent starting point for the identification of disease associations with TCRB. Several features of the polymorphism data in TCRB need to be considered in the design of an optimal method of choosing SNPs for testing a genotype-phenotype association. First, a vital aspect concerning expression of these genes is that they successfully proceed through a recombination, translation, and folding steps to form mature TCR molecules. Therefore, common variants may influence the progression and/or function of the TCR, for example, SNPs in the recombination-signal sequences (13 of which were identified in active BV genes), SNPs that inactivate BV genes, and SNPs in the complementarity-determining regions or superantigen-binding sites. Second, the levels of polymorphism across the array exhibit variation consistent with neutrality, so we do not find particular signs of hot or cold spots of variability. However, the variability in LD across TCRB suggests that the density of markers typed may need to vary considerably across the locus. Perhaps even more informative than simple SNP scoring would be a tally of homozygosity blocks and the use of these blocks for tests of association with immunity phenotypes.
Overall, the magnitude and pattern of LD across the TCRB array suggest that LD mapping would have a reasonable chance to succeed in this region of the genome, but the density of SNPs would have to be rather high. Every SNP exhibits significant LD with at least one other SNP, and this implies that hidden variation would be largely detected by sampling other SNPs. Although we found some heterogeneity in levels of LD across populations, most pairs of common SNPs that are in LD in one population exhibit similar LD in the other populations. The results also demonstrate how misleading blocks of LD can be, in that purely neutral coalescent models with homogeneous rates of mutation and recombination frequently generate strikingly similar blocks of multiple SNPs in LD. This simply means that those regions have had, by chance, relatively few recombination events in their ancestral history; and, of course, tightly linked sites would be expected to exhibit a more highly correlated ancestral history.
Genes whose products are involved in immune responses are well known for their high levels of variability, and the patterns of variability often show clear departures from neutral evolution (Hughes and Nei 1988). In fact, in large-scale scans for genes that exhibit a signature of natural selection in the form of excess nonsynonymous substitution, a large portion are found to be involved in vertebrate immune response (Endo et al. 1996). The TCRB data presented here depart markedly from this pattern, and the data appear concordant with neutrality by virtue of several tests: Tajima's D, whether applied to all data or to only the nonsynonymous sites, shows no sign of departure from neutral expectations. The McDonald-Kreitman test (McDonald-Kreitman [1991]) makes use of interspecific divergence to gain power in tests of neutrality, and it too yields no sign of selection. The data differ from those of many genes, in that they show a greater proportion of nonsynonymous differences, but this only makes the TCRB genes appear less subjected to purifying selection.
Because we know that TCRB is a vital part of the immune system—and that complete loss of TCRB would be disastrous for the individual—the question becomes how selection can produce a pattern so perfectly matching the neutral expectation. We suspect that the answer lies in the fact that TCRB is a tandem array and that selection on any one gene in the array is weak and acts only sporadically. The level of pseudogene polymorphism certainly is consistent with this idea.
Alternatively, we can turn the question around and ask how strongly selection could be acting on TCRB if the nature of the repetitive structure of the array, the gain and loss of genes, and the dispersal of selective effects across the whole array may attenuate the signal of selection. For any given bout of selection, it may be that only one TCRB segment is relevant to the assault. Compared with a single-copy gene, the force of selection could be felt as rarely as 1/65 as often for a given TCRB segment.
Finally, it is important to put the intragenic polymorphism of TCRB in the context of the deeper evolutionary history of this tandem array. When the different BV segments are aligned according to the reference sequence, the average nucleotide divergence across different segments is >40%, indicating that the tandem array predates the common ancestor of mice and humans (Su and Nei 2001). In fact, the divergence of the two oldest subfamilies of BV genes has been estimated to have occurred 423 million years ago. This high divergence among the BV segments makes the likelihood of gene conversion events across segments very low. The analysis of Su and Nei (2001), in fact, finds no evidence for intersegment exchange, but it does suggest relatively rapid gain and loss of genes in the human-mouse comparison. Our finding of extensive polymorphism for active genes versus pseudogenes is consistent with the birth-and-death model in this multigene family.
Acknowledgments
We thank M. Rieder and S. Taylor, for many helpful discussions, and S. daPonte, P. Lee, M. Montoya, C. Thayer, and T. Miller, for their assistance in obtaining the BV segment polymorphisms. This work was accomplished with support of National Institutes of Health grants AI45279 and HG01436 (to D.A.N.) and MH59520 (to L.K). L.K. is a James S. McDonnell Centennial Fellow.
Electronic-Database Information
Accession numbers and URLs for data in this article are as follows:
- GDA: Software for the Analysis of Discrete Genetic Data, http://lewis.eeb.uconn.edu/lewishome/gda.html (for data analysis)
- GenBank, http://www.ncbi.nlm.nih.gov/Genbank/index.html (for U66059, U66060, and U66061 [for the reference sequence of human TCRB])
- IMGT, the International ImMunoGeneTics Database, http://imgt.cnusc.fr:8104 (for TCRB mapping and nomenclature)
- Kruglyak Laboratory, Fred Hutchinson Cancer Research Center, http://www.fhcrc.org/labs/kruglyak/ (for coalescent software)
- Online Mendelian Inheritance in Man (OMIM), http://www.ncbi.nlm.nih.gov/Omim/ (for TCRB MIM 186930)
- Phrap and cross_match, version 0.990319 (documentation by P. Green), http://bozeman.mbt.washington.edu/phrap.docs/swat.html (for alignment of gene-specific assemblies)
- PolyPhred, http://droog.mbt.washington.edu/PolyPhred.html (for PolyPhred software)
- Single Nucleotide Polymorphism Database, http://www.ncbi.nlm.nih.gov/SNP/ (for submitter “debnick” ss19617 to ss19719 and ss458387 to ss458562 [for TCRB V gene segment SNPs])
- Swat, version 0.990319 (documentation by P. Green), http://bozeman.mbt.washington.edu/phrap.docs/swat.html (for Smith-Waterman alignment tool)
- Nickerson Laboratory, University of Washington, http://droog.mbt.washington.edu (for genotypes, mapping information on variable sites, PCR primer sequences)
References
- Abecasis GR, Noguchi E, Heinsmann A, Traherne JA, Bhattacharyya S, Leaves NI, Anderson GG, Zhang Y, Lench NJ, Carey A, Cardon LR, Moffatt MF, Cookson WOC (2001) Extent and distribution of linkage disequilibrium in three genomic regions. Am J Hum Genet 68:191–197 [DOI] [PMC free article] [PubMed] [Google Scholar]
- Arden B, Clark SP, Kabelitz D, Mak TW (1995) Human T-cell receptor variable gene segment families. Immunogenetics 42:455–500 [DOI] [PubMed] [Google Scholar]
- Cargill M, Altshuler D, Ireland J, Sklar P, Ardlie K, Patil N, Lane CR, Lim EP, Kalyanaraman N, Nemesh J, Ziaugra L, Friedland L, Rolfe A, Warrington J, Lipshutz R, Daley GQ, Lander ES (1999) Characterization of single-nucleotide polymorphisms in coding regions of human genes. Nat Genet 22:231–238 [DOI] [PubMed] [Google Scholar]
- Cavalli-Sforza LL, Menozzi P, Piazza A (1996) The history and geography of human genes. Princeton University Press, Princeton, NJ [Google Scholar]
- Chakravarti A (1999) Population genetics: making sense out of sequence. Nat Genet 21:56–60 [DOI] [PubMed] [Google Scholar]
- Charmley P, Wang K, Hood L, Nickerson DA (1993) Identification and physical mapping of a polymorphic human T cell receptor Vβ gene with a frequent null allele. J Exp Med 177:135–143 [DOI] [PMC free article] [PubMed] [Google Scholar]
- Charmley P, Concannon P (1995) PCR-based genotyping and haplotype analysis of human TCRBV gene segment polymorphisms. Immunogenetics 42:254–261 [DOI] [PubMed] [Google Scholar]
- Charmley P, Concannon P, Hood L, Rowen L (1995) Frequency and polymorphism of simple sequence repeats in a contiguous 685-kb DNA sequence containing the human T-cell receptor β-chain gene complex. Genomics 29:760–765 [DOI] [PubMed] [Google Scholar]
- Clark AG (1999) The size distribution of homozygous segments in the human genome. Am J Hum Genet 65:1489–1492 [DOI] [PMC free article] [PubMed] [Google Scholar]
- Collins A, Lonjou C, Morton NE (1999) Genetic epidemiology of single-nucleotide polymorphisms. Proc Natl Acad Sci USA 96:15173–15177 [DOI] [PMC free article] [PubMed] [Google Scholar]
- Davis MM, Bjorkman PJ (1988) T-cell antigen receptor genes and T-cell recognition. Nature 334:395–402 [DOI] [PubMed] [Google Scholar]
- Day CE, Schmitt K, Robinson MA (1994) Frequent recombination in the human T-cell receptor beta gene complex. Immunogenetics 39:335–342 [DOI] [PubMed] [Google Scholar]
- De Inocencio J, Choi E, Glass DN, Hirsch R (1995) T cell receptor repertoire differences between African Americans and Caucasians associated with polymorphism of the TCRBV3S1 (Vβ 3.1) gene. J Immunol 154:4836–4841 [PubMed] [Google Scholar]
- Devlin B, Risch N (1995) A comparison of linkage disequilibrium measures for fine-scale mapping. Genomics 29:311–322 [DOI] [PubMed] [Google Scholar]
- Dunning AM, Durocher F, Healey CS, Teare MD, McBride SE, Carlomagno F, Xu C-F, Dawson E, Rhodes S, Ueda S, Lai E, Luben RN, Van Rensburg EJ, Mannermaa A, Kataja V, Rennart G, Dunham I, Purvis I, Easton D, Ponder BAJ (2000) The extent of linkage disequilibrium in four populations with distinct demographic histories. Am J Hum Genet 67:1544–1554 [DOI] [PMC free article] [PubMed] [Google Scholar]
- Eaves IA, Merriman TR, Barber RA, Nutland S, Tuomilehto-Wolf E, Tuomilehto J, Cucca F, Todd JA (2000) The genetically isolated populations of Finland and Sardinia may not be a panacea for linkage disequilibrium mapping of common diseases. Nat Genet 25:320–323 [DOI] [PubMed] [Google Scholar]
- Endo T, Ikeo K, Gojobori T (1996) Large-scale search for genes on which positive selection may operate. Mol Biol Evol 13:685–690 [DOI] [PubMed] [Google Scholar]
- Ewens WJ (1979) Mathematical population genetics. Springer-Verlag, New York, NY [Google Scholar]
- Fullerton SM, Clark AG, Weiss KM, Nickerson DA, Taylor SL, Stengård JH, Salomaa V, Vartiainen E, Perola M, Boerwinkle E, Sing CF (2000) Apoliprotein E variation at the sequence haplotype level: Implications for origin and maintenance of a major human polymorphism. Am J Hum Genet 67:881–900 [DOI] [PMC free article] [PubMed] [Google Scholar]
- Funkhouser W, Koop BF, Charmley P, Martindale D, Slightom J, Hood L (1997) Evolution and selection of primate T cell antigen receptor BV8 gene subfamily. Mol Phylogenet Evol 8:51–64 [DOI] [PubMed] [Google Scholar]
- Garboczi DN, Ghosh P, Utz U, Fan QR, Biddison WE, Wiley DC (1996) Structure of the complex between human T-cell receptor, viral peptide and HLA-A2. Nature 384:134–141 [DOI] [PubMed] [Google Scholar]
- Garcia KC, Degano M, Stanfield RL, Brunmark A, Jackson MR, Peterson PA, Teyton L, Wilson IA (1996) An αβ T cell receptor structure at 2.5 A and its orientation in the TCR-MHC complex. Science 274:209–219 [DOI] [PubMed] [Google Scholar]
- Garcia KC, Teyton L, Wilson IA (1999) Structural basis of T cell recognition. Annu Rev Immunol 17:369–397 [DOI] [PubMed] [Google Scholar]
- Gilad Y, Segre D, Skorecki K, Nachman MW, Lancet D, Sharon D (2000) Dichotomy of single-nucleotide polymorphism haplotypes in olfactory receptor genes and pseudogenes. Nat Genet 26:221–224 [DOI] [PubMed] [Google Scholar]
- Goddard KA, Hopkins PJ, Hall JM, Witte JS (2000) Linkage disequilibrium and allele-frequency distributions for 114 single-nucleotide polymorphisms in five populations. Am J Hum Genet 66:216–234 [DOI] [PMC free article] [PubMed] [Google Scholar]
- Halushka MK, Fan JB, Bentley K, Hsie L, Shen N, Weder A, Cooper R, Lipshutz R, Chakravarti A (1999) Patterns of single-nucleotide polymorphisms in candidate genes for blood-pressure homeostasis. Nat Genet 22:239–247 [DOI] [PubMed] [Google Scholar]
- Hill WG (1974) Estimation of linkage disequilibrium in randomly mating populations. Heredity 33:229–239 [DOI] [PubMed] [Google Scholar]
- Hood L, Koop BF, Rowen L, Wang K (1993) Human and mouse T-cell-receptor loci: the importance of comparative large-scale DNA sequence analyses. Cold Spring Harb Symp Quant Biol 58:339–348 [DOI] [PubMed] [Google Scholar]
- Hudson RR (1991) Gene genealogies and the coalescent process. In: Futuyma D, Antonovics J (eds) Oxford Surveys in Evolutionary Biology, Vol 7. Oxford University Press, Oxford, pp 1–44 [Google Scholar]
- Hudson RR, Boos DD, Kaplan NL (1992) A statistical test for detecting geographic subdivision. Mol Biol Evol 9:138–151 [DOI] [PubMed] [Google Scholar]
- Hughes AL, Nei M (1988) Pattern of nucleotide substitutions at major histocompatibility complex class I loci reveals overdominant selection. Nature 335:167–170 [DOI] [PubMed] [Google Scholar]
- Huttley GA, Smith MW, Carrington M, O'Brien SJ (1999) A scan for linkage disequilibrium across the human genome. Genetics 152:1711–1722 [DOI] [PMC free article] [PubMed] [Google Scholar]
- Jorde LB (2000) Linkage disequilibrium and the search for complex disease genes. Genome Res 10:1435–1444 [DOI] [PubMed] [Google Scholar]
- Jorgensen JL, Reay PA, Ehrich EW, Davis MM (1992) Molecular components of T-cell recognition. Annu Rev Immunol 10:835–873 [DOI] [PubMed] [Google Scholar]
- Jouvin-Marche E, Trede NS, Bandeira A, Tomas A, Loh DY, Cazenave PA (1989) Different large deletions of T cell receptor Vβ genes in natural populations of mice. Eur J Immunol 19:1921–1926 [DOI] [PubMed] [Google Scholar]
- Kidd JR, Pakstis AJ, Zhao H, Lu R-B, Okonofua E, Odunsi A, Grigorenko E, Bonne-Tamir B, Friedlaender J, Schulz LO, Parnas J, Kidd KK (2000) Haplotypes and linkage disequilibrium at the phenylalanine hydroxylase locus, PAH, in a global representation of populations. Am J Hum Genet 66:1882–1899 [DOI] [PMC free article] [PubMed] [Google Scholar]
- Lewontin RC (1964) The interaction of selection and linkage. I. General considerations, heterotic models. Genetics 49:49–67 [DOI] [PMC free article] [PubMed] [Google Scholar]
- Lai E, Concannon P, Hood L (1988) Conserved organization of the human and murine T-cell receptor β-gene families. Nature 331:543–546 [DOI] [PubMed] [Google Scholar]
- Li H, Llera A, Malchiodi EL, Mariuzza RA (1999) The structural basis of T cell activation by superantigens. Annu Rev Immunol 17:435–466 [DOI] [PubMed] [Google Scholar]
- Luyrink L, Gabriel CA, Thompson SD, Grom AA, Maksymowych WP, Choi E, Glass DN (1993) Reduced expression of a human Vβ 6.1 T-cell receptor allele. Proc Natl Acad Sci USA 90:4369–4373 [DOI] [PMC free article] [PubMed] [Google Scholar]
- Maksymowych WP, Gabriel CA, Luyrink L, Melin-Aldana H, Elma M, Giannini EH, Lovell DJ, VanKerckhove, C, Leiden J, Choi E, Glass DN (1992) Polymorphism in a T-cell receptor variable gene is associated with susceptibility to a juvenile rheumatoid arthritis subset. Immunogenetics 35:257–262 [DOI] [PubMed] [Google Scholar]
- McDermott M, Kastner DL, Holloman JD, Schmidt-Wolf G, Lundberg AS, Sinha AA, Hsu C, Cashin P, Molloy MG, Mulcahy B, Shanahan F, O’Gara F, McConnell FA, Adams C, Khan AM, Wolfe F, Rubin LA, Clegg DO, Husebye D, Amos CI, Ward RH, McDevitt HO (1995) The role of T-cell receptor β chain genes in the susceptibility to rheumatoid arthritis. Ann N Y Acad Sci 756:173–175 [DOI] [PubMed] [Google Scholar]
- McDonald JH, Kreitman M (1991) Adaptive protein evolution at the Adh locus in Drosophila. Nature 351:652–654 [DOI] [PubMed] [Google Scholar]
- Moffatt MF, Traherne JA, Abecasis GR, Cookson WO (2000) Single nucleotide polymorphism and linkage disequilibrium within the TCR α/δ locus. Hum Mol Genet 9:1011–1019 [DOI] [PubMed] [Google Scholar]
- Nickerson DA, Taylor SL, Weiss KM, Clark AG, Hutchinson RG, Stengård J, Salomaa V, Boerwinkle E, Sing CF (1998) DNA sequence diversity in a 9.7-kb region of the human lipoprotein lipase gene. Nat Genet 19:233–240 [DOI] [PubMed] [Google Scholar]
- Nickerson DA, Taylor SL, Fullerton SM, Weiss KM, Clark AG, Stengård J, Salomaa V, Boerwinkle E, Sing CF (2000) Sequence diversity and large-scale typing of SNPs in the human apolipoprotein E gene. Genome Res 10:1532–1545 [DOI] [PMC free article] [PubMed] [Google Scholar]
- Nickerson DA, Tobe VO, Taylor SL (1997) PolyPhred: detecting and genotyping single nucleotide substitutions by fluorescence-based resequencing. Nucleic Acids Res 25:2745–2751 [DOI] [PMC free article] [PubMed] [Google Scholar]
- Posnett DN, Vissinga CS, Pambuccian C, Wei S, Robinson MA, Kostyu D, Concannon P (1994) Level of human TCRBV3S1 (Vβ 3) expression correlates with allelic polymorphism in the spacer region of the recombination signal sequence. J Exp Med 179:1707–1711 [DOI] [PMC free article] [PubMed] [Google Scholar]
- Przeworski M, Hudson RR, Di Rienzo A (2000) Adjusting the focus on human variation. Trends Genet 16:296–302 [DOI] [PubMed] [Google Scholar]
- Rowen L, Koop BF, Hood L (1996) The complete 685-kilobase DNA sequence of the human β T cell receptor locus. Science 272:1755–1762 [DOI] [PubMed] [Google Scholar]
- Ruiz M, Giudicelli V, Ginestoux C, Stoehr P, Robinson J, Bodmer J, Marsh SG, Bontrop R, Lemaitre M, Lefranc G, Chaume D, Lefranc MP (2000) IMGT, the international ImMunoGeneTics database. Nucleic Acids Res 28:219–221 [DOI] [PMC free article] [PubMed] [Google Scholar]
- Sachidanandam R, Weissman D, Schmidt SC, Kakol JM, Stein LD, Marth G, Sherry S, et al (2001) A map of human genome sequence variation containing 1.42 million single nucleotide polymorphisms. Nature 409:928–933 [DOI] [PubMed] [Google Scholar]
- Seboun E, Robinson MA, Kindt TJ, Hauser SL (1989) Insertion/deletion-related polymorphisms in the human T cell receptor beta gene complex. J Exp Med 170:1263–1270 [DOI] [PMC free article] [PubMed] [Google Scholar]
- Sharon D, Gilad Y, Glusman G, Khen M, Lancet D, Kalush F (2000) Identification and characterization of coding single-nucleotide polymorphisms within a human olfactory receptor gene cluster. Gene 260:87–94 [DOI] [PubMed] [Google Scholar]
- Su C, Nei M (2001) Evolutionary dynamics of the T-cell receptor vb gene family as inferred from the human and mouse genomic sequences. Mol Biol Evol 18:503–513 [DOI] [PubMed] [Google Scholar]
- Sved JA (1971) Linkage disequilibrium and homozygosity of chromosome segments in finite populations. Theor Popul Biol 2:125–141 [DOI] [PubMed] [Google Scholar]
- Taillon-Miller P, Bauer Sardina I, Saccone NL, Putzel J, Laitinen T, Cao A, Kere J, Pilia G, Rice JP, Kwok P-Y (2000) Juxtaposed regions of extensive and minimal linkage disequilibrium in human Xq25 and Xq28. Nat Genet 25:324–328 [DOI] [PubMed] [Google Scholar]
- Tajima F (1989) Statistical method for testing the neutral mutation hypothesis by DNA polymorphisms. Genetics 123:585–595 [DOI] [PMC free article] [PubMed] [Google Scholar]
- Venter JC, Adams MC, Myers EW, Li PW, Mural RJ, Sutton GG, Smith HO et al. (2001) The sequence of the human genome. Science 291:1304–1351 [DOI] [PubMed] [Google Scholar]
- Watterson GA (1975) On the number of segregating sites in genetical models without recombination. Theor Popul Biol 7:256–276 [DOI] [PubMed] [Google Scholar]
- Weir BS (1996) Genetic data analysis. II. Sinauer Associates, Sunderland, MA [Google Scholar]