Abstract
Fluorescence correlation spectroscopy (FCS) of fluorescence resonant energy transfer (FRET) on immobilized individual fluorophores was used to study the Mg2+-facilitated conformational change of an RNA three-helix junction, a structural element that initiates the folding of the 30S ribosomal subunit. Transitions of the RNA junction between open and folded conformations resulted in fluctuations in fluorescence by FRET. Fluorescence fluctuations occurring between two FRET states on the millisecond time scale were found to be dependent on Mg2+ and Na+ concentrations. Correlation functions of the fluctuations were used to determine transition rates between the two conformations as a function of Mg2+ or Na+ concentration. Both the opening and folding rates were found to vary with changing salt conditions. Assuming specific binding of divalent ions to RNA, the Mg2+ dependence of the observed rates cannot be explained by conformational change induced by Mg2+ binding/unbinding, but is consistent with a model in which the intrinsic conformational change of the RNA junction is altered by uptake of Mg2+ ion(s). This version of FCS/FRET on immobilized single molecules is demonstrated to be a powerful technique in the study of conformational dynamics of biomolecules over time scales ranging from microseconds to seconds.
Monovalent and divalent cations such as magnesium and sodium play an important role in stabilizing nucleic acid structure in vivo. Specific binding sites for magnesium ions (1) have been observed crystallographically in a number of systems, including tRNA (2), hammerhead ribozyme (3), the P4-P6 domain of the Tetrahymena thermophila group I intron (4), and a 5S ribosomal RNA domain (5). Metal ions can also stabilize the RNA structure nonspecifically by screening the negatively charged backbone (6). Furthermore, the role of counterions is critical to understanding protein–nucleic acid interactions (7).
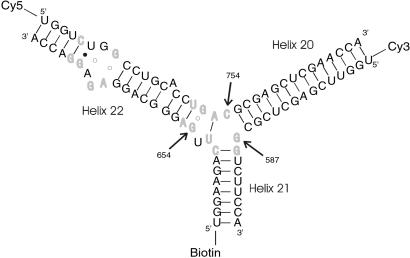
In the case of RNA–protein interactions, the situation can be even more complex when ion-dependent conformational changes accompany protein binding. An interesting example is the three-helix junction located in the central domain of the 16S ribosomal RNA that is the binding site for protein S15 (Fig. 1). Biochemical analysis of the binding of S15 from Bacillus stearothermophilus has shown that a large conformational change occurs in the junction region (8, 9). Two different groups recently solved the crystal structure of the ribo–nucleoprotein complex including the junction region and S15 protein (10, 11), and the structure of the entire 30S subunit has been solved (12, 13).
Figure 1.
The secondary structure of a modified 16S ribosomal RNA junction. Bases in bold light gray are conserved above 95% across all known eubacterial sequences. On folding, rotation of helix 22 by 60° toward helix 20 decreases the donor–acceptor distance from 8.5 nm to 5 nm, and the FRET efficiency increases markedly. Based on the crystal structure, it is likely that C754 switches base pairing from G587 to G654 in this transition.
In the open (unfolded) form of the junction, the three helices 20, 21, and 22 are arranged with nearly equal ≈120° angles between them. The folded form of the junction is formed in the presence of ions or upon the binding of S15, where helix 21 stacks coaxially under helix 22, and helix 20 makes 60° angle with helix 22. This unusual structure is stabilized in part by the noncanonical base-pairing between C754 and G654. S15 interacts with the upper bulge region of helix 22 and the junction region. Solution studies based on gel mobility of this RNA three-helix junction showed that various cations such as Mg2+, Ca2+, Co3+, and spermidine alone also yield the same folded conformation of the junction (8, 9). Crystallographic studies located 8 Mg2+ ions around the junction region that may be involved in stabilizing the folded form (10).
When fluorescence resonance energy transfer (FRET) (14, 15) was applied to single molecules (16), we previously observed conformational changes of individual RNA junctions that contained shortened helices 20, 21, and 22 (17). In the open conformation, the donor and acceptor are about 8.5 nm apart, whereas in the folded conformation they are about 5 nm apart based on the three-dimensional structure (10, 11). The large difference in donor–acceptor distance between the open and folded state makes the two conformations easily distinguishable by their different FRET efficiencies defined as Ia/(Ia + Id), where Ia is the acceptor intensity and Id is the donor intensity. In our previous study, the binding equilibrium and slow dissociation of S15 were observed. However, when we used a buffer exchange technique with a mixing time of ≈10 ms, we were unable to measure the conformational dynamics of the RNA junctions in response to [Mg2+] changes.
In this work, we use fluorescence correlation spectroscopy (FCS) (18, 19) and FRET on immobilized single molecules to measure the Mg2+- and Na+-dependent folding rates (kf,obs) and opening rates (ko,obs) of the RNA junction. Conventional FCS on freely diffusing molecules is not applicable if the time scale of their molecular transition is longer than their diffusion time across the observation region. Also, impurities, dye degradation, or incomplete labeling of one of the FRET pairs can be easily identified with immobilized molecules.
Materials and Methods
Sample Preparation.
A Cy3–Cy5 donor–acceptor pair was attached to two ends of the three-helix junction (Fig. 1), and a biotin moiety attached to the third helix was used for immobilization on a glass surface. Two coverslips (No. 1½, VWR Scientific) were flamed with a propane torch and taped to each other. The narrow channel between two glasses guided by double stick tape was used as a flow cell for microscopy. Glass surface was treated with 1 mg/ml of biotin-labeled bovine albumin (Sigma), 0.2 mg/ml of streptavidin (Molecular Probes) and ≈50 pM of biotinylated RNA junction, successively. Each step lasted for 5 min and was followed by washing the flow cell with the standard buffer (10 mM Tris/50 mM NaCl, pH 8). The biotinylated end of an RNA junction then forms a specific binding to the surface through the streptavidin linker.
Correlation of Fluorescence Intensities.
Information on stochastic processes underlying the fluctuations is contained in correlations of fluorescence fluctuations. Even for shot-noise-dominated fluorescence fluctuations, rate constant for the fluctuations can be extracted with high accuracy by counting a large number of photons. The autocorrelation AC(τ) of a signal I(t) is defined by
 |
1 |
where 〈I(t)〉 is the time average of I(t), and δI(t) is the difference of I(t) from 〈I(t)〉. Similarly, the cross-correlation CC(τ) of two signals is defined by
 |
2 |
To obtain correlation functions in terms of transition rates, we consider a two-level system composed of N identical molecules with state 1 and state 2. The master equation that governs the stochastic dynamics of the system is
 |
3 |
where N1(t) and N2(t) are the number of molecules in state 1 and state 2, and k1 and k2 are transition rates to state 1 and state 2, respectively. The solution to this equation is
 |
4 |
where λ = k1 + k2 and m = 1, 2. The long-time equilibrium probability P(m) of the system is then given by
 |
5 |
We now calculate the conditional transition probability P(m, t|n, t + τ) that a molecule in state m at time t, will be in state n at time t + τ. Applying the initial condition, Nm(t) = N and solving for Nn(t + τ) by using Eq. 4 leads to
 |
6 |
where δmn is the Kronecker delta. If Im is the observable measured from a single molecule in state m, the autocorrelation of I can be derived from Eq. 1 as
 |
7 |
We assume that the donor (acceptor) signal fluctuates in an anticorrelated manner between two intensity levels I and I
and I (I
(I and I
and I ). We further assume that two rate coefficients, the observed folding and opening rates, kf,obs and ko,obs apply to both signals. Applying these assumptions to Eq. 7, the autocorrelations for donor and acceptor signals and the cross-correlation between the two signals become
 |
8 |
 |
9 |
 |
10 |
where the apparent rate coefficient λ is the sum of kf,obs and ko,obs. It is assumed that I < I
< I and I
and I > I
> I for an anticorrelated fluctuation. The two-state approximation holds valid if the correlations decay exponentially with a single rate constant. Two parameters, the decay time of the exponential and the amplitude of the exponential at τ = 0, can be obtained from each correlation function.
Single-Molecule Measurements.
A confocal scanning microscope system was used to excite and detect fluorescent-labeled single RNA junctions as described (17). Donors were directly excited with an argon laser (Coherent, Santa Clara, CA) at 514 nm, and fluorescence was collected through an oil immersion objective (Achroplan 100×/1.25 oil; Zeiss) and detected at the donor emission maximum (590 nm) and acceptor emission maximum (675 nm) by two photon counting modules (SPCM-AQ, EG & G Optoelectronics, Vaudreuil, Quebec). The surface density of RNA junction was adjusted so that the fluorescent spots were well separated from one another.
One-step photobleaching was used to confirm the presence of single molecules, and photons from a number of different dye molecules had to be collected to achieve good statistics for correlation analysis. In our experiment, the excitation laser intensity at 514 nm was kept at ≈10 μW/μm2, and oxygen in solution was depleted by use of an enzymatic oxygen scavenging system, 0.1 g of β-D(+) glucose, 0.25 mg of glucose oxidase (Roche Molecular Biochemicals), 0.5 μl of catalase (Roche Molecular Biochemicals), and 10 μl of β-mercaptoethanol in 1 ml of the standard buffer. Minimum of 50 mM of Na+ was kept in the buffer to prevent RNA junctions from denaturing. Under these conditions, the Cy5 usually photobleached faster than the Cy3, with approximately 50,000 photons detected during its lifetime. Typically ≈106 photons were collected from ≈50 molecules to calculate correlation.
To capture the potentially fast conformational dynamics of the RNA junction, the rising edge of pulses from the avalanche photodiode was detected with a 100-ns clock signal (PCI-MIO-16E-4, National Instruments, Austin, TX). This acquisition method created data files storing the arrival times of single photons with 100ns resolution. With this method of recording, (i) the time resolution is limited by the speed of the clock board, (ii) the calculation of correlation functions can be performed much faster, and (iii) the same amount of information can be stored in much more compact form.
Results and Discussion
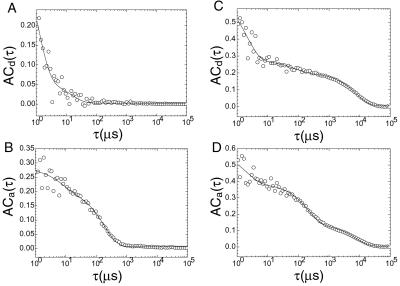
Fluorescence fluctuations of donor (Cy3) and acceptor (Cy5) dye molecules can be characterized by the intensity autocorrelation function. A Cy3 dye attached to the RNA junction in the absence of a corresponding Cy5 FRET partner shows two relaxation times (1.1 μs and 15 μs) (Fig. 2A). These relaxations may be tentatively identified as a combination of a trans–cis isomerization and triplet-state relaxation (20). To mimic a situation of direct excitation of Cy5, S15 protein (3-h off rate) was attached to the junction so that the molecule is in the folded configuration, giving high FRET efficiency (17). The autocorrelation amplitude of Cy5 is shown in Fig. 2B. The ≈100-μs relaxation time may indicate that Cy5 has a slower triplet-state relaxation time than Cy3. The observation that Cy5 photobleaches faster than Cy3 is consistent with this difference.
Figure 2.
Fluorescence autocorrelations AC(τ) calculated over 5 orders of magnitude of time. Autocorrelation curves in A and B are fitted with 2 exponentials [A1exp(−τ/t1) + A2exp(−τ/t2)], and autocorrelation curves in C and D are fitted with 3 exponentials [A1exp(−τ/t1) + A2exp(−τ/t2) + A3exp(−τ/t3)]. (A) AC(τ) of Cy3 dyes attached to RNA junctions, directly excited at 514 nm, in the absence of Cy5 acceptors. A1 = 0.42, t1 = 1.1 μs, A2 = 0.058, t2 = 15 μs. (B) AC(τ) of acceptor Cy5 dyes from S15-bound RNA junctions. The fluorescence emission of Cy5 dyes arises because of high FRET from the directly excited Cy3 dyes. A1 = 0.076, t1 = 7.4 μs, A2 = 0.2, t2 = 180 μs. t2 is much slower than the relaxation time of Cy5 in the presence of oxygen, which was measured to be on the order of ≈1 μs (20). However, the triplet-state lifetime of Cy5 might be dramatically lengthened in the absence of oxygen, a very effective triplet-state quencher. For example, the triplet decay rate of rhodamine 6G in aqueous solution equilibrated with argon atmosphere was reported to be 2.5 ms−1, 1,000-fold lower than the 2.5-μs−1 decay rate in oxygen-equilibrated solution (21). (C) AC(τ) of donors at [Mg2+] = 140 μM. Compared with A, a third exponential process is apparent. A1 = 0.40, t1 = 2.1 μs, A2 = 0.073, t2 = 78 μs, A3 = 0.2, t3 = 7.8 ms. (D) AC(τ) of acceptors at [Mg2+] = 140 μM. Compared with B, a third exponential process is apparent. A1 = 0.19, t1 = 2.1 μs, A2 = 0.25, t2 = 210 μs, A3 = 0.14, t3 = 7.5 ms.
When Mg2+ or Na+ was introduced, an additional relaxation feature appeared in both donor and acceptor correlations (Fig. 2 C and D), which is well separated in time from the relaxation processes intrinsic in the dye molecules. We identified this decay with the reversible conformational change of the RNA junction.
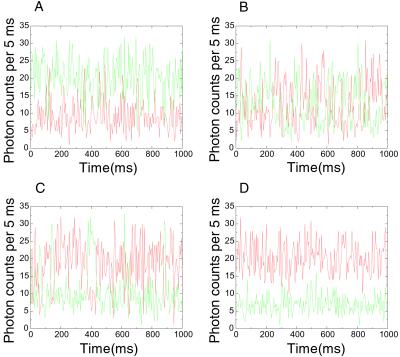
Fluorescence time traces from single RNA molecules were obtained at various concentrations of either Mg2+ or Na+, with an example shown in Fig. 3. At the midpoint concentrations, 130 μM for Mg2+ and 350 mM for Na+, the overall times spent in the open and folded conformations become equal and the fluorescence fluctuation is maximized.
Figure 3.
Fluorescence fluctuations of donor (green) and acceptor (red) signals at different [Mg2+]. Similar traces were seen with Na+. (A) [Mg2+] = 30 μM. (B) [Mg2+] = 140 μM. (C) [Mg2+] = 400 μM. (D) Fluorescence signals of donor and acceptor from an RNA junction, locked in the folded conformation by S15 protein.
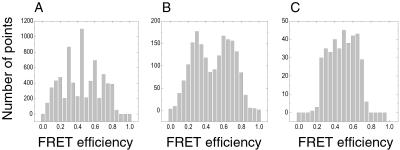
We plotted the histogram of the FRET signals from a single RNA junction at [Mg2+] = 140 μM using different time bins in Fig. 4. With typically 3 ∼ 4 photons detected from a single molecule per millisecond, an optimal time bin partially resolves the two FRET levels. At a 1-ms bin width, FRET distribution is not resolvable due to low signal-to-noise in each bin. As the time bin is increased to 5 ms, a bimodal distribution emerges, whereas a 25-ms time bin completely smears out the bimodal distribution.
Figure 4.
Histograms of the FRET efficiencies at different widths of the time bins. A fluorescence time trace of a single RNA junction obtained at [Mg2+] = 140 μM was binned in 1 ms, 5 ms, and 25 ms. FRET efficiencies were calculated for each binned point over the whole trace. Their numbers are shown in a histogram as a function of the FRET efficiencies at 1-ms bin width (A), 5-ms bin width (B), and 25-ms bin width (C). At ≈5-ms bin width, a bimodal distribution of the FRET efficiencies appears.
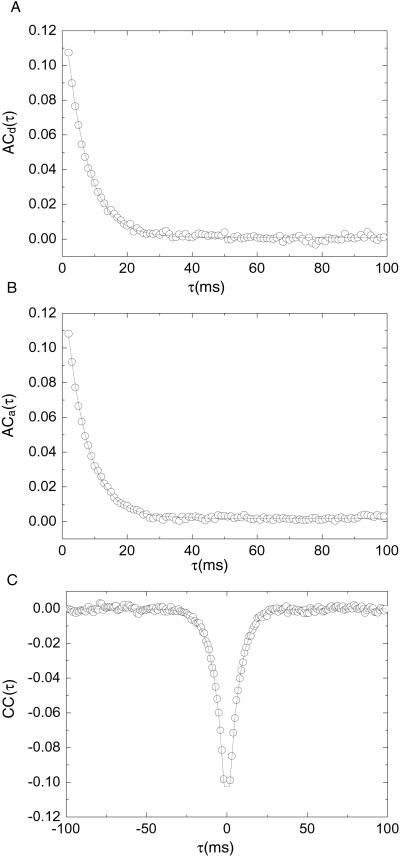
If the raw data are put into 1-ms time bins as shown in Fig. 5, the average correlation functions are well fitted by a single exponential function with the same decay rate, implying that the anticorrelated donor and acceptor fluctuations are driven by the same stochastic process. This finding further supports the idea that conformational changes of the RNA molecules cause the observed fluorescence fluctuations on this time scale.
Figure 5.
Correlation functions obtained at [Mg2+] = 120 μM. The autocorrelations of donor and acceptor signals are fitted separately with a single exponential [A1exp(−τ/t1)]. Cross-correlation is calculated in both lag directions and fitted with a symmetric single exponential centered at τ = 0. These representative correlation functions are the time-weighted-average of individual correlation functions of single RNA molecules. The correlations for τ = 0 are not considered. This treatment of the data effectively ignores the faster relaxation rates. Two parameters are determined from each correlation function −λ, the sum of kf,obs and ko,obs and ACa(0), ACd(0), or CC(0), the correlation amplitudes at τ = 0. (A) A1 = 0.14, t1 = 6.5 ms. (B) A1 = 0.14, t1 = 6.5 ms. (C) A1 = −0.13, t1 = 6.5 ms.
As stated in Materials and Methods, the observed folding and opening rates, kf,obs and ko,obs, can be extracted from the two fit parameters, τ and the correlation amplitude at τ = 0 using the experimentally determined ratios I /I
/I and I
and I /I
/I . The intensities, I
 and I
and I are taken from intensity measurements at low-salt condition where the junction is in open state, and I
 and I
and I are taken from measurements with S15 bound to the junction.
The fluorescence properties of donor and acceptor may slightly vary with ion concentration. For example, the individual fluorescence intensities of Cy3 and Cy5 at fixed emission wavelengths varied up to 10% over the range of Mg2+ and Na+ in our measurements. It is also possible that the FRET efficiency at a fixed distance changes with varying ion concentration. Because there is no direct way to accurately determine I /I
/I and I
and I /I
/I as a function of ion concentration, we let them float up to 15% around the estimated values.
With the unknown variable ko,obs/kf,obs, and the variables, I /I
/I and I
and I /I
/I , partially constrained as discussed above, the two equations for ACa(0) and ACd(0) can be solved for the range of ko,obs/kf,obs. The value of λ at each concentration is taken as the average of λ's obtained from ACa(τ), ACd(τ), and CC(τ). Individual rate constants, kf,obs and ko,obs, are then calculated from λ and ko,obs/kf,obs.
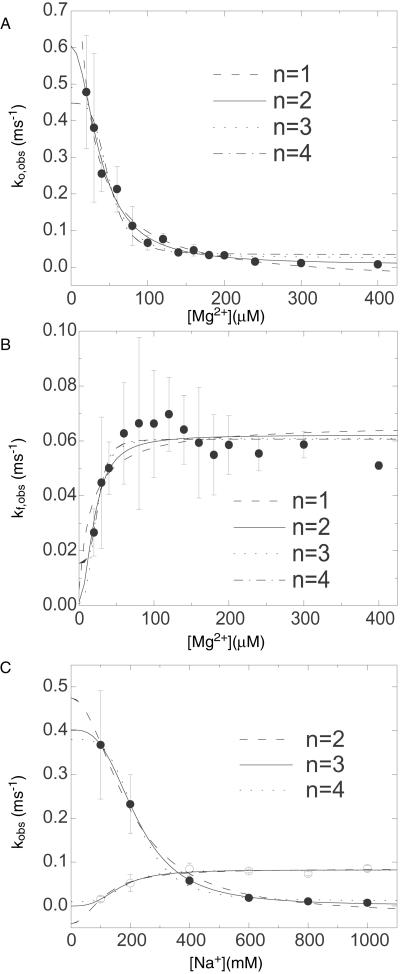
The overall dependence of kf,obs and ko,obs on Mg2+ and Na+ is shown in Fig. 6. The rates, kf,obs and ko,obs are equal at [Mg2+] = 140 μM, in agreement with our previous result (17). The effects of Na+ and Mg2+ on kf,obs and ko,obs are similar, except for the 2,500-fold larger equilibrium constant. Both cations accelerate the folding rate of the open form and reduce the unfolding rate of the folded form.
Figure 6.
The overall dependence of [Mg2+] and [Na+] on the observed folding and opening rates. The error bars show errors propagated from the 15% inaccuracy introduced in I /I
/I and I
and I /I
/I and the SD of τ among three values from ACa(t), ACd(t), and CC(t). (A) ko,obs as a function of [Mg2+]. The phenomenological fits based on Eq. 12 with n = 1 to 4 are shown, where n is defined to be the number of Mg2+ ions that bind collectively to the folded junction. For example, at n = 2, k
 = 0.604 ms−1, k
 = 0.007 ms−1 and KO = 0.026 μM−1. (B) kf,obs as a function of [Mg2+]. The phenomenological fits based on Eq. 11 with n = 1–4 are shown. kf,obs increases rather steeply with [Mg2+] up to the equilibrium constant and plateaus at higher [Mg2+]. For example, at n = 4, k
 = 0.015 ms−1, k
 = 0.061 ms−1 and KF = 0.04 μM−1. (C) ko,obs (●) and kf,obs (○) as a function of [Na+], Fits with n = 2–4 are shown.
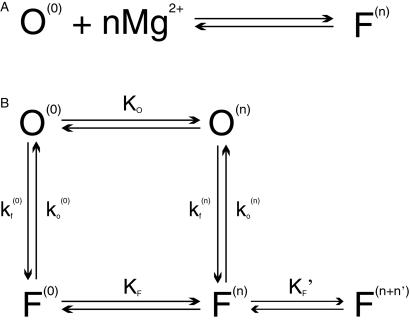
Folding due to a simple bimolecular reaction (Fig. 7A) between the RNA junction and cations cannot explain our data. In such a model, ko,obs would be identical to the dissociation rate of an ion, which should not depend on concentration. Therefore, a different approach to the conformational change should be considered to explain the Mg2+ dependence of the opening rate. We start from relaxing the constraint that ion exchange be coincidental with the actual conformational change of the RNA junction.
Figure 7.
Schemes for Mg2+-dependent conformational change of the RNA junction. O(0) and F(0) are ion-free, open and folded junctions, and O(n) and F(n) are open and folded junctions bound with n Mg2+ ions. (A) In bimolecular reaction scheme, the opening rate should be Mg2+-independent. (B) In this extended model scheme, it is assumed that n number of Mg2+ ions bind cooperatively to the junction. k (k
(k )and k
 (k
(k ) are folding and opening rates for ion-free (ion-bound) junctions. KO and KF are binding constants for binding one Mg2+ ion to the open and folded junctions, respectively. Thus, KO = [O(1)]/([O(0)][Mg2+]) and KF = [F(1)]/([F(0)][Mg2+]). Fluorescence fluctuation occurs as a result of conformational change between O forms and F forms with two observed rate constants, kf,obs and ko,obs. In the case where the folded form of the junction can be bound with more Mg2+ ions than the open form, a fifth state F(n + n′) is introduced with additional binding constant K′F. Similar to KO and KF, K′F = [F(n+1)]/([F(n)][Mg2+]).
Assuming that ion exchange is much faster than the conformational change, open and folded junctions will be equilibrated between ion-bound and ion-free forms with binding constants KO and KF, respectively. For simplicity, we assume that n ions bind cooperatively (i.e., any sequential binding is not time-resolved in our experiment) so that junctions exist either in the ion-free form or in the form bound with n ions. These two different forms connected by KO or KF are not distinguishable by means of fluorescence. More properly, the value of n should be taken as the Hill coefficient, the maximum possible value of which is equal to the number of binding sites.
In such a four-state model as sketched in Fig. 7B, the observed conformational changes can occur via two pathways, one between ion-free forms, O(0) and F(0) and the other between ion-bound forms, O(n) and F(n). With kf (0), ko (0), and kf(n), ko(n) denoting such transitions between ion-free forms and n ion-bound forms, the observed folding rate (kf,obs) and observed opening rate (ko,obs) are given as
 |
11 |
 |
12 |
We used the nonlinear least square fitting routine from origin (Microcal Software, Northampton, MA). To judge how well the model agrees with the data, we used the χ2 function weighted by the uncertainties in the data. For Mg2+, ko,obs is best fitted with n = 2, whereas kf,obs can be fitted with n ≥ 4. Fits at n = 1–4 are shown in Fig. 6A. For Na+, the best fit to ko,obs is obtained with n = 3, and similar to the Mg2+ case, the optimal n for kf,obs cannot be well determined.
It is also possible that different number of Mg2+ ions are bound to different conformations of the RNA junction. One such case is that more cations bind the folded form to stabilize the RNA structure with closer proximity of negative phosphates (22). Assuming that the folded junction can take additional n′ Mg2+ ions, the reaction scheme should allow a transition between F(n) and F(n+n′) and ko,obs becomes
 |
13 |
where K′F is the binding constant for binding additional n′ ions to F(n). For example, if n is fixed to 4 as determined from kf,obs, Eq. 13 fits the data at n′ = 1 (result not shown), suggesting that an additional Mg2+ further stabilizes the folded form of the junction. However, it should be mentioned that because of the poor precision of the data, it is very difficult to determine the stoichiometry in these model schemes. Also, the cooperativity of binding represented by n might not be the same over the whole range of Mg2+.
It is likely that any reaction scheme based strictly on a stoichiometric binding mechanism cannot properly completely describe ion–nucleic acid interaction. Besides unique sites that take up integral number of Mg2+ ions, an RNA structure has diffusing ions accumulated around its negatively charged backbone and is stabilized through delocalized electrostatic screening. Quantitative models for ion screening and the electrostatic potential of RNA molecules have been suggested based on nonlinear Poisson–Boltzmann theory (23, 24), but these models have yet to be used to calculate the energy landscape of the RNA junction affected by electrostatic screening.
A simple, qualitative argument based on such a screening mechanism can also account for the data. The two-state model for the RNA conformational change tells us that the open and folded conformations of the RNA junction are thermodynamically stable. In the absence of screening ions, because of the high-repulsive interaction between the two negatively charged arms of the junction, the open conformation is much more stable than the folded conformation. In the presence of screening ions, the open state, the transition state, and the folded state of the RNA junction are all energetically lowered. However, the folded state with the highest density of negatively charged phosphates is preferentially lowered compared with the more extended open state. Therefore, with increasing cation concentration, the folded conformation becomes more favored. Change of rate constants with increasing ion concentration can be understood in association with the transition state as well.
In reality, however, it is most likely that the observed RNA conformational change is a result of both specific binding and diffuse binding/screening. The x-ray crystallography studies have found 3 Mg2+ ions localized near the junction region (10), and these ions are good candidates for specifically bound ions. The question of whether the multiple Mg2+ ions determined by our phenomenological model correspond to the ones found in the crystal structure requires further investigation.
In conclusion, we applied FCS at the single-molecule level to determine rate constants for conformational changes of an RNA molecule over a range of concentrations of Mg2+ and Na+. The RNA conformational change was approximately a two-state fluctuation, but the ion dependence of rates could not be explained by simple ion binding models because the opening rate was greatly dependent on ion concentration. The results presented in this paper suggest that an RNA molecule in the folded conformation is greatly stabilized by interacting with Mg2+. Na+ is shown to be capable of replacing the role of Mg2+ at 2,500-fold higher concentration. With this 16S ribosomal RNA junction as a model system, we demonstrated that FRET technique combined with FCS can find its application in probing millisecond or faster conformational dynamics of biomolecules at the single-molecule level.
Acknowledgments
This work was supported by the National Science Foundation, Air Force Office of Scientific Research (S.C.) and National Institutes of Health Grant GM53757 (to J.R.W.). H.D.K. received support from a Stanford Graduate Fellowship, and J.W.O. received support from the Cancer Research Fund of the Damon Runyon–Walter Winchell Foundation. G.U.N. acknowledges generous financial support from the Volkswagen Foundation.
Abbreviations
- FRET
fluorescence resonance energy transfer
- FCS
fluorescence correlation spectroscopy
References
- 1.Ferré-D'Amaré A R, Doudna J A. Annu Rev Biophys Biomol Struct. 1999;28:57–73. doi: 10.1146/annurev.biophys.28.1.57. [DOI] [PubMed] [Google Scholar]
- 2.Holbrook S R, Sussman J L, Warrant R W, Kim S H. Nucleic Acids Res. 1977;4:2811–2820. doi: 10.1093/nar/4.8.2811. [DOI] [PMC free article] [PubMed] [Google Scholar]
- 3.Pley H W, Flaherty K M, McKay D B. Nature (London) 1994;372:68–74. doi: 10.1038/372068a0. [DOI] [PubMed] [Google Scholar]
- 4.Cate J H, Gooding A R, Podell E, Zhou K H, Golden B L, Kundrot C E, Cech T R, Doudna J A. Science. 1996;273:1678–1685. doi: 10.1126/science.273.5282.1678. [DOI] [PubMed] [Google Scholar]
- 5.Correll C C, Freeborn B, Moore P B, Steitz T A. Cell. 1997;91:705–712. doi: 10.1016/s0092-8674(00)80457-2. [DOI] [PubMed] [Google Scholar]
- 6.Anderson C F, Record M T. Annu Rev Phys Chem. 1995;46:657–700. doi: 10.1146/annurev.pc.46.100195.003301. [DOI] [PubMed] [Google Scholar]
- 7.Lohman T M, Dehaseth P L, Record M T. Biochemistry. 1980;19:3522–3530. doi: 10.1021/bi00556a017. [DOI] [PubMed] [Google Scholar]
- 8.Orr J W, Hagerman P J, Williamson J R. J Mol Biol. 1998;275:453–464. doi: 10.1006/jmbi.1997.1489. [DOI] [PubMed] [Google Scholar]
- 9.Batey R T, Williamson J R. RNA. 1998;4:984–997. doi: 10.1017/s1355838298980426. [DOI] [PMC free article] [PubMed] [Google Scholar]
- 10.Nikulin A, Serganov A, Ennifar E, Tishchenko S, Nevskaya N, Shepard W, Portier C, Garber M, Ehresmann B, Ehresmann C. Nat Struct Biol. 2000;7:273–277. doi: 10.1038/74028. [DOI] [PubMed] [Google Scholar]
- 11.Agalarov S C, Prasad G S, Funke P M, Stout C D, Williamson J R. Science. 2000;288:107–112. doi: 10.1126/science.288.5463.107. [DOI] [PubMed] [Google Scholar]
- 12.Wimberly B T, Brodersen D E, Clemons W M, Morgan-Warren R J, Carter A P, Vonrhein C, Hartsch T, Ramakrishnan V. Nature (London) 2000;407:327–399. doi: 10.1038/35030006. [DOI] [PubMed] [Google Scholar]
- 13.Schluenzen F, Tocilj A, Zanvach R, Harms J, Gluehmann M, Janell D, Bashan A, Bartels H, Agmon I, Franceschi F, Yonath A. Cell. 2000;102:615–623. doi: 10.1016/s0092-8674(00)00084-2. [DOI] [PubMed] [Google Scholar]
- 14.Stryer L, Haugland R P. Proc Natl Acad Sci USA. 1967;58:719–730. doi: 10.1073/pnas.58.2.719. [DOI] [PMC free article] [PubMed] [Google Scholar]
- 15.Selvin P R. Methods Enzymol. 1995;246:300–334. doi: 10.1016/0076-6879(95)46015-2. [DOI] [PubMed] [Google Scholar]
- 16.Weiss S. Science. 1999;283:1676–1683. doi: 10.1126/science.283.5408.1676. [DOI] [PubMed] [Google Scholar]
- 17.Ha T J, Zhuang X W, Kim H D, Orr J W, Williamson J R, Chu S. Proc Natl Acad Sci USA. 1999;96:9077–9082. doi: 10.1073/pnas.96.16.9077. [DOI] [PMC free article] [PubMed] [Google Scholar]
- 18.Rigler R, Mets U, Widengren J, Kask P. Eur Biophys J. 1993;22:169–175. [Google Scholar]
- 19.Maiti S, Haupts U, Webb W W. Proc Natl Acad Sci USA. 1997;94:11753–11757. doi: 10.1073/pnas.94.22.11753. [DOI] [PMC free article] [PubMed] [Google Scholar]
- 20.Widengren J, Schwille P. J Phys Chem A. 2000;104:6416–6428. [Google Scholar]
- 21.Widengren J, Mets U, Rigler R. J Phys Chem. 1995;99:13368–13379. [Google Scholar]
- 22.Gluick T C, Gerstner R B, Draper D E. J Mol Biol. 1997;270:451–463. doi: 10.1006/jmbi.1997.1119. [DOI] [PubMed] [Google Scholar]
- 23.Misra V K, Draper D E. J Mol Biol. 1999;294:1135–1147. doi: 10.1006/jmbi.1999.3334. [DOI] [PubMed] [Google Scholar]
- 24.Chin K, Sharp K A, Honig B, Pyle A M. Nat Struct Biol. 1999;6:1055–1061. doi: 10.1038/14940. [DOI] [PubMed] [Google Scholar]


